

ABSTRACT
Macroautophagy/autophagy is a central mechanism by which cells maintain integrity and homeostasis, and endotoxin-induced autophagy plays important roles in innate immunity. Although TLR4 stimulation mediated by lipopolysaccharide (LPS) also upregulates autophagy in hepatocytes and liver, its physiological role remains elusive. The objective of this study was to determine the role of LPS-induced autophagy in the regulation of liver lipid metabolism. LPS treatment (5 mg/kg) increased autophagy, as detected by LC3 conversion and transmission electron microscopy (TEM) analysis in C57BL6 mouse livers. AC2F hepatocytes also showed increased autophagic flux after LPS treatment (1 μg/ml). To investigate the role of LPS-induced autophagy further, liver lipid metabolism changes in LPS-treated mice and fasted controls were compared. Interestingly, LPS-treated mice showed less lipid accumulation in liver than fasted mice despite increased fatty acid uptake and lipid synthesis-associated genes. In vitro analysis using AC2F hepatocytes demonstrated LPS-induced autophagy influenced the degradation of lipid droplets. Inhibition of LPS-induced autophagy using bafilomycin A1 or Atg7 knockdown significantly increased lipid accumulation in AC2F hepatocytes. In addition, pretreatment with chloroquine aggravated LPS-induced lipid accumulation and inflammation in C57BL6 mouse livers. The physiological importance of autophagy was verified in LPS-treated young and aged rats. Autophagic response was diminished in LPS-treated aged rats and lipid metabolism was impaired during sepsis, indicating autophagy response is important for regulating lipid metabolism after endotoxin challenge. Our findings demonstrate endotoxin-induced autophagy is important for the regulation of lipid metabolism, and suggest that autophagy helps maintain lipid metabolism homeostasis during sepsis.
KEYWORDS: aging, autophagy, endotoxin, lipid metabolism, lipophagy, liver, sepsis
Introduction
Autophagy is a well-conserved catabolic process and is responsible for the disposal of damaged organelles and metabolic macromolecules to maintain cellular homeostasis, and to supply a variety of substrates for cellular energy generation during harsh conditions, such as starvation.1 At least 3 forms of autophagy have been identified: macroautophagy, microautophagy, and chaperone-mediated autophagy (CMA). Macroautophagy (hereafter referred to as autophagy) involves the sequestering of cytoplasmic components by phagophores that mature into autophagosomes, which subsequently fuse with lysosomes, where their cargoes are delivered for degradation and recycling.2 The diverse substrates and cellular functions of autophagy suggest that organisms are highly dependent on this process for maintaining a normal physiology, and disruption of this process is probably involved in the pathogenesis and development of disease states.3 The importance of autophagy has been implicated in the contexts of metabolic organs, such as liver, muscle, and adipose tissue, due to their unique metabolic macromolecule degrading activities.4 In addition to the canonical pathway for lipid degradation (cytoplasmic lipases), liver lipids are also degraded by autophagy in the normal and fasting states.5,6 Furthermore, recent studies have demonstrated that alterations in autophagy underlie various hepatic diseases, including fatty liver, steatosis, viral hepatitis, drug or ischemia/reperfusion-induced liver injury, and hepatocellular carcinoma.7,8
The liver provides a central store for lipids. In the normal state, the organ actively oxidizes triglycerides (TGs) to produce energy or synthesize lipoproteins. However, the liver is also susceptible to steatosis in individuals that consume high-fat diets or excessive alcohol, or in the presence of infection or inflammation. Researchers are now showing considerable interest in the basic mechanisms and the roles played by lipid droplet formation in the pathogeneses and progression of liver diseases. Of the many hepatic physiological challenges, fasting and sepsis (normally accompanied by anorexia) induce acute lipid accumulation,9,10 which is a recognized normal physiological process that regulates excessive lipid metabolite release from adipose tissue.11-13 In the fasting state, the mechanisms that regulate hepatic lipid accumulation are fairly well demonstrated. The uptake of free fatty acids (FFAs) from adipose tissue is essential for hepatic lipid accumulation,9 and insufficient autophagy during fasting exacerbates lipid accumulation.6 Because liver autophagy directly regulates lipid degradation, it becomes clear that basal and stimuli-induced autophagy are important for maintaining hepatic lipid homeostasis.5,14
Toll-like receptors (TLRs) are pattern recognition receptors (PRRs) that play critical roles in the early innate immune response to invading pathogens by recognizing structurally conserved molecules derived from microbes. TLR4 primarily recognizes lipopolysaccharide (LPS), a component of the outer membranes of Gram-negative bacteria, and then stimulates the pro-inflammatory cytokines required to activate the immune response. Interestingly, LPS can directly induce autophagy in immune cells by activating TLR4 signaling, and thus, participates in the removal of pathogens.15,16 Furthermore, several authors have also suggested LPS-induced autophagy has protective roles in various tissues.17,18 Hepatocytes also express TLR4 receptor, which activates downstream signaling upon LPS stimulation.19 In addition, it has been well established that LPS-induced autophagy also plays important protective roles in liver and in hepatocytes.20,21
Although LPS induces an autophagic response in liver and hepatocytes, exact physiological roles are not fully discovered. Based on the role of autophagy in the metabolically active tissues, we speculated hepatic autophagy pathways have roles that differ from those of immune cells after LPS challenge. In the present study, we investigated the role of LPS-induced autophagy in the maintenance of lipid metabolism homeostasis during sepsis. As previously reported, LPS induced a robust autophagic action in mouse liver and hepatocytes. Because endotoxins induce severe anorexia and liver lipid accumulation (as occurs under fasting conditions) during sepsis, we sought to determine the role played by LPS-induced autophagy in the regulation of liver lipid metabolism by comparing LPS-treated mice and fasting mice. Interestingly, LPS-treated mice showed lower lipid accumulation in liver with higher induction of autophagy compared with their fasting controls. Further in vitro and in vivo experiments under autophagy inhibition conditions demonstrated the role of LPS-induced autophagy in the regulation of lipid degradation. These findings establish a new function for hepatocyte autophagy induced by LPS in the maintenance of lipid metabolism homeostasis during sepsis.
Results
Endotoxin-induced autophagic response in mouse livers and hepatocytes
To confirm the previously reported effects of endotoxin on autophagy induction, C57BL/6 mice were intraperitoneally injected with LPS (5 mg/kg, n = 5∼6 per each group) and livers were dissected at 1 h to 48 h post-injection. LC3 conversion robustly increased after LPS injection and this increase was maintained throughout the experimental periods (Fig. 1A∼C). Protein levels of BECN1/Beclin1 and SQSTM1/p62 in liver also increased after LPS injection (Fig. 1A). However, conjugated ATG12 levels showed no changes post-injection (Fig. 1A). To check autophagy flux in vivo, chloroquine (50 mg/kg) was pre-administered to mice intraperitoneally before LPS. Chloroquine pretreatment increased levels of LC3-I and LC3-II in livers, and caused a further SQSTM1 accumulation indicating that LPS increased autophagy flux in the liver (Fig. 1D). Transmission electron microscopy (TEM) confirmed increased autophagosome formation after LPS treatment in the liver (Fig. 1E).
Figure 1.
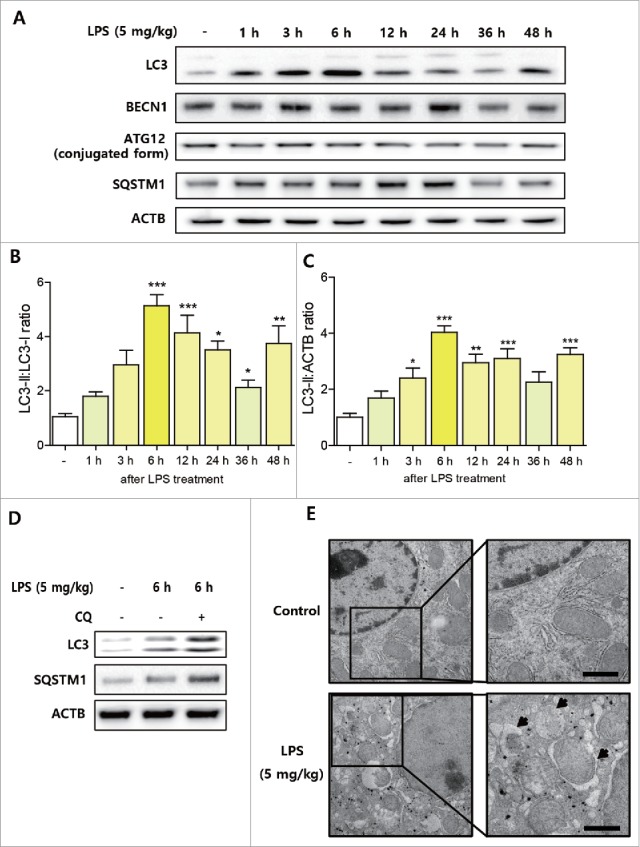
LPS-induced autophagic response in mouse liver. C57BL/6 mice were intraperitoneally injected with LPS (5 mg/kg, n = 5∼6 per each group) and livers were dissected at prescribed times. (A) Autophagy-related protein level changes during endotoxemia were detected in treated livers. Western blotting was used to estimate the protein levels of LC3, BECN1, ATG12, and SQSTM1 in liver tissues. ACTB was used as the loading control. (B) LC3 conversion (LC3-II:LC3-I ratio) in 4 independent western blots were quantified by densitometry. *P < 0.05, **P < 0.01, and ***P < 0.001 vs. nontreated controls. (C) LC3-II:ACTB ratio in 4 independent western blots were quantified by densitometry. *P < 0.05, **P < 0.01, and ***P < 0.001 vs. nontreated controls. (D) Chloroquine (50 mg/kg) was used as a pretreatment before LPS to inhibit autophagosome-lysosome fusion (n = 3). LC3 conversion and SQSTM1 accumulation in livers were detected by western blotting. Chloroquine pretreatment significantly increased LPS-induced LC3 conversion and SQSTM1 accumulation. (E) Nontreated control and LPS-treated (6 h) mouse livers were examined by transmission electron microscopy (TEM). LPS treatment increased autophagosome formation detected by TEM. The arrow indicates autophagosomes. Scale bar: 1 μm.
Next, we investigated whether LPS also induces autophagic responses in hepatocytes. Initially, we used 2 liver-derived hepatocytes. AC2F rat liver hepatocytes showed increased autophagic response after LPS treatment (1 μg/ml) as determined by LC3 conversion (Fig. 2A∼C). However, LPS induced no such change in HepG2 hepatocytes (Fig. S1). HepG2 hepatocytes were unresponsive to 1 μg/ml of LPS as determined by the nuclear expression of RELA/p65, whereas AC2F cells showed increased RELA expression (Fig. S2). In addition, LPS also increased BECN1 and SQSTM1 in AC2F hepatocytes, but not in HepG2 hepatocytes (Fig. 2A, Fig. S1). GFP-tagged LC3 plasmid transfection showed increased LC3 puncta formation after LPS treatment in AC2F hepatocytes (Fig. 2D, E). To investigate autophagic flux, AC2F hepatocytes were transfected with an mCherry-GFP-tagged LC3 plasmid as described previously.22 LPS treatment and starvation (induced by incubation in Hank's buffered salt solution for 2 h) increased mCherry-positive regions compared with control cells (Fig. 2F, G). Autophagy flux was further analyzed by pretreating AC2F hepatocytes with bafilomycin A1. Bafilomycin A1 (50 nM) pretreatment also caused LC3-I and LC3-II accumulation and SQSTM1 increase, indicating that LPS upregulated autophagic flux in AC2F hepatocytes (Fig. 2H). These observations suggest endotoxins induce an autophagic response in mouse liver and hepatocytes.
Figure 2.
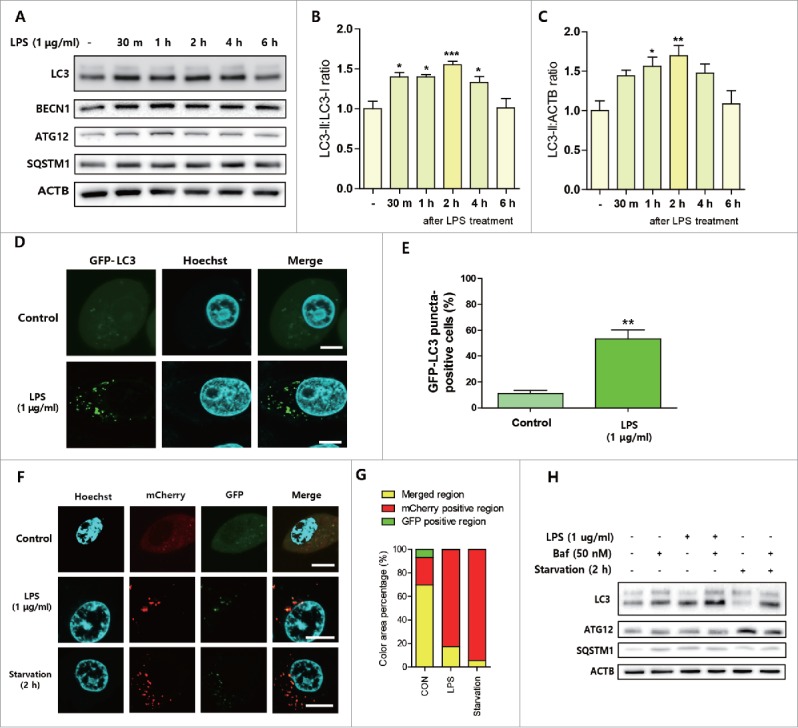
LPS-induced autophagic response in hepatocytes. AC2F rat hepatocytes were treated with LPS (1 μg/ml) and cells were then analyzed at different times. (A) Autophagy-related protein level changes were detected in LPS-treated AC2F hepatocytes. Western blots were performed to estimate the protein expression levels of LC3, BECN1, ATG12, and SQSTM1 in hepatocytes. ACTB was used as the loading control. n = 4 for each treatment conditions. (B) LC3 conversion (LC3-II:LC3-I ratio) in 4 independent western blots were quantified by densitometry. *P < 0.05 and ***P < 0.001 vs. nontreated controls. (C) LC3-II:ACTB ratio in 4 independent western blots were quantified by densitometry. *P < 0.05 and **P < 0.01 vs. nontreated controls. (D) LC3 puncta formation was detected by transfecting cells with a GFP-LC3 plasmid, and LPS treatment significantly increased LC3 puncta formation. Scale bar: 10 μm. (E) GFP-LC3 puncta-containing cells were quantified by counting GFP-positive cells (counting number ≥ 100 for each condition). **P < 0.01 vs. nontreated controls. (F) An mCherry-GFP-LC3 plasmid was transfected to measure autophagic flux in cells. LPS treatment of 2 h or Hank's buffered salt solution treatment (starved cells) significantly increased both mCherry and GFP fluorescence versus treatment naive controls. Scale bar: 10 μm. (G) mCherry- and GFP-positive areas and overlapping areas were quantified by analyzing different cells detected by confocal microscopy. Both starved cells and LPS-treated cells showed more mCherry- and GFP-positive regions than treatment naive controls. (H) Autophagy flux increases were analyzed by pretreating cells with bafilomycin A1 (50 nM). LC3, SQSTM1, and ATG12 protein levels in cells were detected by western blotting. ACTB was used as the loading control. Bafilomycin A1 pretreatment upregulated LPS-induced LC3 conversion in cells. n = 4 for each treatment condition.
MAPK/p38 and class III phosphatidylinositol 3-kinase (PtdIns3K) activity were required for LPS-induced autophagy
To verify the involvement of signaling pathways associated with LPS-induced autophagy, we first checked classical pathways that activate autophagy. However, AKT-MTOR signaling pathways that inhibit autophagy initiation by directly phosphorylating ULK1 were all upregulated by LPS in AC2F hepatocytes (Fig. 3A). Consequently, the phosphorylation (site inactivated by MTOR) of ULK1 was increased by LPS treatment (Fig. 3A). Because previous studies have demonstrated the role of MAPK signaling in LPS-induced autophagy, we checked the involvement of MAPK signaling pathways, and subsequently, found all 3 MAPKs (p38, JNK, ERK) were activated by LPS (Fig. 3B). Furthermore, pretreatment with a MAPK/p38 inhibitor partially inhibited LPS-induced autophagy as indicated by LC3 puncta formation and LC3 conversion (Fig. 3C∼E). However, MAPK/JNK and MAPK/ERK inhibitors did not inhibit LPS-induced autophagy (data not shown). In our previous experiments, BECN1 upregulation was consistently observed, and because BECN1 interacts with PtdIns3K and increases vesicle nucleation during autophagy, we examined whether PtdIns3K inhibition affected LPS-induced autophagy. We found that pretreatment with 3-methyladenine (3MA) totally blocked LPS-induced LC3 conversion and autophagosome formation (Fig. 3F-H). These observations indicate MAPK/p38 and PtdIns3K activity are required for LPS-induced autophagy in hepatocytes.
Figure 3.
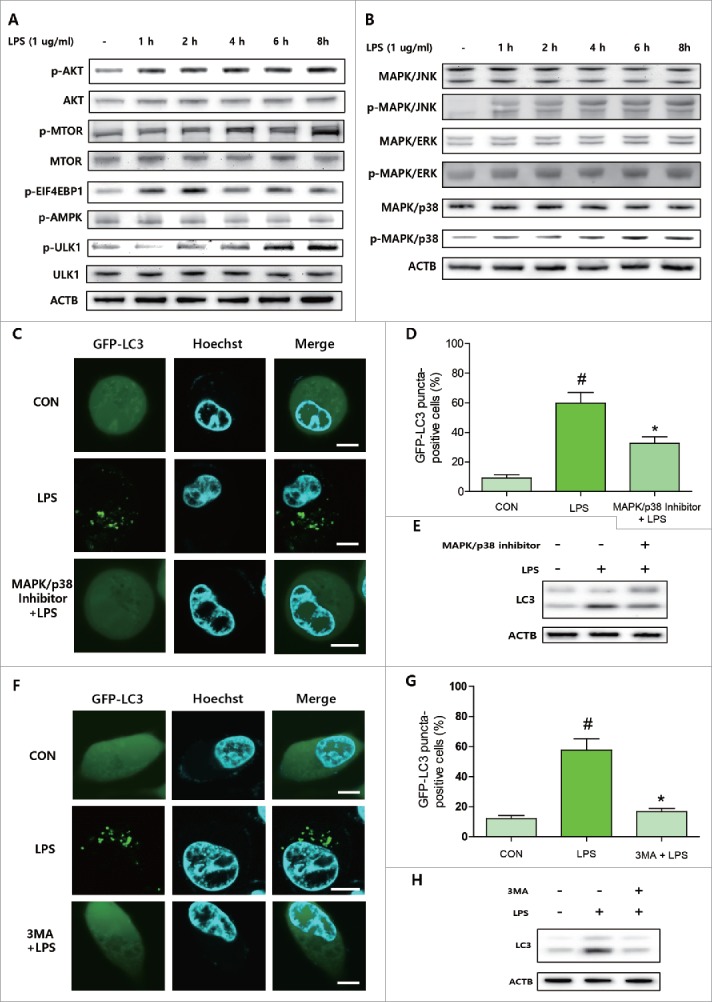
MAPK/p38 and PtdIns3K activities were required for LPS-induced autophagy. To observe time-dependent changes in autophagy-related signaling, AC2F cells were pretreated with inhibitors and then treated with LPS to check the involvement of specific proteins in LPS-induced autophagy. (A) AKT-MTOR signaling pathway and downstream proteins were detected by western blotting. Protein levels of AKT, MTOR, and ULK1 and phosphorylated protein levels of AKT, MTOR, EIF4EBP1, AMPK, and ULK1 were measured after LPS treatment. n = 4 for each treatment condition. (B) MAPK signaling pathways were detected by western blotting. Protein levels of MAPK/p38, MAPK/JNK, and MAPK/ERK and the corresponding phosphorylated protein levels were measured after LPS treatment. n = 4 for each treatment conditions. (C) MAPK/p38 inhibitor was used for pretreatment before LPS to investigate the effects of MAPK/p38 on LPS-induced autophagy. LC3 puncta formation was detected by GFP-LC3 plasmid transfection. Scale bar: 10 μm. (D) GFP-LC3 puncta-containing cells were quantified by counting GFP-positive cells (counting number ≥ 100 for each condition). #P<0.05 vs. controls. *P < 0.01 vs. LPS-treated controls. (E) LC3 conversion was detected by western blotting after treatment with LPS in cells pretreated or not with MAPK/p38 inhibitor. (F) PtdIns3K inhibitor was used for pretreatment to investigate the effects of PtdIns3K on LPS-induced autophagy. LC3 puncta formation was detected by GFP-LC3 plasmid transfection. Scale bar: 10 μm. (G) GFP-LC3 puncta-containing cells were quantified by counting GFP-positive cells (counting number ≥ 100 for each condition). #P<0.05 vs. treatment naïve controls. *P < 0.01 vs. LPS-controls. (H) LC3 conversion was detected by western blotting with or without PtdIns3K inhibitor pretreatment before LPS administration.
Dynamics of lipid metabolism changes during endotoxemia and fasting
Endotoxemia and accompanying anorexia induce massive changes in metabolism. Under both conditions, liver lipid accumulation is increased due to increased fatty acid uptake as a result of adipose tissue lipolysis and upregulated lipid synthesis-associated gene expression.13 Although liver lipid metabolism is important in both conditions, exact changes are not directly comparable. To understand the dynamic changes in lipid metabolism under both conditions, we first examined the dose-dependent effects of LPS. Administration of 20 mg/kg of LPS significantly increased liver lipid accumulation versus fasted controls over 24 h (Fig. S3A). Interestingly, the administration of lower than 5 mg/kg of LPS caused changes that differed from those induced by higher doses. LPS treatment at 5 mg/kg or 0.5 mg/kg showed less lipid accumulation in liver as compared with nontreated fasted controls (Fig. S3A). Conversely, fasted mice showed a constant increase in lipid accumulation and LPS-treated mice showed reduced lipid accumulation at 48 h post-LPS treatment regardless of dose (Fig. S3A). Furthermore, LPS-treated mice had higher serum free fatty acid (FFA) levels than fasted controls (Fig. S3B). These findings indicate lipid metabolism is differentially regulated by LPS, and indicate LPS play an important role in lipid metabolism regulation during endotoxemia.
We further focused on the effects of 5 mg/kg LPS because this was associated with less lipid accumulation in liver than was observed in fasted mice. Treatment with 5 mg/kg LPS showed less lipid accumulation from 12 h after treatment as compared with fasting controls (Fig. 4A), and this was confirmed by oil red O staining (Fig. 4B). Furthermore, serum TG levels were greater in LPS-treated mice than in fasted mice (Fig. S4A), and serum glucose levels depleted more rapidly in LPS-treated mice than in fasted mice (Fig. S4B). LPS treatment made no difference to weight loss when compared with fasted controls (Fig. S4C). Next, we compared the serum FFAs and liver fatty acid uptake-associated genes. Serum FFA levels increased more rapidly in LPS-treated mice than in fasted controls (Fig. 4C). FFA uptake-associated genes (Cd36 and Slc27a1/Fatp) also showed greater expression increases in LPS-treated mouse livers than in fasted controls (Fig. 4D). In addition, the expression of most TG synthesis-associated genes (Gpat, Agpat, Lpn, and Dgat families) were similar or higher in LPS-treated mouse livers than fasted control livers (Fig. 4E). In contrast to TG synthesis-associated genes, de novo FFA synthesis-associated genes were all downregulated during endotoxemia and after fasting (Fig. S5). We also examined the fatty acid oxidation-associated transcriptional factor PPARA/PPARα and its target gene changes. LPS transiently increased nuclear PPARA expression and the expressions of its target genes (Acox1, Cpt1) and showed a time-dependent decrease through 24 h after treatment (Fig. S6). In contrast, fasting gradually increased the expression of PPARA and its target genes (Fig. S6). Liver autophagic responses were compared by investigating LC3 conversion in LPS-treated and fasted mouse liver. Although fasting for 12 h induced LC3 conversion in the liver, the amount of conversion was higher in the livers of LPS-treated mice (Fig. 4F∼H). In summary, although LPS increased the levels of serum FFAs and increased the expression of genes associated with fatty acid uptake and TG synthesis as compared with fasting controls, the extent of LPS-induced liver lipid accumulation was less than in fasting controls. There results led us to investigate the role of autophagy in the regulation of lipid metabolism during sepsis.
Figure 4.
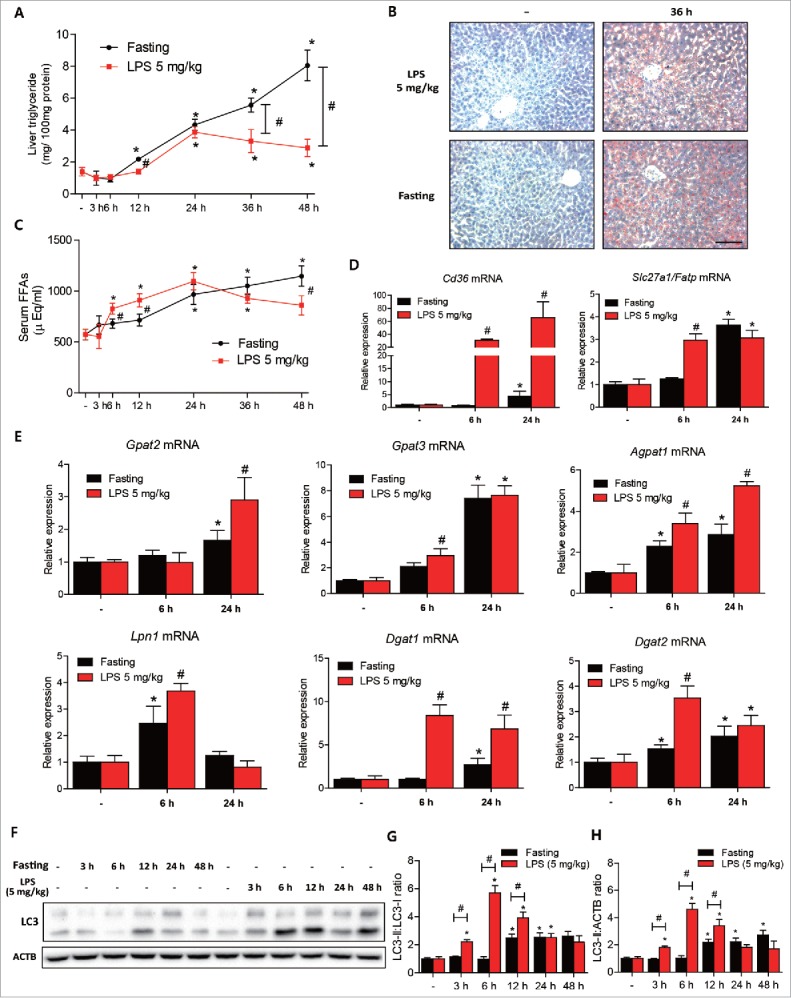
LPS induced less lipid accumulation than fasting in mouse livers. C57BL/6 mice were intraperitoneally injected with LPS (5 mg/kg, n = 5∼6 per each group) or fasted, and livers were dissected at prescribed times. (A) Liver triglyceride levels were quantified in LPS (5 mg/kg)-treated or fasted mouse livers. *P < 0.05 vs. nontreated controls. #P < 0.05 vs. LPS-treated mice. (B) LPS-treated (36 h) and fasted (36 h) livers were stained with Oil red O to visualize lipid accumulation. Fasted livers showed more lipid accumulation than LPS-treated livers. Scale bar: 50 μm. (C) Free fatty acids levels were quantified in LPS (5 mg/kg)-treated and in fasted mouse serum to compare levels of lipolysis from adipose tissue. *P < 0.05 vs. nontreated controls. #P < 0.05 vs. LPS-treated mice. (D) Cd36 and Slc27a1/Fatp levels were measured in LPS (5 mg/kg)-treated and in fasted mouse livers by qPCR. *P < 0.05 vs. nontreated controls. #P < 0.05 vs. fasted mice. (E) Liver triglyceride synthesis-associated gene (Gpat2, Gpat3, Agpat1, Lpn1, Dgat1, and Dgat2) levels were measured in LPS (5 mg/kg)-treated and fasted mouse livers by qPCR. *P < 0.05 vs. nontreated controls. #P < 0.05 vs. fasted mice. (F) Liver autophagy levels were compared in LPS (5 mg/kg)-treated and fasted mouse livers at different times. LC3 conversion was detected in both liver types by western blotting. (G) LC3 conversion (LC3-II:LC3-I ratio) in 4 independent western blots were quantified by densitometry. *P < 0.05 vs. nontreated controls. #P < 0.05 vs. fasted controls. (H) LC3-II:ACTB ratio in 4 independent western blots were quantified by densitometry. *P < 0.05 vs. nontreated controls. #P < 0.05 vs. fasted controls.
LPS-induced autophagy reduced lipid accumulation in hepatocytes
To explore the effect of LPS-induced autophagy on lipid metabolism, we used oleic acid (200 μM)-pretreated AC2F hepatocytes 18 h before LPS treatment. Oleic acid treatment did not affect the LPS-induced LC3 conversion increase or the nuclear expression of RELA (Fig. 5A). The expression of lipid metabolism-associated genes was measured by qPCR after treatment with LPS with or without oleic acid. Pretreatment with oleic acid significantly decreased the expression of fatty acid uptake- and TG synthesis-associated genes (Fig. 5B, Fig. S7A), and treatment with LPS significantly increased some of the fatty acid uptake- and TG synthesis-associated genes with or without oleic acid pretreatment (Fig. 5B, Fig. S7A). Interestingly, LPS also induced the expression of fatty acid de novo synthesis-associated genes (Fig. S7B). To check whether LPS-induced autophagy was associated with lipid droplets in hepatocytes, lipids were stained with Nile red dye and observed under a confocal microscope. Oleic acid pretreatment significantly increased lipid droplet formation as determined by Nile red staining (Fig. 5C). Furthermore, LPS significantly increased the colocalization of lipid droplets with autophagosomes (Fig. 5C, D), and significantly reduced oleic acid-induced lipid accumulation in AC2F hepatocytes (Fig. 5E). These results indicate that although LPS treatment increases the expressions of genes associated with fatty acid uptake, TG and FFA synthesis, LPS also induces the colocalization of lipid droplets with autophagosomes, and probably subsequent lipid degradation by autophagy.
Figure 5.
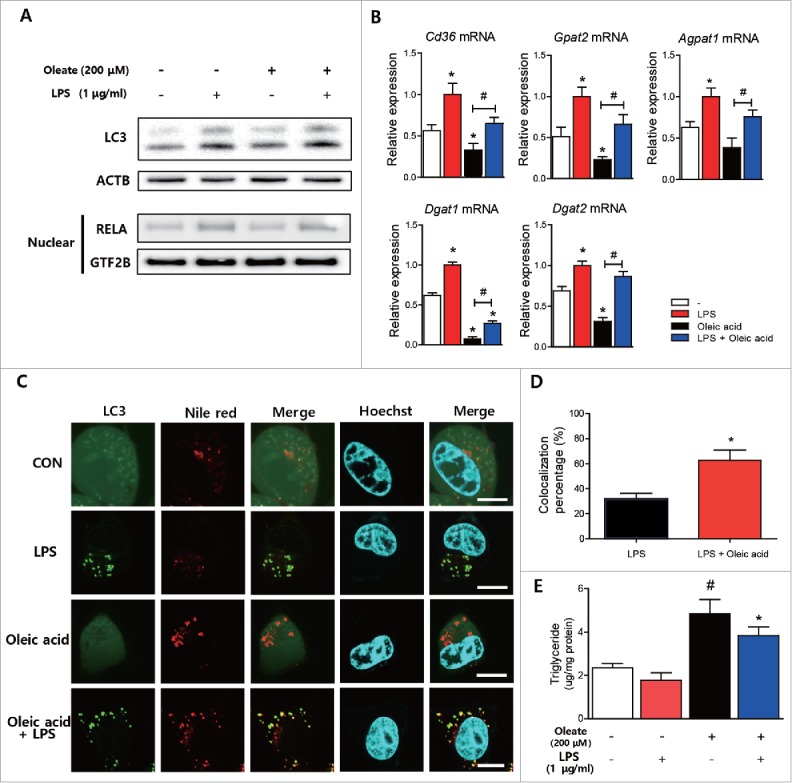
LPS-induced autophagy reduced oleic acid-induced lipid accumulation in hepatocytes. (A) Effects of oleic acid (200 μM) treatment on LPS-induced autophagy were examined by measuring LC3 conversion. Western blotting was performed to detect LC3 conversion. ACTB was used as the loading control. Nuclear RELA expression was detected by western blotting nuclear fractions to confirm effects of LPS on AC2F cells. GTF2B was used as the loading control. n = 4 for each treatment conditions. (B) Cd36 levels and triglyceride synthesis-associated genes (Gpat2, Agpat1, Dgat1, and Dgat2) levels were measured in LPS-(1 μg/ml) and/or oleic acid (200 μM)-treated cells by qPCR. n = 4 for each treatment condition. *P < 0.05 vs. treatment naïve cells. #P < 0.05 vs. oleic acid-treated cells. (C) Cells were transfected with a plasmid encoding GFP-LC3 and treated with LPS (1 μg/ml) and/or oleic acid (200 μM), and then stained with Nile red dye to detect neutral lipids. Confocal microscopy shows that colocalization between lipid droplets and LC3 puncta increased after LPS (1 μg/ml) and oleic acid (200 μM) cotreatment. Scale bar: 10 μm. (D) Colocalization of lipid droplets and LC3 puncta was quantified by analysis of results of (C). n = 4 for each treatment condition. *P < 0.05 vs. LPS-treated cells. (E) Lipid levels were quantified in cells treated with LPS (1 μg/ml) and/or oleic acid (200 μM). n = 5 for each treatment condition. #P < 0.05 vs. nontreated controls. *P < 0.05 vs. oleic acid-treated cells.
To determine whether LPS-induced autophagy regulates lipid degradation in hepatocytes, we inhibited autophagosome-lysosome fusion by pretreating AC2F cells with bafilomycin A1. Treatment with bafilomycin A1 significantly increased lipid accumulation in AC2F cells treated with LPS (Fig. 6A). When oleic acid pretreatment was performed to induce more lipid accumulation in cells, the effects of bafilomycin A1 on lipid accumulation were more pronounced (Fig. 6A). Similar results were obtained when cells were stained with Nile red and LysoTracker dye. Bafilomycin A1 treatment significantly increased LC3-positive puncta formation and lipid droplet formation, and, as was expected, bafilomycin A1 decreased the colocalization of lipid droplet-autophagosomes and lysosomes (Fig. 6B, C). We confirmed these results by Atg7 knockdown to inhibit autophagosome formation. Atg7 knockdown significantly reduced ATG12–ATG5 conjugation and increased SQSTM1 and LC3-I accumulation (Fig. 6D). Atg7 knockdown also increased lipid accumulation induced by oleic acid (Fig. 6E). These observations collectively indicate endotoxin-induced autophagy plays a role in the regulation of lipid metabolism and that the inhibition of autophagy significantly increases lipid accumulation in hepatocytes.
Figure 6.
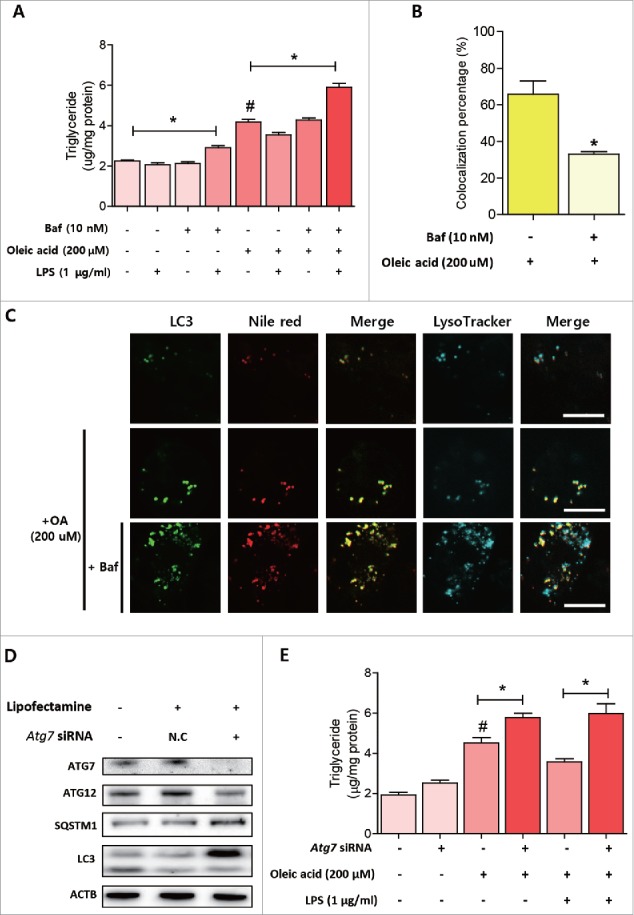
Inhibition of LPS-induced autophagy aggravated lipid accumulation in hepatocytes. (A) Lipid levels were quantified in cells with various treatment conditions. n = 4 for each treatment conditions. *P < 0.05, #P < 0.05 vs. nontreated cells. (B) Colocalization of lipid droplets with autophagosomes and lysosomes was quantified by analyzing the results of (C). n = 4 for each treatment condition. *P < 0.05 vs. oleic acid-treated cells. (C) Cells were transfected with a plasmid encoding GFP-LC3 and then treated with various conditions according to the experimental design. Cells were then stained with Nile red and LysoTracker Blue to visualize lipid droplets and lysosomes. Confocal microscopy showed pretreatment with bafilomycin A1 reduced colocalizations of lipid droplets and lysosomes. Scale bar: 10 μm. (D) Autophagy-related protein level changes were detected after Atg7 knockdown. Western blotting was used to estimate the protein expression levels of ATG7, ATG12, LC3, and SQSTM1 in cells. (E) Cellular lipid levels were quantified under various conditions according to the experimental design. n = 5 for each treatment condition. *P < 0.05, #P < 0.05 vs. non-treated group.
Inhibition of LPS-induced autophagy by chloroquine increased lipid accumulation and inflammation in mouse livers
To determine whether LPS-induced autophagy regulates lipid metabolism in vivo, we pretreated mice with chloroquine (50 mg/kg) before injecting LPS. LPS-treated mouse livers showed significant increases in TG accumulation at 24 h after treatment and returned to almost the basal level at 48 h (Fig. 7A). Chloroquine pretreatment plus LPS treatment of mouse livers resulted in a higher accumulation of TG than seen in LPS-treated livers from 24 h after LPS treatment (Fig. 7A). These results were confirmed by liver Oil red O staining. Chloroquine pretreatment and LPS treatment significantly increased liver lipid accumulation as compared with the LPS treatment group (Fig. 7B). Although liver lipid accumulation was significantly greater in chloroquine plus LPS-treated animals, serum FFA levels were not different between the 2 groups (Fig. 7C). In addition, chloroquine plus LPS-treated mice showed lower glucose levels during endotoxemia. LPS-treated animals showed constant plasma glucose levels, whereas chloroquine plus LPS-treated animals showed gradual decreases in plasma glucose levels (Fig. 7D). Inhibition of autophagy further aggravated LPS-induced liver inflammation. Increased serum GPT/ALT levels in chloroquine plus LPS-treated animals were sustained at higher levels than in LPS-treated animals (Fig. 7E). Furthermore, the gene expression of pro-inflammatory cytokines (Il1b, Tnf/Tnfa, and Il6) in liver was higher in chloroquine plus LPS-treated animals (Fig. 7F). Interestingly, Il10 (an anti-inflammatory cytokine) levels were also higher in chloroquine plus LPS-treated animals (Fig. 7F). We also examined changes associated with apoptosis because autophagy inhibition is also related to the aberrant upregulation of apoptosis. LPS-treatment significantly upregulated pro-apoptotic (Apaf1, Bax) and anti-apoptotic genes (Bcl2, Bcl2l1), and chloroquine plus LPS further upregulated genes associated with pro-apoptosis and anti-apoptosis (Fig. 7G). Finally, the effects of autophagy inhibition on the survival of LPS-treated mice were examined. At 48 h after LPS treatment, the number of mice that survived after treatment with chloroquine plus LPS was significantly smaller than in the LPS-treated group (Fig. 7H). These results show the suppression of autophagy increases lipid accumulation in liver (decreases lipid utilization and lowers glucose level) and liver inflammation, and increases mortality, which suggests the induction of autophagy protects against sepsis.
Figure 7.

Inhibition of LPS-induced autophagy by chloroquine increased lipid accumulation and liver inflammation. C57BL/6 mice were intraperitoneally injected with LPS (5 mg/kg, n = 5∼6 per each group) with or without pretreatment with chloroquine (50 mg/kg) and livers were dissected at prescribed times. (A) Liver triglyceride levels were quantified. *P < 0.05 vs. nontreated controls. #P < 0.05 vs. LPS-treated mice. (B) LPS-treated (24 h or 48 h) livers that had been pretreated or not with chloroquine (50 mg/kg) were stained with Oil red O to visualize lipid accumulation. Chloroquine plus LPS-treated livers showed more lipid accumulation than LPS-treated livers. Scale bar: 50 μm. (C) To compare lipolysis levels in adipose tissues, free fatty acids levels were quantified in LPS (5 mg/kg)-treated mice that had been pretreated or not with chloroquine (50 mg/kg). *P < 0.05 vs. nontreated controls. (D) Glucose levels were quantified in LPS (5 mg/kg)-treated mice pretreated or not with chloroquine (50 mg/kg). *P < 0.05 vs. nontreated mice.#P < 0.05 vs. LPS-treated mice. (E) GPT/ALT levels were quantified in LPS (5 mg/kg)-treated mice pretreated or not with chloroquine (50 mg/kg). *P < 0.05 vs. nontreated mice.#P < 0.05 vs. LPS-treated mice. (F) Liver inflammation-associated genes (Il1b, Tnf, Il6, and Il10) levels were measured in LPS (5 mg/kg)-treated mice pretreated or not with chloroquine (50 mg/kg) by qPCR. *P < 0.05 vs. nontreated mice.#P < 0.05 vs. LPS-treated mice. (G) Liver apoptosis-associated genes (Apaf1, Bax, Bcl2, and Bcl2l1) levels were measured in LPS (5 mg/kg)-treated mice pretreated or not with chloroquine (50 mg/kg) by qPCR. *P < 0.05 vs. nontreated mice.#P < 0.05 vs. LPS-treated mice. (H) Survival rates after LPS treatment with or without chloroquine pretreatment.
Activation of autophagy by rapamycin decreased lipid accumulation in LPS-treated mouse liver
To determine whether autophagy activation also influences lipid accumulation during endotoxemia, we pretreated mice with rapamycin before injecting LPS. Rapamycin (6 mg/kg) was applied intraperitoneally once a day for 2 d before LPS injection. Rapamycin pretreated mouse livers showed lower TG accumulation when compared with LPS-treated livers at 24 h after LPS treatment (Fig. S8A, S8B). However, no changes were detected 48 h after LPS treatment. Serum FFA and TG levels were not different between the 2 groups (Fig. S8C, S8D). Furthermore, activation of autophagy reduced LPS-induced liver inflammation. Serum GPT/ALT levels were slightly reduced but the results were not significant (Fig. S8E). Gene expression of IL1b was lower in rapamycin pretreated animals whereas that of Tnf, Il6, and Il10 were not significantly changed (Fig. S8F). Rapamycin-pretreated animals showed a decreased Bax gene level but no changes of other apoptosis-related genes (Fig. S8G). These results show that the activation of autophagy significantly decreased lipid accumulation in liver but had only slight effects on inflammation and apoptosis.
Age-related decreased autophagic response to LPS aggravated lipid utilization
We previously reported that aged rats react more to an endotoxin challenge, especially in terms of lipid metabolism regulation in liver.23 To determine whether defective autophagy in aged rats aggravates the maintenance of lipid metabolism homeostasis and inflammation in liver, we used young (6 mo) and aged (24 mo) rats. LPS (2 mg/kg) was intraperitoneally injected into both young and aged rats, and metabolic changes were examined. In accordance with previously reported results, aged rats accumulated more lipid in the liver as determined by Oil red O staining and lipid quantification (Fig. 8A, B). Serum FFA levels were also higher in aged rats (Fig. 8C). Furthermore, LPS-treated aged rats showed the same tendencies toward blood glucose declines and liver inflammation as the chloroquine-treated mice. In addition, serum glucose levels in aged rats treated with LPS were significantly lower in young rats treated with LPS (Fig. 8D). Liver inflammation levels were checked by measuring serum GPT/ALT and liver cytokine expression levels. Serum GPT/ALT levels were found to be higher in aged rats (Fig. 8E), as was the gene expression of pro-inflammatory cytokines (Il1b, Tnf, and Il6) in liver (Fig. 8G). Pro- and anti-apoptotic gene expression was also higher in aged rats (Fig. 8H). Finally, we examined whether a deficient autophagic response against LPS caused these differential changes. Interestingly, LPS-induced LC3 conversion and BECN1 showed a lower increase in aged rat liver, whereas SQSTM1 accumulation was higher in aged rat livers (Fig. 8F). Taken together these results support the notion that efficient liver autophagy is needed to maintain metabolic and inflammatory homeostasis during sepsis, and that deficient autophagy in aged rats aggravates the normal defense against endotoxins.
Figure 8.
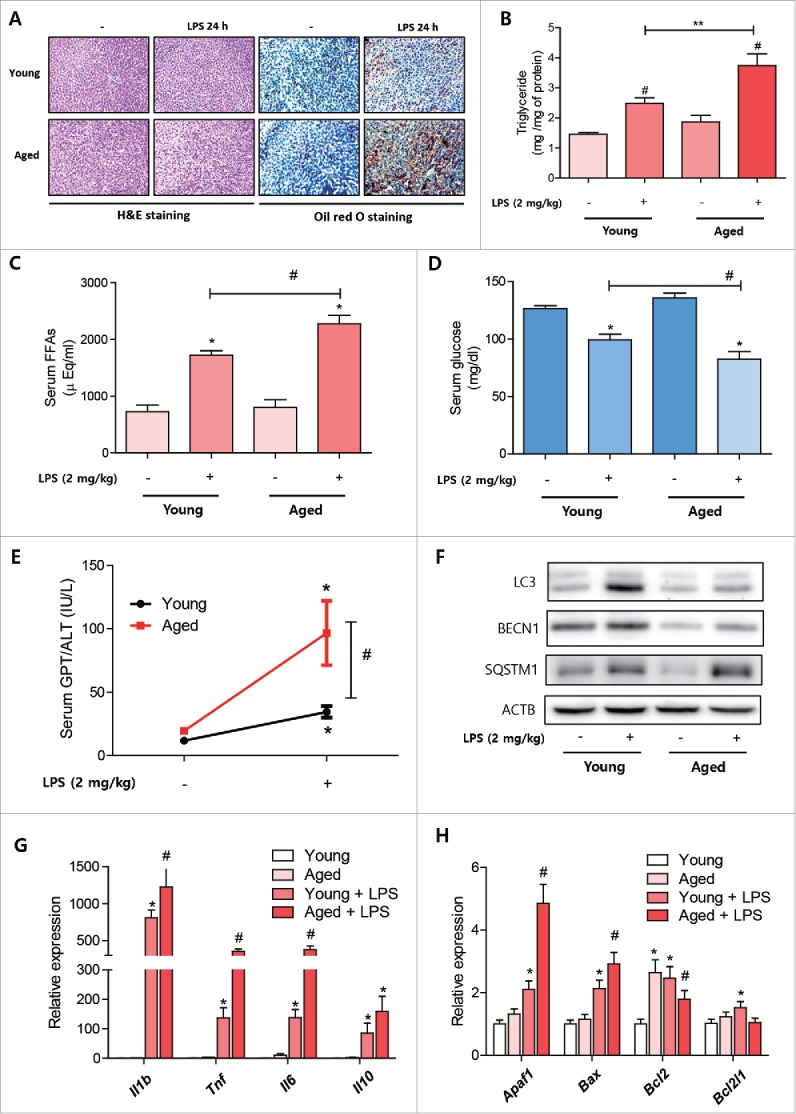
Age-related reductions in autophagic response to LPS aggravated lipid utilization. Young (6 mo) and aged (24 mo) rats (n = 5∼6) were treated with LPS (2 mg/kg) and livers were dissected at prescribed times. (A) Excised livers were stained with Oil red O to visualized lipid accumulation. Scale bar: 50 μm. (B) Liver triglyceride levels were quantified in young and aged rats treated with or without LPS. #P < 0.05 vs. nontreated controls. **P < 0.05. (C) Serum free fatty acids levels were quantified in young and aged rats treated with or without LPS. *P < 0.05 vs. nontreated controls. #P < 0.05. (D) Serum glucose levels were quantified in young and aged rat treated with or without LPS. *P < 0.05 vs. nontreated controls. #P < 0.05. (E) Serum GPT/ALT levels were quantified in young and aged rat treated with or without LPS. *P < 0.05 vs. nontreated controls. #P < 0.05. (F) Autophagy-related protein level changes during endotoxemia were detected in young and aged rat livers. Western blotting was performed to assess LC3, BECN1, and SQSTM1 protein levels in livers. ACTB was used as the loading control. (G) Liver inflammation-associated gene (Il1b, Tnf, Il6, and Il10) levels were measured in LPS-treated young and aged rats by qPCR. *P < 0.05 vs. nontreated controls.#P<0.05 vs. LPS-treated controls. (H) Liver apoptosis-associated genes (Apaf1, Bax, Bcl2, and Bcl2l1) levels were measured in LPS-treated young and aged rat by qPCR. *P < 0.05 vs. nontreated controls.#P < 0.05 vs. LPS-treated controls.
Discussion
In this study, we attempted to determine the role played by LPS-induced autophagy in the regulation of liver lipid metabolism by comparing LPS-treated mice and fasting mice. We observed that hepatocytes and mouse livers showed a robust autophagic response to LPS challenge. Furthermore, an increased autophagic response against LPS in hepatocytes was independent of classical autophagy signaling (MTOR-ULK1), but dependent on MAPK/p38 and BECN1 complex signaling. Because liver autophagy regulates lipid metabolism through the direct breakdown of lipid droplets, we investigated the role of LPS-induced autophagy in the regulation of lipid metabolism during sepsis. When LPS-treated mice were compared with control fasted mice, we found that LPS induced dynamic alterations in liver lipid metabolism in a time- and dose-dependent manner. Most interestingly, LPS-treated mice showed lower lipid accumulations in liver and higher induction of autophagy than fasted controls. Further in vitro and in vivo experiments under autophagy inhibitory conditions demonstrated the role of LPS-induced autophagy in the regulation of lipid degradation. The physiological importance of this phenomenon was verified in young and aged rats. Aged rats showed a reduced autophagic response to LPS and impaired lipid metabolism. These findings establish a new function for hepatocyte autophagy induced by LPS in the maintenance of lipid metabolism homeostasis during sepsis.
Specific lipid droplet degradation by autophagy (lipophagy) has been extensively studied since autophagy was shown to regulate lipid droplet degradation directly.5 In particular, hepatocyte lipophagy is critical for regulating energy homeostasis and lipid contents.5,6 Because the liver is a major site of excessive lipid accumulation in metabolic syndrome, such as in patients with diabetes or fatty liver disease, it is plausible that lipophagy might play an important role in the liver. In a previous study, the inhibition of liver autophagy using genetic or pharmacological methods led to increases in cellular lipid contents, lipid droplet sizes, and impaired β-oxidation.5 In addition to hepatocytes, several studies have reported that autophagy participates in lipid droplet degradation in hypothalamic and striatal neurons, glial cells, macrophage foam cells, fibroblasts, adipocytes, enterocytes, and T cells.24 Although it is evident the substrates of autophagy include lipid droplets, and that the inhibition of autophagy causes lipid degradation problems, the mechanisms responsible for the selection, identification, and sequestration of lipid droplets remain largely unknown. Recently, several studies have demonstrated that certain regulatory autophagy proteins are enriched in lipid droplets and that they facilitate autophagosome sequestration of lipid droplets.14,25 Furthermore, in a more recent study, it was demonstrated that the small GTPase RAB7 acts as a central regulator of hepatocellular lipophagy.26 In our experiments, we focused on determining whether endotoxin-induced autophagy plays a role in the maintenance of lipid metabolism homeostasis during sepsis. We found that the inhibition of autophagy in vitro and in vivo during LPS stimulation significantly increased lipid accumulation, but although it was evident that autophagy regulated lipid metabolism in our sepsis model, we did not identify the molecular mechanisms involved or examine the specificities of autophagy substrates. Further experiments are needed to confirm the lipophagy-associated protein changes observed in other experiments.
An autophagy response during infection has been well demonstrated, especially in immune cells. Autophagy contributes to the suppression of inflammation, including the downregulation of the interferon response and the inhibition of inflammasome-dependent cytokines,27,28 and plays important roles in the adaptive immune response. Autophagy also contributes to CD4+ T-cell selection.29 Furthermore, autophagosomes can fuse with major histocompatibility complex class II loading compartments to achieve antigen presentation.30 These previous findings suggest autophagy can influence inflammation and immune system functions. Of the many known mediators of inflammation, LPS is an important mediator of the autophagic response. Although LPS-induced autophagy plays important roles in the degradation of intracellular bacteria and viruses in immune cells, the role of LPS-induced autophagy in other cell types has yet to be elucidated. Hepatocytes also express TLR4 and recognize the presence of Gram negative bacterial infections, and the activation of TLR4 on hepatocytes contributes to various physiological and pathological states including metabolic and inflammatory diseases.19,31 Recent studies have demonstrated that autophagy is also induced in patients with sepsis and in an animal model of sepsis, and have shown that autophagy might play a protective role during sepsis.20,21,32,33 Furthermore, in vitro exposure of LPS to hepatocytes has been reported to induce an autophagic response directly.34 Interestingly, LPS-induced autophagy induction showed little difference from classically (e.g., starvation) activated autophagy. Normally, SQSTM1 is decreased during autophagy due to increased clearance of SQSTM1 sequestered within autophagosomes. However, Chen et al. showed that LPS treatment in hepatocytes increases mRNA and protein levels of SQSTM1 and demonstrated that this increase is pivotal for LPS-induced autophagy.34 Furthermore, TLR4-driven autophagosome formation in macrophages is also dependent on an SQSTM1 increase implicating the importance of SQSTM1 in LPS-induced autophagy.16 Consistently, our data also showed an increase of SQSTM1 expression in vitro and in vivo after LPS challenge implicating the importance of SQSTM1 in LPS-induced autophagy.
Fasting and endotoxemia, the latter of which is commonly accompanied by severe anorexia, induce marked changes in lipid metabolism.9,10 Both of these conditions induce the release of FFAs from adipose tissue due to increased LIPE (lipase, hormone sensitive) activity. Consequently, the liver takes up excessive amounts of FFAs from blood and stores these lipids.13 Although fasting and endotoxemia both induces lipid accumulative anabolic actions in the liver, few experiments have compared these 2 conditions with respect to lipid accumulation. Ohhira et al. demonstrated that 30 mg/kg of LPS causes greater hepatic accumulation of liver lipid versus fasted controls.10 When we examined the dose- and time-dependent effects of LPS on lipid accumulation vs. fasted controls, we found that LPS doses lower than 5 mg/kg showed lower hepatic lipid accumulations than fasted controls (Fig. 4). Furthermore, fasting mice showed time-dependent increases in lipid accumulation, whereas LPS-treated mice showed almost basal level of lipids in the liver after 48-h treatment (Fig. 4). These time- and dose-dependent experiments revealed unexpected and dynamic lipid metabolism changes in liver during sepsis. Based on these results, we hypothesized increased autophagy during sepsis might regulate lipid metabolism changes. Our in vitro and in vivo experiments demonstrated that the inhibition of autophagy during sepsis can aggravate lipid accumulation, and that inflammation and apoptosis-associated genes were dysregulated when autophagy was inhibited (Fig. 6, 7). However, further activation of autophagy during sepsis did not show dramatic effects when compared with inhibitor-based experiments (Fig. S8). These results might be due to the sufficient autophagy induction by the LPS response in the liver. Interestingly, serum glucose, which maintains energy homeostasis during sepsis, was significantly lower in autophagy-inhibited mice, which suggests liver autophagy was essential for maintaining serum glucose levels. It has already been suggested that liver autophagy contributes to the maintenance of blood glucose level.35 Although it was evident from previous reports that autophagy induced by LPS in the liver plays a protective role, no previous report has connected an increased autophagy response and lipid metabolism changes during sepsis. Accordingly, this is the first report to connect autophagy response and dynamic changes of lipid metabolism during sepsis.
To determine the physiological meanings of our findings, we examined previous results regarding dysregulated lipid metabolism after LPS treatment. We previously reported that aged rats showed higher lipid accumulation, and inflammasome and IL1B levels in liver than young rats,23 and in the present study, we further examined the autophagic response in young and aged rats. We found increased LC3 conversion in response to LPS was lower in aged rat livers, and that both basal BECN1 levels and LPS-induced increases in BECN1 levels were lower in aged rat livers. These results are of interest because autophagy suppresses the inflammasome complex directly.28 Collectively, it would appear that a defective autophagic response in aged rat livers might result in increased lipid accumulation and sustained inflammasome activation. Obesity, like aging, also increases sensitivity to endotoxins, especially during the pathogenesis of steatohepatitis.36 Because obese livers exhibit reduced basal or stimuli-induced autophagy,37 it is plausible that decreased autophagy during obesity might play a role in the pathogenesis of LPS-induced steatohepatitis. Stated simply, autophagy enhanced during sepsis in the liver and hepatocytes has significant physiological and pathological meaning with respect to the regulation of lipid metabolism.
Although our findings demonstrated the putative role of autophagy in regulating lipid metabolism during sepsis, there still remain some limitations. One issue of concern is whether changes in lipid metabolism are the cause of increased inflammation and injury in our experiments. Autophagy substrates also include cellular organelle and inflammation-related molecules, which can affect not only metabolism but also inflammation and cell death; it is not easy to ensure that the changes in lipid metabolism are the cause of increased injury. To make a clear explanation between altered lipid metabolism and increased injury, accurate mechanisms that specifically regulate lipophagy will be needed. Furthermore, we only applied pharmacological agents to see the effects of inhibition or activation of autophagy on LPS-induced lipid metabolism changes. Genetic models (e.g., conditional autophagy gene knockout mice) should be investigated to fully demonstrate the role of autophagy in endotoxin-induced liver lipid metabolism changes. Finally, our study design also has a limitation in drawing clinical conclusions as we used LPS treatment as a sepsis model. LPS-induced sepsis is a limited model for sepsis studies, which cannot be applied in human sepsis. Because other polymicrobial sepsis models using cecal ligation and puncture (CLP) also show increased autophagy with lipid accumulation in liver,33,38 the role of autophagy suggested here should be further demonstrated in other sepsis models that resemble human sepsis.
In summary, this study shows that liver autophagy induced by LPS plays a role in the degradation of lipid during sepsis (Fig. S9). Furthermore, blocking autophagy induced by LPS aggravated lipid accumulation, and reduced lipid utilization caused by inhibiting autophagy further increased liver inflammation and decreased blood glucose levels. At the cellular level, deficient autophagy increased lipid accumulation after treatment with fatty acid and LPS. The physiological importance of autophagy in the regulation of lipid metabolism was verified in young and aged rats treated with LPS. In particular, the autophagic response was lower in aged rat livers, which showed more lipid accumulation and inflammation. The present study demonstrates the important physiological and pathological meanings of autophagy in the regulation of lipid metabolism during sepsis and provides potential therapeutic targets for dysregulated lipid metabolism during sepsis.
Materials and methods
Materials
Lipopolysaccharide (LPS; Escherichia coli serotype O111:B5) was purchased from Sigma (L2630). The antibodies used for WB were anti-LC3 (Cell Signaling Technology, 3869), anti-BECN1 (Cell Signaling Technology, 3495), anti-ATG12 (Cell Signaling Technology, 4180), anti-SQSTM1 (Cell Signaling Technology, 5114), anti-ATG7 (Cell Signaling Technology, 8558), anti-phospho-AKT (Santa Cruz Biotechnology, sc-7985R), anti-AKT (Santa Cruz Biotechnology, sc-1618), anti-phospho-MTOR (Cell Signaling Technology, 2481), anti-MTOR (Cell Signaling Technology, 2983), anti-phospho-EIF4EBP1 (Cell Signaling Technology, 2855), anti-phospho-AMPK (Cell Signaling Technology, 2535), anti-phospho-ULK1 (Cell Signaling Technology, 6888), anti-ULK1 (Santa Cruz Biotechnology, sc-33182), anti-ACTB (Santa Cruz Biotechnology, sc-47778), anti-MAPK/JNK (Cell Signaling Technology, 9252), anti-phospho-MAPK/JNK (Santa Cruz Biotechnology, sc-6254), anti-MAPK/ERK (Cell Signaling Technology, 9102), anti-phospho-MAPK/ERK (Santa Cruz Biotechnology, sc-101761), anti-MAPK/p38 (Cell Signaling Technology, 9212), anti-phospho-MAPK/p38 (Santa Cruz Biotechnology, sc-7975R), anti-RELA (Santa Cruz Biotechnology, sc-372), anti-GTF2B/TFIIB (Santa Cruz Biotechnology, sc-225), and anti-PPARA/PPARα (Abcam, 24509).
Animals
Eight-wk-old male C57BL/6 mice were used to investigate the effects of LPS on the autophagic response. Mice were maintained under controlled environmental conditions under a 12-h/12-h light/dark cycle, and allowed ad libitum access to water and a standard laboratory diet, but deprived of food just before LPS injection. Control mice were also deprived of food in the same manner and are referred to as fasted controls. Mice were treated with LPS (0.5 mg/kg ∼20 mg/kg) intraperitoneally according to each experimental condition and killed at predetermined times to examine time-dependent effects. To inhibit autophagosome-lysosome formation during sepsis, chloroquine (50 mg/kg; Sigma, C6628) was pre-injected intraperitoneally. To investigate the effects of autophagy activation during sepsis, rapamycin (6 mg/kg; Selleckchem, s1039) was pre-injected intraperitoneally. Young (6 mo) and aged (24 mo) rats were treated with LPS (2 mg/kg) to compare the effect of age on autophagy and lipid accumulation. Serum was collected for biochemical analysis. Livers were collected and either frozen immediately in liquid nitrogen for quantitative polymerase chain reaction (qPCR), western blot, and biochemical tests, or fixed in neutral-buffered formalin for histochemical examination. For long-term storage, tissue samples were moved to a -80°C deep freezer located at Aging Tissue Bank in Pusan National University. Animal studies were designed by the Aging Tissue Bank, approved by the Institutional Animal Care Committee of Pusan National University, and performed in accordance with the guidelines for animal experimentation issued by Pusan National University.
Cell culture experiments
AC2F rat liver hepatocytes (Japanese Collection of Research Bioresources Cell Bank, JCRB0408) and the HepG2 human hepatoma cell line (American Type Culture Collection, HB-8065) initially were used to evaluate the effects of LPS on autophagy initiation. Cells were cultured in Dulbecco's modified Eagle's medium (WELGENE Inc., LM001–05) containing 10% fetal bovine serum (WELGENE Inc., S101–01) and penicillin/streptomycin (100 IU/50 μg/mL; WELGENE Inc., LS202–02) in a humidified atmosphere containing 5% CO2 at 37°C. Cells were treated with LPS (1 µg/ml) with or without various inhibitors according to the experimental design. Cells were collected and either homogenized immediately to extract RNA or protein, or fixed in neutral-buffered formalin for staining. To observe autophagosome formation and autophagy flux, cells were pretransfected with a GFP-LC3 plasmid (Addgene, 21073; deposited by Tamotsu Yoshimori) or an mCherry-GFP-LC3 plasmid (Addgene, 22418; deposited by Jayanta Debnath) using Lipofectamine 3000 (Invitrogen, L3000015). Cells were stained with Nile red dye (Sigma, 19123) and LysoTracker Blue DND-22 dye (ThermoFisher Scientific, L7525) to determine the locations of autophagosomes, lipid droplets, and lysosomes. Confocal images were obtained using a FV10i FLUOVIEW Confocal Microscope (Olympus, Tokyo, Japan).
siRNA transfection
Atg7 siRNA and negative control siRNA were purchased from Integrated DNA Technologies (IDT). Dicer-substrate siRNA methods were used to increase the potency of target gene knockdown. The selected Atg7 siRNA-targeting duplex sequence was: 5’-CCAGCUCUGAACUCAAUAAUAACTT-3’ and 5’-AAGUUAUUAUUGAGUUCAGA GCUGGUG-3’. siRNA transfections were performed using Lipofectamine 3000. For transfection, cells were seeded in 6-well plates, grown for 24 h until 60–70% confluent, and then transfected with 25 nM Atg7 siRNA or negative control siRNA.
Transmission electron microscopy
Livers were fixed with 2% paraformaldehyde and 2% glutaraldehyde in 0.1 M phosphate buffer at pH 7.4 for 1 h. After fixation and dehydration, ultrathin sections (70–80 nm) were obtained using an ultramicrotome (RMC MT6000-XL). Sections were stained with uranyl acetate and lead citrate and examined under a Zeiss EM 900 transmission electron microscope.
Protein extractions from tissue and cells
All solutions, tubes, and centrifuges were maintained at 0–4°C. PRO-PREP protein extraction solution (Intron Biotech Inc., 17081) was used to extract total protein lysates from tissues or cells according to the manufacturer's instructions. To extract nuclear protein, tissues or cells were washed with ice-cold phosphate-buffered saline (PBS; Thermo Fisher Scientific, 21600–010), suspended in 10 mM Tris (pH 8.0) containing 1.5 mM MgCl2, 1 mM dithiothreitol, 0.1% NP-40 Substitute (Affymetrix, 19628), and protease inhibitors (GenDEPOT, P3100), homogenized, incubated on ice for 15 min, and centrifuged at 14,000 g for 15 min at 4°C. Supernatants were used as cytosolic fractions and pellets were resuspended in 10 mM Tris-HCl (pH 8.0) containing 50 mM KCl, 100 mM NaCl, and protease inhibitors, incubated on ice for 30 min, and centrifuged at 14,000 g for 30 min at 4°C. The resultant supernatants were used as nuclear fractions.
Western blotting
Western blot assays were performed as described previously with minor modification.39 Briefly, nuclear or cytosolic proteins (20 ∼100 μg of protein) were boiled for 5 min in gel-loading buffer (0.125 M Tris-HCl, pH 6.8, 4% SDS (Biosesang, S2015), 10% 2-mercaptoethanol, 0.2% bromophenol blue) at a volume ratio of 1:1. Samples containing the same amounts of proteins were then separated by sodium dodecyl sulfate-polyacrylamide gel electrophoresis in 8 ∼15% acrylamide gels and transferred using a Bio-Rad western system (Bio-Rad, Hercules, CA, USA) to polyvinylidene difluoride (PVDF; Millipore, IPVH00010) membranes, which were immediately placed in blocking buffer (5% non-fat milk) containing 10 mM Tris, pH 7.5, 100 mM NaCl, 0.1% Tween 20 (AMRESCO, 0777). Membranes were then washed in Tris-buffered saline (TBS; 50 mM Tris, 150 mM, NaCl, pH 7.6)-Tween buffer (10 mM Tris, pH 7.5, 100 mM NaCl, 0.1% Tween 20) for 30 min, incubated with specific primary antibodies (dilution 1:500 to 1:2000) at 4°C overnight, washed 3 × 10-min in TBS-Tween buffer, and incubated with horseradish peroxidase-conjugated anti-mouse antibody (1:10,000; Santa Cruz Biotechnology, sc-2005), anti-rabbit antibody (1:10,000; Santa Cruz Biotechnology, sc-2030), or anti-goat antibody (1:10,000; Santa Cruz Biotechnology, sc-2354) at 25°C for 1 h. Resulting immunoblots were visualized using Western Bright Peroxide solution (Advansta, K-12045-D50) and a Davinch-chemi CAS-400 (Davinch-K, Seoul, Korea), according to the manufacturers’ instructions.
Isolation of total RNA and qPCR
Total RNA was isolated as described previously. Briefly, liver tissue samples were homogenized in the presence of TRIzol reagent (Invitrogen, 15596026) in a tissue homogenizer. Aliquots of 0.2 ml chloroform per 1 ml homogenate were added and samples were shaken vigorously for 15 min. Aqueous phases were transferred to fresh tubes, to which an equal volume of isopropanol was added. Samples were then left at 4°C for 15 min and centrifuged at 12,000 g at 4°C for 15 min. Supernatants were removed and RNA pellets were washed once with 75% ethanol by vortexing and then centrifuged at 7,500 g at 4°C for 8 min. Pellets were dried for 10–15 min and dissolved in DEPC-treated water (Sigma, D5758). RNase-free DNase-treated total RNA (2.0 μg) was reverse-transcribed using a cDNA synthesis kit from GenDEPOT (R5600–500). cDNA so obtained was stored at -20°C until required. qPCR was performed using Sybr green dye (BIOLINE, B10–98005) and the CFX Connect System (Bio-Rad Laboratories Inc., Hercules, CA, USA).
Lipid extraction and quantification
To analyze hepatic and cellular TG levels, livers or cells were homogenized in ice-cold PBS. Lipids were extracted with methanol:chloroform (1:2), dried and resuspended in 5% bovine serum albumin (Sigma, A6003) in distilled water. TG levels were determined using a commercially available kit (STANBIO, 2200–225).
Histological analysis
Livers were fixed in 10% neutral formalin and paraffin-embedded sections were stained with hematoxylin and eosin (H&E staining). The Oil Red O (Sigma, O1391) staining was done by described previously methods with optimal cutting temperature of frozen samples and consequent staining.40
Serum analysis
Serum glucose (STANBIO, 1070–125), cholesterol (Biosystems, 12505), TG (STANBIO, 2200–225), and free fatty acids (FFAs; Shin Yang Chemical, 01120302) were analyzed using commercially available kits. Serum GPT/ALT levels were measured using a commercial kit (STANBIO, 2930–500).
Statistical analysis
The Student t test was used to analyze differences between 2 groups, and analysis of variance (ANOVA) was used to analyze intergroup differences. P values of < 0.05 were considered statistically significant. The analysis was performed using GraphPad Prism 5 (GraphPad software, La Jolla, CA). Colocalization percentages and densitometry results of western blotting were obtained using ImageJ software.
Supplementary Material
Abbreviations
- 3-MA
3-methyladenine
- CMA
chaperone-mediated autophagy
- FFA
free fatty acid
- GPT/ALT
glutamic pyruvic transaminase, soluble
- LPS
lipopolysaccharide
- MAPK
mitogen-activated protein kinase
- OA
oleic acid
- PtdIns3K
phosphatidylinositol-3 kinase
- qPCR
quantitative polymerase chain reaction
- TEM
transmission electron microscopy
- TG
triglyceride
- TLR
toll-like receptor
Disclosure of potential conflicts of interest
No potential conflicts of interest were disclosed.
Acknowledgments
The authors thank the Korean Aging Tissue Bank for providing research materials.
Funding
This work was supported by the National Research Foundation of Korea (NRF) funded by the Korea government (MSIP) (grant no. 2009–0083538); National Research Foundation of Korea (NRF) funded by the Korea government (MSIP) (grant no. 2015R1A2A2A01004137); Bio & Medical Technology Development Program of the NRF funded by the Ministry of Science, ICT & Future Planning (grant no. 2015M3A9B 8029074).
References
- [1].Choi AM, Ryter SW, Levine B. Autophagy in human health and disease. N Engl J Med 2013; 368:1845-6; PMID:23656658; https://doi.org/ 10.1056/NEJMc1303158 [DOI] [PubMed] [Google Scholar]
- [2].Glick D, Barth S, Macleod KF. Autophagy: cellular and molecular mechanisms. J Pathol 2010; 221:3-12; PMID:20225336; https://doi.org/ 10.1002/path.2697 [DOI] [PMC free article] [PubMed] [Google Scholar]
- [3].Jiang P, Mizushima N. Autophagy and human diseases. Cell Res 2014; 24:69-79; PMID:24323045; https://doi.org/ 10.1038/cr.2013.161 [DOI] [PMC free article] [PubMed] [Google Scholar]
- [4].Rabinowitz JD, White E. Autophagy and metabolism. Science 2010; 330:1344-8; PMID:21127245; https://doi.org/ 10.1126/science.1193497 [DOI] [PMC free article] [PubMed] [Google Scholar]
- [5].Singh R, Kaushik S, Wang Y, Xiang Y, Novak I, Komatsu M, Tanaka K, Cuervo AM, Czaja MJ. Autophagy regulates lipid metabolism. Nature 2009; 458:1131-5; PMID:19339967; https://doi.org/ 10.1038/nature07976 [DOI] [PMC free article] [PubMed] [Google Scholar]
- [6].Settembre C, De Cegli R, Mansueto G, Saha PK, Vetrini F, Visvikis O, Huynh T, Carissimo A, Palmer D, Klisch TJ, et al.. TFEB controls cellular lipid metabolism through a starvation-induced autoregulatory loop. Nat Cell Biol 2013; 15:647-58; PMID:23604321; https://doi.org/ 10.1038/ncb2814 [DOI] [PMC free article] [PubMed] [Google Scholar]
- [7].Ding WX. Induction of autophagy, a promising approach for treating liver injury. Hepatology 2014; 59:340-3; PMID:23775596; https://doi.org/ 10.1002/hep.26572 [DOI] [PMC free article] [PubMed] [Google Scholar]
- [8].Rautou PE, Mansouri A, Lebrec D, Durand F, Valla D, Moreau R. Autophagy in liver diseases. J Hepatol 2010; 53:1123-34; PMID:20810185; https://doi.org/ 10.1016/j.jhep.2010.07.006 [DOI] [PubMed] [Google Scholar]
- [9].Newberry EP, Xie Y, Kennedy S, Han X, Buhman KK, Luo J, Gross RW, Davidson NO. Decreased hepatic triglyceride accumulation and altered fatty acid uptake in mice with deletion of the liver fatty acid-binding protein gene. J Biol Chem 2003; 278:51664-72; PMID:14534295; https://doi.org/ 10.1074/jbc.M309377200 [DOI] [PubMed] [Google Scholar]
- [10].Ohhira M, Motomura W, Fukuda M, Yoshizaki T, Takahashi N, Tanno S, Wakamiya N, Kohgo Y, Kumei S, Okumura T. Lipopolysaccharide induces adipose differentiation-related protein expression and lipid accumulation in the liver through inhibition of fatty acid oxidation in mice. J Gastroenterol 2007; 42:969-78; PMID:18085354; https://doi.org/ 10.1007/s00535-007-2119-8 [DOI] [PubMed] [Google Scholar]
- [11].Rui L. Energy metabolism in the liver. Compr Physiol 2014; 4:177-97. PMID: 24692138. [DOI] [PMC free article] [PubMed] [Google Scholar]
- [12].Feingold KR, Staprans I, Memon RA, Moser AH, Shigenaga JK, Doerrler W, Dinarello CA, Grunfeld C. Endotoxin rapidly induces changes in lipid metabolism that produce hypertriglyceridemia: low doses stimulate hepatic triglyceride production while high doses inhibit clearance. J Lipid Res 1992; 33:1765-76. PMID: 1479286. [PubMed] [Google Scholar]
- [13].Khovidhunkit W, Kim MS, Memon RA, Shigenaga JK, Moser AH, Feingold KR, Grunfeld C. Effects of infection and inflammation on lipid and lipoprotein metabolism: mechanisms and consequences to the host. J Lipid Res 2004; 45:1169-96; PMID:15102878; https://doi.org/ 10.1194/jlr.R300019-JLR200 [DOI] [PubMed] [Google Scholar]
- [14].Kaushik S, Cuervo AM. Degradation of lipid droplet-associated proteins by chaperone-mediated autophagy facilitates lipolysis. Nat Cell Biol 2015; 17:759-70; PMID:25961502; https://doi.org/ 10.1038/ncb3166 [DOI] [PMC free article] [PubMed] [Google Scholar]
- [15].Xu Y, Jagannath C, Liu XD, Sharafkhaneh A, Kolodziejska KE, Eissa NT. Toll-like receptor 4 is a sensor for autophagy associated with innate immunity. Immunity 2007; 27:135-44; PMID:17658277; https://doi.org/ 10.1016/j.immuni.2007.05.022 [DOI] [PMC free article] [PubMed] [Google Scholar]
- [16].Fujita K, Maeda D, Xiao Q, Srinivasula SM. Nrf2-mediated induction of p62 controls Toll-like receptor-4-driven aggresome-like induced structure formation and autophagic degradation. Proc Natl Acad Sci U S A 2011; 108:1427-32; PMID:21220332; https://doi.org/ 10.1073/pnas.1014156108 [DOI] [PMC free article] [PubMed] [Google Scholar]
- [17].Yuan H, Perry CN, Huang C, Iwai-Kanai E, Carreira RS, Glembotski CC, Gottlieb RA. LPS-induced autophagy is mediated by oxidative signaling in cardiomyocytes and is associated with cytoprotection. Am J Physiol Heart Circ Physiol 2009; 296:H470-9; PMID:19098111; https://doi.org/ 10.1152/ajpheart.01051.2008 [DOI] [PMC free article] [PubMed] [Google Scholar]
- [18].Leventhal JS, Ni J, Osmond M, Lee K, Gusella GL, Salem F, Ross MJ. Autophagy Limits Endotoxemic Acute Kidney Injury and Alters Renal Tubular Epithelial Cell Cytokine Expression. PLoS One 2016; 11:e0150001; PMID:26990086; https://doi.org/ 10.1371/journal.pone.0150001 [DOI] [PMC free article] [PubMed] [Google Scholar]
- [19].Jia L, Vianna CR, Fukuda M, Berglund ED, Liu C, Tao C, Sun K, Liu T, Harper MJ, Lee CE, et al.. Hepatocyte Toll-like receptor 4 regulates obesity-induced inflammation and insulin resistance. Nat Commun 2014; 5:3878; PMID:24815961; https://doi.org/ 10.1038/ncomms4878 [DOI] [PMC free article] [PubMed] [Google Scholar]
- [20].Carchman EH, Rao J, Loughran PA, Rosengart MR, Zuckerbraun BS. Heme oxygenase-1-mediated autophagy protects against hepatocyte cell death and hepatic injury from infection/sepsis in mice. Hepatology 2011; 53:2053-62; PMID:21437926; https://doi.org/ 10.1002/hep.24324 [DOI] [PMC free article] [PubMed] [Google Scholar]
- [21].Amir M, Zhao E, Fontana L, Rosenberg H, Tanaka K, Gao G, Czaja MJ. Inhibition of hepatocyte autophagy increases tumor necrosis factor-dependent liver injury by promoting caspase-8 activation. Cell Death Differ 2013; 20:878-87; PMID:23519075; https://doi.org/ 10.1038/cdd.2013.21 [DOI] [PMC free article] [PubMed] [Google Scholar]
- [22].Zhang Q, Gao M, Zhang Y, Song Y, Cheng H, Zhou R. The germline-enriched Ppp1r36 promotes autophagy. Sci Rep 2016; 6:24609; PMID:27098880; https://doi.org/ 10.1038/srep24609 [DOI] [PMC free article] [PubMed] [Google Scholar]
- [23].Chung KW, Lee EK, Kim DH, An HJ, Kim ND, Im DS, Lee J, Yu BP, Chung HY. Age-related sensitivity to endotoxin-induced liver inflammation: Implication of inflammasome/IL-1beta for steatohepatitis. Aging Cell 2015; 14:524-33; PMID:25847140; https://doi.org/ 10.1111/acel.12305 [DOI] [PMC free article] [PubMed] [Google Scholar]
- [24].Ward C, Martinez-Lopez N, Otten EG, Carroll B, Maetzel D, Singh R, Sarkar S, Korolchuk VI. Autophagy, lipophagy and lysosomal lipid storage disorders. Biochim Biophys Acta 2016; 1861:269-84; PMID:26778751; https://doi.org/ 10.1016/j.bbalip.2016.01.006 [DOI] [PubMed] [Google Scholar]
- [25].Dupont N, Chauhan S, Arko-Mensah J, Castillo EF, Masedunskas A, Weigert R, Robenek H, Proikas-Cezanne T, Deretic V. Neutral lipid stores and lipase PNPLA5 contribute to autophagosome biogenesis. Curr Biol 2014; 24:609-20; PMID:24613307; https://doi.org/ 10.1016/j.cub.2014.02.008 [DOI] [PMC free article] [PubMed] [Google Scholar]
- [26].Schroeder B, Schulze RJ, Weller SG, Sletten AC, Casey CA, McNiven MA. The small GTPase Rab7 as a central regulator of hepatocellular lipophagy. Hepatology 2015; 61:1896-907; PMID:25565581; https://doi.org/ 10.1002/hep.27667 [DOI] [PMC free article] [PubMed] [Google Scholar]
- [27].Saitoh T, Fujita N, Jang MH, Uematsu S, Yang BG, Satoh T, Omori H, Noda T, Yamamoto N, Komatsu M, et al.. Loss of the autophagy protein Atg16L1 enhances endotoxin-induced IL-1beta production. Nature 2008; 456:264-8; PMID:18849965; https://doi.org/ 10.1038/nature07383 [DOI] [PubMed] [Google Scholar]
- [28].Shi CS, Shenderov K, Huang NN, Kabat J, Abu-Asab M, Fitzgerald KA, Sher A, Kehrl JH. Activation of autophagy by inflammatory signals limits IL-1beta production by targeting ubiquitinated inflammasomes for destruction. Nat Immunol 2012; 13:255-63; PMID:22286270; https://doi.org/ 10.1038/ni.2215 [DOI] [PMC free article] [PubMed] [Google Scholar]
- [29].Nedjic J, Aichinger M, Emmerich J, Mizushima N, Klein L. Autophagy in thymic epithelium shapes the T-cell repertoire and is essential for tolerance. Nature 2008; 455:396-400; PMID:18701890; https://doi.org/ 10.1038/nature07208 [DOI] [PubMed] [Google Scholar]
- [30].Schmid D, Pypaert M, Munz C. Antigen-loading compartments for major histocompatibility complex class II molecules continuously receive input from autophagosomes. Immunity 2007; 26:79-92; PMID:17182262; https://doi.org/ 10.1016/j.immuni.2006.10.018 [DOI] [PMC free article] [PubMed] [Google Scholar]
- [31].Seki E, De Minicis S, Osterreicher CH, Kluwe J, Osawa Y, Brenner DA, Schwabe RF. TLR4 enhances TGF-beta signaling and hepatic fibrosis. Nat Med 2007; 13:1324-32; PMID:17952090; https://doi.org/ 10.1038/nm1663 [DOI] [PubMed] [Google Scholar]
- [32].Carchman EH, Whelan S, Loughran P, Mollen K, Stratamirovic S, Shiva S, Rosengart MR, Zuckerbraun BS. Experimental sepsis-induced mitochondrial biogenesis is dependent on autophagy, TLR4, and TLR9 signaling in liver. FASEB J 2013; 27:4703-11; PMID:23982147; https://doi.org/ 10.1096/fj.13-229476 [DOI] [PMC free article] [PubMed] [Google Scholar]
- [33].Takahashi W, Watanabe E, Fujimura L, Watanabe-Takano H, Yoshidome H, Swanson PE, Tokuhisa T, Oda S, Hatano M. Kinetics and protective role of autophagy in a mouse cecal ligation and puncture-induced sepsis. Crit Care 2013; 17:R160; PMID:23883625; https://doi.org/ 10.1186/cc11939 [DOI] [PMC free article] [PubMed] [Google Scholar]
- [34].Chen C, Deng M, Sun Q, Loughran P, Billiar TR, Scott MJ. Lipopolysaccharide stimulates p62-dependent autophagy-like aggregate clearance in hepatocytes. Biomed Res Int 2014; 2014:267350; PMID:24683544. [DOI] [PMC free article] [PubMed] [Google Scholar]
- [35].Ezaki J, Matsumoto N, Takeda-Ezaki M, Komatsu M, Takahashi K, Hiraoka Y, Taka H, Fujimura T, Takehana K, Yoshida M, et al.. Liver autophagy contributes to the maintenance of blood glucose and amino acid levels. Autophagy 2011; 7:727-36; PMID:21471734; https://doi.org/ 10.4161/auto.7.7.15371 [DOI] [PMC free article] [PubMed] [Google Scholar]
- [36].Yang SQ, Lin HZ, Lane MD, Clemens M, Diehl AM. Obesity increases sensitivity to endotoxin liver injury: implications for the pathogenesis of steatohepatitis. Proc Natl Acad Sci U S A 1997; 94:2557-62; PMID:9122234; https://doi.org/ 10.1073/pnas.94.6.2557 [DOI] [PMC free article] [PubMed] [Google Scholar]
- [37].Yang L, Li P, Fu S, Calay ES, Hotamisligil GS. Defective hepatic autophagy in obesity promotes ER stress and causes insulin resistance. Cell Metab 2010; 11:467-78; PMID:20519119; https://doi.org/ 10.1016/j.cmet.2010.04.005 [DOI] [PMC free article] [PubMed] [Google Scholar]
- [38].Lee SJ, Zhang J, Choi AM, Kim HP. Mitochondrial dysfunction induces formation of lipid droplets as a generalized response to stress. Oxid Med Cell Longev 2013; 2013:327167; PMID:24175011; https://doi.org/ 10.1155/2013/327167 [DOI] [PMC free article] [PubMed] [Google Scholar]
- [39].Gershoni JM, Palade GE. Protein blotting: principles and applications. Anal Biochem 1983; 131:1-15; PMID:6193725; https://doi.org/ 10.1016/0003-2697(83)90128-8 [DOI] [PubMed] [Google Scholar]
- [40].Seiliez I, Belghit I, Gao Y, Skiba-Cassy S, Dias K, Cluzeaud M, Rémond D, Hafnaoui N, Salin B, Camougrand N, et al.. Looking at the metabolic consequences of the colchicine-based in vivo autophagic flux assay. Autophagy 2016; 12:343-56; PMID:26902586; https://doi.org/ 10.1080/15548627.2015.1117732 [DOI] [PMC free article] [PubMed] [Google Scholar]
Associated Data
This section collects any data citations, data availability statements, or supplementary materials included in this article.