

ABSTRACT
Enhanced macroautophagy/autophagy is recognized as a component of the pathogenesis of smoking-induced airway disease. Based on the knowledge that enhanced autophagy is linked to oxidative stress and the DNA damage response, both of which are linked to smoking, we used microarray analysis of the airway epithelium to identify smoking upregulated genes known to respond to oxidative stress and the DNA damage response. This analysis identified OSGIN1 (oxidative stress induced growth inhibitor 1) as significantly upregulated by smoking, in both the large and small airway epithelium, an observation confirmed by an independent small airway microarray cohort, TaqMan PCR of large and small airway samples and RNA-Seq of small airway samples. High and low OSGIN1 expressors have different autophagy gene expression patterns in vivo. Genome-wide correlation of RNAseq analysis of airway basal/progenitor cells showed a direct correlation of OSGIN1 mRNA levels to multiple classic autophagy genes. In vitro cigarette smoke extract exposure of primary airway basal/progenitor cells was accompanied by a dose-dependent upregulation of OSGIN1 and autophagy induction. Lentivirus-mediated expression of OSGIN1 in human primary basal/progenitor cells induced puncta-like staining of MAP1LC3B and upregulation of MAP1LC3B mRNA and protein and SQSTM1 mRNA expression level in a dose and time-dependent manner. OSGIN1-induction of autophagosome, amphisome and autolysosome formation was confirmed by colocalization of MAP1LC3B with SQSTM1 or CD63 (endosome marker) and LAMP1 (lysosome marker). Both OSGIN1 overexpression and knockdown enhanced the smoking-evoked autophagic response. Together, these observations support the concept that smoking-induced upregulation of OSGIN1 is one link between smoking-induced stress and enhanced-autophagy in the human airway epithelium.
KEYWORDS: airway epithelium, autophagy, COPD, oxidative stress, smoking, stem cell, TP53
Introduction
Cigarette smoke, with 1014 oxidants per puff and >4,000 xenobiotic compounds, puts a significant stress on the airway epithelium, the cell population that exhibits the first abnormal morphological changes in smokers.1-5 Among the consequences of smoking on the airway epithelium are derangements in the control of autophagy, normally a homeostatic process by which cells recycle damaged macromolecules.6-11 Exposure to cigarette smoke disrupts this process, contributing to epithelial loss of function and eventual cell death.12-22
Modification of autophagy in the airway epithelium has potential clinical implications relating to mucociliary clearance,18 protecting stressed cells from death,17 inhibiting cellular senescence,21 and suppressing carcinogenesis,23 and has been implicated in the pathogenesis of chronic obstructive pulmonary disease (COPD).6,7,11,21 From a biomarker view, genetic variants of autophagy-regulated genes may be potentially useful to identify subjects susceptible to COPD.24 Alterations in autophagy-related genes have been identified in lung tissue samples, but less is known about the regulation of autophagy-related genes in the human airway epithelium, the initial site of cigarette smoking-induced lung disease.25,26 In a review of our microarray analysis of genes expressed in the human airway epithelium, we recognized that oxidative stress-induced growth inhibitor, OSGIN1/OKL38/BDGI, a gene linked to oxidative stress and cell death in other tissues, was markedly upregulated in smokers compared with nonsmokers. Assessment of the literature relating to organs other than lung demonstrated that the expression of OSGIN1 is normally low, but with DNA damage, OSGIN1 is upregulated, likely via a TP53/p53-associated process [TP53/TRP53/p53 (note that the mouse nomenclature is TRP53, but we use TP53 hereafter to refer to both the human and mouse genes/proteins for simplicity)].27,28 Consequent to OSGIN1 upregulation, cells undergo apoptosis, likely through the translocation of OSGIN1 to mitochondria, with consequent cytochrome C release and cell death,27-29 suggesting that OSGIN1 belongs to the mitochondrial-related proapoptotic class of TP53 target genes.30 There is also evidence that the function of OSGIN1 can be mediated by genetic variance.29 In the context that smoking induces oxidative stress and that the known functions of OSGIN1 often coexist with autophagy,31-33 we hypothesized that smoking-induced upregulation of OSGIN1 expression can induce autophagy in the human airway epithelium.
Results
OSGIN1 is upregulated by cigarette smoking and associated with dysregulation of autophagy in vivo
To assess the effect of smoking on OSGIN1 expression in the airway epithelium in vivo, we evaluated global airway epithelium expression using microarray. In the large airway epithelium, OSGIN1 was upregulated by smoking (2.0-fold, P<0.003; Fig. 1A). In the small airway epithelium, OSGIN1 was significantly upregulated by smoking (cohort I, healthy smokers vs. healthy nonsmokers, 2.4-fold, P<10−9; COPD smokers vs. healthy nonsmokers, 2.5-fold, P<10−4; Fig. 1B). There were no significant differences between healthy smokers and COPD smokers. An independent microarray cohort (cohort II) with small airway samples was also analyzed.34 In this data set, OSGIN1 was also significantly upregulated by smoking (2.6-fold, P<0.003; Fig. S2).
Figure 1.
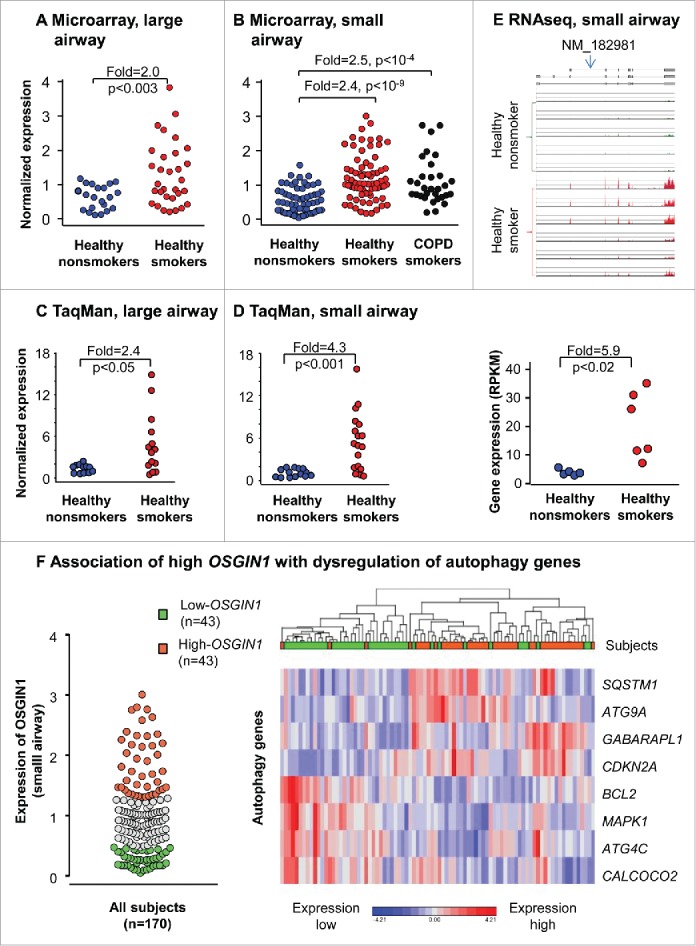
Upregulation of OSGIN1 in the human airway epithelium by cigarette smoking in vivo. Each data point represents one subject. (A) Microarray assessment of OSGIN1 expression in the large airway epithelium from 21 healthy nonsmokers and 31 healthy smokers. (B) Microarray assessment of OSGIN1 expression in the small airway epithelium from 62 healthy nonsmokers, 72 healthy smokers and 36 COPD smokers. (C) TaqMan validation of the upregulation of OSGIN1 gene expression in the large airway epithelium from 12 healthy nonsmokers and 14 healthy smokers. (D) TaqMan RT-PCR validation of the upregulation of OSGIN1 gene expression in the small airway epithelium from 14 nonsmokers and 18 smokers. (E) RNA-Seq assessment of OSGIN1 in the small airway epithelium from 5 healthy nonsmokers and 6 healthy smokers. Shown is the OSGIN1 sequence alignments with the read coverage depth, below is the quantitative data expressed in reads per kilobase per million mapped reads (RPKM). (F) Association of high OSGIN1 with dysregulation of autophagy genes. Left panel, the subjects from the small airway microarray cohort in Fig. 1B were grouped into high (> 3rd quartile) and low (< 1st quartile) OSGIN1 expressors. Right panel, the heatmap of 8 differentially-expressed common autophagy genes (99 in total) between high and low OSGIN1 expressors.
To validate the finding from the microarray studies, we assessed the expression OSGIN1 in human large and small airway epithelium by TaqMan PCR. Compared to Affymetrix microarray probesets for OSGIN1, the TaqMan probe binds to a different location in the OSGIN1 sequence. The data confirmed that smoking upregulates OSGIN1 expression in both large and small airway epithelium (2.4-fold, P<0.05 and 4.3-fold, P<0.001, respectively; Fig. 1C, D).
To further confirm the upregulation of OSGIN1 by smoking, RNA sequencing was used to assess OSGIN1 expression in small airway epithelium from 5 healthy nonsmokers and 6 healthy smokers. Quantitatively, smoking induced 5.9-fold upregulation of OSGIN1 (P<0.02, Fig. 1E). RNA-Seq analysis identified that NM_182981 (OSGIN1) is the only OSGIN1 mRNA isoform expressed in human airway epithelium from both nonsmokers and smokers.
To assess the expression pattern of OSGIN1 in smoking-stressed human airway epithelium, we stained OSGIN1 in human large airway biopsies from nonsmokers and smokers with or without COPD. The results demonstrated that: (1). OSGIN1 was both nuclei- and cytoplasm-positive, consistent with the literature;27 (2) upregulation of OSGIN1 by smoking had high variability among different individuals, consistent with the transcriptome data; (3) increased expression of OSGIN1 was not evenly distributed in the airway epithelium (Fig. S3).
Since there was a high variability of OSGIN1 gene expression in human airway epithelium, we grouped all 170 subjects in cohort I together and defined high OSIGN1 expressor (> 3rd quartile) and low OSGIN1 expressor (< 1st quartile). To explore the link of OSGIN1 with autophagy, expression of 99 common autophagy-related genes (Table S1), which were derived from 2 online databases, were compared between high and low OSGIN1 expressor groups. The results demonstrated that high OSGIN1 expression was associated with differential expression of autophagy-associated genes (Benjamini-Hochberg corrected P<0.05), including SQSTM1, ATG9A, GABARAPL1, CDKN2A/ARF, BCL2, MAPK1/ERK2, ATG4C and CALCOCO2/NDP52), supporting the hypothesis that OSGIN1 is an autophagy-relevant gene (Fig. 1F).
Expression of OSGIN1 is correlated with classic autophagy genes in vitro
To explore a possible role of OSGIN1 in autophagy of human airway epithelial cells in vitro, genome-wide correlation analysis was performed for OSGIN1, using RNAseq data from pure primary airway basal/progenitor cells of 17 healthy individuals.35 Using pure airway basal/progenitor cells reduced the complexity of carrying out correlation analysis in a mixed airway cell population. Strikingly, OSGIN1 showed strong positive correlations with many classical autophagy-related genes (http://autophagy.lu and http://www.tanpaku.org/autophagy), including MAP1LC3B, LAMP1, LAMP3, SQSTM1, WIPI1, ATG4B, GABARAPL1 and ULK1 (rho>0.7, P<0.05; Fig. 2A). As an example, the expression of the autophagy marker MAP1LC3B had a linear correlation to OSGIN1 (rho = 0.87, P<10−3; Fig. 2B). Pathway analysis demonstrated that autophagy-related pathways, including the lysosome-related pathways, MTOR signaling and regulation of autophagy, were significantly enriched in the OSGIN1-positively-correlated genes (Fig. 2C). Consistent with the function of OSGIN1 as a growth inhibitor,36-38 OSGIN1 was negatively correlated with cell cycle related genes (Fig. S4). Together, this unbiased correlation analysis is consistent with the in vivo finding (Fig. 1F) and supports the hypothesis that OSGIN1 might be an autophagy regulator in the airway epithelium.
Figure 2.
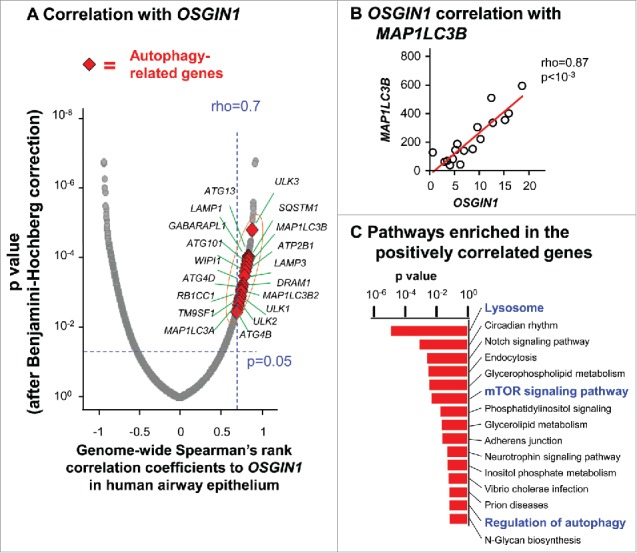
Correlation of the expression of OSGIN1 with classic autophagy genes in human airway basal cells. Gene expression of purified human airway basal cells from 17 healthy individuals were assessed by RNAseq. (A) Genome-wide correlations to OSGIN1. X axis, Spearman's rank correlation coefficient (rho). Y axis, P value after Partek step-up multiple test correction. Red diamonds are autophagy-related genes with high positive correlations to OSGIN1 (rho>0.7, P<0.05). (B) Correlation between the expression of OSGIN1 and MAP1LC3B (autophagy marker) gene expression. (C) Pathways enriched in the genes positively correlated with OSGIN1. The pathway enrichment analysis was based on the genes with high positive correlations to OSGIN1 (rho>0.7, P<0.05). Pathways related to autophagy (lysosome, MTOR signaling and regulation of autophagy) are highlighted.
Autophagy induction by smoking in vitro is accompanied by upregulation of OSGIN1
Prior studies have demonstrated that cigarette smoke extract (CSE) treatment can induce autophagy in human airway epithelial cells.12-19,21,22 Consistent with these findings, noncytotoxic CSE treatment (Fig. S5) of primary human airway basal cells increased autophagy-related gene expression at both the mRNA level (MAP1LC3B, SQSTM1 and GABARAPL1; Fig. 3A) and the protein level (SQSTM1 and MAP1LC3B-II, [the cleaved, lipidated and autophagosome-associated form of processed MAP1LC3B]) indicating autophagosome formation;39,40 Fig. 3B). Typical puncta staining of LC3B39,40 were observed in CSE-treated samples (Fig. 3C). In parallel, OSGIN1 was upregulated by CSE at both mRNA and protein level (Fig. 3A to C). Together, the data suggests that smoking-induced OSGIN1 upregulation and CSE-induced autophagy are connected events.
Figure 3.

Autophagy induction of autophagy-related genes by cigarette smoke extract in vitro paralleled by upregulation of OSGIN1. Primary human airway basal cells were treated with cigarette smoke extract (CSE) in vitro. Increasing concentrations of CSE (0 to 10%) were assessed (n = 3/group). (A) TaqMan PCR assessment of gene expression changes induced by CSE. Oxidative stress genes HMOX1, CYP1A1 and NQO1 were used as positive control. Shown are autophagy-related genes, MAP1LC3B, SQSTM1 and GABARAPL1, paralleled by OSGIN1 expression. Values are mean ± standard deviation; *, P<0.05; **, P<0.01; CSE treatment vs control. (B) Western analysis of gene expression changes induced by CSE. Shown is the expression of OSGIN1, oxidative stress genes HMOX1 and NQO1 (positive controls) and autophagy genes MAP1LC3B and SQSTM1. β-actin (ACTB) was used as loading control. MAP1LC3B-II is the activated form of MAP1LC3B during autophagy.39,40 (C) Fluorescence staining of MAP1LC3B and OSGIN1 in airway epithelial cells with or without 3% CSE treatment. Red, positive staining; green, OSGIN1; blue, nuclei. Bar: 10 µm. Experiments were repeated twice with similar results.
OSGIN1 upregulation of autophagy marker MAP1LC3B and SQSTM1
To explore a direct link of OSGIN1 with autophagy, we assessed the effect of enhanced expression of OSGIN1 in human primary airway basal cells. Two central autophagy markers, MAP1LC3B and SQSTM1,39,41,42 both upregulated in smoking-induced autophagy,12-19,21,22 were used as markers of autophagy induction. Cells from different human subjects, different dose of OSGIN1 and different time points were assayed. TaqMan PCR analysis showed that, although there was some variability in the 3 subjects tested, expression of both MAP1LC3B and SQSTM1 were upregulated by enhanced expression of OSGIN1 (Fig. 4A). The upregulation of MAP1LC3B and SQSTM1 reached the peak on post-treatment d 4 (Fig. 4B) and both MAP1LC3B and SQSTM1 expression were upregulated by OSGIN1 in a dose-dependent fashion (Fig. 4C).
Figure 4.

OSGIN1-mediated upregulation of autophagy-related genes in airway basal cells at the mRNA level. Human primary airway basal cells were infected with lenti-control or lenti-OSGIN1. Uninfected cells were used as additional control. Gene expression of autophagy genes MAP1LC3B and SQSTM1 were assessed by TaqMan PCR. (A) Validation in different subjects. Shown are results of 3 independent experiments using airway epithelial cells from 3 different subjects. n = 3/group. (B) Assessment over time. Samples were collected at post infection d 0 to d 5. n = 3/group. Values are mean ± standard deviation; *, P<0.05; **, P<0.01; lenti-OSGIN1 vs lenti-control at the same time point. (C) Assessment of dose. Three doses of lentivirus vector were used. The woodchuck hepatitis posttranscriptional regulatory element, a shared component on both the lenti-control and lenti-OSGIN1 vectors, were used to compare the post-infection dose of vectors between groups. Values are mean ± SD; *, P<0.05; **, P<0.01; lenti-OSGIN1 vs lenti-control at the same dose.
To assess the effect of OSGIN1 on the autophagic flux, late stage of autophagic flux was suppressed by bafilomycin A1 (BafA1). Since BafA1 can inhibit the fusion of autophagosomes with lysosomes, in the presence of BafA1, increased amount of SQSTM1 and MAP1LC3B-II will be seen if there is heightened autophagic flux. The results demonstrated that OSGIN1 overexpression can enhance the autophagic flux (Fig. 5A), but knockdown OSGIN1 has no consistent effect on autophagic flux (Fig. 5B). Together, it suggested that upregulation of OSGIN1 can increase autophagic flux, but OSGIN1 is not essential for the maintenance of autophagic flux in normal conditions.
Figure 5.
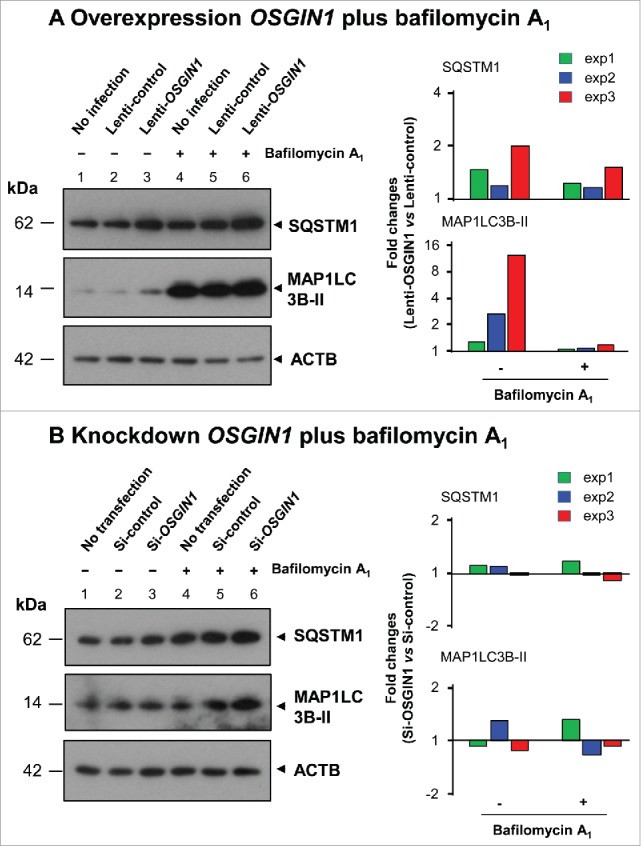
Effect of OSGIN1 on the autophagic flux. OSGIN1 was either overexpressed by lentiviral vector or suppressed by siRNA in the primary basal cells and then treated with BafA1, a late stage inhibitor of autophagic flux. The changes of autophagy markers MAP1LC3B and SQSTM1 were assessed by western analysis with ACTB as a loading control. (A) Overexpression of OSGIN1 with BafA1 treatment. Fold-changes between lenti-OSGIN1 and lenti-control from 3 independent experiments are shown. Note the consistent upregulation of SQSTM1 and MAP1LC3B-II by lenti-OSGIN1 with or without BafA1 (all fold-changes >1). (B) Knockdown OSGIN1 with BafA1 treatment. Folds changes between si-OSGIN1 and si-control from 3 independent experiments are shown. Note there are no consistent changes.
Morphological assessment of autophagosome and autolysosome induction by OSGIN1
To assess autophagy induction by OSGIN1 at the morphological level, immunostaining of MAP1LC3B was assessed in primary airway basal cells in which OSGIN1 was upregulated. Typical for cells undergoing autophagy,39 puncta-like staining of MAP1LC3B was observed in OSGIN1-treated cells using either immunofluorescence (Fig. 6A, 6B) or histochemistry staining (Fig. 6C). By overlaying differential interference contrast image with fluorescent images, MAP1LC3B-positive, vacuole-like structure could be clearly seen in OSGIN1 expressing cell (Fig. 6B). Quantitatively, there was a dose and time-dependent effect of OSGIN1 on the formation of MAP1LC3B-positive puncta (Fig. 6A, C. This observation was confirmed using cells from different human subjects (Fig. 6D).
Figure 6.

OSGIN1 induced autophagosome and autolysosome formation. Human primary airway basal cells were infected with lenti-control or lenti-OSGIN1. Autophagosome and autolysosome formation was assessed by punctate staining of MAP1LC3B, using both immunofluorescence staining and immunohistochemistry staining. The effect of lenti-OSGIN1 at different doses, different times and in different subjects were quantified by the percentage of MAP1LC3B+ cells. (A) Dose response. Left panels, immunofluorescence staining of MAP1LC3B in cells treated with the different dose of lenti-control and lenti-OSGIN1. Blue, nuclei; red, MAP1LC3B; green, OSGIN1. Bar: 50 µm. Right panel, quantification of MAP1LC3B+ cells. (B) Autophagic vacuole with MAP1LC3B staining. R, pseudo color red, MAP1LC3B; W, pseudo color white, OSGIN1; G, pseudo color green, GFP; B, pseudo color blue, nuclei; DIC, differential interference contrast. The inset is a combined image of DIC, MAP1LC3B and nuclei in an OSGIN1-expressing cell. Note the colocalization of MAP1LC3B with the vacuole structure in the cytoplasm. Bar: 10 µm. (C) Function of time. Left panels, immunohistochemistry staining of MAP1LC3B in cells at different time points after treatment (d 2 to d 5). Bottom insets are high magnification of MAP1LC3B staining from lenti-OSGIN1, day 4 samples, demonstrating morphology of MAP1LC3B+ cells. Blue, nuclei; red, MAP1LC3B. Bar: 50 µm. Bottom Right panel, quantification of MAP1LC3B+ cells. (D) Different subjects. Quantification of MAP1LC3B+ cells from experiments performed on 3 different subjects.
To further characterize the puncta-like staining in OSGIN1 treated cells, we did subcellular colocalization of OSGIN1 with SQSTM1, the endosome marker CD63 (also previously termed MLA1, LAMP-3 or TSPAN30) and LAMP1, a lysosome marker. Theoretically, along the sequential process of autophagy, phagophore, amphisome, autophagosome or autolysosome can lead to puncta-like staining pattern, with the interaction of SQSTM1 and MAP1LC3B mainly in autophagosomes,39 and coexpression of CD63 and MAP1LC3B in amphisomes, with coexpression of LAMP1 and MAP1LC3B in autolysosomes. The colocalization staining showed that in MAP1LC3B-positive cells, there were SQSTM1 costained puncta (Fig. 7A), CD63 costained puncta (Fig. 7B) and LAMP1 costained puncta (Fig. 7C), reflecting the dynamics of MAP1LC3B along the autophagic flux.
Figure 7.

Confirmation of OSGIN1-mediated autophagosome, amphisome and autolysosome formation. Human primary airway basal cells were infected with lenti-OSGIN1. Costaining of MAP1LC3B with SQSTM1 or CD63 (endosome marker) or LAMP1 (lysosome marker) was used to confirm autophagosome, amphisome and autolysosome formation. Red-MAP1LC3B; color green-SQSTM1, CD63 or LAMP1; yellow, colocalization; white, lenti-OSGIN1 infected cells; blue, nuclei. Pink arrowhead indicates the same cell in a different color channel. (A) Costaining of MAP1LC3B with SQSTM1. The costained puncta are in an autophagosome or autolysosome. (B) Costaining of MAP1LC3B with CD63. The costained puncta are in an amphisome. (C) Costaining of MAP1LC3B with LAMP1. The costained puncta are in an autolysosome. Bar: 10 µm.
Because OSGIN1 can cause mitochondrial damage in some cell types,27,29 it is possible that OSGIN1 might induce mitochondrial specific autophagy, i.e., mitophagy, in human airway epithelial cells. However, the data demonstrated that in OSGIN1-overexpressing cells; colocalization of MAP1LC3B and mitochondrial markers was rarely detectable; and OSGIN1 was not colocalized with mitochondrial markers; there was no clear mitochondrial pattern alternations (Fig. S6A) and expression of mitophagy-related genes were not altered (Fig. S6B).
OSGIN1-induced oxidative stress response
Since oxidative stress can cause irreversible damages to biomolecules (proteins, DNA and lipids) and acts as a major driving force for autophagy induction,43-45 we assessed OSGIN1-mediated upregulation of expression of oxidative stress response genes in lenti-OSGIN1-treated airway basal cells. At the mRNA level, OSGIN1 significantly upregulated expression of multiple oxidative stress genes, including GPX2 (5.9-fold), NQO1 (4.0-fold), MAFG (2.2-fold) and HMOX1 (17.1-fold) (P<0.01, all comparisons, Fig. S7A). The upregulation of NQO1 and HMOX1 were further confirmed by immunofluorescent staining (Fig. S7B). Together, the data suggests that the OSGIN1-induced autophagy is associated with heightened oxidative stress.
Expression of OSGIN1 affected smoking-induced autophagic response
To ask whether OSGIN1 expression can affect smoking-induced autophagic response, OSGIN1 was either overexpressed by lentiviral vector or suppressed by siRNA and then challenged with 4% CSE. Consistently, OSGIN1 overexpression increased SQSTM1 and MAP1LC3B expression at both the mRNA and protein levels. In the context of OSGIN1 overexpression, smoking-induced autophagic response was enhanced as indicated by the synergic upregulation of MAP1LC3B-II and SQSTM1 (Fig. 8A). Interestingly, under normal conditions, OSGIN1 knockdown had no effect on the expression of SQSTM1 and MAP1LC3B. Under smoking-stressed condition, expression of SQSTM1 and MAP1LC3B were enhanced by OSGIN1 knockdown (Fig. 8B). Together, these data suggest that OSGIN1 expression needs to be tightly controlled in the stressed environment.
Figure 8.

Effect of OSGIN1 on smoking-induced autophagy. OSGIN1 was either overexpressed by lentiviral vector or suppressed by siRNA in the primary basal cells and then challenged with 4% cigarette smoke extract (CSE). The changes of autophagy markers MAP1LC3B and SQSTM1 were assessed at both mRNA level by TaqMan PCR and protein level by western blot analysis. (A) Overexpression of OSGIN1 with CSE treatment. Left panel, TaqMan PCR results. The data are normalized to uninfected control. Values are mean ± SD; *, P<0.05; **, P<0.01; ***, P<0.001. Right panel, western blot analysis. Fold changes between lenti-OSGIN1 and lenti-control with CSE treatment from 3 independent experiments are shown (all fold-changes >1). (B) Knockdown of OSGIN1 with CSE treatment. Left panel, TaqMan PCR results. The data are normalized to untransfected control. Values are mean ± SD; *, P<0.05; **, P<0.01. Right panel, western blot analysis. Fold-changes between si-OSGIN1 and si-control with CSE treatment from 3 independent experiments are shown (all fold-changes>1).
Discussion
In the current study, we observed that a novel smoking response gene, OSGIN1, is upregulated in the large and small airway epithelium of healthy smokers. Expression of OSGIN1 correlated with expression of classic autophagy markers, and enhanced-expression of OSGIN1 led to autophagy through coinduction of MAP1LC3B and SQSTM1 in human airway basal/progenitor cells, likely associated with heightened oxidative stress. The upregulation of OSGIN1 is a link between smoking and autophagy in the human airway epithelium.
Smoking and autophagy in the lung
Cigarette smoking is the dominant risk factor for COPD,46-48 and autophagy in the respiratory epithelium has been proposed as one mechanism contributing to the pathogenesis of COPD.7,11 Most studies have been focused on lung epithelial cells, the first cell population to show smoking-induced stress. Deficiency of MAP1LC3B, a key gene in the autophagy pathway, can alleviate smoking-induced airway cilia shortening18 and alveolar cell loss.13 Insufficient autophagy leads to cellular senescence in smoking-stressed airway epithelial cells.15,21 Some genes in COPD lung tissue have been proposed as autophagy regulators in airway epithelial cells, including, EGR1 which upregulates MAP1LC3B expression,12 SIRT1 which might affect MTOR signaling,16 HDAC6 which recognizes and delivers damaged cilia protein to the autophagosome,18 SIRT6 which upregulates MTOR signaling,19 HMOX1 which downregulates the expression of the autophagic regulator BECN117 and PARK2 which mediates mitophagy.21 However, since samples of human lung tissues contain only small portions of the airway epithelium and cell lines were used in most of these studies, the regulators of smoking-induced autophagy in the human airway epithelium remain unclear.
OSGIN1
OSGIN1 has been initially identified as a pregnancy-induced growth inhibitor in the mammary gland.36 Further studies suggest it might be a tumor suppressor gene in kidney, breast and liver cancer.29,37,38 Although how OSGIN1 is suppressed in cancer cells is unclear,49 it has been shown that OSGIN1 can be induced by DNA damage in an osteosarcoma cell line,2728 and by oxidative stress in endothelial cells,5051 and blood cell lines.52,53 Our finding that smoking can induce OSGIN1 is consistent with the knowledge that smoking can induce both DNA damage and oxidative stress in airway epithelial cells.
The known functions of OSGIN1 are mainly related to growth inhibition and cell death induction in cancer cells.27-29,36-38,49 Cell death induction by OSGIN1 has been attributed to mitochondrial damage27-29 and suppression of the antiapoptosis factors BCL2 and BCL2L1/Bcl−xL.38 The effect of OSGIN1 may be cell specific. As an example, OSGIN1 overexpression leads to mitochondrial localization in an osteosarcoma cell line but not in a cervical cancer cell line.28
OSGIN1 as an inducer of autophagy in the airway epithelium in smokers
The functions of OSGIN1 such as growth inhibition and cell death induction often coexist with autophagy.31-33 The coordinated expression pattern of OSGIN1 with autophagy genes in airway epithelial cells supports the concept that OSGIN1 is likely an autophagy regulator. Interestingly, it is mostly transcription factors that induce autophagy directly, for example, TFEB, TFE3, MITF and FOXO3.54-57 In contrast to the global upregulation of autophagy genes by these transcription factors, OSGIN1 upregulated only a few autophagy-related genes, e.g., MAP1LC3B and SQSTM1, 2 of the core genes in the autophagy pathway.39,41,42 Besides mRNA expression level changes, post-translational level modifications of autophagic proteins were also activated by OSGIN1, as evidenced by the enhanced distribution of MAP1LC3B from autophagosome to autolysosome. It is interesting that although OSGIN1 can enhance autophagic flux, suppression of OSGIN1 expression did not influence the autophagic flux under normal conditions. Instead, with cigarette smoking-induced stress, both upregulation and downregulation of OSGIN1 can affect autophagic response evoked by smoking, which suggests that expression of OSGIN1 needs to be tightly controlled in the airway epithelium. These complicated regulations have been associated with several autophagy-related genes in the literature. For example, nuclei or cytoplasm-located TP53 has different effect on autophagy58 and HMOX1 can either suppress or induce autophagy.17,59 Interestingly, TP53 is one binding partner of OSGIN127 and HMOX1 is an OSGIN1-regulated gene.51 In addition, OSGIN1 downstream genes KLF4,51 ATF4,51 BCL2,38 and binding partner CAPN360,61 are all involved in autophagy regulation through different mechanisms.
Although the autophagy induction by OSGIN1 theoretically could result from the enrichment of OSGIN1 in the mitochondria, we were not able to see colocalization of OSGIN1 with mitochondrial markers in the airway epithelial cells. Instead, we observed increased oxidative stress response in OSGIN1-overexpressing cells. Increased oxidative stress causes damage to intracellular macromolecules and organelles, leading to autophagy activation.43-45 Since OSGIN1 itself is an oxidative stress response gene, these observations suggest that upregulation of OSGIN1 plays a role in smoking-induced stress, which eventually triggers autophagy in the airway epithelium.
Materials and methods
Brushed human airway epithelium
Healthy nonsmokers and healthy smokers were recruited using local print media. Individuals with COPD (all current smokers) were recruited in the same way and also from the outpatient clinics of the Division of Pulmonary and Critical Care Medicine. The study population was evaluated at the Department of Genetic Medicine Clinical Research Facility under the auspices of the Weill Cornell NIH Clinical and Translational Science Center with approval by the Weill Cornell Medical College Institutional Review Board. Written informed consent was obtained from each volunteer before enrollment in the study. Individuals were determined to be phenotypically normal on the basis of clinical history and physical examination, routine blood screening tests, urinalysis, chest X-ray, ECG and pulmonary function testing. Current smoking status was confirmed by history, venous carboxyhemoglobin levels and urinalysis for levels of nicotine and its derivative cotinine. Smoking history and urine nicotine and cotinine level are summarized in Table S2. Smokers were asked not to smoke for at least 12 h before bronchoscopy. See Supplemental Methods for inclusion and exclusion criteria.
Large airway epithelium (LAE, 3rd-4th order bronchi; 21 healthy nonsmokers, 31 healthy smokers, assessed by microarray)62 and small airway epithelium (SAE, 10th to 12th order bronchi; cohort I, for microarray, 62 healthy nonsmokers, 72 healthy smokers and 36 COPD smokers;63 cohort II, for microarray, 14 healthy nonsmokers (2 subjects which are repeated in cohort I were excluded), 20 healthy smokers.34 Small sample set, for RNA-Seq, 5 healthy nonsmokers, 6 healthy smokers64 were collected via flexible bronchoscopy as described previously.34,62-65 Primary airway basal stem/progenitor cells (for RNA-Seq) were isolated from the LAE of 17 healthy individuals as described previously (n = 10 healthy nonsmokers and 7 healthy smokers).35 Following RNA extraction and sample quality assessment, genome-wide expression assessment was performed using microarray (Affymetrix Human Genome U133 Plus 2.0 arrays, Santa Clara CA) or RNA-Seq (Illumina flow cells, San Diego, CA) as detailed in Supplemental Methods. These studies have been published34,35,62-65 and raw data has been deposited in the Gene Expression Omnibus (GEO) site (GSE76327) and the Short Read Archive (SRA) section of the NCBI SRA database (SRA accession #SRP005411). See Supplemental Methods for more details.
Real-time PCR
For confirmation of the microarray data, total RNA (LAE, 12 nonsmokers and 14 smokers; SAE, 14 nonsmokers and 18 smokers) was extracted and cDNA was synthesized using TaqMan Reverse Transcriptase Reaction kit (Thermo Fisher Scientific, N8080234). All reactions were run on an Applied Biosystems Sequence Detection System 7500 (CA, USA) and relative expression levels determined using the △Ct method with 18S rRNA (RNA18S/18S) as the endogenous control. Premade TaqMan Gene Expression Assays from Applied Biosystems are listed in Table S3.
Lentivirus upregulation and siRNA downregulation
Lenti-OSGIN1 and lenti-GFP (as control) expressing plasmids were produced using the Precision LentiORF lentiviral vector backbone (GE Dharmacon, OHS5833; see Fig. S1 for a schematic of the open reading frame of the plasmids). The replication-deficient lentiviruses were generated in 293A cells using compatible packaging vectors. All viruses generated were pseudotyped with the VSV-G envelope and concentrated with PEG-it™ Virus Precipitation Solution (System Biosciences, LV810A) using the manufacturer's protocol. The infectious titer of each virus was determined via Lenti-X™ qRT-PCR Titration Kit (Clontech, 631235). For infection of the airway basal cells, recombinant lentiviruses at an equal multiplicity of infection (MOI) were added with 6 µg/ml of polybrene (Sigma-Aldrich, H9268) to aid viral infection. As part of quality control, to compare the transduction efficiency of different lentiviral vectors in basal cells, TaqMan PCR was used to assess the common lentiviral component woodchuck hepatitis post-transcriptional regulatory element at the mRNA level.66
The siRNA reagents were all purchased from Thermo Scientific. Silencer® Select siRNAs for OSGIN1 (s195180) and negative control (4390843) were used. Lipofectamine® RNAiMAX Transfection Reagent (13778030) was used to deliver the siRNA into the cells.
In vitro studies with primary human airway basal/progenitor cells
Normal human basal cells obtained from Lonza (CC-2540, Lots 310206, 314700 and 247681) were used for in vitro studies. The cells were cultured in bronchial epithelium basal medium (Lonza, CC-3171, CC-4175) containing gentamycin (50 μg/ml; Sigma-Aldrich, G1397), amphotericin B (1.25 μg/ml; Thermo Scientific, 15290018), and penicillin-streptomycin (50 μg/ml; Thermo Scientific, 15140122).
Cigarette smoke extract was made from one brand of commercial cigarette bubbled through 12.5 ml of bronchial epithelium basal medium that was then filtered through a 0.2-mm pore filter.67,68 To ensure standardization between experiments and batches of CSE, the absorbance was measured at 320 nm on a spectrophotometer and the optical density of 1 was defined as 100%. CSE was frozen in single use aliquots at −20°C. Based on the literature, 1% CSE is equal to 5 cigarettes/d, 3% to 15 cigarettes/d, 6% to 30 cigarettes/d and 10% is equal to 50 cigarettes/d which corresponds to human daily exposure to cigarette smoke.69,70 The cytotoxicity of CSE on primary basal cells was measured by Cytotoxicity Detection Kit (LDH; Roche Life Science, 11644793001).
Autophagic flux was assessed by western blot analysis.12,15,17,21 BafA1 (StressMarq, SKC-135) was used (100 nM, 2 h) to block the late-stage autophagic flux. The western analysis band intensity of autophagy markers SQSTM1/p62 and MAP1LC3B/LC3B were compared between samples treated with or without BafA1. For experiments with OSGIN1 overexpression, BafA1 was added after 4 d lentivirus infection. For OSGIN1 knockdown experiments, BafA1 was added 1 d after siRNA transfection.
CSE challenge study (4% CSE, 12 h) was performed after either OSGIN1 overexpression or knockdown. For the OSGIN1 overexpression experiments, CSE was added 4 d after lentivirus infection. For OSGIN1 knockdown experiments, CSE was treated 2 d after siRNA transfection.
Airway basal cells were cultured on Lab-Tek chamber slides (Thermo Scientific, 154453) for immunofluorescence and immunohistochemical staining. The following primary antibodies were used: rabbit anti-human MAP1LC3B (1:200 for immunofluorescence, 1:800 for immunohistochemistry; Cell Signaling Technology, 3868); mouse anti-human LAMP1 (1:100; R&D Systems, MAB4800); mouse Anti-SQSTM1 (1:2000; BD Biosciences, 610833); mouse anti-human OSGIN1 (1:100; Sigma-Aldrich, SAB1407392), mouse anti-CD63 (1:100; Santa Cruz Biotechnology, sc-5275), mouse anti-NQO1 (1:200; Abcam, ab28947), mouse anti-HMOX1 (1:100; Thermo Scientific, MA1–112). For immunofluorescence staining, Alexa Fluor-labeled secondary antibodies (Alexa Fluor 488, 555, 647; Thermo Scientific, A11029, A21424, A21236, A11034, A21429, A21245) were used to visualize the signal. The cells were counterstained with DAPI to identify cell nuclei. For mitochondrial pattern assessment, MitoTracker® Red CMXRos (Thermo Scientific, M7512) was used. The images were captured with a Zeiss Axiovert 200M microscope (Zeiss USA, Thornwood, NY, USA) using false coloring. For quantification by fluorescence staining, 6 random fields under 20x objective lens were imaged and the percentage of LC3B-positive cells were counted. For immunohistochemistry staining, Vectastain Elite ABC kit (Vector Laboratories, PK-6100) and AEC substrate kit (Dako, K3464) were used to visualize antibody binding. The slides were counterstained with Mayer's hematoxylin (Poly Scientific R&D Corp, S216). Images were acquired using a Nikon Microphot microscope (Nikon Instruments, Melville, NY, USA) with an Olympus DP70 CCD camera (Olympus, PA, USA). For quantification by immunohistochemistry staining, 8 random fields under 10x objective lens were imaged and the percentage of LC3B-positive cells were counted.
For western blot analysis, protein was extracted by radioimmunoprecipitation lysis (RIPA) buffer (Sigma-Aldrich, R0278) containing Halt Phosphatase Inhibitor cocktail (Thermo Fisher Scientific, 78420). Protein concentration was measured with a BCA Protein Assay Kit (Thermo Fisher Scientific, 23225). NuPAGE® SDS PAGE Gel System (Thermo Fisher Scientific) was used for electrophoresis and western transfer, using 4 to 12% Bis-Tris gradient gel and PVDF membrane. The membranes were blocked and incubated with specific antibodies overnight at 4°C, washed 3 times for 5 min each with PBST (Thermo Scientific, 10010023; with 0.1% Tween 20; Bio-Rad, 161–0781) and incubated with an anti-rabbit or anti-mouse antibody conjugated to horseradish peroxidase (GE Healthcare Biosciences, NA9340 or NA9310). The membranes were washed again 3 times for 5 min with PBST, and antibodies were visualized after the addition of SuperSignal West Femto Maximum Sensitivity Substrate (Thermo Fisher Scientific, 34095) and exposure to X-ray film. The primary antibodies used for the western analysis included: rabbit monoclonal anti-MAP1LC3B (1:1000; Cell Signaling Technology, 3868), mouse anti-SQSTM1 (1:2000; BD Biosciences, 610833), mouse anti-OSGIN1 (1:500; Sigma-Aldrich, SAB1407392) and mouse anti-ACTB/β actin (1:5000; Sigma-Aldrich, A2228). To quantify the western results, the films were scanned and analyzed with ImageJ software (http://imagej.nih.gov/ij/). ACTB staining was used for normalization.
IHC staining on airway biopsy
The airway biopsies were processed with a standard method (deparaffinization, antigen retrieval and inactivation of endogenous peroxidase),67 stained with Avidin-Biotin Complex and detected by AEC Substrate-Chromogen as described above. Commercial human liver tissue (US Biomax, HuFPT074) was used as positive control. Mouse anti-OSGIN1 (1:300; Sigma-Aldrich, SAB1407392) was used with mouse IgG (Sigma-Aldrich, I8765) as a negative control.
Statistical analyses
The details of microarray and RNA-Seq data analysis have been reported elsewhere.34,62-65 The 2-tailed Student t test was used to compare OSGIN1 expression in the brushed airway epithelium. In the small airway microarray cohort I, 170 subjects were grouped as high OSGIN1 expressors (> 3rd quartile, n = 43) and low OSGIN1 expressors (< 1st quartile, n = 43). This data set was assessed for expression of 99 autophagy genes shared by 2 online autophagy gene databases (http://www.tanpaku.org/autophagy/; http://autophagy.lu/; data freezed in June–2016; for genes with multiple Affymetrix probesets, the probeset with highest mean expression level among all subjects was used; Table S1). The analysis was performed by comparing high and low OSGIN1 expressor groups using 2-tailed Student t test with P value correction. Hierarchical clustering and heat map plotting were based on the differentially expressed autophagy genes. Genome-wide correlation analysis for OSGIN1 in airway basal cells was performed in Partek Genomics Suite 6.6 (St. Louis, MO, USA), using the Spearman's rank correlation coefficient. The P values were corrected by the step-up method [Benjamini-Hochberg correction71] in the Partek Genomics Suite. Pathway analysis was performed in DAVID Bioinformatics Resources 6.7. The 2-tailed Student t test was used for TaqMan PCR analysis. The Mann-Whitney U test was used for comparison of the percentage of positively stained cells. In all analyses, a P value less than P<0.05 was deemed significant.
Supplementary Material
Abbreviations
- ACTB
actin β
- ATF4
activating transcription factor 4
- ATG13
autophagy-related 13
- ATG4B
autophagy related 4B cysteine peptidase
- ATG4C
autophagy-related 4C cysteine peptidase
- ATG9A
autophagy-related 9A
- ATP2B1
ATPase plasma membrane Ca2+ transporting 1
- ATG101/C12ORF44
autophagy-related 101
- BCL2
BCL2, apoptosis regulator
- BCL2L1/BCL−XL
BCL2 like 1
- BECN1
Beclin 1
- CALCOCO2
calcium binding and coiled-coil domain 2
- CAPN3
calpain 3
- CD63
CD63 molecule
- CDKN2A/ARF
cyclin dependent kinase inhibitor 2A
- COPD
chronic obstructive pulmonary disease
- CSE
cigarette smoke extract
- CYP1A1
cytochrome P450 family 1 subfamily A member 1
- DRAM1
DNA damage regulated autophagy modulator 1
- EGR1
early growth response 1
- FOXO3
forkhead box O3
- GABARAPL1
GABA type A receptor associated protein like 1
- GFP
green fluorescent protein
- GPX2glutathione peroxidase 2
glutathione peroxidase 2HDAC6, histone deacetylase 6
- HMOX1/HO-1
heme oxygenase 1
- KLF4
Kruppel like factor 4
- LAMP1
lysosomal associated membrane protein 1
- LAMP3
lysosomal associated membrane protein 3
- MAFG
MAF bZIP transcription factor G
- MAP1LC3B/LC3B
microtubule associated protein 1 light chain 3 β
- MAPK1
mitogen-activated protein kinase 1
- MITF
melanogenesis associated transcription factor
- NQO1
NAD(P)H quinone dehydrogenase 1
- OSGIN1
oxidative stress-induced growth inhibitor
- PARK2
parkin RBR E3 ubiquitin protein ligase
- RB1CC1
RB1 inducible coiled-coil 1
- SIRT1
sirtuin 1
- SQSTM1/P62
sequestosome 1
- TFE3
transcription factor binding to IGHM enhancer 3
- TM9SF1
transmembrane 9 superfamily member 1
- ULK1
unc-51 like autophagy activating kinase 1
- ULK2
unc-51 like autophagy activating kinase 2
- ULK3
unc-51 like kinase 3
- WIPI1
WD repeat domain, phosphoinositide interacting 1
Disclosure of potential conflicts of interest
No potential conflicts of interest were disclosed.
Acknowledgments
We thank N. Mohamed for help with manuscript preparation.
Funding
This study was supported in part by R01HL107882, and R01HL118541. GW was supported, in part, by T32HL094284. Research reported in this publication was supported by NIH and the Family Smoking Prevention and Tobacco Control Act. The content is solely the responsibility of the authors and does not necessarily represent the official views of the NIH nor the U.S. Food and Drug Administration.
References
- [1].Auerbach O, Stout AP, Hammond EC, Garfinkel L. Changes in bronchial epithelium in relation to cigarette smoking and in relation to lung cancer. N Engl J Med 1961; 265:253-67; PMID:13685078; https://doi.org/ 10.1056/NEJM196108102650601 [DOI] [PubMed] [Google Scholar]
- [2].Auerbach O, Hammond EC, Garfinkel L. Changes in bronchial epithelium in relation to cigarette smoking, 1955-1960 vs. 1970-1977. N Engl J Med 1979; 300:381-5; PMID:759914; https://doi.org/ 10.1056/NEJM197902223000801 [DOI] [PubMed] [Google Scholar]
- [3].MacNee W. Oxidative stress and lung inflammation in airways disease. Eur J Pharmacol 2001; 429:195-207; PMID:11698041; https://doi.org/ 10.1016/S0014-2999(01)01320-6 [DOI] [PubMed] [Google Scholar]
- [4].Saetta M, Finkelstein R, Cosio MG. Morphological and cellular basis for airflow limitation in smokers. Eur Respir J 1994; 7:1505-15; PMID:7957838; https://doi.org/ 10.1183/09031936.94.07081505 [DOI] [PubMed] [Google Scholar]
- [5].Yoshida T Tuder RM. Pathobiology of cigarette smoke-induced chronic obstructive pulmonary disease. Physiol Rev 2007; 87:1047-82; PMID:17615396; https://doi.org/ 10.1152/physrev.00048.2006 [DOI] [PubMed] [Google Scholar]
- [6].Choi AM, Ryter SW, Levine B. Autophagy in human health and disease. N Engl J Med 2013; 368:651-62; PMID:23406030; https://doi.org/ 10.1056/NEJMra1205406 [DOI] [PubMed] [Google Scholar]
- [7].Haspel JA, Choi AM. Autophagy: a core cellular process with emerging links to pulmonary disease. Am J Respir Crit Care Med 2011; 184:1237-46; PMID:21836133; https://doi.org/ 10.1164/rccm.201106-0966CI [DOI] [PMC free article] [PubMed] [Google Scholar]
- [8].Klionsky DJ, Emr SD. Autophagy as a regulated pathway of cellular degradation. Science 2000; 290:1717-21; PMID:11099404; https://doi.org/ 10.1126/science.290.5497.1717 [DOI] [PMC free article] [PubMed] [Google Scholar]
- [9].Levine B, Kroemer G. Autophagy in the pathogenesis of disease. Cell 2008; 132:27-42; PMID:18191218; https://doi.org/ 10.1016/j.cell.2007.12.018 [DOI] [PMC free article] [PubMed] [Google Scholar]
- [10].Mizushima N, Levine B, Cuervo AM, Klionsky DJ. Autophagy fights disease through cellular self-digestion. Nature 2008; 451:1069-75; PMID:18305538; https://doi.org/ 10.1038/nature06639 [DOI] [PMC free article] [PubMed] [Google Scholar]
- [11].Ryter SW, Lee SJ, Choi AM. Autophagy in cigarette smoke-induced chronic obstructive pulmonary disease. Expert Rev Respir Med 2010; 4:573-84; PMID:20923337; https://doi.org/ 10.1586/ers.10.61 [DOI] [PMC free article] [PubMed] [Google Scholar]
- [12].Chen ZH, Kim HP, Sciurba FC, Lee SJ, Feghali-Bostwick C, Stolz DB, Dhir R, Landreneau RJ, Schuchert MJ, Yousem SA, Nakahira K, Pilewski JM, et al.. Egr-1 regulates autophagy in cigarette smoke-induced chronic obstructive pulmonary disease. PLoS One 2008; 3:e3316; PMID:18830406; https://doi.org/ 10.1371/journal.pone.0003316 [DOI] [PMC free article] [PubMed] [Google Scholar]
- [13].Chen ZH, Lam HC, Jin Y, Kim HP, Cao J, Lee SJ, Ifedigbo E, Parameswaran H, Ryter SW, Choi AM. Autophagy protein microtubule-associated protein 1 light chain-3B (LC3B) activates extrinsic apoptosis during cigarette smoke-induced emphysema. Proc Natl Acad Sci U S A 2010; 107:18880-5; PMID:20956295; https://doi.org/ 10.1073/pnas.1005574107 [DOI] [PMC free article] [PubMed] [Google Scholar]
- [14].An CH, Wang XM, Lam HC, Ifedigbo E, Washko GR, Ryter SW, Choi AM. TLR4 deficiency promotes autophagy during cigarette smoke-induced pulmonary emphysema. Am J Physiol Lung Cell Mol Physiol 2012; 303:L748-57; PMID:22983353; https://doi.org/ 10.1152/ajplung.00102.2012 [DOI] [PMC free article] [PubMed] [Google Scholar]
- [15].Fujii S, Hara H, Araya J, Takasaka N, Kojima J, Ito S, Minagawa S, Yumino Y, Ishikawa T, Numata T, et al.. Insufficient autophagy promotes bronchial epithelial cell senescence in chronic obstructive pulmonary disease. Oncoimmunology 2012; 1:630-41; PMID:22934255; https://doi.org/ 10.4161/onci.20297 [DOI] [PMC free article] [PubMed] [Google Scholar]
- [16].Hwang JW, Chung S, Sundar IK, Yao H, Arunachalam G, McBurney MW, Rahman I. Cigarette smoke-induced autophagy is regulated by SIRT1-PARP-1-dependent mechanism: implication in pathogenesis of COPD. Arch Biochem Biophys 2010; 500:203-9; PMID:20493163; https://doi.org/ 10.1016/j.abb.2010.05.013 [DOI] [PMC free article] [PubMed] [Google Scholar]
- [17].Kim HP, Wang X, Chen ZH, Lee SJ, Huang MH, Wang Y, Ryter SW, Choi AM. Autophagic proteins regulate cigarette smoke-induced apoptosis: protective role of heme oxygenase-1. Autophagy 2008; 4:887-95; PMID:18769149; https://doi.org/ 10.4161/auto.6767 [DOI] [PubMed] [Google Scholar]
- [18].Lam HC, Cloonan SM, Bhashyam AR, Haspel JA, Singh A, Sathirapongsasuti JF, Cervo M, Yao H, Chung AL, Mizumura K, An CH, Shan B, Franks JM, Haley KJ, Owen CA, Tesfaigzi Y, Washko GR, Quackenbush J, Silverman EK, Rahman I, Kim HP, Mahmood A, Biswal SS, Ryter SW, Choi AM. Histone deacetylase 6-mediated selective autophagy regulates COPD-associated cilia dysfunction. J Clin Invest 2013; 123:5212-30; PMID:24200693; https://doi.org/ 10.1172/JCI69636 [DOI] [PMC free article] [PubMed] [Google Scholar]
- [19].Takasaka N, Araya J, Hara H, Ito S, Kobayashi K, Kurita Y, Wakui H, Yoshii Y, Yumino Y, Fujii S, et al.. Autophagy induction by SIRT6 through attenuation of insulin-like growth factor signaling is involved in the regulation of human bronchial epithelial cell senescence. J Immunol 2014; 192:958-68; PMID:24367027; https://doi.org/ 10.4049/jimmunol.1302341 [DOI] [PubMed] [Google Scholar]
- [20].Dickinson JD, Alevy Y, Malvin NP, Patel KK, Gunsten SP, Holtzman MJ, Stappenbeck TS, Brody SL. IL13 activates autophagy to regulate secretion in airway epithelial cells. Autophagy 2015; 12(2):397-409 [DOI] [PMC free article] [PubMed] [Google Scholar]
- [21].Ito S, Araya J, Kurita Y, Kobayashi K, Takasaka N, Yoshida M, Hara H, Minagawa S, Wakui H, Fujii S, et al.. PARK2-mediated mitophagy is involved in regulation of HBEC senescence in COPD pathogenesis. Autophagy 2015; 11:547-59; PMID:25714760; https://doi.org/ 10.1080/15548627.2015.1017190 [DOI] [PMC free article] [PubMed] [Google Scholar]
- [22].Tran I, Ji C, Ni I, Min T, Tang D, Vij N. Role of Cigarette Smoke-Induced Aggresome Formation in Chronic Obstructive Pulmonary Disease-Emphysema Pathogenesis. Am J Respir Cell Mol Biol 2015; 53:159-73; PMID:25490051; https://doi.org/ 10.1165/rcmb.2014-0107OC [DOI] [PMC free article] [PubMed] [Google Scholar]
- [23].Rao S, Tortola L, Perlot T, Wirnsberger G, Novatchkova M, Nitsch R, Sykacek P, Frank L, Schramek D, Komnenovic V, et al.. A dual role for autophagy in a murine model of lung cancer. Nat Commun 2014; 5:3056; PMID:24445999; https://doi.org/ 10.1038/ncomms4056 [DOI] [PubMed] [Google Scholar]
- [24].Poon A, Eidelman D, Laprise C, Hamid Q. ATG5, autophagy and lung function in asthma. Autophagy 2012; 8:694-5; PMID:22498476; https://doi.org/ 10.4161/auto.19315 [DOI] [PubMed] [Google Scholar]
- [25].Hogg JC, Chu F, Utokaparch S, Woods R, Elliott WM, Buzatu L, Cherniack RM, Rogers RM, Sciurba FC, Coxson HO, et al.. The nature of small-airway obstruction in chronic obstructive pulmonary disease. N Engl J Med 2004; 350:2645-53; PMID:15215480; https://doi.org/ 10.1056/NEJMoa032158 [DOI] [PubMed] [Google Scholar]
- [26].McDonough JE, Yuan R, Suzuki M, Seyednejad N, Elliott WM, Sanchez PG, Wright AC, Gefter WB, Litzky L, Coxson HO, et al.. Small-airway obstruction and emphysema in chronic obstructive pulmonary disease. N Engl J Med 2011; 365:1567-75; PMID:22029978; https://doi.org/ 10.1056/NEJMoa1106955 [DOI] [PMC free article] [PubMed] [Google Scholar]
- [27].Hu J, Yao H, Gan F, Tokarski A, Wang Y. Interaction of OKL38 and p53 in regulating mitochondrial structure and function. PLoS One 2012; 7:e43362; PMID:22912861; https://doi.org/ 10.1371/journal.pone.0043362 [DOI] [PMC free article] [PubMed] [Google Scholar]
- [28].Yao H, Li P, Venters BJ, Zheng S, Thompson PR, Pugh BF, Wang Y. Histone Arg modifications and p53 regulate the expression of OKL38, a mediator of apoptosis. J Biol Chem 2008; 283:20060-20068; PMID:18499678; https://doi.org/ 10.1074/jbc.M802940200 [DOI] [PMC free article] [PubMed] [Google Scholar]
- [29].Liu M, Li Y, Chen L, Chan TH, Song Y, Fu L, Zeng TT, Dai YD, Zhu YH, Li Y, et al.. Allele-specific imbalance of oxidative stress-induced growth inhibitor 1 associates with progression of hepatocellular carcinoma. Gastroenterology 2014; 146:1084-96; PMID:24417816; https://doi.org/ 10.1053/j.gastro.2013.12.041 [DOI] [PubMed] [Google Scholar]
- [30].Galluzzi L, Morselli E, Kepp O, Vitale I, Pinti M, Kroemer G. Mitochondrial liaisons of p53. Antioxid Redox Signal 2011; 15:1691-714; PMID:20712408; https://doi.org/ 10.1089/ars.2010.3504 [DOI] [PubMed] [Google Scholar]
- [31].Maiuri MC, Zalckvar E, Kimchi A, Kroemer G. Self-eating and self-killing: crosstalk between autophagy and apoptosis. Nat Rev Mol Cell Biol 2007; 8:741-52; PMID:17717517; https://doi.org/ 10.1038/nrm2239 [DOI] [PubMed] [Google Scholar]
- [32].Wang RC, Levine B. Autophagy in cellular growth control. FEBS Lett 2010; 584:1417-26; PMID:20096689; https://doi.org/ 10.1016/j.febslet.2010.01.009 [DOI] [PMC free article] [PubMed] [Google Scholar]
- [33].Neufeld TP. Autophagy and cell growth–the yin and yang of nutrient responses. J Cell Sci 2012; 125:2359-68; PMID:22649254; https://doi.org/ 10.1242/jcs.103333 [DOI] [PMC free article] [PubMed] [Google Scholar]
- [34].Buro-Auriemma LJ, Salit J, Hackett NR, Walters MS, Strulovici-Barel Y, Staudt MR, Fuller J, Mahmoud M, Stevenson CS, Hilton H, et al.. Cigarette smoking induces small airway epithelial epigenetic changes with corresponding modulation of gene expression. Hum Mol Genet 2013; 22:4726-38; PMID:23842454; https://doi.org/ 10.1093/hmg/ddt326 [DOI] [PMC free article] [PubMed] [Google Scholar]
- [35].Ryan DM, Vincent TL, Salit J, Walters MS, gosto-Perez F, Shaykhiev R, Strulovici-Barel Y, Downey RJ, Buro-Auriemma LJ, Staudt MR, et al.. Smoking dysregulates the human airway basal cell transcriptome at COPD risk locus 19q13.2. PLoS One 2014; 9:e88051; PMID:24498427; https://doi.org/ 10.1371/journal.pone.0088051 [DOI] [PMC free article] [PubMed] [Google Scholar]
- [36].Huynh H, Ng CY, Ong CK, Lim KB, Chan TW. Cloning and characterization of a novel pregnancy-induced growth inhibitor in mammary gland. Endocrinology 2001; 142:3607-15; PMID:11459809; https://doi.org/ 10.1210/endo.142.8.8297 [DOI] [PubMed] [Google Scholar]
- [37].Ong CK, Ng CY, Leong C, Ng CP, Foo KT, Tan PH, Huynh H. Genomic structure of human OKL38 gene and its differential expression in kidney carcinogenesis. J Biol Chem 2004; 279:743-54; PMID:14570898; https://doi.org/ 10.1074/jbc.M308668200 [DOI] [PubMed] [Google Scholar]
- [38].Wang T, Xia D, Li N, Wang C, Chen T, Wan T, Chen G, Cao X. Bone marrow stromal cell-derived growth inhibitor inhibits growth and migration of breast cancer cells via induction of cell cycle arrest and apoptosis. J Biol Chem 2005; 280:4374-82; PMID:15569677; https://doi.org/ 10.1074/jbc.M408708200 [DOI] [PubMed] [Google Scholar]
- [39].Klionsky DJ, Abdalla FC, Abeliovich H, Abraham RT, cevedo-Arozena A, Adeli K, Agholme L, Agnello M, Agostinis P, guirre-Ghiso JA, et al.. Guidelines for the use and interpretation of assays for monitoring autophagy. Autophagy 2012; 8:445-544; PMID:22966490; https://doi.org/ 10.4161/auto.19496 [DOI] [PMC free article] [PubMed] [Google Scholar]
- [40].Mizushima N Yoshimori T. How to interpret LC3 immunoblotting. Autophagy 2007; 3:542-5; PMID:17611390; https://doi.org/ 10.4161/auto.4600 [DOI] [PubMed] [Google Scholar]
- [41].He C, Klionsky DJ. Regulation mechanisms and signaling pathways of autophagy. Annu Rev Genet 2009; 43:67-93; PMID:19653858; https://doi.org/ 10.1146/annurev-genet-102808-114910 [DOI] [PMC free article] [PubMed] [Google Scholar]
- [42].Johansen T, Lamark T. Selective autophagy mediated by autophagic adapter proteins. Autophagy 2011; 7:279-96; PMID:21189453; https://doi.org/ 10.4161/auto.7.3.14487 [DOI] [PMC free article] [PubMed] [Google Scholar]
- [43].Moore MN. Autophagy as a second level protective process in conferring resistance to environmentally-induced oxidative stress. Autophagy 2008; 4:254-6; PMID:18196967; https://doi.org/ 10.4161/auto.5528 [DOI] [PubMed] [Google Scholar]
- [44].Lee J, Giordano S, Zhang J. Autophagy, mitochondria and oxidative stress: cross-talk and redox signalling. Biochem J 2012; 441:523-40; PMID:22187934; https://doi.org/ 10.1042/BJ20111451 [DOI] [PMC free article] [PubMed] [Google Scholar]
- [45].Filomeni G, De ZD, Cecconi F. Oxidative stress and autophagy: the clash between damage and metabolic needs. Cell Death Differ 2015; 22:377-88; PMID:25257172; https://doi.org/ 10.1038/cdd.2014.150 [DOI] [PMC free article] [PubMed] [Google Scholar]
- [46].Fletcher C Peto R. The natural history of chronic airflow obstruction. Br Med J 1977; 1:1645-8; PMID:871704; https://doi.org/ 10.1136/bmj.1.6077.1645 [DOI] [PMC free article] [PubMed] [Google Scholar]
- [47].Sethi JM Rochester CL. Smoking and chronic obstructive pulmonary disease. Clin Chest Med 2000; 21:67-86, viii; PMID:10763090; https://doi.org/ 10.1016/S0272-5231(05)70008-3 [DOI] [PubMed] [Google Scholar]
- [48].Eisner MD, Anthonisen N, Coultas D, Kuenzli N, Perez-Padilla R, Postma D, Romieu I, Silverman EK, Balmes JR. An official American Thoracic Society public policy statement: Novel risk factors and the global burden of chronic obstructive pulmonary disease. Am J Respir Crit Care Med 2010; 182:693-718; PMID:20802169; https://doi.org/ 10.1164/rccm.200811-1757ST [DOI] [PubMed] [Google Scholar]
- [49].Ong CK, Leong C, Tan PH, Van T, Huynh H. The role of 5′ untranslated region in translational suppression of OKL38 mRNA in hepatocellular carcinoma. Oncogene 2007; 26:1155-1165; PMID:16924236; https://doi.org/ 10.1038/sj.onc.1209896 [DOI] [PubMed] [Google Scholar]
- [50].Li R, Chen W, Yanes R, Lee S, Berliner JA. OKL38 is an oxidative stress response gene stimulated by oxidized phospholipids. J Lipid Res 2007; 48:709-15; PMID:17192422; https://doi.org/ 10.1194/jlr.M600501-JLR200 [DOI] [PubMed] [Google Scholar]
- [51].Romanoski CE, Che N, Yin F, Mai N, Pouldar D, Civelek M, Pan C, Lee S, Vakili L, Yang WP, et al.. Network for activation of human endothelial cells by oxidized phospholipids: a critical role of heme oxygenase 1. Circ Res 2011; 109:e27-e41; PMID:21737788; https://doi.org/ 10.1161/CIRCRESAHA.111.241869 [DOI] [PMC free article] [PubMed] [Google Scholar]
- [52].Hammad SM, Twal WO, Barth JL, Smith KJ, Saad AF, Virella G, Argraves WS, Lopes-Virella MF. Oxidized LDL immune complexes and oxidized LDL differentially affect the expression of genes involved with inflammation and survival in human U937 monocytic cells. Atherosclerosis 2009; 202:394-404; PMID:18597759; https://doi.org/ 10.1016/j.atherosclerosis.2008.05.032 [DOI] [PMC free article] [PubMed] [Google Scholar]
- [53].Chorley BN, Campbell MR, Wang X, Karaca M, Sambandan D, Bangura F, Xue P, Pi J, Kleeberger SR, Bell DA. Identification of novel NRF2-regulated genes by ChIP-Seq: influence on retinoid X receptor alpha. Nucleic Acids Res 2012; 40:7416-29; PMID:22581777; https://doi.org/ 10.1093/nar/gks409 [DOI] [PMC free article] [PubMed] [Google Scholar]
- [54].Martina JA, Diab HI, Lishu L, Jeong A, Patange S, Raben N, Puertollano R. The nutrient-responsive transcription factor TFE3 promotes autophagy, lysosomal biogenesis, and clearance of cellular debris. Sci Signal 2014; 7:ra9; PMID:24448649; https://doi.org/ 10.1126/scisignal.2004754 [DOI] [PMC free article] [PubMed] [Google Scholar]
- [55].Perera RM, Stoykova S, Nicolay BN, Ross KN, Fitamant J, Boukhali M, Lengrand J, Deshpande V, Selig MK, Ferrone CR, et al.. Transcriptional control of autophagy-lysosome function drives pancreatic cancer metabolism. Nature 2015; 524:361-5; PMID:26168401; https://doi.org/ 10.1038/nature14587 [DOI] [PMC free article] [PubMed] [Google Scholar]
- [56].Settembre C Ballabio A. TFEB regulates autophagy: an integrated coordination of cellular degradation and recycling processes. Autophagy 2011; 7:1379-81; PMID:21785263; https://doi.org/ 10.4161/auto.7.11.17166 [DOI] [PubMed] [Google Scholar]
- [57].Warr MR, Binnewies M, Flach J, Reynaud D, Garg T, Malhotra R, Debnath J, Passegue E. FOXO3A directs a protective autophagy program in haematopoietic stem cells. Nature 2013; 494:323-7; PMID:23389440; https://doi.org/ 10.1038/nature11895 [DOI] [PMC free article] [PubMed] [Google Scholar]
- [58].Levine B Abrams J. p53: The Janus of autophagy? Nat Cell Biol 2008; 10:637-9; PMID:18521069; https://doi.org/ 10.1038/ncb0608-637 [DOI] [PMC free article] [PubMed] [Google Scholar]
- [59].Surolia R, Karki S, Kim H, Yu Z, Kulkarni T, Mirov SB, Carter AB, Rowe SM, Matalon S, Thannickal VJ, et al.. Heme oxygenase-1-mediated autophagy protects against pulmonary endothelial cell death and development of emphysema in cadmium-treated mice. Am J Physiol Lung Cell Mol Physiol 2015; 309:L280-92; PMID:26071551; https://doi.org/ 10.1152/ajplung.00097.2015 [DOI] [PMC free article] [PubMed] [Google Scholar]
- [60].Fanin M, Nascimbeni AC, Angelini C. Muscle atrophy in Limb Girdle Muscular Dystrophy 2A: a morphometric and molecular study. Neuropathol Appl Neurobiol 2013; 39:762-71; PMID:23414389; https://doi.org/ 10.1111/nan.12034 [DOI] [PubMed] [Google Scholar]
- [61].Rolland T, Tasan M, Charloteaux B, Pevzner SJ, Zhong Q, Sahni N, Yi S, Lemmens I, Fontanillo C, Mosca R, et al.. A proteome-scale map of the human interactome network. Cell 2014; 159:1212-26; PMID:25416956; https://doi.org/ 10.1016/j.cell.2014.10.050 [DOI] [PMC free article] [PubMed] [Google Scholar]
- [62].Wang G, Wang R, Ferris B, Salit J, Strulovici-Barel Y, Hackett NR, Crystal RG. Smoking-mediated up-regulation of GAD67 expression in the human airway epithelium. Respir Res 2010; 11:150; PMID:21034448; https://doi.org/ 10.1186/1465-9921-11-150 [DOI] [PMC free article] [PubMed] [Google Scholar]
- [63].Tilley AE, O'Connor TP, Hackett NR, Strulovici-Barel Y, Salit J, Amoroso N, Zhou XK, Raman T, Omberg L, Clark A, et al.. Biologic phenotyping of the human small airway epithelial response to cigarette smoking. PLoS One 2011; 6:e22798; PMID:21829517; https://doi.org/ 10.1371/journal.pone.0022798 [DOI] [PMC free article] [PubMed] [Google Scholar]
- [64].Hackett NR, Butler MW, Shaykhiev R, Salit J, Omberg L, Rodriguez-Flores JL, Mezey JG, Strulovici-Barel Y, Wang G, Didon L, et al.. RNA-Seq quantification of the human small airway epithelium transcriptome. BMC Genomics 2012; 13:82; PMID:22375630; https://doi.org/ 10.1186/1471-2164-13-82 [DOI] [PMC free article] [PubMed] [Google Scholar]
- [65].Harvey BG, Heguy A, Leopold PL, Carolan BJ, Ferris B, Crystal RG. Modification of gene expression of the small airway epithelium in response to cigarette smoking. J Mol Med (Berl) 2007; 85:39-53; PMID:17115125; https://doi.org/ 10.1007/s00109-006-0103-z [DOI] [PubMed] [Google Scholar]
- [66].Salmon P, Trono D. Production and titration of lentiviral vectors. Curr Protoc Hum Genet 2007; Chapter 12:Unit; PMID:18428406; https://doi.org/ 10.1002/0471142905.hg1210s54 [DOI] [PubMed] [Google Scholar]
- [67].Wang R, Wang G, Ricard MJ, Ferris B, Strulovici-Barel Y, Salit J, Hackett NR, Gudas LJ, Crystal RG. Smoking-induced upregulation of AKR1B10 expression in the airway epithelium of healthy individuals. Chest 2010; 138:1402-10; PMID:20705797; https://doi.org/ 10.1378/chest.09-2634 [DOI] [PMC free article] [PubMed] [Google Scholar]
- [68].Brekman A, Walters MS, Tilley AE, Crystal RG. FOXJ1 prevents cilia growth inhibition by cigarette smoke in human airway epithelium in vitro. Am J Respir Cell Mol Biol 2014; 51:688-700; PMID:24828273; https://doi.org/ 10.1165/rcmb.2013-0363OC [DOI] [PMC free article] [PubMed] [Google Scholar]
- [69].Hogan AE, Corrigan MA, O'Reilly V, Gaoatswe G, O'Connell J, Doherty DG, Lynch L, O'Shea D. Cigarette smoke alters the invariant natural killer T cell function and may inhibit anti-tumor responses. Clin Immunol 2011; 140:229-35; PMID:21684213; https://doi.org/ 10.1016/j.clim.2011.01.011 [DOI] [PubMed] [Google Scholar]
- [70].Kosmider B, Messier EM, Chu HW, Mason RJ. Human alveolar epithelial cell injury induced by cigarette smoke. PLoS One 2011; 6:e26059; PMID:22163265; https://doi.org/ 10.1371/journal.pone.0026059 [DOI] [PMC free article] [PubMed] [Google Scholar]
- [71].Benjamini Y, Hochberg Y. Controlling the false discovery rate: a practical and powerful approach to multiple testing. J R Stat Soc 1995; B57:289-300. [Google Scholar]
Associated Data
This section collects any data citations, data availability statements, or supplementary materials included in this article.