

The transcriptional repressor ZKSCAN3 has been reported to be an important regulator of genes involved in autophagosome formation and lysosomal biogenesis. These results have been based on acute knockdown studies in cultured cells. Here, we have generated and analyzed a mouse model lacking Zkscan3 expression. In vivo, we do not find evidence that this factor is an important regulator of autophagic or lysosomal gene expression.
Because enucleated cells appear to be fully capable of activating macroautophagy/autophagy,1 the transcriptional regulation of this process has often been ignored or underappreciated.2 Nonetheless, a growing number of transcription factors appear to modulate the expression of various autophagic components.2 Most notably, the transcription factor TFEB activates a broad range of genes associated with autophagosome formation and lysosomsal biology.3 In contrast, it has been suggested that ZKSCAN3 can act in an opposing fashion to repress the expression of an overlapping set of genes involved in autophagy and lysosomal biogenesis.4 ZKSCAN3 belongs to a family of transcriptional regulators, which contain zinc finger motifs (ZNFs), a Krüppel-associated box (KRAB) and a SCAN domain.5,6 The KRAB domain is a very potent transcriptional repression module and it is thought to bind to corepressors and/or transcription factors via protein-protein interaction. Overexpression of ZKSCAN3 has been associated with augmenting tumor cell growth both in vitro and in vivo.7-9 In contrast, a previous report found that knockdown of ZKSCAN3 induced growth arrest and augmented senescence, and that these biological effects could be attributed, at least in part, to the increased expression of a host of genes involved in autophagy and lysosomal biology.4 These experimental results were obtained in several established transformed human tumor cell lines after acute knockdown of ZKSCAN3 using lentiviral shRNA constructs. Our preliminary observations using similar strategies largely confirmed these observations (data not shown).
Intrigued by the possibility that ZKSCAN3 could potentially function in vivo as a negative regulator of autophagic flux, we sought to generate zkscan3 knockout (KO) mice using the CRISPR (clustered regularly interspaced short palindromic repeats)/Cas9 approach. We generated several independent lines. All lines gave similar results and thus for the sake of clarity, we provide an in-depth analysis of one line that contained a large 8.1-kb deletion spanning from exon 2–6 of the Zkscan3 locus (Fig. 1A and B). The loss of ZKSCAN3 protein was confirmed using lysates obtained from wild-type (WT) or zkscan3 knockout animals (Fig. 1C). Although acute knockdown of ZKSCAN3 has dramatic effects on the growth of transformed cells,4 mice lacking Zkscan3 were born in the expected Mendelian ratio (Fig. 1D). These mice did not manifest any discernable phenotypic abnormalities as WT and KO mice were indistinguishable by weight, size and appearance (Fig. 1E).
Figure 1.
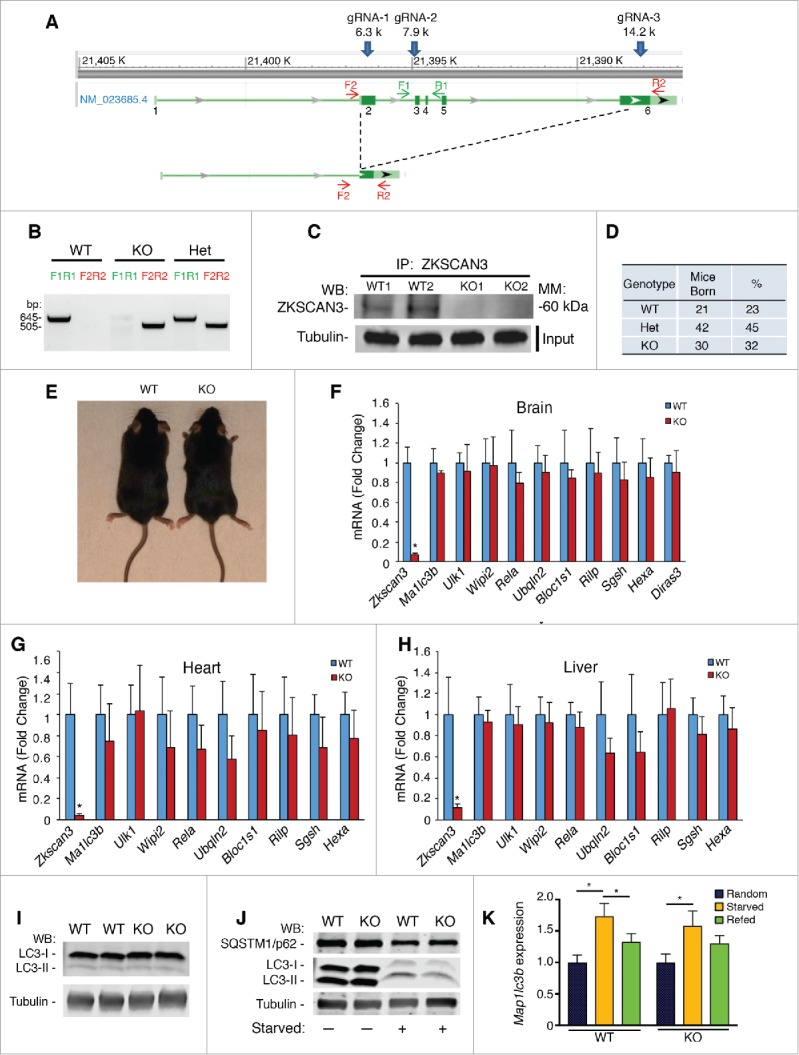
The role of ZKSCAN3 in transcriptional regulation of autophagy. (A) CRISPR-mediated deletions in the zkscan3 knockout mouse line. The genomic sequence and intron/exon sequence of Zkscan3 are shown. Given putative alternative transcripts, the diagram shows the strategy to use 3 gRNA targeting 3 different locations in exon 2, exon 3 and exon 6 of the Zkscan3 gene. This strategy leads to generating this knockout line with a deletion of 8083 base pairs (bp), with complete loss of exon 2–5 and partial loss of the 6th exon (14,050 to 14,957). Primers F1 and R1 are for the WT allele, while F2 and R2 can only amplify the KO allele. (B) Genotyping result demonstrates the product of primer F1 and R1 (645 bp in WT alleles) and that of F2 and R2 (505 bp in KO alleles). Heterozygous mice have both alleles. (C) Representative result of immunoprecipitation (IP) followed by western blot (WB) demonstrating loss of the 63 kD ZKSCAN3 protein in KO heart tissue. Analysis is from 2 WT (WT1, WT2) and 2 knockout (KO1, KO2) mice. Loading control for tubulin expression represents a WB of the input lysates used for immunoprecipitation. (D) Analysis of approximately 100 live consecutive births from Zkscan3+/− heterozygous (Het) crosses demonstrating no evidence for embryonic lethality in mice lacking Zkscan3. (E) Representative appearance of male WT and KO mice at 8 wk of age. (F-H) qPCR analysis for selected genes involved in autophagy and lysosomal biogenesis in the brain (F), heart (G) and liver (H) of WT and KO mice. n = 5 mice per group, *p < 0.05, error bars represent standard deviation (SD). (I) Representative western blot of brain lysate of 2 WT and 2 zkscan3−/− mice demonstrating no difference in LC3B expression. (J) Representative western blot of SQSTM1/p62 and LC3 from WT and KO MEFs under fed (-) and starved (+) conditions. (K) Analysis of Map1lc3b expression in hearts of WT or KO mice under randomly fed conditions (n = 8 WT, n = 7 KO), starved conditions (n = 5 WT, n = 7 KO) and 8 h after refeeding (n = 4 WT, n = 4 KO). Values were normalized to random fed conditions for each genotype. *p < 0.05.
We next sought to understand whether the absence of Zkscan3 resulted in an induction of autophagy/lysosomal gene expression consistent with its putative function as a transcriptional repressor. We harvested the brain, heart and liver from 5 WT and KO mice. These organs were chosen based on previous observations that ZKSCAN3 is highly expressed in these tissues.10 Surprisingly, Zkscan3 deletion had no marked effect on the expression of a host of either autophagy (Map1lc3b, Ulk1, Wipi2, Diras2 and Rela) or lysosomal genes (Ubqln2, Bloc1s1, Rilp, Sgsh and Hexa) previously reported to be direct and indirect targets of ZKSCAN3 (Fig. 1F-H).4 While we did note that a few genes were modestly reduced in some tissues, this reduction was actually the opposite from what was expected following deletion of a repressor. These expression results were obtained under fasting conditions because previous results have suggested that the effects of ZKSCAN3 inhibition are more marked under conditions of nutrient depletion.4 Nonetheless, we also found that the expression of these target genes were also not induced in randomly fed mice (Fig. S1), or when we analyzed other lines of zkscan3 KO mice generated from independent CRISPR/Cas9 targeting events (data not shown). Consistent with this lack of transcriptional change, we saw no evidence of increased steady-state levels of autophagy proteins such as LC3B in tissues obtained from zkscan3 KO animals (Fig. 1I). Furthermore, using WT or KO mouse embryonic fibroblasts (MEFs), we observed that the absence of Zkscan3 did not alter the induction of autophagy following nutrient withdrawal, as both WT and KO cells had a similar fall in SQSTM1/p62 levels and a similar rise in the LC3-II:LC3-I ratio under starved conditions (Fig. 1J). Similarly, in vivo, while expression of Map1lc3b, which encodes LC3B, was dynamically regulated by nutrient availability, the overall response to starvation and re-feeding was similar between WT and KO mice (Fig. 1K).
Taken together, our results do not support an important in vivo role for ZKSCAN3 in the transcriptional regulation of autophagy. There are several potential explanations of these observations and why they conflict with a previous in vitro analysis.4 First, there may be important differences between the role of ZKSCAN3 in human and mouse tissues. It should be noted that at the protein level, there is only an approximate 80% level of amino acid conservation between mouse and human ZKSCAN3. Another possibility is that there are often important differences in the cellular response between acute shRNA knockdown and stable germline knockouts. In that regard, ZKSCAN4 is highly related to ZKSCAN3 and might be able to compensate for the loss of the latter in our stable knockout mice. Finally, and perhaps most likely, there may be substantial differences in the regulation of autophagy between normal tissues and tumor cell lines. These and other explanations are likely to account for the differences in these sets of observations. Nonetheless, given the fact that inhibiting ZKSCAN3 has been viewed as an attractive target to augment autophagy therapeutically,11 we think our in vivo results may be of interest to the community.
Materials and methods
Generation of zkscan3 knockout mice by the CRISPR/Cas9 method
zkscan3 knockout mice were generated using the CRISPR/Cas9 method as reported previously.12 Briefly, 3 single guide RNAs (sgRNAs) were designed to target the Zkscan3 gene, targeting exon 2, exon 3 and exon 6 separately. The nucleotide sequences for these sgRNAs were as follows: Zkscan3-Ex2:GGAGCTACTGGTCATAAAGG; Zkscan3-Ex3: AAGTAGCCAGATGGAGCCCG and Zkscan3-Ex6: ATAGAACCGCCTGGTTCCTG. These sequences were cloned into a sgRNA vector using OriGene sgRNA cloning services and were then used as templates to synthesize sgRNAs using the MEGAshortscript T7 kit (ThermoFisher, AM1354). Cas9 mRNA was in vitro-transcribed from plasmid MLM3613 (Addgene, 42251; deposited by Dr. Keith Joung) using the mMESSAGEmMACHINE T7 Ultra kit (ThermoFisher, AM1345). For microinjection, Cas9 mRNA (100 ng/μl) was mixed with all 3 sgRNAs (20 ng/μl of each sgRNA) and then microinjected into the cytoplasm of fertilized eggs collected from C57BL/6N inbred mice. The injected zygotes were cultured overnight in M16 medium at 37°C in 5% CO2. The next morning, embryos that had reached the 2-cell stage of development were implanted into the oviducts of pseudopregnant foster mothers (Swiss Webster, Taconic Farm). From the first generation, we identified 5 individual lines with long genomic DNA deletion, ranging from 7 kb to 8 kb. We named the lines 1295, 1297, 1298, 1440, and 1444. The majority of our experiments were performed using Line 1444.
Mice
The Zkscan3 mice were maintained in a C57BL/6N or C57BL/6J F1 background, and experimental mice were obtained by breeding the mice using heterozygous crosses. Genotyping for Zkscan3 was performed using the following primers: 5′-GCTACTGGTTTCACTCACTCT-3′ (F1) and 5′-CACTCTAGC ATCAGCCTTCTTG-3′ (R1) for the WT allele, 5′-ATGCCACCCACAGTCATTAG -3′ (F2) and 5′-GAAGATGTG AGCTACGCCTAAA-3′ (R2) for the KO allele. All animal studies were done in accordance with and approval of the National Heart, Lung, and Blood Institute (NHLBI) Animal Care and Use Committee.
Cell culture
MEFs were prepared from Zkscan3 heterozygous breeders using embryos harvested on embryonic d 12–14. MEFs were cultured in growth medium consisting of DMEM (ThermoFisher, 11965–092) supplemented with 10% fetal bovine serum (ThermoFisher, 16000044). For starved conditions, the growth medium was replaced with Hank's balanced salt solution (ThermoFisher, 14025092) for 6 h before harvesting the cells.
Protein detection of ZKSCAN3
Hearts from WT and KO mice were lysed with RIPA buffer (10 mM Tris-Cl, pH 8.0, 1 mM EDTA, 1% Triton X-100 [Sigma-Aldrich, T9284], 0.1% SDS [Sigma-Aldrich, L3771], 150 mM NaCl) supplemented with protease inhibitor (Roche, 11873580001) and phosphatase inhibitor (Roche, 04906837001) cocktails. After homogenization, protein concentrations were measured and immunoprecipitation procedures were performed as described previously.13 ZKSCAN3 antibody (ProteinTech, 20800–1-AP) was incubated with the protein lysate overnight (1 mg of protein) in a 4°C cold room, at a concentration of 2 μg of Ab/1 mg lysate. Protein A magnetic beads (Bio-rad, 1614013) were used according to the manufacturer's instructions. Immunoprecipitates were resolved by SDS-PAGE and transferred to a nitrocellulose membrane. The same antibody for ZKSCAN3 immunoprecipitation was used in the subsequent western blot (1: 1000), along with a True blot secondary antibody (Rockland, 18–4516–32). Other antibodies used include SQSTM1/p62 (American Research Products, 03-GP62-C), tubulin (Millipore, 05–829) and LC3 (Novus, NB100–2220).
Quantitative RT-PCR
The procedures for mRNA expression were as described previously.14 The primers used are listed in Table 1. The expression of individual genes was normalized to the expression of the ribosomal gene Rps21. Three pairs of WT and KO mice that had been fasted for 12 h were used for each tissue analyzed. The data were normalized to the expression observed in WT samples.
Table 1.
Primers used in the study for RT-PCR.
| Name | Sequence |
|---|---|
| mDiras2F | GGTTGGGCTAATCTCTCTTTC |
| mDiras2R | CAGGATGGCAGGCAAATTA |
| mRelaF | GCATGCGATTCCGCTATAA |
| mRelaR | CTTGGTGGTATCTGTGCTTC |
| mWipi2F | CAGGCCTGTGTGGTTATG |
| mWipi2R | GGGAACCTCAGCAGATTTAG |
| mStx5aF | TGGAGGTGGTCCCATAAT |
| mStx5aR | CTAGGGTCCATCATGTCAATAG |
| mSec22bF | CACCTTCCTCTTCGTTTACTC |
| mSec22bR | GAGACCAAACAGTCCCAAATA |
| mUbqln2F | ACACCTACCACCACGAATA |
| mUbqln2R | CAGGTTACTAAGGCTGGAAAG |
| mBloc1s1F | GACCATGAGGTGAAGACTCTA |
| mBloc1s1R | GTTCTCCACCATTCCAATCC |
| mRilp-F | CTCCAACGACAAGGAAGATG |
| mRilp-R | CCCGATACCATAAGCCAAAG |
| mZkscan3-F | CTG GAG TAC TTG GAC AGG CAG |
| mZkscan3-R | ATC ATC TGG AAC CTG TGG AGG |
| mUlk1-F | CAC ACT CTG TGG TTC TCC TAT G |
| mUlk1-R | CAT CGT AGT GCT GGG ACA TAA T |
| mMaplc3b-F | ACG AGA GTG AGA GAG ATG AAG A |
| mMaplc3b-R | GTC TCC TGC GAG GCA TAA A |
| mRps21-F | AAA CCT ATG GCA TCT GCG GG |
| mRps21-R | ATC ATC TGA CTC GCC CAT CC |
Statistical analysis
Statistical significance for gene expression was by a Tukey-Kramer Multiple Comparison Test. A value of p < 0.05 was considered significant.
Supplementary Material
Abbreviations
- CAS9
CRISPR associated protein 9
- CRISPR
clustered regularly interspaced short palindromic repeats
- KO
knockout
- MEFs
mouse embryonic fibroblasts
- shRNA
short hairpin RNA
- WT
wild type
Disclosure of potential conflicts of interest
No potential conflicts of interest were disclosed.
Funding
This work was supported by NIH Intramural funds and support from the Leducq Transatlantic Network.
References
- [1].Morselli E, Marino G, Bennetzen MV, Eisenberg T, Megalou E, Schroeder S, Cabrera S, Bénit P, Rustin P, Criollo A, et al.. Spermidine and resveratrol induce autophagy by distinct pathways converging on the acetylproteome. J Cell Biol 2011; 192:615-29; PMID:21339330; https://doi.org/ 10.1083/jcb.201008167 [DOI] [PMC free article] [PubMed] [Google Scholar]
- [2].Fullgrabe J, Klionsky DJ, Joseph B. The return of the nucleus: transcriptional and epigenetic control of autophagy. Nat Rev Mol Cell Biol 2014; 15:65-74; PMID:24326622; https://doi.org/ 10.1038/nrm3716 [DOI] [PubMed] [Google Scholar]
- [3].Settembre C, Di Malta C, Polito VA, Garcia Arencibia M, Vetrini F, Erdin S, Erdin SU, Huynh T, Medina D, Colella P, et al.. TFEB links autophagy to lysosomal biogenesis. Science 2011; 332:1429-33; PMID:21617040; https://doi.org/ 10.1126/science.1204592 [DOI] [PMC free article] [PubMed] [Google Scholar]
- [4].Chauhan S, Goodwin JG, Chauhan S, Manyam G, Wang J, Kamat AM, Boyd DD. ZKSCAN3 is a master transcriptional repressor of autophagy. Mol Cell 2013; 50:16-28; PMID:23434374; https://doi.org/ 10.1016/j.molcel.2013.01.024 [DOI] [PMC free article] [PubMed] [Google Scholar]
- [5].Lupo A, Cesaro E, Montano G, Zurlo D, Izzo P, Costanzo P. KRAB-Zinc Finger proteins: A repressor family displaying multiple biological functions. Curr Genomics 2013; 14:268-78; PMID:24294107; https://doi.org/ 10.2174/13892029113149990002 [DOI] [PMC free article] [PubMed] [Google Scholar]
- [6].Huntley S, Baggott DM, Hamilton AT, Tran-Gyamfi M, Yang S, Kim J, Gordon L, Branscomb E, Stubbs L. A comprehensive catalog of human KRAB-associated zinc finger genes: insights into the evolutionary history of a large family of transcriptional repressors. Genome Res 2006; 16:669-77; PMID:16606702; https://doi.org/ 10.1101/gr.4842106 [DOI] [PMC free article] [PubMed] [Google Scholar]
- [7].awahara T, Inoue S, Ide H, Kashiwagi E, Ohtake S, Mizushima T, Li P, Li Y, Zheng Y, Uemura H, et al.. ZKSCAN3 promotes bladder cancer cell proliferation, migration, and invasion. Oncotarget 2016; 7(33):53599-610; https://doi.org/ 10.18632/oncotarget.10679 [DOI] [PMC free article] [PubMed] [Google Scholar]
- [8].Yang L, Hamilton SR, Sood A, Kuwai T, Ellis L, Sanguino A, Lopez-Berestein G, Boyd DD. The previously undescribed ZKSCAN3 (ZNF306) is a novel "driver" of colorectal cancer progression. Cancer Res 2008; 68:4321-30; PMID:18519692; https://doi.org/ 10.1158/0008-5472.CAN-07-6426 [DOI] [PubMed] [Google Scholar]
- [9].Zhang X, Jing Y, Qin Y, Hunsucker S, Meng H, Sui J, Jiang Y, Gao L, An G, Yang N, et al.. The zinc finger transcription factor ZKSCAN3 promotes prostate cancer cell migration. Int J Biochem Cell Biol 2012; 44:1166-73; PMID:22531714; https://doi.org/ 10.1016/j.biocel.2012.04.005 [DOI] [PMC free article] [PubMed] [Google Scholar]
- [10].Li J, Wang Y, Fan X, Mo X, Wang Z, Li Y, Yin Z, Deng Y, Luo N, Zhu C, et al.. ZNF307, a novel zinc finger gene suppresses p53 and p21 pathway. Biochem Biophys Res Commun 2007; 363:895-900; PMID:17910948; https://doi.org/ 10.1016/j.bbrc.2007.08.180 [DOI] [PubMed] [Google Scholar]
- [11].Li Y, Xu M, Ding X, Yan C, Song Z, Chen L, Huang X, Wang X, Jian Y, Tang G, et al.. Protein kinase C controls lysosome biogenesis independently of mTORC1. Nat Cell Biol 2016; 18:1065-77; PMID:27617930; https://doi.org/ 10.1038/ncb3407 [DOI] [PubMed] [Google Scholar]
- [12].Wang H, Yang H, Shivalila CS, Dawlaty MM, Cheng AW, Zhang F, Jaenisch R. One-step generation of mice carrying mutations in multiple genes by CRISPR/Cas-mediated genome engineering. Cell 2013; 153:910-8; PMID:23643243; https://doi.org/ 10.1016/j.cell.2013.04.025 [DOI] [PMC free article] [PubMed] [Google Scholar]
- [13].Pan H, Zhao X, Zhang X, Abouelsoud M, Sun J, April C, Amleh A, Fan JB, Hu Y, Li R. Translational Initiation at a Non-AUG Start Codon for Human and Mouse Negative Elongation Factor-B. PLoS One 2015; 10:e0127422; PMID:26010750; https://doi.org/ 10.1371/journal.pone.0127422 [DOI] [PMC free article] [PubMed] [Google Scholar]
- [14].Pan H, Qin K, Guo Z, Ma Y, April C, Gao X, Andrews TG, Bokov A, Zhang J, Chen Y, et al.. Negative elongation factor controls energy homeostasis in cardiomyocytes. Cell Rep 2014; 7:79-85; PMID:24656816; https://doi.org/ 10.1016/j.celrep.2014.02.028 [DOI] [PMC free article] [PubMed] [Google Scholar]
Associated Data
This section collects any data citations, data availability statements, or supplementary materials included in this article.