

ABSTRACT
Although the treatments of malignant glioma include surgery, radiotherapy and chemotherapy by oral drug administration, the prognosis of patients with glioma remains very poor. We developed a polyethylene glycol-dipalmitoylphosphatidyle- thanoiamine (mPEG-DPPE) calcium phosphate nanoparticles (NPs) injectable thermoresponsive hydrogel (nanocomposite gel) that could provide a sustained and local delivery of paclitaxel (PTX) and temozolomide (TMZ). In addition, the proportion of PTX and TMZ for the optimal synergistic antiglioma effect on C6 cells was determined to be 1:100 (w/w) by the Chou and Talalay method. Our results clearly indicated that the autophagy induced by PTX:TMZ NPs plays an important role in regulating tumor cell death, while autophagy inhibition dramatically reverses the antitumor effect of PTX:TMZ NPs, suggesting that antiproliferative autophagy occurs in response to PTX:TMZ NPs treatment. The antitumor efficacy of the PTX:TMZ NP-loaded gel was evaluated in situ using C6 tumor-bearing rats, and the PTX:TMZ NP-loaded gel exhibited superior antitumor performance. The antitumor effects of the nanocomposite gel in vivo were shown to correlate with autophagic cell death in this study. The in vivo results further confirmed the advantages of such a strategy. The present study may provide evidence supporting the development of nanomedicine for potential clinical application.
KEYWORDS: autophagy, glioma, hydrogel, mPEG-PE CaP, nanoparticles, paclitaxel, temozolomide
Introduction
Glioma is one of the most common primary tumors in the central nervous system.1 Many factors are involved in the development of the central nervous system. Glioma tissue is derived from the nerve epithelium, and exhibits invasive, growth, and other malignant biological characteristics.2 Although significant progress in the basic research of glioma has been made in recent years, the prognosis of patients with glioma has not been significantly improved. The average survival time of these patients is approximately 14.6 mo.3 The combination of surgical treatment with radiotherapy or chemotherapy is the principal treatment of malignant gliomas. With more in-depth research on the molecular characteristics of glioma, improving the efficacy of chemotherapy has become an important part of this strategy.4
However, challenges in glioma drug development include ineffective systems for drug delivery to intracerebral tumor elements. Nanopreparations have been shown to reduce the side effects of cancer chemotherapy and improve the effects of treatment.5 Polymer materials used in the preparation of nanoparticles must have good biocompatibility and degradation in vivo.5,6 Lipid, calcium phosphate (LCP) NPs were first developed for siRNA delivery.7 According to the mechanism of LCP NP formation, we assumed that some drugs that can be coated with lipids have the potential to be formulated into LCP NPs. Polyethylene glycol (PEG) is most commonly used in the formation of hydrophilic shells of hydrophilic block copolymers because of its good hydrophilicity and biocompatibility. It can effectively improve the hydrophilicity and degradation of a nanosystem and extend the carrier system cycle time in vivo.8 As a result, mPEG- dipalmitoylphosphatidylethanoiamine (DPPE) is widely used in the preparation of nanodelivery systems, and its amphiphilic core can solve the problem of low PTX solubility.
Autophagy refers to a biological degradation process of macromolecules and organelles in the cytoplasm and in membrane vesicles; this process can occur in the degradation of large cysts.9,10 Degradation products can be reused to maintain the balance of intracellular metabolic synthesis and decomposition, and to maintain the stability of the internal environment. Autophagy is widespread in the pathophysiology of eukaryotes.11 Studies have found that many antitumor drugs can induce autophagy in tumor cells.12,13 Temozolomide (TMZ) directly alkylates DNA and penetrates the blood-brain barrier without requiring liver metabolic activation. The cell cycle arrests in M/G2 phase.14 Recently, many studies have found that temozolomide binding to other drugs can enhance its autophagy-promoting effect and thus improve the effect of chemotherapy.4,15 In addition, paclitaxel (PTX) is a microtubule-stabilizing agent that has a good clinical therapeutic effect in a variety of tumors.16 A recent study has found that paclitaxel can stimulate autophagy and the induction of apoptosis.17 TMZ and PTX inhibit the proliferation of tumor cells through different mechanisms, and there is no cross resistance between them. Therefore, PTX and TMZ can be used to treat glioma. In fact, there are several clinical studies where PTX was combined with an alkylating agent for synergistic treatment of tumors.18,19 Autophagy in glioma cells can play a role in cell protection while promoting cell death. The induction of autophagy in malignant glioma cells by an autophagy-stimulating factor to induce caspase-independent cell death in cells exhibiting significant autophagic activity.20 The study shows that the classic caspase apoptosis pathway is highly resistant to drugs and that autophagy is significantly weaker than the process of apoptosis.20
As almost no intracranial or distant metastases result from glioma, it can be regarded as a type of local malignant lesion.21 The presence of the blood-brain barrier also provides a natural barrier to oral or intravenous chemotherapy, which provides a strong theoretical basis for the treatment of interstitial chemotherapy.22,23 Bodell et al.24 confirm that the local drug concentration in brain tissue after intratumoral delivery can be more than 113 times that when the drug is delivered through intravenous injection, and the infiltration of local tissue can reach 2.5 cm. The nanocomposite thermoresponsive hydrogel (nanocomposite gel) is a type of water soluble gel with swelling properties. It has a high molecular weight and has the characteristics of high water content, fast dissolution, and good biocompatibility. It is convenient for delivering drugs, and it can release drugs at a constant rate for a long time.25 In addition, with this material, drug concentration in the region of a tumor is high, and thus the anticancer effect is improved.26
In the current study, the best synergistic effect of PTX and TMZ was obtained in vitro by the Chou and Talalay method for drug combination, which is based on the median-effect equation, derived from the mass-action law principle.27 The optimal synergistic proportion of PTX and TMZ was loaded into the nanoparticles by a double emulsion method. The synergistic antiglioma effect of PTX and TMZ in PTX:TMZ-coloaded mPEG-PE CaP NP (PTX:TMZ NPs) was further evaluated in vitro. Next, we used F127 and other materials as matrix materials to prepare thermoresponsive nanocomposite gels. The optimal synergistic effect was selected by the previous work, and PTX and TMZ were coloaded into the thermoresponsive nanocomposite gels. MTT and flow cytometry were used to evaluate the proliferation and apoptosis of C6 cells in vitro. In addition, we chose Wistar rats and C6 cells to establish a rat C6 glioma in situ model. Two types of methods were used to treat the rats: 1. Cauda vein injection and 2. Interstitial dosing, which involves the direct implantation of a thermoresponsive nanocomposite gel loaded with PTX:TMZ NPs. In vivo antitumor effects of the nanocomposite gel were evaluated by the survival curve of tumor-bearing rats. We suggest that PTX and TMZ in PTX:TMZ NPs inhibit the proliferation of glioma cells and that the nanocomposite gel inhibits the growth of glioma by inducing autophagy.
Results
Synergistic effect of free PTX and TMZ on C6 cells
The effects of PTX, TMZ, NPs and gel on glioma cell proliferation were estimated using MTT assays. The results showed that the sensitivity of the C6 cells to the 2 drugs were different; the C6 cells were more sensitive to PTX. The IC50 values of TMZ (23.23 μg/ml) were almost 260-fold higher than those of PTX (0.09 μg/ml) after 48 h of incubation. In contrast, both the NP and gel did not cause apparent alterations in cell proliferation (Fig. 1C and D), suggesting that NPs and gel had no toxic effect on C6 cells in vitro.
Figure 1.
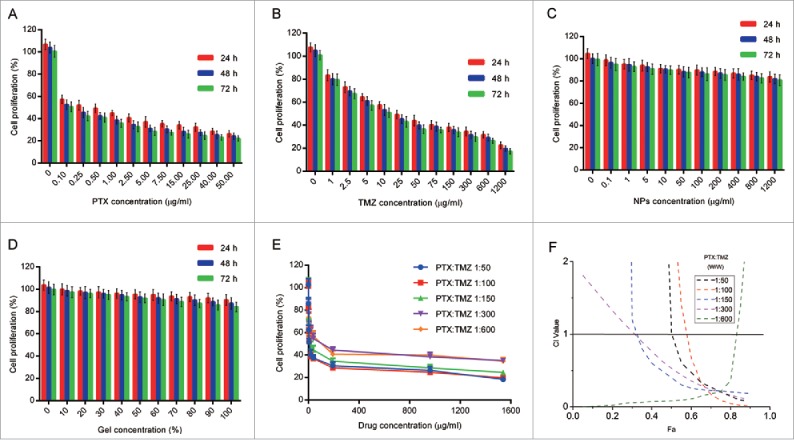
Cytotoxicity study of free PTX and TMZ, mPEG-PE CaP NPs, gel and synergistic effect of PTX and TMZ on the proliferation of C6 cells. (A) Cytotoxicity study of free NPs on C6 cells at various concentration levels. (B) Cytotoxicity study of free gel on C6 cells at various concentration levels. (C) Cytotoxicity study of free PTX on C6 cells at various concentration levels. (D) Cytotoxicity study of free TMZ on C6 cells at various concentration levels for 24 h, 48 h and 72 h, respectively. (E) C6 cells were treated with combination of free drugs at variable molar ratios. (F) The corresponding CI vs Fa (inhibition rate) plot. n = 5.Single asterisk, P < 0.05; double asterisk, P < 0.01; triple asterisk, P < 0.001. Data are shown as the mean ± SEM.
To determine whether PTX and TMZ were exerting an additive or a synergistic effect, the Chou and Talalay method21 was performed. In vitro toxicity analysis of PTX and TMZ combined was estimated after 48 h treatments on C6 cells (Fig. 1A and B). A series of weight ratios and amounts of PTX and TMZ was used to calculate the combination index (CI). CompuSyn software was used to analyze CI values by the Chou and Talalay method.27 The CI vs Fa (inhibition rate) plot (Fig. 1F) results suggested that the CI was between 0.1 and 0.3 over a broad range of drug ratios. CI < 1 indicates a synergistic effect; thus, a synergistic effect was considered to be induced by a wide range of free drug ratios. The results showed that the synergistic effect of PTX and TMZ on the C6 cells was optimal when PTX:TMZ = 1:100 (w/w). The synergistic effect of PTX and TMZ at a weight ratio of 1 to 100 was indicated to exhibit better performance within the range of drug ratios with the lowest IC50 and a small CI value under one (Fig. 1E and F). However, this synergy was not dose-dependent; in other words, the synergistic effect of PTX and TMZ was not enhanced with increases in drug concentrations.
Characterization of PTX:TMZ-loaded mPEG-PE CaP NPs and the thermoresponsive nanocomposite hydrogel
The preparation of the PTX:TMZ-loaded mPEG-PE CaP NPs (PTX:TMZ NPs) was changed based on a method by Li J et al.7 Fig. 2A is a schematic drawing of the self-assembly process of the PTX:TMZ NPs. The size and size distribution of the PTX:TMZ NPs were measured using dynamic light scattering (Fig. S1 A and B). The values of average size and size distribution were 38.3 ± 1.4 nm and 0.156 ± 0.021 (Table S1), respectively, which are in an excellent size range for readily accumulating in tumor vasculature because of the EPR effect. TEM was used to investigate the morphology of the PTX:TMZ NPs. A TEM image of the PTX:TMZ NPs is shown in Fig. 2B. The PTX:TMZ NPs had a nearly spherical shape, and their size seemed to agree with that measured by dynamic light scattering. The zeta potential of these PTX:TMZ NPs was measured to be −40.2 ± 1.2 mV. The slight negative zeta potential could allow the PTX:TMZ NPs to have a higher stability in circulation in comparison with that of negative-charged particles, which tend to be rapidly taken up by the liver and spleen (Fig. S1B).The loading content of PTX and TMZ in the PTX:TMZ NPs was 5.1 ± 0.15% and 5.3 ± 0.18, and the drug encapsulation efficiency of PTX and TMZ in the PTX:TMZ NPs was 82.6 ± 3.65% and 83.5 ± 3.69%, respectively (Table S1).
Figure 2.
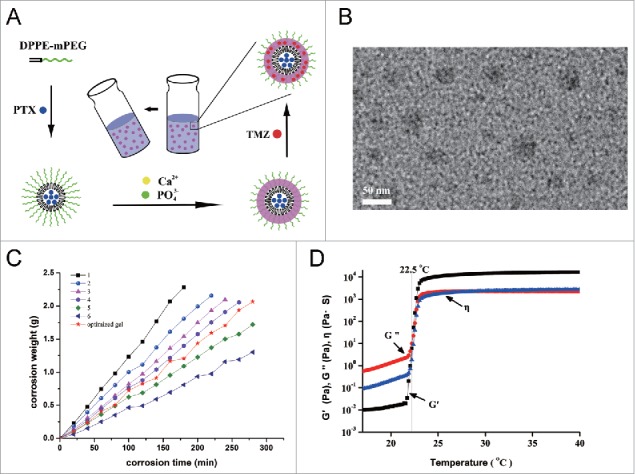
Preparation and characterization of the PTX:TMZ NPs and thermoresponsive nanocomposite hydrogel. (A) Schematic showing the structure of the PTX:TMZ NPs and the conversion between the liquid phase and the gel of hydrogel. (B) Dynamic light scattering size distribution of mPEG-PE CaP NPs showed approximately normal distribution. (C) Apparent zeta potential of the observed PTX:TMZ NPs. (D) TEM images of mPEG-PE CaP NPs loaded with PTX and TMZ showed spherical and well dispersed. Scale bar: 50 nm. (E) Corrosion behavior of the composite gels. (F) Temperature dependence of elastic modulus (G′) and viscous modulus (G″).
In addition, the corrosion of the gel was plotted by time (Fig. 2C), and the corrosion of the gel was zero order; corrosion and time had a good linear correlation. At the same time, the drug release characteristics were investigated in the corrosion samples. The results are shown in Fig. 3A and B. Both PTX and TMZ exhibited slow release, which suggested that drug release was controlled by the corrosion behavior of the gel. With the corrosion of gel, the nanoparticles were released from the gel first, and then the drugs were released from the nanoparticles, instead of drugs being released from the nanoparticles first, and then gradually being released with the corrosion of gel. Tumor tissue is surrounded by constantly renewed fluid. The gel is gradually dissolved and released into the tumor tissue or tumor cavity, releasing the nanoparticles, which then release the drugs; this is similar to the mechanism of drug release in vitro.25 However, physiological factors, such as blood flow velocity and metabolic rate, among others, could make the process of drug release from the gel more complex; therefore, further investigation is required.
Figure 3.
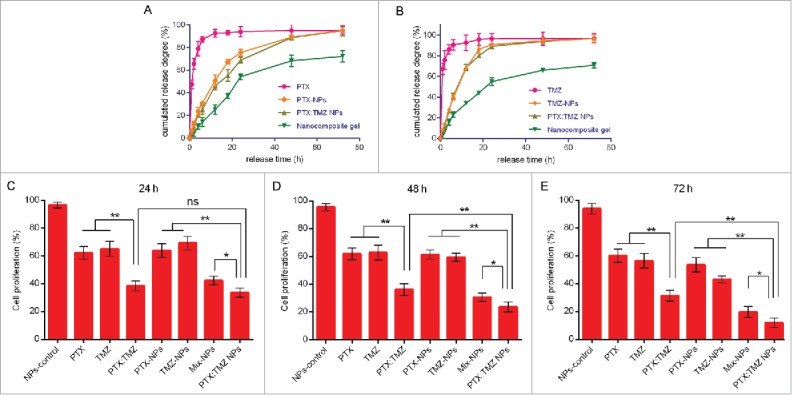
PTX and TMZ release profile and the synergistic inhibitory effects of PTX:TMZ NPs. (A) Cumulative release profiles of PTX from PTX NPs, PTX:TMZ NPs and nanocomposite gel. (B) Cumulative release profiles of TMZ from TMZ NPs PTX:TMZ NPs and nanocomposite gel. The synergistic inhibitory effects of PTX and TMZ on the proliferation of C6 cells after 24 h (C), 48 h (D), and 72 h (E). (n = 3 for each data point and the errors are ± SD).
A rheological method was used to trace gelatinization with temperature rise. Fig. 2D shows the temperature-induced viscoelasticity of the S curve of the gel elastic modulus G′, and which was very low in a region below CAT. When the temperature increased to a certain level, G' increased sharply, which indicated the transformation from solution to gel. This transition point is the gelation temperature Tgel = 28.6°C, and the change of G' with the temperature tended to be flat in the gel.
Synergistic inhibition effect of PTX:TMZ NPs in glioma C6 cells
The results of previous studies showed that PTX and TMZ at a ratio of 1:100 (w/w) exerted the best synergistic effect on C6 cells. The synergistic effect of PTX and TMZ at a weight ratio of 1 to 100 was further affirmed by an in vitro cytotoxicity study using PTX NPs, TMZ NPs, and PTX:TMZ NPs (Fig. 3C to E and S2B). According to the dosage proportion, a double emulsion method was used with the 2 drugs to prepare the PTX:TMZ NPs. Then, the inhibitory effect of the PTX:TMZ NPs on C6 cells was detected using an MTT assay. As shown by the histograms in Fig. 3C to E, significantly stronger proliferation inhibitory effects were observed with the combination treatments whether they were in the form of free drug or drug-loaded nanoparticles; these results were consistent with those of the previous experiments. In addition, the proliferation inhibition effect of the PTX:TMZ NP treatment on C6 cells was always greater than in the treatment with the mix of NPs (PTX NPs, TMZ NPs). Moreover, the inhibition effect of each treatment was time dependent, but the cell proliferation inhibition effect of the drug-loaded nanoparticles was higher than that of the free drug treatments, which may be related to the slow release of drugs. Furthermore, at all time points, there were no obvious inhibitory effects on cell proliferation with blank nanoparticle treatment, which indicates that mPEG-DPPE CaP NP compounds are safe and nontoxic; these results are consistent with existing reports.28,29
The ratio of PTX and TMZ in PTX:TMZ NPs determined to be synergistic in vitro was used for further in vivo experiments.
PTX:TMZ NPs enhance C6 cells autophagic cell death
PTX and TMZ can both induce autophagy to lead to cell death;17,30 therefore, we next assessed the effect of PTX:TMZ NPs in inducing autophagy activity in C6 cells that were treated for 48 h. C6 cells were stained using monodansylcadeverine (MDC) and observed using a fluorescence microscope. As shown in Fig. 4A, trehalose (a common autophagy inducer, a positive control here) treatment induced many more green MDC puncta compared with that of untreated C6 cells, suggesting that more autophagy vesicles were induced by trehalose. Although there were fewer green puncta in untreated C6 cells, it was indicated that basal autophagy occurred. In addition, the number of green MDC puncta resulting from empty nanoparticles was also more than that of untreated cells. Accordingly, we speculate that autophagy was also induced by empty nanoparticles (NPs). As shown, the most MDC puncta of all treatments were observed in PTX:TMZ NP-treated C6 cells. This was probably because empty nanoparticles also induced MDC puncta, and PTX:TMZ NP-treated cells generated more MDC puncta than did free PTX:TMZ. Notably, the formation of green fluorescent MDC puncta was significantly attenuated in the presence of PTX:TMZ NPs+3-methyladenine (3-MA), as shown in Fig. 4A. In addition, to study the effect of 3-MA on PTX:TMZ NPs, we investigated the formation of green fluorescent MDC puncta of empty nanoparticles or trehalose on C6 cells in the presence of 3-MA. The number of green MDC puncta and its fluorescence intensity suggested that 3-MA can significantly inhibit C6 cells autophagy induced by empty nanoparticles or trehalose (Fig. 4 A). Similar results are shown in Fig. 4B and C. The percentage of MDC-positive cells was determined by flow cytometry. From this quantitative analysis, PTX:TMZ NPs were determined to have induced autophagy in C6 cells, and the PTX:TMZ NP treatment yielded the most dramatic results. Compared with that of the PTX:TMZ NP treatment, the quantity of green puncta resulting from the PTX:TMZ NP+3-MA treatment was significantly less, indicating that when 3-MA was added, autophagy was significantly inhibited. These inhibitory effects may be achieved by the limited 3-MA effect on empty nanoparticles and less inhibition of C6 cell autophagy induced by drugs. Furthermore, to address whether PTX:TMZ NPs affect autophagosome-lysosome fusion, we examined the colocalization of mCHERRY-EGFP-LC3B, which is a tandem-tagged construct with LC3B, GFP fluorescent protein and mCHERRY. Because the GFP signal is more sensitive to the acidic conditions of the lysosome lumen, the single red fluorescence signal indicated autolysosomes, whereas colocalization of both GFP and mCHERRY fluorescence suggested that the autophagosomes and lysosomes had not yet been fused. As a positive control, C6 cells were also treated with trehalose to induce autophagy and stained with MDC. As shown in Fig. 5A, trehalose induced a significant increase of green and yellow (green and red colocalization) puncta, indicative of autophagosome formation process that normally occurs during starvation upon autophagy activation. The results showed that a few yellow dots were observed from the control treatment, and the green fluorescence was mostly a uniform, cytoplasmic distribution. Notably, the PTX:TMZ NP treatment exhibited several yellow and red dots, illustrating that PTX:TMZ NPs could induce the substantial formation of autolysosomes and complete autophagic flux. In contrast, yellow dots were primarily observed in PTX:TMZ-treated cells, demonstrating that, although more autophagosomes could be induced by PTX:TMZ, the formation of autophagic flux could not be induced. C6 cells were further cotreated with PTX:TMZ NPs and the inhibitor of the autophagy complex, 3-MA. As expected, 3-MA could inhibit autolysosome formation induced by the PTX:TMZ NPs (Fig. 4C and Fig. 5A).
Figure 4.
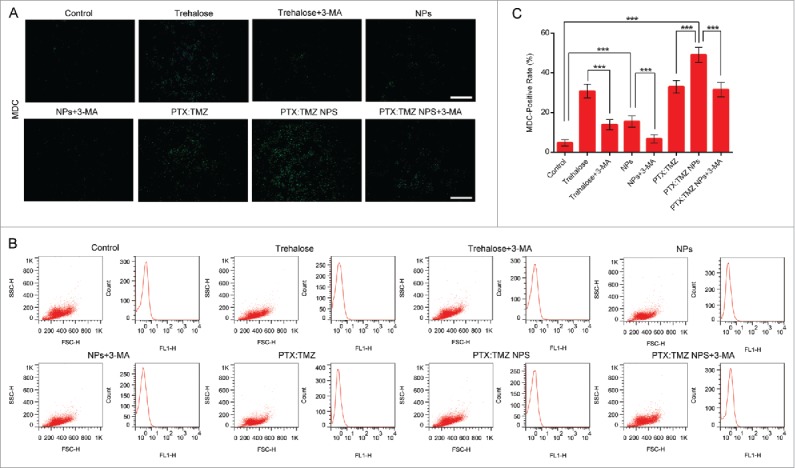
Autophagy induced in C6 rat glioma cells in response to PTX:TMZ NPs for 48 h (MDC). (A) Fluorescence microscopy images of autophagic vacuoles with trehalose, trehalose+3-MA, NP, NP+3-MA, PTX:TMZ, PTX:TMZ NP, and PTX:TMZ NP+3-MA (1 mM) treatment of 48 h using MDC staining. (B) The flow cytometric analysis of fluorescence intensity of intracellular MDC treated as described in (A). Scale bar: 100 μm. (C) Quantification of MDC-positive cells determined 48 h after treatment as described in (A) using image pro plus software. Data are expressed as means ± SD. *P < 0.05, **P < 0.01, ***P < 0.001. (For interpretation of the references to color in this figure legend, the reader is referred to the web version of this article).
Figure 5.
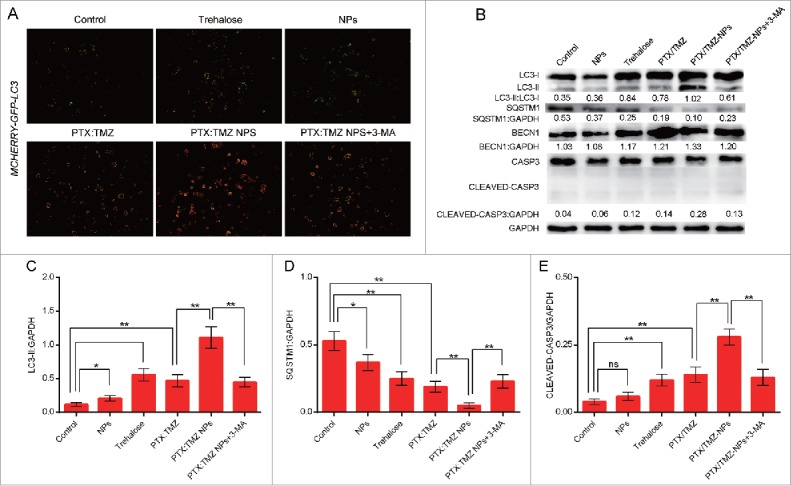
Autophagy induced in C6 rat glioma cells in response to PTX:TMZ NPs for 48 h. (A) C6 cells transfected with the mCHERRY-EGFP-Lc3b construct were also evaluated for PTX:TMZ NP-induced autophagy with fluorescence microscopy with trehalose, NP, PTX:TMZ, PTX:TMZ NP and PTX:TMZ NP+3-MA (1 mM) treatment of 48 h. Scale bar: 100μm. (B) Western blot analysis of LC3-I and LC3-II, SQSTM1, BECN1, and CASP3 expression in C6 glioma cells treated with trehalose, NPs, PTX:TMZ, PTX:TMZ NP and PTX:TMZ NP+3-MA (1 mM) treatment of 48 h. Each protein levels against GAPDH were determined by image pro plus software. GAPDH was used as the loading control. The ratios were measured using quantitative image pro plus software. The change was determined by the change in LC3-II, SQSTM1, cleaved CASP3 normalized to GAPDH, LC3-II:GAPDH (C), SQSTM1:GAPDH (D) cleaved CASP3:GAPDH (E) from 0 to 2 (y axis). Error bars indicate standard deviation. *P < 0.05; **P < 0.01. All blots shown are representative of 3 independent experiments. (For interpretation of the references to color in this figure legend, the reader is referred to the web version of this article).
A reliable marker of autophagy activation is the conversion of LC3-I to LC3-II.31 Therefore, the conversion of LC3-I to LC3-II was next determined, with an anti-LC3 antibody. Western blotting using lysates from PTX:TMZ NP-treated C6 cells revealed a significant increase of processed LC3-II that was much stronger compared with that of the trehalose treatment (Fig. 5B and C). These results suggest that PTX:TMZ NP-induced autophagy in C6 cells was associated with the processing of LC3-I to promote a redistribution of LC3-II to autophagosomes. It was noted that the expression of 17 kDa-cleaved fragments of CASP3 was not detected after treatment with PTX:TMZ NPs or other treatments (Fig. 5 B and C). Accordingly, western blot analysis showed an apparent accumulation of LC3-II in C6 cells after PTX:TMZ NP treatment (Fig. 5B and C). In general, these studies demonstrated that PTX:TMZ NPs potently induced autophagy in C6 cells. As before, when 3-MA was added, the conversion of LC3-I to LC3-II was significantly reduced. In mammals and Drosophila, inhibition of autophagy correlates with increased levels of SQSTM1, suggesting that steady-state levels of this protein reflect the autophagic status.32 In addition, to examine whether PTX:TMZ NPs could alter autophagic degradation, steady-state levels of SQSTM1, which serves as a link between LC3 and ubiquitinated substrates and is degraded through the autophagic pathway, were analyzed. As expected, PTX:TMZ NP treatment also induced SQSTM1 degradation, and it led to the degradation of the maximum level (Fig. 5B and C). 3-MA reduced the degradation degree compared with that induced by the PTX:TMZ NP treatment.
Many nanomaterials and drugs will cause the production of reactive oxygen species (ROS) in the body, and ROS have also been shown to have a close relationship with autophagy.33 2′, 7′-dichlorofluorescein diacetate (DCFH-DA) is a commonly used fluorescent probe for the detection of reactive oxygen species in the cells. It is able to enter the cells through the cell membrane, and after entering the cell, the DCFH-DA is converted into dichlorofluorescein DCFH. The ability to pass through the cell membrane is lost, so its use is now called “probe loading.”34 If reactive oxygen species are produced, DCFH would react with the reactive oxygen species to produce DCF, which can be directly observed by green fluorescence under a fluorescence microscope. Figure 5A shows that the cells produced a strong green fluorescence after treatment for 48 h with PTX:TMZ NPs and DCFH-DA probe, which indicates that reactive oxygen species were produced in the cells by PTX:TMZ NP treatment. This result was the most significant of all the treatments. A small amount of green fluorescence was produced by the NPs. It was illustrated that NPs could produce reactive oxygen species, and this was similar to the findings of other studies.35 In addition, autophagy inducer trehalose also produced copious green fluorescence. To elucidate the relationship between autophagy and the ROS that were produced by PTX:TMZ NPs, after treatment of cells with 1 mM of the autophagy inhibitor 3-MA, the level of ROS caused by the PTX:TMZ NPs should be weakened. The result showed that the expression of green fluorescence in the cells was reduced, which indicated that the level of ROS in the cells was decreased in the presence of 3-MA (Fig. 6A to C). It was also demonstrated that the decrease in the activity of autophagy induced by PTX:TMZ NPs+3MA may result in the decrease of reactive oxygen species induced by PTX:TMZ NPs.
Figure 6.

Detection of ROS induced in C6 rat glioma cells in response to PTX:TMZ NPs and the synergistic apoptosis-inducing effects of PTX:TMZ NPs in C6 cells. (A) Fluorescence microscopy image of ROS induced in C6 rat glioma cells in response to trehalose, NP, PTX:TMZ, PTX:TMZ NP, and PTX:TMZ NP+3-MA treatment of 48 h. Scale bar: 100 μm. (B) Quantification of DCFH-DA-positive cells was analyzed by image pro plus software. Each reported value represents the mean SEM. From 3 independent experiments. (C) Detection of ROS by fluorescence intensity measurement using fluorescence microscopy and image pro plus software. (D) Apoptosis of C6 cells in vitro determined by flow cytometric analysis with ANXA5-FITC and PI double-staining after incubated with trehalose, NPs, PTX:TMZ, PTX:TMZ NPs, and PTX:TMZ NP+3-MA for 48 h by flow cytometry (n = 3). (E) Percentage of apoptotic cells summarized from the relative percentage of early apoptotic and late apoptotic cells. From 3 independent experiments.*P < 0.05; ***P < 0.01; ***P < 0.001. Data are shown as the mean ± SEM.
To investigate whether the induction of autophagy contributed to PTX:TMZ NP-mediated cell death using the autophagy inhibitor 3-MA, ANXA5/annexin V-FITC and propidium iodide (PI) flow cytometry analysis showed that the cell apoptosis caused by PTX:TMZ NP treatment was significantly increased, and the apoptosis rate was 17.2%. Interestingly, the apoptosis rates observed after autophagy inducer trehalose treatment and PTX:TMZ treatment were 11.61% and 12.47% (Fig. 6D and E), respectively. There were no significant differences between them. Based on this, we evaluated the effect of trehalose itself on C6 proliferation for 48 h. With the increase of the concentration of trehalose, the cell proliferation was obviously inhibited (Fig, S2). This may be explained from another point of view that promoting autophagy may promote C6 cell death. The results showed that 3-MA inhibited the induction of autophagy, and the number of apoptotic cells was significantly decreased (Fig. 6E). When PTX:TMZ NP-induced autophagy was inhibited with 3-MA, a strong decrease in the proportion of ANXA5-positive cells was observed (Fig. 6D and E). Taken together, the results demonstrate that the autophagy induced by PTX:TMZ NPs promoted cell death in C6 cells.
The efficacy of PTX:TMZ NPs and nanocomposite gel against glioma tumors in vivo
In this study, a nanocomposite gel was designed for the in situ treatment of a tumor cavity; therefore, to study the in vivo synergistic antiglioma effect, a glioma model must first be established. MRI imaging (Fig. 7A and B) and H&E staining (Fig. 7C and D) were used to assess pathological glioma sections 15 d after the rats were inoculated. After removal of the tumor tissue, the sterilized preparation was immediately implanted into the tumor cavity, and the whole process was kept sterile. In addition, to avoid the impact of the operation trauma itself on survival and body weight of the rats, a saline treatment without surgery was used as a control. The control still used the same skin incision, to inject the saline into the drilled bone hole used for the inoculation. To investigate whether local drug delivery was advantageous, cauda vein injection (no surgery) and cauda vein injection (+surgery) were as other controls. The PTX and TMZ concentration in the healthy brain tissue and the resected tumor of cauda vein injection (no surgery) group were determined by HPLC and the results are shown as Table S2 in supplemental material. The PTX concentration in the PTX:TMZ NP group was higher than that in the PTX:TMZ group (P < 0.05). Survival time (n = 6), average survival time, and Kaplan-Meier survival curves were recorded (Fig. 7 F and G, I and J and Fig. S4 B and C). Compared with that of Sur + Saline treatment (21.5 + 2.4 days), the average survival times of rats that received Sur + PTX:TMZ treatment, Sur + PTX:TMZ NP treatment and Sur + Gel treatment were significantly longer, and the survival time of rats that received Sur + Gel treatment was the longest in a groups of rats via local drug delivery. Remarkably, they were significantly longer than that of the corresponding treatment administered by both cauda vein injection (Fig. 6F and G, I and J and Fig. S4 B and C). The results showed that the effects of a surgical operation on the survival of rats were not significant and that the results were not affected. Aneurysms were avoided after administration to observe the rat living conditions (Fig. 7E). The rats that received the saline treatment gradually began to exhibit reduced consumption, poor feeding, weight loss, limb paralysis, seizures, convulsions and death. Rats that received Sur + Saline treatment were able to eat and reduce weight loss as well as other symptoms that appeared later compared with rats that received saline treatment, but because the symptoms rapidly progressed after their onset, surgical resection alone leads to a poor prognosis and cannot be considered an effective treatment. In contrast, 3 of the rat treatments lead to milder limb paralysis and other symptoms, especially the Sur + Gel treatment in local drug delivery groups, demonstrating that the combination of surgical resection and local drug treatment can effectively inhibit the growth of glioma and improve the prognosis. In particular, compared with cauda vein injection (+surgery) in average survival time and Kaplan-Meier survival curves (Fig. 7 I and J and Fig. S4 B and C), the advantage of local drug administration was more than that. It is worth mentioning that there is no significant difference in average survival time and Kaplan-Meier survival curves between the 2 groups in the treatment via cauda vein injection (surgery or not) (Fig. 7 F and G and Fig. S4 B and C). This further shows that, even if at the same condition of the surgery, the local administration can be considered a more effective treatment than via cauda vein injection. The release characteristics of the composite gel can guarantee the slow release of anticancer drugs as well as good tolerability. In addition, the rats that received Sur + PTX:TMZ treatment had a certain degree of decline, but the weight of rats that received Sur +PTX:TMZ NPs or Sur + Gel treatment exhibited almost no change, especially those that received Sur + Gel treatment, where body weight remained stable (Fig. 7F). The free PTX:TMZ exhibited a certain degree of systemic toxicity. Based on these findings, compared with intravenous administration, local administration could more effectively prolong the survival time of rats with glioma.
Figure 7.
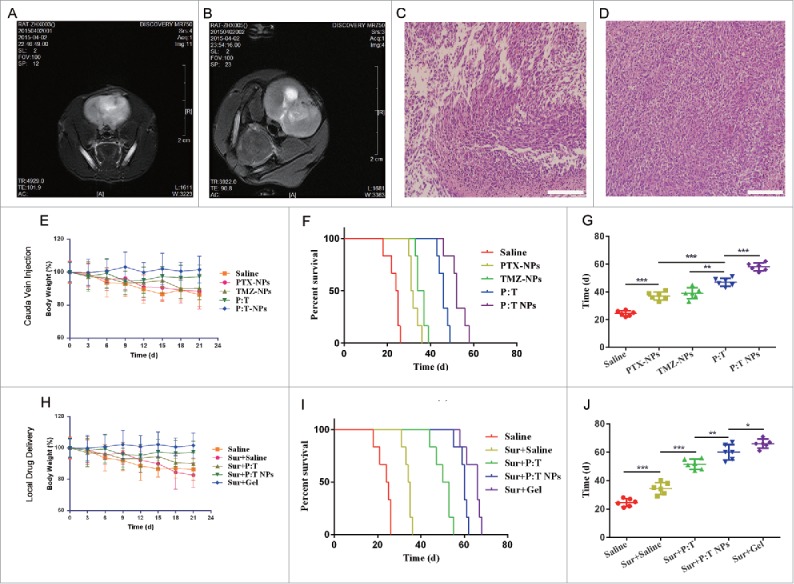
In vivo antitumor effects of various treatments on rats bearing C6 glioma in brain through 2 types of drug delivery (n = 6). Brain MRI images of rat (A) and rat (B) at the time point 15 d after inoculating C6 cells (establishment of glioma model). (C) Histopathology of H&E-stained brain sections of rat (C) and rat (D) from rat (A) and rat (B) that were killed after the MRI. Magnification, 200x; scale bar: 50 µm. (E) The change in body weight of rats during treatments, (F) Kaplan-Meyer survival curves, and (G) mean survival time of rats after treatment with saline, PTX NPs, TMZ NPs, PTX:TMZ (P:T), or PTX:TMZ NPs (P:T NPs) by tail vein injection (no surgery). Rats were administered a total of 4 d (once every 2 d) of treatment over one wk. (H) The change in body weight of rats during treatments, (I) Kaplan-Meyer survival curves, and (J) mean survival time of rats after saline, PTX:TMZ, PTX:TMZ NP or nanocomposite thermoresponsive hydrogel treatment implantation into the resection cavity. The concentration of PTX and TMZ was 28 μg/kg body weight and 2.8 mg/kg body weight, respectively. Scale bar: 200 x. Data were presented as mean ± SEM (n = 6). (*P < 0.05, **P < 0.01, **P < 0.001).
PTX:TMZ NPs and the nanocomposite gel enhance C6 cell autophagy-mediated cell death in vivo
To examine whether PTX:TMZ NPs induced autophagy in vivo, changes in the number of autophagosomes were observed using an electron microscope in both types of drug delivery. As shown in Fig. 8A, a significantly increased number of autophagosomes was observed in the tumor tissue from rats treated with PTX:TMZ NPs (48 h) compared with that resulting from other treatments administered via cauda vein injection (no surgery). However, in local drug delivery, except the saline treatment alone, the other treatments induces more autophagosomes than did the treatments via cauda vein injection (no surgery. This may be due to the tumor surgery causing a certain degree of trauma, leading to dramatic changes in the organization of the growth environment, thus inducing more autophagy. In particular, a substantial number of bilayer membrane autophagosomes and single membrane autolysosomes containing cytosolic components of the cells appeared in the tumors that received Sur + Gel treatment, significantly more so than the other treatment tissues (Fig. 8A). This may be attributed to the occurrence of autophagy that is also induced by the gel. The results of these experiments were confirmed by the PTX:TMZ NP-loaded gel inducing autophagy in vivo. Consistent with the tumor tissue autophagy that was observed using an electron microscope, the terminal deoxyribonucleotidyl transferase (TDT)-mediated dUTP digoxigenin nick-end labeling (TUNEL) assay revealed many more apoptotic cells in the tumors treated with PTX:TMZ NP gel plus surgery by local drug delivery than in the tumors treated with PTX:TMZ NPs alone by cauda vein injection (no surgery). Few apoptotic cells were observed in the tumors treated with saline alone by 2 methods (Fig. 8B and Fig. S3). These results may be due to the release characteristics of the nanocomposite gel that ensure the slow release of the PTX:TMZ NPs as well as the anticancer drugs. Notably, the saline plus surgery and PTX:TMZ plus surgery treatment by local drug administration were found to induce significantly more apoptotic cells in the tumors than did the saline and PTX:TMZ treatments administered by cauda vein injection (no surgery), respectively. The results demonstrated that the surgery plus nanocomposite gel could induce more apoptotic cells and that local drug delivery could more effectively promote tumor death compared with cauda vein injection (no surgery). These results suggested that the inhibition of tumor growth in vivo mediated by PTX:TMZ NPs and nanocomposite gel is associated with autophagic cell death.
Figure 8.

PTX:TMZ NPs and nanocomposite gel enhance autophagy-mediated cell death in vivo. (A) Autophagic ultrastructural features in tumor tissues treated with 2 types of drug delivery for 48 h by TEM. Arrows indicate autolysosomes and autophagosomes. Scale bar: 1 µm (B) Tumor tissues were examined by TUNEL staining to evaluate effects of different treatments of 48 h on the induction of apoptosis in tumors. Tumor tissues were stained with tunnel assay kit (green), and counterstained with DAPI (blue). Scale bar: 50 µm. (For interpretattion of the references to color in this figure legend, the reader is referred to the web version of this article).
Discussion
In this study, the optimal synergistic proportion of PTX and TMZ was 1:100, and it was first obtained by the Chou and Talalay method.27 These materials was loaded into the mPEG-PE CaP NPs at this proportion, and the resulting average particle size (38.3 nm) could allow penetration of the blood-brain barrier in rats.36 The synergistic antitumor effects of PTX and TMZ in the PTX:TMZ NPs exhibited the best performance, i.e., the inhibitory effect on cell proliferation by the PTX:TMZ NPs was more than that of the free drug combination treatment and the 2 types of single-loaded NPs and mixed NPs. The former may be related to the slow release of drug in the NPs, and the latter mechanism might need further study.
The importance of autophagy in antitumor activities has led to a large number of studies about drug-loaded NPs that can produce positive or negative regulation of autophagy in tumor cells. Our data indicated that PTX:TMZ NPs could induce autophagy, as indicated by green MDC puncta, mCHERRY-EGFP-LC3B dot formation, the conversion of LC3-I to LC3-II, SQSTM1 degradation, and direct visualization of autophagosomes and autolysosomes by TEM. In addition, the mCHERRY-EGFP-LC3B fluorescence results suggested that PTX:TMZ NPs not only induced the formation of autophagosomes but also induced autophagy flux. Another interesting and possibly useful discovery from the present study is that the autophagy induced by the PTX:TMZ NPs played a specific role in regulating cancer cell death. The autophagy inhibitor 3-MA suppressed autophagosome formation and significantly decreased the number of apoptotic cells. Because autophagy inhibition could alleviate the treatment effectiveness of PTX:TMZ NPs, the chemotherapeutic antitumor effects of the drug-loaded NPs formulation should also be greatly enhanced by coencapsulation of the autophagy inducer in the drug-loaded NPs.
Next, an in situ glioma model was established with C6 cells. In addition, the proof-of-concept for a system was established based on a PTX:TMZ NP-loaded thermoresponsive hydrogel that could be easily injected into a tumor resection cavity, remain there, and maintain a therapeutic concentration of PTX and TMZ, fitting many requirements of local drug delivery for the treatment of glioma. Because the nanocomposite gel was liquid at room temperature, the gel was easily injectable by extrusion through a needle or a catheter. Gelation quickly occurred at physiological temperatures. Because of its good mechanical properties and temperature sensitivity, this gel was an efficient local drug delivery vehicle as an effective concentrate. In our study, the antitumor effect of surgery plus nanocomposite gel treatment was the most effective. Remarkably, the effects of all the antitumor therapies in the local drug delivery group were better than those in 2 intravenous administration groups. There are several reasons for the desirable anticancer effects of the nanocomposite gel. First, the nanocomposite gel has a hemostatic effect, and this leads to a certain remediation of the injury caused by surgery. Second, the gel portion of the NPs release the PTX and TMZ sustainably and slowly due to the further release from the NPs. Third, the enhanced synergistic antitumor effects of the nanocomposite gel could be due to both the gel and the PTX:TMZ NPs. Finally, the NPs prevented removal of PTX and TMZ from the tumor, and this led to maintained high drug concentrations in the tumor region and long-term effects. Another important finding is that the in vivo antitumor effects of the nanocomposite gel are related to autophagic cell death. In addition to PTX:TMZ NP-induced autophagy, it is possible that the surgery and the gel itself induce autophagy. The induction of autophagy by the gel itself requires further research.
Altogether, the results of this study suggest that PTX:TMZ NPs show promise for replacing free drug combinations in clinical therapies and thus should undergo further in vivo testing. As the nanocomposite gel exhibited improved antitumor effects for glioma via local drug delivery, we suggest that it could be applied in the treatments of other malignant tumors. However, our study is only a preliminary study. Including examination of in vivo side effects, further study of the nanocomposite gel is required for future applications in clinical treatments.
Materials and methods
Preparation and characterization of PTX:TMZ-coloaded mPEG-PE CaP NPs
PTX:TMZ -coloaded mPEG-PE CaP NPs were prepared by a double emulsion method. Ten mg of mPEG-PE (Nippon Oil and Fats Co., Ltd., CAS 474922–84–4) was dissolved in 1 mL trichlormethane (Sinopharm Chemical Reagent Co., Ltd., 10006818) and 1 mL of 1 M paclitaxel (dissolved in trichlormethane) (PTX; Jiangsu YEW Biotechnology Co., Ltd., 9807) was added in solution. Then they were dried in the vacuum. Free paclitaxel that was not encased in the kernel was removed by a membrane filtration. After evaporating the trichlormethane, the residual membrane was dispersed in 4 mL of Tris-HCl (10 mM Tris-HCl, pH 7.4) (Roche, 10812846001) to form mPEG-PE micelles. The micelles were stored at 4°C. CaCl2 (100 μL of 100 mM) (Sigma, C8106) solution mixed with 250 μL of mPEG-PE (1 mg/mL) solution. Five hundred μL of HBS (50 mM HEPES, 280 mM NaCl, 1.5 mM Na3PO4, pH 7.4) was quickly added to mPEG-PE Ca2+ PTX solution and allowed to stand for 30 min. Temozolomide (Sigma-Aldrich, T2577) was added directly into the mPEG-PE solution to prepare 2-drug-loaded mPEG-PE CaP NPs. To remove the excess Ca2+, the mixture was centrifuged at 1000 g and 4°C for 1 h using Amicon Ultra-4 centrifugal filter devices (MWCO 10 kDa; Sigma-Aldrich, Z740189). The sample solution was used in further experiment. All of the reagents and solvents (AR grade) were purchased from Sinopharm Chemical Reagent Co., Ltd.
A Malvin MasterSizer 2000 (Zetasizer Nano ZS90, Malvern Instruments Ltd, Malvern, UK) was used to measure the size and zeta potential of the mPEG-PE CaP NPs, and the morphology of the mPEG-PE CaP NPs was observed using a transmission electron microscope (H-800, Hitachi, Honshu, Japan). Each sample was placed on a copper grid (Ted Pella, 9GC20H) coated with a layer of carbon and allowed to dry naturally at room temperature before observation.
Preparation and rheological characterization of nanocomposite thermoresponsive hydrogel
Hydroxypropyl methyl cellulose (HPMC-100M; Colorcon, PD381348) was stirred in hot water until uniformly dispersed. Then, it was refrigerated until fully swollen into a transparent solution. The Pluronic F127 (BASF, 50254759) and sodium alginate (Sigma-Aldrich, 180947) were prepared by a cold method.37 Certain amounts of PTX:TMZ NP freeze-dried powder and sodium alginate were weighed in 30-mL vials, and an appropriate amount of phosphate-buffered saline (PBS, pH 7.4; Beyotime, C0221A) was added. In an ice bath, magnetic stirring was used to dissolve these materials, and the evenly dispersed HPMC-100 M solution was blended with a certain amount of F127. The mixture was kept at 4°C for 24 h or longer, until the polymer was completely dissolved and stirred, resulting in a nanocomposite gel solution.
In this study, a rheological method38 was used to identify the gelation temperature (Tgel) of the gel.
The dissolution rate of the gel was investigated using the method of no film dissolution.39 The dissolution rate of the gel was calculated using the length of gel erosion time. Each sample was measured in parallel 6 times, and the mean value was taken. The PBS solution was obtained from the gel. Each time point had 6 parallel samples; 3 samples were diluted with acetonitrile 10 times, and then were dissolved by ultrasound. The content of PTX was detected by HPLC (Agilent 1200, Santa Clara, California, USA). The other 3 samples were diluted with acetonitrile:water 1:1 (v/v) 10 times, and then were used to promote the dissolution; the content of TMZ was detected by HPLC.
Determination of rheological parameters should be within the linear viscoelastic range to avoid affecting the 3-dimensional network structure of the gel, which is destroyed by shearing movement. At 37°C, the linear viscoelastic region of the system was determined by a stress sweep. Then, after choosing a stress value in the linear viscoelastic region, an oscillation mode was used to measure samples at 37°C for elastic modulus G' (storage modulus), viscous modulus G″ (loss modulus) and phase angle δ (tan δ = G″ / G′); the sweep ranged from 0.1 ∼10 Hz.
Drug loading and in vitro drug release
The content of PTX and TMZ in the PEG-PE CaP NPs was determined by HPLC.40,41 Moreover, the drug-loading content42 was calculated from the mass of the drug loaded into the PEG-PE CaP NPs divided by the weight of the PEG-PE CaP NPs. The drug encapsulation efficiency42 was defined as the weight percentage of incorporated drug compared with the initial total amount of drug. All the experiments were repeated 3 times.43
The release of PTX from the mPEG-PE CaP NPs was characterized by a dialysis method.44 Samples (0.2 mL) were collected at 1, 2, 4, 6, 12, 18, 24, 48 and 72 h, and an equal volume was placed at 37°C to preheat the release medium. The concentration of PTX in the sample was determined by HPLC, as previous described. The release of TMZ from PTX:TMZ NPs was measured in a similar manner.
In vitro cell proliferation of free PTX and TMZ, empty NPs and gel
An MTT (3-[4, 5-dimethylthiazol-2-yl]-2, 5-diphenyltetrazolium bromide) assay was used to determine the effect of treatment with empty NPs, free PTX and TMZ and their combinations on the proliferation of C6 cells (ATCC, CCL−107).
C6 cells were plated in 96-well cell culture plates (1 × 10⁴ cells/well) and maintained in DMEM (Invitrogen, 11965118) supplemented with 10% fetal bovine serum (FBS) (Sigma-Aldrich, F6178) for 24 h in a 37°C, 5% CO2 incubator (Heracell™ 150i, Waltham, MA, USA). Sequently, they were incubated with increasing concentrations of empty NPs, trehalose (Sigma-Aldrich, T0167), PTX and/or TMZ in DMEM supplemented with 10% FBS.
Cells were cultured for 24 h, 48 h and 72 h (trehalose, PTX+3-MA, TMZ+3-MA, PTX:TMZ+3-MA, 48 h) in DMEM supplemented with 10% FBS and then each well was added 100 uL MTT solutions (0.5 mg / ml, with serum-free corresponding medium dissolved) (Sigma-Aldrich, M2128). After 4 h incubation, cultured medium was removed 150 μl of DMSO was added to each well to dissolve the crystal formazan dye. The absorbance value (OD) of 490 nm was determined by using a plate reader (ELX800, BioTek Instruments, Inc., Winooski, VT, USA). The cytotoxicity of the hydrogels against glioma C6 cells was assessed in vitro by MTT assay. Cells were seeded into 24-well plates at 80,000 cell per well in 1 mL of DMEM supplemented with 10% FBS for 24 h. Then the culture medium was removed and the hydrogel precursor solutions (increasing concentration) were added to each well. After incubation for another 24 h, 48 h and 72 h, MTT assay test was performed and the cell proliferation was determined.
Cell relative proliferation rate (RGR%) was calculated with the following formula 1–1:
The Chou and Talalay method21 was used for the analysis of the Combination Index (CI) of the free drug combination using CompuSyn software. CI values between Fa = 0.2 and Fa = 0.8 were considered valid.45
Flow cytometry cell apoptosis detection
The apoptosis of glioma C6 cells was detected by the ANXA5-FITC and PI (Sigma-Aldrich, APOAF) double-staining method. In brief, glioma C6 cells were seeded at 2 × 10⁵ cells/well on 12-well plates (EMD Millipore Corporation, PIMWS1250), and the volume of cell suspension was 1 mL. After an overnight incubation, 1 mL of the PTX:TMZ, PTX:TMZ NP, and the composite gel solutions were added to each well, as well as a control. Three wells (sample) were used in each experimental group. After the cells were incubated in a sterile environment at 37°C for 48 h, the medium collected, and the cells were washed once with precooled PBS. An appropriate amount of 0.25% trypsin solution was then added to each well for cell removal. The collected medium was combined with the cell suspension solution, and the cells were collected by centrifugation. Cells were washed 3 times with the chilled PBS, and then the cells were resuspended with PBS to count the cells. According to the ANXA5-FITC cell apoptosis detection kit instructions, 2 × 10⁵ cells were suspended in 0.5 mL of binding solution, and 5 μL of ANXA5-FITC and 10 μL of PI was added to each tube. The cells were allowed to stand for 15 min at room temperature in the dark. Then, the cells were immediately analyzed by flow cytometry (BD FACSCalibur, Franklin Lakes, New Jersey, USA).
Hematoxylin and eosin (H&E) staining
Rat brain glioma tissues were obtained and washed with PBS, and then the tissues were immersed in 70% ethanol. After producing paraffin sections, the sections were baked at 60°C for 4 h. The slices were dewaxed in water and gradient alcohol. Then, the slices were immersed in xylene 3 times for 10 min. The sections were stained with hematoxylin and eosin. After having been stained, the sections were dehydrated by pure alcohol, and then the slices were rendered transparent by xylene. The samples stained with H&E were sealed with neutral gum. Light microscopy (Olympus IX51, Tokyo, Japan) was used to image the stained sections.
Fluorescence microscopy for MDC, mCHERRY-EGFP-LC3B and ROS
Monodansylcadaverine (Sigma-Aldrich, 30432) is a marker of autophagic vacuoles.33 The C6 cells were seeded onto 6-well plates with a slide. The cells were incubated on the glass slides after the addition of different processing factors. After 24 h of incubation, 0.05 mM MDC was added to the culture medium and incubated for 15 min to stain autophagic vacuoles. Then, the glioma cells were rinsed 3 times with PBS and examined using a fluorescence microscope (Olympus IX51, Tokyo, Japan).
The Lipofectamine™ 2000 transfection reagent (Invitrogen, 11668019) was used to transiently transfect mCHERRY-EGFP-Lc3b (Addgene, 22418; deposited by Jayanta Debnath [University of California at San Francisco, USA]) into C6 cells. After 6-well plates were incubated at 37°C and 5% CO2 for 6 h, the medium was replaced with culture medium supplemented with fetal bovine serum. After different processing factors were added, the cells were imaged using a fluorescence microscope to calculate the number of cells that had been transfected.
Approximately 3000 C6 cells per well were seeded onto 96-well plates. After approximately 24 h, the cell density reached the 70% to 80% that was required for the experiments. A nanomaterial treatment group, a negative control group, and a positive control group were established; the control group was treated with a volume of PBS buffer equal to the volume of material that was added in the other groups. Half an hour earlier than the specified time, Rosup (Beyotime, S0033) was added to positive control wells and incubated for half an hour to produce ROS; dichlorofluorescin (Beyotime, S0033) was then added to all wells, including the positive and negative controls, until a predetermined time. Diacetate (Beyotime, S0033) was added to make a final concentration of 50 nM. The cells were then incubated for 20 min. Serum-free medium or PBS buffer was used to wash the cells twice, and the cells were then imaged using an inverted fluorescence microscope.
Western blot analysis to assess relative proteins of autophagy
Glioma C6 cells were incubated on 6-well plates. After the indicated treatments, cells were washed with chilled PBS 3 times, and 100 µl of lysis buffer (Sigma, X100) supplemented with a proteinase inhibitor cocktail (Roche, 11873580001) was added to each plate. Protein was collected at 10,000 g and 4°C for 30 min, and the protein concentration was determined using a BCA Protein Assay Kit (Beyotime, P0009). Each sample was mixed with an equal amount of protein (50 μg), and after being separated by SDS-PAGE (Beyotime, P0012AC), the proteins were transferred to polyvinylidene difluoride B (PVDF) membranes. The PVDF membranes were blocked for 1 h with 5% nonfat dry milk at room temperature, and then incubated overnight with anti-LC3B (Sigma, A5316), BECN1 (Cell Signaling Technology, 2630), anti-CASP3 (Cell Signaling Technology, 3868), SQSTM1 (Cell Signaling Technology, 2531), and GAPDH (Cell Signaling Technology, 2795s). The films were then washed 3 times. After the PVDF membranes were incubated for 45 min with horseradish peroxidase (HRP)-labeled secondary antibodies (Beyotime, A0208 and A0216), ECL reagent (Pierce, 32132) was added and allowed to react for 5 min; the films were then exposed in a darkroom using an imaging system (New Life Science Products, Boston, MA, USA). The experiment was repeated at least 3 times.
Transmission electron microscopy
The tumor tissue was cut into the size of the soybean and fixed in 3% glutaraldehyde (pH 7.4) for 4 h. The sample was flushed with 0.1 M phosphate buffer (pH 7.2) twice and fixed in osmic acid for 1 h. Then the block with acetone dehydration was embedded in Epon-Araldite resin (Ted Pella, 18030). Semithin sections were made into ultrathin sections, counterstained with 3% uranyl acetate and 0.3% lead citrate. Then he cells of tumor tissue were observed with an EM420 transmission electron microscope (Philips, Eindhoven, The Netherlands).
TUNEL assay for apoptosis detection
A terminal deoxynucleotidyl transferase dUTP nick end-labeling (TUNEL) assay was performed (Promega, G3250), as described previously.46 Glioma C6 cells were incubated on 6-well plates. After the indicated treatments, cells were rinsed with PBS twice and fixed in a 4% methanol-free formaldehyde solution at 4°C for 25 min; then, 0.2% Triton X-100 (Beyotime, ST795) in PBS was used to permeabilize the cells for 5 min at room temperature. Staining was performed according to TUNEL Apoptosis Assay Kit instructions.
Establishment of in situ glioma model
After C6 cells were detached by trypsin, resuspended in serum-free culture medium, and counted, the suspensions were adjusted to a cell concentration of 1 × 10⁶ (cells)/mL. SPF male Wistar rats (200 ± 25 g) (from Shanghai Laboratory Animal Resource Center) using stereotactic technology modeling.36,47 were anesthetized by an intraperitoneal injection of 2% sodium pentobarbital, and a brain stereotaxic instrument (SR-6R; Narishige, Tokyo, Japan) was used to fix the rats heads, which were shaved with a clipper, in position. After the skin was disinfected, a midline longitudinal incision of the scalp and skull periosteum was made, and the anterior fontanelle of the head was exposed. In the anterior fontanelle, 1 mm forward and 3 mm right lateral of the midpoint, a hole in the skull approximately 1 mm in diameter was drilled with a small drill. A 10-μL microinjector was used to extract 8 μL of cell suspension solution, and then it was fixed to a stereotaxic frame for manual advance. Perpendicular to the skull plate, the needle was injected to a depth of 6.5 mm through the bone hole, where it remained for 5 min. The needle was withdrawn 0.5 mm and remained there for 5 min. The whole cell sample was injected into the head within 10 min, and then the needle remained stationary for 5 min. The cells were fully administered, and the needle was slowly and completely withdrawn over the course of 5 min. The incision was closed using bone wax, sutured, and then disinfected.
Resection of the tumor body to create a cavity for loading of nanocomposite gel
Rats were fixed on a stereotaxic frame and an incision was made about 9 to 16 mm in length along the previous surgical scar from tumor implantation. The bregma, ipsilateral coronal suture and previous burr hole were exposed by using an operating scissors to cut away the periosteum. Next, the temporalis muscle dissected from the cranium. A 5 mm by 9 mm cranial window around the burr hole was made by a high-speed drill (Dremel Inc., Racine, WI, USA). After the tumor was exposed, a Leica dissecting microscope (Leica M525 F40, Leica Microsystems, Inc. Frankfurt, Germany) was used to visualize the tumor for resection. The dissecting Leica surgical microscope with 209 magnification was used to guide a 3 F suction tip under regulated suction to slowly reduce the tumor volume up to the tumor-tissue interface, leaving margins of the dura intact. Following complete gross tumor removal, further hemostasis was obtained before nanocomposite gel administration. Finally, the incision was closed using bone wax, sutured, and then disinfected. In the whole process of tumor resection, we attempted to avoid injury to normal brain parenchyma.
Synergistic effect of nanocomposite thermoresponsive hydrogel in vivo
After 15 d, the rat orthotropic glioma model was successfully established, and the rats were randomly divided into 3 groups (i.e., cauda vein injection [no surgery] or cauda vein injection or local drug delivery [both + surgery]). Each group was randomly divided into 5 groups (n = 6): both cauda vein injection with saline treatment, PTX NP treatment, TMZ NP treatment, PTX:TMZ treatment (PTX:TMZ), or PTX:TMZ NP treatment (PTX:TMZ NPs); or local drug delivery with saline treatment (no surgery, directly by bone hole injection), surgery + saline, surgery + PTX:TMZ treatment (Sur + PTX:TMZ), surgery + PTX:TMZ NP treatment (Sur + PTX:TMZ NPs), or surgery + nanocomposite thermoresponsive hydrogel treatment (Sur + Gel). The PTX:TMZ NPs and nanocomposite thermoresponsive hydrogel were prepared according to the formulation optimized in vitro. The dosage of PTX and TMZ was determined to be 28 μg/kg and 2.8 mg/kg, respectively, according to the literature and the optimal synergistic ratio from the in vitro experiments.
To investigate the advantages of local drug delivery, cauda vein injection was used as a control. Among them, the group of rats via cauda vein injection (+surgery) administration only did the survival condition evaluation. After anesthesia, the rats were fixed in the positioning device, and the tumor tissues were carefully accessed in time to stop the bleeding. The rats were implanted with the appropriate sterile preparation once every 2 d, a total of 4 times for the drugs. The saline group was injected with normal saline using a microsyringe directly through the bone hole. The survival time of rats after inoculation was recorded, and Kaplan-Meier survival curves were drawn. Rat weight after administration was observed and plotted.
Statistical data analysis
The data were analyzed by SPSS 20 statistical software. The differences between groups were analyzed by the Student t test or analysis of variance(one-way ANOVA), and P < 0.05 was considered to be of statistical significance.
Supplementary Material
Abbreviations
- 3-MA
3-methyladenine
- BECN1
Beclin 1
- CaP
calcium/phosphate
- CASP3
caspase 3
- CI
combination index
- DCFH-DA2′
2′7′-dichlorofluorescein diacetate
- GFP
green fluorescent protein
- H&E
hematoxylin and eosin
- HPLC
high performance liquid chromatography
- LCPlipid
lipidcalcium phosphate
- MAP1LC3B/LC3B
microtubule-associated protein 1 light chain 3
- MDC
monodansylcadeverine
- mPEG-DPPE
polyethylene glycol-dipalmitoylphosphatidyle-thanolamine
- MTT
3-[4,5-dimethylthiazol-2-yl]-2,5-diphenyltetrazolium bromide
- NPs
nanoparticles
- PBS
phosphate-buffered saline
- PTX
paclitaxel
- ROS
reactive oxygen species
- SQSTM1
sequestosome 1
- TEM
transmission electron microscope
- TMZ
temozolomide
- TUNEL
terminal deoxynucleotidyl transferasemediated nick end labeling.
Disclosure of potential conflicts of interest
No potential conflicts of interest were disclosed.
Funding
This work was supported by the Natural Science Foundation of China (No.81472841, 81572999, 81502692, 14JC1492500, 51372084); State Key Laboratory of Oncogenes and Re-lated Genes (No. 91–15–08); Shanghai Municipal Health and Family Planning Commission Foundation (No. 201440015).
References
- [1].Huse JT, Holland E, DeAngelis LM. Glioblastoma: Molecular analysis and clinical implications. Annu Rev Med 2013; 64:59-70; PMID:23043492; https://doi.org/ 10.1146/annurev-med-100711-143028 [DOI] [PubMed] [Google Scholar]
- [2].Gao H, Jiang X. Progress on the diagnosis and evaluation of brain tumors. Cancer Imaging 2013; 13:466-81; PMID:24334439; https://doi.org/ 10.1102/1470-7330.2013.0039 [DOI] [PMC free article] [PubMed] [Google Scholar]
- [3].Templeton A, Hofer S, Topfer M, Sommacal A, Fretz C, Cerny T, Gillessen S. Extraneural spread of glioblastoma - Report of two cases. Onkologie 2008; 31:192-64; PMID:18418021; https://doi.org/ 10.1159/000118627 [DOI] [PubMed] [Google Scholar]
- [4].Gottardo NG, Gajjar A. Chemotherapy for Malignant brain tumors of childhood. J Child Neurol 2008; 23:1149-59; PMID:18952581; https://doi.org/ 10.1177/0883073808321765 [DOI] [PMC free article] [PubMed] [Google Scholar]
- [5].Wang Z, Chui WK, Ho PC. Nanoparticulate delivery system targeted to tumor neovasculature for combined anticancer and antiangiogenesis therapy. Pharm Res-Dordr 2011; 28:585-96; https://doi.org/ 10.1007/s11095-010-0308-2 [DOI] [PubMed] [Google Scholar]
- [6].Kim JH, Kim YS, Kim S, Park JH, Kim K, Choi K, Chung H, Jeong SY, Park RW, Kim IS, et al.. Hydrophobically modified glycol chitosan nanoparticles as carriers for paclitaxel (Reprinted from Journal of Controlled Release, vol 109, pg 1, 2005). J Control Release 2006; 111:228-34; https://doi.org/ 10.1016/j.jconrel.2005.12.013 [DOI] [PubMed] [Google Scholar]
- [7].Li J, Yang Y, Huang L. Calcium phosphate nanoparticles with an asymmetric lipid bilayer coating for siRNA delivery to the tumor. J Control Release 2012; 158:108-14; PMID:22056915; https://doi.org/ 10.1016/j.jconrel.2011.10.020 [DOI] [PMC free article] [PubMed] [Google Scholar]
- [8].Bajaj A, Rao MR, Khole I, Munjapara G. Self-nanoemulsifying drug delivery system of cefpodoxime proxetil containing tocopherol polyethylene glycol succinate. Drug Dev Ind Pharm 2013; 39:635-45; PMID:22564007; https://doi.org/ 10.3109/03639045.2012.683440 [DOI] [PubMed] [Google Scholar]
- [9].Tasdemir E. Maiuri MC, Galluzzi L, Vitale I, Djavaheri-Mergny M, D'Amelio M, Criollo A, Morselli E, Zhu C, Harper F, et al.. Regulation of autophagy by cytoplasmic p53. Nat Cell Biol 2008; 10:676-87; PMID:18454141; https://doi.org/ 10.1038/ncb1730 [DOI] [PMC free article] [PubMed] [Google Scholar]
- [10].Wang K, Klionsky DJ. Mitochondria removal by autophagy. Autophagy 2011; 7:297-300; PMID:21252623; https://doi.org/ 10.4161/auto.7.3.14502 [DOI] [PMC free article] [PubMed] [Google Scholar]
- [11].Mizushima N, Komatsu M. Autophagy: renovation of cells and tissues. Cell 2011; 147:728-41; PMID:22078875; https://doi.org/ 10.1016/j.cell.2011.10.026 [DOI] [PubMed] [Google Scholar]
- [12].Shingu T, Fujiwara K, Bögler O, Akiyama Y, Moritake K, Shinojima N, Tamada Y, Yokoyama T, Kondo S. Stage-specific effect of inhibition of autophagy on chemotherapy-induced cytotoxicity. Autophagy 2009; 5:537-9; PMID:19270491; https://doi.org/ 10.4161/auto.5.4.8164 [DOI] [PubMed] [Google Scholar]
- [13].Kondo Y, Kondo S. Autophagy and cancer therapy. Autophagy 2006; 2:85-90; PMID:16874083; https://doi.org/ 10.4161/auto.2.2.2463 [DOI] [PubMed] [Google Scholar]
- [14].Stupp R, Hegi M, Weller M. Neuro Oncol, a decade of temozolomide and beyond. Expert Rev Anticancer Ther 2010; 10:1675-7; PMID:21080792; https://doi.org/ 10.1586/era.10.161 [DOI] [PubMed] [Google Scholar]
- [15].Torres S, Lorente M, Rodríguez-Fornés F, Hernández-Tiedra S, Salazar M, García-Taboada E, Barcia J, Guzmán M, Velasco G. A Combined Preclinical Therapy of Cannabinoids and Temozolomide against Glioma. Mol Cancer Ther 2011; 10:90-103; PMID:21220494; https://doi.org/ 10.1158/1535-7163.MCT-10-0688 [DOI] [PubMed] [Google Scholar]
- [16].Marupudi NI, Han JE, Li KW, Renard VM, Tyler BM, Brem H. Paclitaxel: a review of adverse toxicities and novel delivery strategies. Expert Opin Drug Saf 2007; 6:609-21; PMID:17877447; https://doi.org/ 10.1517/14740338.6.5.609 [DOI] [PubMed] [Google Scholar]
- [17].Chi EY, Viriyapak B, Kwack HS, Lee YK, Kim SI, Lee KH, Park TC. Regulation of paclitaxel-induced programmed cell death by autophagic induction: A model for cervical cancer. Obstet Gynecol Sci 2013; 56(2):84-92; PMID:24327986; https://doi.org/ 10.5468/OGS.2013.56.2.84 [DOI] [PMC free article] [PubMed] [Google Scholar]
- [18].Azzabi A, Hughes A, Calvert P, Plummer ER, Todd R, Griffin MJ, Lind MJ, Maraveyas A, Kelly C, Fishwick K, et al.. Phase I study of temozolomide plus paclitaxel in patients with advanced malignant melanoma and associated in vitro investigations. Br J Cancer 2005; 92:1006-12; PMID:15756276; https://doi.org/ 10.1038/sj.bjc.6602438 [DOI] [PMC free article] [PubMed] [Google Scholar]
- [19].Liebmann JE, Fisher J, Teague D, Cook JA. Sequence Dependence of Paclitaxel (Taxol(R)) Combined with Cisplatin or Alkylators in human cancer-cells. Oncol Res 1994; 6:25-31; PMID:7919549 [PubMed] [Google Scholar]
- [20].Voss V, Senft C, Lang V, Ronellenfitsch MW, Steinbach JP, Seifert V, Kögel D. The Pan-Bcl-2 Inhibitor (−)-Gossypol Triggers Autophagic cell death in Malignant Glioma. Mol Cancer Res 2010; 8:1002-16; PMID:20587533; https://doi.org/ 10.1158/1541-7786.MCR-09-0562 [DOI] [PubMed] [Google Scholar]
- [21].Wallner KE, Galicich JH, Krol G, Arbit E, Malkin MG. Patterns of failure following treatment for glioblastoma multiforme and anaplastic astrocytoma. Int J Radiat Oncol Biol Phys 1989; 16:1405-9; PMID:2542195; https://doi.org/ 10.1016/0360-3016(89)90941-3 [DOI] [PubMed] [Google Scholar]
- [22].Lawson HC, Sampath P, Bohan E, Park MC, Hussain N, Olivi A, Weingart J, Kleinberg L, Brem H. Interstitial chemotherapy for malignant gliomas: the Johns Hopkins experience. J Neuro-Oncol 2007; 83:61-70; https://doi.org/ 10.1007/s11060-006-9303-1 [DOI] [PMC free article] [PubMed] [Google Scholar]
- [23].Cavaliere R, Wen PY, Schiff D. Novel therapies for malignant gliomas. Neurol Clin 2007; 25:1141; PMID:17964029; https://doi.org/ 10.1016/j.ncl.2007.07.012 [DOI] [PubMed] [Google Scholar]
- [24].Bodell WJ, Bodell AP, Giannini DD. Levels and distribution of BCNU in GBM tumors following intratumoral injection of DTI-015 (BCNU-ethanol). Neuro-Oncology 2007; 9:12-19; PMID:17018699; https://doi.org/ 10.1215/15228517-2006-014 [DOI] [PMC free article] [PubMed] [Google Scholar]
- [25].Nie S, Hsiao WL, Pan W, Yang Z. Thermoreversible Pluronic F127-based hydrogel containing liposomes for the controlled delivery of paclitaxel: in vitro drug release, cell cytotoxicity, and uptake studies. Int J Nanomed 2011; 6:151-66; PMID:21499415 [DOI] [PMC free article] [PubMed] [Google Scholar]
- [26].Ahmed M, Liu Z, Lukyanov AN, Signoretti S, Horkan C, Monsky WL, Torchilin VP, Goldberg SN, et al.. Combination radiofrequency ablation with intratumoral liposomal doxorubicin: Effect on drug accumulation and coagulation in multiple tissues and tumor types in animals. Radiology 2005; 235:469-77; PMID:15858089; https://doi.org/ 10.1148/radiol.2352031856 [DOI] [PubMed] [Google Scholar]
- [27].Chou TC, Talalay P. Quantitative-Analysis of Dose-effect relationships - the combined effects of multiple-drugs or enzyme-inhibitors. Adv Enzyme Regul 1984; 22:27-55; PMID:6382953; https://doi.org/ 10.1016/0065-2571(84)90007-4 [DOI] [PubMed] [Google Scholar]
- [28].LeGeros RZ. Calcium phosphate-based osteoinductive materials. Chem Rev 2008; 108:4742-53; PMID:19006399; https://doi.org/ 10.1021/cr800427g [DOI] [PubMed] [Google Scholar]
- [29].Li J, Yang Y, Huang L. Calcium phosphate nanoparticles with an asymmetric lipid bilayer coating for siRNA delivery to the tumor. J Control Release 2012; 158:108-14; PMID:22056915; https://doi.org/ 10.1016/j.jconrel.2011.10.020 [DOI] [PMC free article] [PubMed] [Google Scholar]
- [30].Jakubowicz-Gil J, Langner E, Rzeski W. Kinetic studies of the effects of Temodal and quercetin on astrocytoma cells. Pharmacol Rep 2011; 63:403-16; PMID:21602595; https://doi.org/ 10.1016/S1734-1140(11)70506-0 [DOI] [PubMed] [Google Scholar]
- [31].Bodine SC, Stitt TN, Gonzalez M, Kline WO, Stover GL, Bauerlein R, Zlotchenko E, Scrimgeour A, Lawrence JC, Glass DJ, et al.. Akt/mTOR pathway is a crucial regulator of skeletal muscle hypertrophy and can prevent muscle atrophy in vivo. Nat Cell Biol 2001; 3:1014-9; PMID:11715023; https://doi.org/ 10.1038/ncb1101-1014 [DOI] [PubMed] [Google Scholar]
- [32].Kohn AD, Takeuchi F, Roth RA. Akt, a pleckstrin homology domain containing kinase, is activated primarily by phosphorylation. J Biol Chem 1996; 271:21920-6; PMID:8702995; https://doi.org/ 10.1074/jbc.271.36.21920 [DOI] [PubMed] [Google Scholar]
- [33].Klionsky DJ, Abdalla FC, Abeliovich H, Abraham RT, Acevedo-Arozena A, Adeli K, Agholme L, Agnello M, Agostinis P, Aguirre-Ghiso JA, et al.. Guidelines for the use and interpretation of assays for monitoring autophagy. Autophagy 2012; 8:445-544; PMID:22966490; https://doi.org/ 10.4161/auto.19496 [DOI] [PMC free article] [PubMed] [Google Scholar]
- [34].Markovic Z, Todorovic-Markovic B, Kleut D, Nikolic N, Vranjes-Djuric S, Misirkic M, Vucicevic L, Janjetovic K, Isakovic A, Harhaji L, et al.. The mechanism of cell-damaging reactive oxygen generation by colloidal fullerenes. Biomaterials 2007; 28:5437-48; PMID:17884160; https://doi.org/ 10.1016/j.biomaterials.2007.09.002 [DOI] [PubMed] [Google Scholar]
- [35].Dewaele M, Martinet W, Rubio N, Verfaillie T, de Witte PA, Piette J, Agostinis P. Autophagy pathways activated in response to PDT contribute to cell resistance against ROS damage. J Cell Mol Med 2011; 15:1402-14; PMID:20626525; https://doi.org/ 10.1111/j.1582-4934.2010.01118.x [DOI] [PMC free article] [PubMed] [Google Scholar]
- [36].Xie H, Zhu Y, Zhu W, Zhao Y, Xu H, Yang X. pH/temperature sensitive magnetic nanogels conjugated with Cy5.5-labled lactoferrin for MR and fluorescence imaging of glioma in rats. Biomaterials 2013; 34:7418-28; PMID:23810255; https://doi.org/ 10.1016/j.biomaterials.2013.05.078 [DOI] [PubMed] [Google Scholar]
- [37].Neyns B, Sadones J, Joosens E, Bouttens F, Verbeke L, Baurain JF, D'Hondt L, Strauven T, Chaskis C, In't Veld P, et al.. Stratified phase II trial of cetuximab in patients with recurrent high-grade glioma. Annals Oncol 2009; 20:1596-603; https://doi.org/ 10.1093/annonc/mdp032 [DOI] [PubMed] [Google Scholar]
- [38].Ricci EJ, Bentley MVLB, Farah M, Bretas RES, Marchetti JM. Rheological characterization of Poloxamer 407 lidocaine hydrochloride gels. Eur J Pharm Sci 2002; 17:161-7; PMID:12393144; https://doi.org/ 10.1016/S0928-0987(02)00166-5 [DOI] [PubMed] [Google Scholar]
- [39].Barichello JM, Morishita M, Takayama K, Nagai T. Absorption of insulin from Pluronic F-127 gels following subcutaneous administration in rats. Int J Pharmaceutics 1999; 184:189-98; PMID:10387948; https://doi.org/ 10.1016/S0378-5173(99)00119-2 [DOI] [PubMed] [Google Scholar]
- [40].Wang Y, Yu L, Han L, Sha X, Fang X. Difunctional Pluronic copolymer micelles for paclitaxel delivery: synergistic effect of folate-mediated targeting and Pluronic-mediated overcoming multidrug resistance in tumor cell lines. Int J Pharmaceutics 2007; 337:63-73; PMID:17289311; https://doi.org/ 10.1016/j.ijpharm.2006.12.033 [DOI] [PubMed] [Google Scholar]
- [41].Jedynak L, Puchalska M, Zezula M, Łaszcz M, Łuniewski W, Zagrodzka J. Stability of sample solution as a crucial point during HPLC determination of chemical purity of temozolomide drug substance. J Pharmaceut Biomed 2013; 83:19-27; https://doi.org/ 10.1016/j.jpba.2013.04.032 [DOI] [PubMed] [Google Scholar]
- [42].Rahman M, Azari H, Deleyrolle L, Millette S, Zeng H, Reynolds BA. Controlling tumor invasion: bevacizumab and BMP4 for glioblastoma. Future Oncol 2013; 9:1389-96; PMID:23980685; https://doi.org/ 10.2217/fon.13.96 [DOI] [PubMed] [Google Scholar]
- [43].Zhao Z, Wang J, Mao HQ, Leong KW. Polyphosphoesters in drug and gene delivery. Adv Drug Deliver Rev 2003; 55:483-99; https://doi.org/ 10.1016/S0169-409X(03)00040-1 [DOI] [PubMed] [Google Scholar]
- [44].Cho YW, Lee J, Lee SC, Huh KM, Park K. Hydrotropic agents for study of in vitro paclitaxel release from polymeric micelles. J Control Release 2004; 97:249-57; PMID:15196752; https://doi.org/ 10.1016/j.jconrel.2004.03.013 [DOI] [PubMed] [Google Scholar]
- [45].Han YC, He Z, Schulz A, Bronich TK, Jordan R, Luxenhofer R, Kabanov AV. Synergistic Combinations of Multiple Chemotherapeutic Agents in High Capacity Poly(2-oxazoline) Micelles. Mol Pharmaceut 2012; 9:2302-13 [DOI] [PMC free article] [PubMed] [Google Scholar]
- [46].Schroeder F, Gallegos AM, Atshaves BP, Storey SM, McIntosh AL, Petrescu AD, Huang H, Starodub O, Chao H, Yang H, et al.. Recent advances in membrane microdomains: Rafts, caveolae, and intracellular cholesterol trafficking. Exp Biol Med 2001; 226:873-90 [DOI] [PubMed] [Google Scholar]
- [47].Gao JQ, Lv Q, Li LM, Tang XJ, Li FZ, Hu YL, Han M. Glioma targeting and blood-brain barrier penetration by dual-targeting doxorubincin liposomes. Biomaterials 2013; 34:5628-39; PMID:23628475; https://doi.org/ 10.1016/j.biomaterials.2013.03.097 [DOI] [PubMed] [Google Scholar]
Associated Data
This section collects any data citations, data availability statements, or supplementary materials included in this article.