

ABSTRACT
Excess triglyceride (TG) accumulation in the liver underlies fatty liver disease, a highly prevalent ailment. TG occurs in the liver sequestered in lipid droplets, the major lipid storage organelle. Lipid droplets are home to the lipid droplet proteins, the most abundant of which are the perilipins (PLINs), encoded by 5 different genes, Plin1 to Plin5. Of the corresponding gene products, PLIN2 is the only constitutive and ubiquitously expressed lipid droplet protein that has been used as a protein marker for lipid droplets. We and others reported that plin2−/− mice have an ∼60% reduction in TG content, and are protected against fatty liver disease. Here we show that PLIN2 overexpression protects lipid droplets against macroautophagy/autophagy, whereas PLIN2 deficiency enhances autophagy and depletes hepatic TG. The enhanced autophagy in plin2−/− mice protects against severe ER stress-induced hepatosteatosis and hepatocyte apoptosis. In contrast, hepatic TG depletion resulting from other genetic and pharmacological manipulations has no effect on autophagy. Importantly, PLIN2 deficiency lowers cellular TG content in wild-type mouse embryonic fibroblasts (MEFs) via enhanced autophagy, but does not affect cellular TG content in atg7−/− MEFs that are devoid of autophagic function. Conversely, adenovirus-shAtg7-mediated hepatic Atg7 knockdown per se does not alter the hepatic TG level, suggesting a more complex regulation in vivo. In sum, PLIN2 guards its own house, the lipid droplet. PLIN2 overexpression protects against autophagy, and its downregulation stimulates TG catabolism via autophagy.
KEYWORDS: ADRP, autophagy, hepatic TG, lipophagy, neutral lipase, PLIN2
Introduction
Intracellular lipid droplets constitute a major energy reserve in the liver; dysregulation of hepatic lipid droplets and cellular triglyceride (TG) content occurs in different disease states, including fatty liver disease, obesity, and type 2 diabetes. Hepatic TG homeostasis is maintained through a dynamic equilibrium of lipid import, secretion, synthesis, lipolysis, and oxidation.1 Traditionally, the cytosolic neutral lipases are considered the major regulators of hepatic TG degradation.2 Notably, however, the neutral lipases, LIPE/HSL (lipase, hormone sensitive) and PNPLA2/ATGL (patatin-like phospholipase domain containing 2), are expressed at very low levels in the liver.2,3 Loss of Lipe in Lepob/ob mice leads to massive cholesteryl ester (CE) accumulation but no change in hepatic TG or total TG lipase activity.4 Genetic inactivation of the other neutral lipase, Pnpla2, produces a ∼3-fold increase in liver TG content.5 An acid lipase called LIPA/LAL (lysosomal acid lipase A) localizes in the lysosome. As a CE hydrolase, LIPA catabolizes extracellular lipoproteins after endocytosis;6 mutations in LIPA underlie CE storage disease.7-9 In addition to its CE hydrolase activity, LIPA also possesses TG lipase activity. Intriguingly, inactivation of Lipa in mice leads to a massive (5–10-fold) accumulation of hepatic TG,7 indicating that LIPA is quantitatively more important than PNPLA2 in lipid homeostasis in the liver. One mechanism whereby LIPA regulates hepatic TG homeostasis is via lysosomal degradation, a pathway integral to macroautophagy (henceforth referred to as autophagy).10,11
Autophagy is a catabolic function that degrades proteins and organelles. Perturbed autophagy has been implicated in a wide range of diseases, including cancer,12 neurodegeneration,13 diabetes,14,15 and aging.16,17 Recently, Singh et al. identified an autophagy-mediated lipolytic function that involves the LIPA pathway, for which they coined the term “lipophagy.”10 The autophagosomal protein MAP1LC3/LC3 (microtubule-associated protein 1 light chain 3) associates with lipid droplets in the apparent absence of an autophagosomal membrane;10,18,19 it has been suggested that LC3 may function in lipid droplet recognition.20
Lipid droplets are the major lipid storage organelle and home to the lipid droplet proteins, the most abundant of which are the perilipins (PLINs) encoded by 5 different genes, Plin1 to Plin5.21,22 Of the corresponding gene products, PLIN2 is the only constitutive lipid droplet protein that is ubiquitously expressed,23 and the PLIN2 expression level seems to correlate with TG content and lipid droplet density.24 We reported that plin2−/− mice have an ∼60% reduction in TG content, and are protected against fatty liver development,25 a finding that was subsequently corroborated by studies in other laboratories.26,27 Inactivation of Plin2 in Lepob/ob mice ameliorates hepatosteatosis, enhances insulin sensitivity and improves glucose homeostasis in these animals.25 Hepatic lipid uptake and de novo lipogenesis are unchanged in plin2−/− mice, which display a minimally increased rate of TG secretion that is insufficient to account for a marked 60% reduction in hepatic TG content.25,28 We hypothesize that, as a ubiquitously expressed lipid droplet protein, PLIN2 protects lipid droplets from autophagy- and LIPA-mediated lipolysis in the liver, and its downregulation causes catabolic hepatic TG depletion through upregulated autophagy.
Results
PLIN2 regulates hepatic TG independent of MTTP (microsomal triglyceride transfer protein)
Nonalcoholic fatty liver disease entails the excessive accumulation of fat, mostly in the form of TG, in the liver. We previously created plin2−/− mice,25 which display a marked reduced hepatic TG. plin2−/− mice also show a modest increase in MTTP and very low-density lipoprotein (VLDL) secretion in the absence of changes in hepatic lipogenesis, lipid uptake, or β-oxidation.25 MTTP is required for the proper lipidation of APOB (apolipoprotein B) and, hence, enhanced MTTP protein expression could potentially lower hepatic TG via enhanced VLDL-TG secretion. To determine the role of MTTP, we treated mice with an MTTP inhibitor, CP346086.29 Although the treatment increased hepatic TG content in both wild-type (WT) and plin2−/− mice (Fig. 1A), the reduced hepatic TG in the plin2−/− compared with WT mice persisted, indicating that the difference in hepatic TG content between the 2 genotypes was not related to differences in VLDL secretion.
Figure 1.
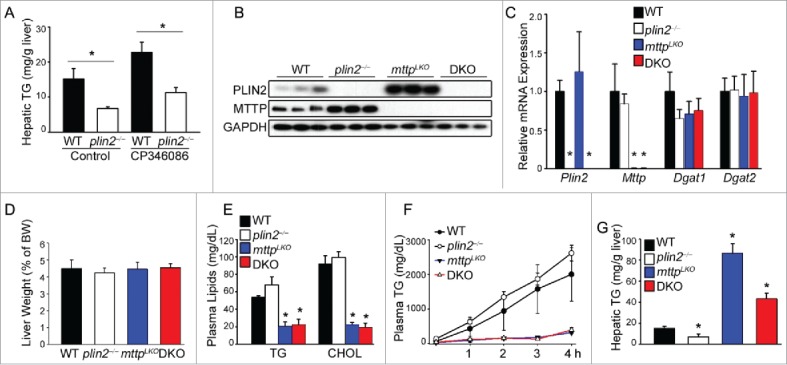
Plin2 regulates hepatic TG independently of MTTP (microsomal triglyceride transfer protein). (A) Mice were given CP346086 (10 mg/kg body weight) or vehicle once daily for 5 d. Mice (n = 4) were killed 2 h after the last dose and liver removed for TG measurement by thin-layer chromatography. (B) Immunoblot of liver homogenates of WT, plin2−/−, Mttp liver-specific knockout (mttpLKO), and plin2 and mttp double knockout (DKO) mice. (C) Expression of hepatic Plin2, Mttp, Dgat1, and Dgat2 assessed by real-time RT-PCR using liver RNA from WT, plin2−/−, mttpLKO, and DKO mice (n = 6). Liver weight (D), plasma TG and cholesterol (CHOL) (E), hepatic VLDL secretion rate (F), and hepatic TG content (G) of the indicated mouse genotypes (n = 6). VLDL secretion was deduced by injecting Pluronic F127 (an inhibitor of VLDL catabolism) i.p. to mice and measuring plasma TG before (0 h) and hourly after injection (n = 6). *, p < 0.05 compared with the WT control.
To corroborate data using CP346086, we crossed plin2−/− mice with liver-specific mttp−/− (mttpLKO) mice to produce double-knockout (DKO) mice. DKO mice have lost both PLIN2 and MTTP proteins in the liver whereas mttpLKO mice, which lack MTTP protein, displayed increased hepatic PLIN2 protein (Fig. 1B), although Plin2 mRNA levels remained unchanged (Fig. 1C). Indeed, Mttp mRNA levels were similar in WT and plin2−/− mice. In addition, Dgat1 and Dgat2 mRNA levels were similar among the 4 genotypes (Fig. 1C), as were liver weights (Fig. 1D). Notably, plasma TG and cholesterol levels were lower in mttpLKO and DKO mice relative to WT (Fig. 1E). VLDL secretion rate was mildly increased in the plin2−/− mice as compared with WT, but was completely suppressed in both the mttpLKO and DKO mice (Fig. 1F). The inhibition of VLDL secretion led to hepatosteatosis in both mttpLKO and DKO mice. Importantly, however, the hepatic TG content in the DKO mice was ∼50% lower than that in mttpLKO mice (Fig. 1G). A major difference between mttpLKO and DKO mice was that mttpLKO mice expressed increased amounts of PLIN2 protein over WT, whereas DKO mice did not produce any PLIN2 in the liver (Fig. 1B). The changes in hepatic TG content produced by these pharmacological and genetic manipulations indicate the existence of additional biological processes that underlie the marked loss of hepatic TG in the absence of PLIN2 that are independent of its effect on MTTP expression and VLDL secretion.
Plin2 knockout mice display elevated autophagy in the liver
Autophagy is a major regulator of hepatic TG.10 To determine whether activated autophagy mediates the reduction in hepatic TG in plin2−/− mice, we performed an immunoblotting analysis of autophagy markers in the liver. The level of LC3-II, a marker of committed autophagosome formation, was found to be increased in the total liver protein extract of the plin2−/− mice (Fig. 2A), and, conversely, the level of SQSTM1/p62 (sequestosome 1), a downstream marker of autophagic flux, was decreased in plin2−/− mice. The combination of elevated LC3-II and reduced SQSTM1 protein level suggests increased hepatic autophagic flux in plin2−/− compared with WT mice.30 Administration of chloroquine (CQ) through intraperitoneal (i.p.) injection, which blocks lysosomal digestion of cargos at this last stage of autophagy, suppressed autophagic flux and raised the level of both LC3-II and SQSTM1 (Fig. 2A). The LC3-II:GAPDH ratio was higher in the plin2−/− compared with the WT hepatocytes with or without CQ treatment (Fig. 2B), while the SQSTM1:GAPDH ratio was lower in plin2−/− hepatocytes but became comparable to the WT after CQ treatment (Fig. 2C). As in the in vivo situation, isolated plin2−/− primary hepatocytes also exhibited increased LC3-II and reduced SQSTM1 (Fig. 2D).
Figure 2.
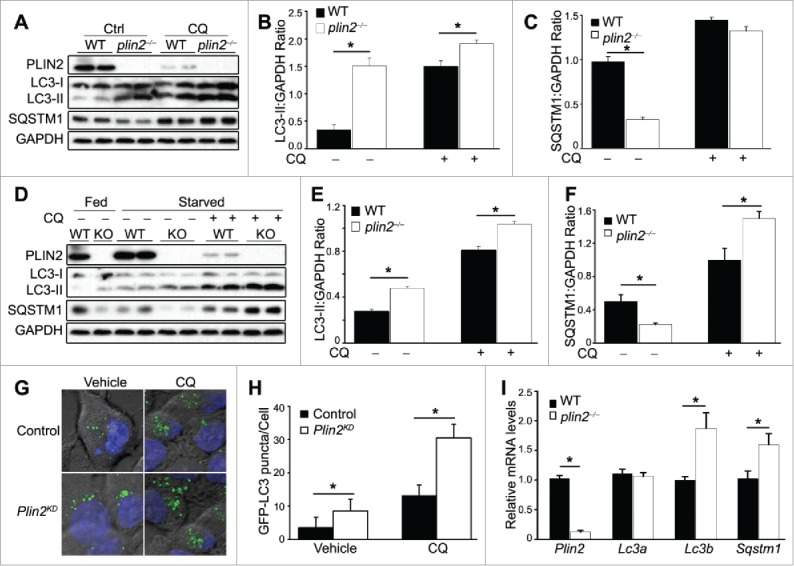
plin2−/− mice display elevated autophagy in the liver. (A) Immunoblot of liver homogenates of WT and plin2−/− mice (2 representatives shown) with or without chloroquine (CQ) treatment (CQ 100 µM). Quantification of ratios of LC3-II:GAPDH (B) and SQSTM1:GAPDH (C) using immunoblots shown in (A) (n = 6). (D) Immunoblot of primary hepatocytes isolated from WT and plin2−/− mice that were grown in normal medium (Fed) or serum-deprived media for 6 h (Starved) with or without chloroquine (CQ 100 μM) (1 to 2 representatives shown). Quantification of ratios of LC3-II:GAPDH (E) and SQSTM1:GAPDH (F) using immunoblots shown in (D) (n = 6). Representative images (G) and quantification (H) of GFP-LC3 puncta in McArdle RH-7777 control or Plin2 knockdown (Plin2KD) cells transiently transfected with GFP-LC3 plasmid, and treated with vehicle or 100 μM CQ for 6 h. (n = 5). *, p < 0.05 between WT and plin2−/− mice. Quantitative RT-PCR analysis of Plin2, Lc3a, Lc3b and Sqstm1 mRNA expression in the liver tissues (I) isolated from WT or plin2−/− mice (n = 4), with or without Plin2 knockdown or overexpression (n = 4).
Nutrient deprivation, a known autophagy activator, was found to lead to increased LC3-II and decreased SQSTM1 in both WT and plin2−/− hepatocytes; notably, the LC3-II level in plin2−/− hepatocytes remained consistently higher, and SQSTM1 consistently lower, in plin2−/− than in WT cells (Fig. 2 D). The addition of CQ, again, raised the levels of both LC3-II and SQSTM1 (Fig. 2D). Importantly, the level of LC3-II and SQSTM1 were both higher in the plin2−/− compared with WT hepatocytes, a finding that was also borne out by comparing the LC3-II:GAPDH and SQSTM1:GAPDH ratios (Fig. 2E and F). These findings are consistent with an increase in autophagic flux in hepatocytes that lack PLIN2.
We next generated stable lentivirus shRNA-mediated Plin2-knockdown (Plin2KD) rat hepatoma (McArdle RH 7777) cells (Fig. S1A) and transfected control (scrambled shRNA-treated parental) and Plin2KD McArdle cells with a GFP-LC3 fusion plasmid. Under the fluorescence microscope, puncta of GFP-LC3 fusion protein marked autophagosomes in these cells.31 Under basal conditions, there were twice as many GFP-LC3 puncta in Plin2KD as in control McArdle cells (Fig. 2G). Upon addition of CQ, the number of puncta increased in both types of cells, but Plin2KD consistently displayed approximately 2 times more puncta compared with scrambled shRNA-treated McArdle cells (Fig. 2G and H), consistent with a higher autophagic flux under conditions of Plin2 knockdown.
We noted a reduction of PLIN2 protein upon CQ administration both in vivo (Fig. 2A) and in vitro (Fig 2D). We monitored Plin2 transcripts by qRT-PCR in these conditions using McArdle cells, but did not find a difference in Plin2 mRNA level with or without CQ administration (Fig. S2 A and B) suggesting that this was a posttranscriptional response to CQ.
The level of the autophagosome protein LC3 is a balance between its production and autophagic flux-mediated degradation. The effects of autophagy inhibitors such as CQ are informative, as induction of LC3 accumulation infers increased flux. We complemented the immunoblotting data with the quantification of Lc3 mRNA expression to ascertain if the increased protein concentration was the result of increased gene expression. We assessed both LC3A and LC3B isoforms. By qRT-PCR, we found that the levels of Lc3a transcripts were unchanged, whereas those of Lc3b transcripts were increased about 2-fold, in plin2−/− liver (Fig 2I). We obtained similar results in 2 hepatic cell lines (Fig. S3 A and B). It is interesting that, despite a lower level of SQSTM1 protein in plin2−/− liver, there was actually an increase in Sqstm1 transcripts (Fig. 2I), suggesting an enhanced SQSTM1 basal expression in the absence of PLIN2. This also goes along with the higher SQSTM1 level in the starved CQ-treated plin2−/− liver cells (Fig. 2F). Taken together, these data indicate that the change of LC3-II in Plin2-deficient hepatocytes is the result of an increased mRNA expression, while the change in SQSTM1 was related to changes in SQSTM1 protein degradation. It is noteworthy that LC3-I levels were comparable in WT and plin2−/− hepatocytes, while the LC3-II level was elevated in the latter group, suggesting enhancement of LC3-I processing and lipidation to LC3-II, committing the cell to autophagosome formation, occurred in plin2−/− hepatocytes.
Changes in cellular TG content per se do not modulate autophagy
plin2−/− mice display reduced basal hepatic TG content.25 It is possible that cells may sense depletion of TG content as a state of nutrient deprivation, which leads to the stimulation of autophagy. We therefore examined the effect of alternative ways to lower liver TG content to determine if reduced hepatic TG content per se affects hepatic autophagy.
We first examined the neutral lipases present in the liver tissues of WT and plin2−/− mice under fed and starvation (16 h fasted) conditions. From the total liver homogenate, the levels of the PNPLA2, total LIPE (t-LIPE) and phospho-LIPE (p-LIPE) were not different between WT and plin2−/− mice (Fig. S4A). The PNPLA2 level was higher under starvation conditions. It is noteworthy that, in agreement with the literature,2 the levels of the neutral lipases in the liver were extremely low compared with those in the white adipose tissue. We further isolated the lipid droplet (LD) fraction from the liver homogenate. Immunoblot analysis of LD proteins (Fig. S4B) revealed that the level of PNPLA2 on the LD was similar in the WT and plin2−/− mice (Fig. S4B), whereas LD-associated t-LIPE and p-LIPE levels were substantially lower in the plin2−/− compared with WT mice. PNPLA2 and LIPE were not detectable in the LD samples from starved mice (Fig. S4B); however, this may be due to the fact that a much smaller fraction of the isolated LD compartment from the livers of the starved mice was applied to the analysis compared with those from the fed conditions as the former samples had much higher hepatic TG content due to starvation.
Because the PNPLA2 and LIPE levels were very low in the liver, we examined whether overexpressing PNPLA2 and LIPE would change hepatic TG levels as well as autophagy. PNPLA2 or LIPE adenovirus transduction markedly reduced hepatic TG by ∼50% (Fig. 3A). Immunoblot analysis revealed that PNPLA2 and LIPE protein were both expressed at high levels in the transduced McArdle cells. There was, however, no difference in the level of LC3-I:LC-II, or SQSTM1, in PNPLA2- or LIPE-overexpressing cells vs. control YFP cells (Fig. 3B). Furthermore, inhibition of LIPA by Lalistat2 had no effect on the TG content of these cells (Fig. 3A), indicating that autophagy was not activated in the TG-depleted cells.
Figure 3.
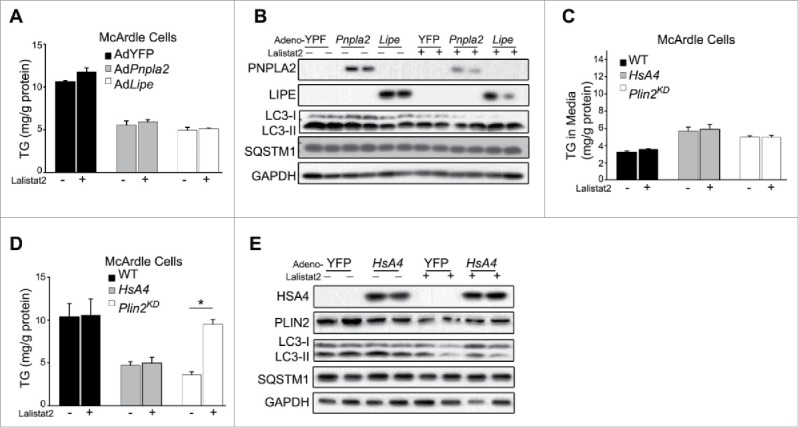
Changes in cellular TG content per se do not modulate autophagy (A) Cellular TG levels of McArdle cells overexpressing YFP control (Ad-YFP) or PNPLA2 (AdPnpla2), or LIPE (AdLipe) transduced with the respective adenovirus vectors (MOI = 10) for 48 h +/− Lalistat2. (B) Immunoblot of McArdle RH7777 cells studied as outlined in (A). TG secreted into the medium (C) or cellular TG retained in the McArdle RH-7777 cells (D) that were either control (WT), or Plin2 knockdown (Plin2KD), or overexpressing human APOA4 (HsA4) using an adenoviral vector (MOI = 10) for 48 h +/−Lalistat2. (E) Immunoblot of McArdle RH7777 cells studied as outlined in ((C)and D). TG levels were analyzed by enzymatic kits. *, p < 0.05.
Previous reports indicated that overexpression of APOA4/apoA-IV in McArdle RH-7777 cells stimulated TG secretion and reduced cellular TG content and that adenovirus (AdHsA4)-mediated hepatic APOA4 overexpression in vivo phenocopies genetic loss of Plin2 because it simultaneously increases VLDL secretion and lowers hepatic TG.32 To study the potential role of altered autophagy in the reduced TG content of APOA4-overexpressing hepatocytes, we examined the consequence of transduction of AdHsA4 on cellular TG dynamics. This manipulation led to human APOA4 overexpression in McArdle cells; the treatment enhanced TG secretion in the culture media (Fig. 3C), and reduced the cellular TG content by ∼60% (Fig. 3D, gray bars). In contrast to Lalistat2-mediated restoration of TG as observed in Plin2KD cells (Fig. 3D, open bars), LIPA inhibition had no effect on the TG content of AdHsA4-treated cells (Fig. 3D, gray bars), indicating that LIPA, a lysosomal lipolytic enzyme that is integral to lipophagy,10 does not mediate hepatic TG depletion during APOA4 overexpression. Indeed, immunoblot analysis of hepatic LC3 and SQSTM1 revealed no change in the level of these autophagy markers with or without APOA4 overexpression (Fig. 3E). Therefore, induced hepatocellular TG depletion in yet another model, which also displays increased VLDL secretion, does not activate lipophagy.
Loss of PLIN2 does not affect mitophagy
To determine if loss of PLIN2 also affects other types of autophagy in liver cells, we studied its effect on mitophagy. We first examined the mitochondrial protein TIMM23 in WT and plin2−/− cells by immunoblotting and found the level of TIMM23 to be comparable in WT and plin2−/− primary hepatocytes (Fig. 4A and B). Addition of FCCP (a mitophagy stimulator) lowered the amount of TIMM23 protein, presumably due to mitophagy induction, but the effect of FCCP was similar in WT and plin2−/− hepatocytes (Fig. 4A and B). Similarly, the content of mitochondrial DNA relative to that of nuclear DNA did not differ between WT and plin2−/− hepatocytes in the absence or presence of FCCP (Fig. 4C). These results suggest that mitophagy is not affected by loss of PLIN2 in mouse hepatocytes.
Figure 4.
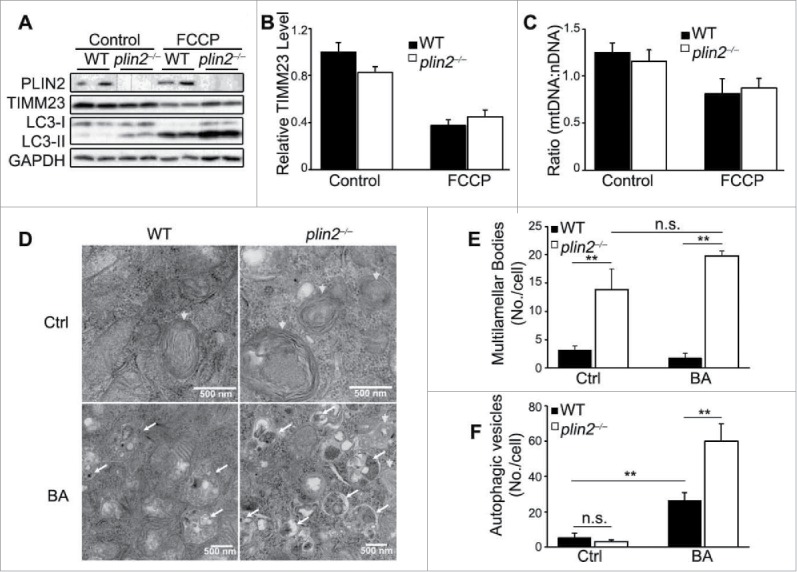
Plin2 deficiency does not alter mitophagy, but elevates autophagic flux. (A) Immunoblot of primary hepatocytes isolated from WT and plin2−/− mice that were treated with or without FCCP (10 μM) for 6 h. (B) Quantification of ratios of TIMM23:GAPDH using immunoblots shown in (A) (n = 6). (C) Real-time PCR of mitochondrial (mt-Rnr2/16S rRNA) to nuclear DNA (Hk/hexokinase) ratio (n = 6). (D) Electron microscopy imaging of control or plin2−/− AML12 generated by CRISPR technology that are treated with bafilomycin A1 (BA) or with vehicle (Ctrl). Arrowheads, multilamellar bodies (MLB), a special kind of autophagosomes; arrows, autophagic vesicles. Quantitative analysis of MLB (E) and Autophagic vesicles (F) (n = 6). n.s., not significant.
Morphological and biochemical analysis of Plin2+/+ and plin2−/− hepatocytes
We used electron microscopy to examine the morphology in AML12 mouse hepatoma and plin2−/− AML12 cells (inactivated by CRISPR, see Materials and Methods). Under normal growth conditions, there were hardly any autophagosomes discernable in either type of cells. Upon close examination, the plin2−/− AML12 cells were found to display a substantial number of multilamellar bodies (Fig. 4D, arrowheads). Multilamellar bodies are considered a type of autophagic vacuoles;33 they were about 4-fold more abundant in plin2−/− than in Plin2+/+ AML12 cells. Autophagosomes were detectable, but their numbers were low and not different in plin2−/− or Plin2+/+ AML12 cells under basal conditions.
We next treated the AML12 cells with bafilomycin A1 (BA), an autophagy inhibitor which prevents acidification of lysosomes and fusion of autophagosomes with lysosomes.34 We found that BA caused no significant change in the number of multilamellar bodies, which remained much higher in plin2−/− than in plin2+/+ AML12 cells (Fig, 4E). Conversely, BA stimulated the accumulation of autophagic vesicles (Fig. 4D, arrows) in both types of cells; the increase in the number of autophagic vesicles was significantly more pronounced in plin2−/− than in Plin2+/+ cells (Fig. 4F).
The association of the autophagy marker LC3 with LD has been reported previously.18,19,35 We observed that only LC3-II, the marker committed to autophagosome formation, was enriched on LD and this enrichment was enhanced upon fasting (Fig. S5A). PLIN2 was also enriched on LD under starvation; however, the level of the LD-associated PLIN3 and PLIN5 was not affected by starvation (Fig. S5A), although both LD proteins were enriched in the plin2−/− compared with WT mice (we noted that tunicamycin (TM) treatment, which also elevates hepatic TG, did increase the LD-associated PLIN3 and PLIN5 in the liver; data not shown, but see below). The level of LC3-II on the LD of the plin2−/− mice was further increased compared with the Plin2+/+ mice (Fig. S5A). To examine whether the LD proteins were “packaged” along with the autophagosome we isolated the autophagosome/autolysome fractions of the cell in WT AML12 cells using differential centrifugation. PLIN2 and PLIN3 were readily detectable in the autophagosome (AVs) and lysosome (Lys) compartments (Fig. S5B), and their abundance in these compartments increased upon nutrient deprivation, a condition associated with increased autophagy (Fig. S5B).
PLIN2 overexpression protects against, and PLIN2 deficiency stimulates, autophagy
We postulated that plin2−/− mice have markedly reduced hepatic TG content because of enhanced autophagy. In the following series of experiments, we characterized TG homeostasis in different hepatocyte cell lines, including lines that had been engineered to over- and underproduce PLIN2.
We examined the TG dynamics in (i) Plin2 expression cassette-transfected overexpression (Plin2o/e), (ii) parental, and (iii) Plin2-knockdown (Plin2KD), McArdle cells. We incubated these cells in the presence of BSA-conjugated oleic acid for 16 h, washed them and measured the cellular TG content at 0, 4, and 8 h. The cellular TG level was highest at time 0, and declined almost linearly for 8 h in all 3 groups. Plin2KD cells displayed the steepest rate, WT cells an intermediate rate, and Plin2o/e cells the slowest rate of decline in cellular TG (Fig. 5A and B). Treatment with BA inhibited and equalized the TG turnover rate in parental and Plin2KD to that seen in Plin2o/e McArdle cells, which were not detectably affected by the treatment (Fig. 5A and B). Similar results were obtained from AML12 hepatocytes, which lack Mttp (Fig. S6) and do not secrete VLDL, indicating that Plin2 overexpression inhibited autophagic flux. Compared to WT AML12 cells, the LC3-II level of the Plin2o/e AML12 cells was barely detectable and the level of SQSTM1 was increased, consistent with a very low level of autophagic flux (Fig. 5C). In comparison, in the Plin2KD AML12 cells, although the LC3-II (and LC3-I) level was also lower than that in control WT AML12 cells, the level of SQSTM1 was extremely low, a combination that indicates increased autophagic flux. We next added BA to block autophagic flux and found markedly increased LC3-I and LC3-II as well as SQSTM1 in the WT control and Plin2KD, though not in Plin2o/e AML12 cells, further corroborating that autophagic flux was indeed higher in both WT control and Plin2KD AML12 cells compared with the Plin2o/e AML12 cells (Fig. 5C). We measured the rate of TG utilization in the 3 cell types in the absence and presence of BA and obtained results in AML12 cells (Fig. 5D) that were similar to those from McArdle cells (Fig. 5B). We conclude that PLIN2 dose-dependently regulates autophagy, thereby controlling cellular TG homeostasis in hepatocytes in a manner that is independent of MTTP expression and TG secretion.
Figure 5.
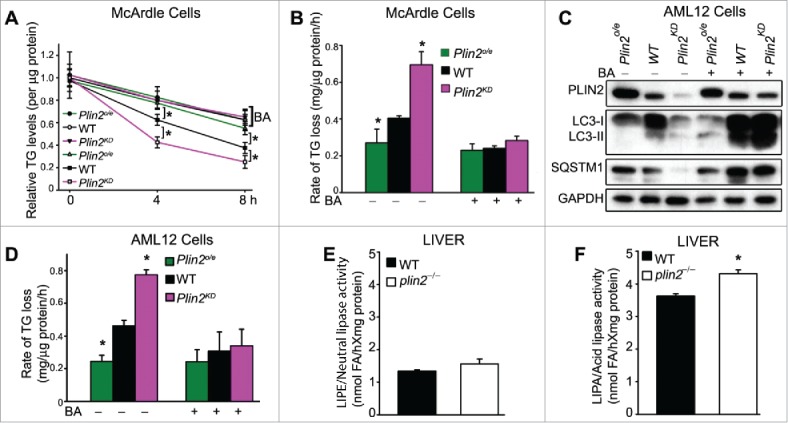
Plin2 regulates lipophagy in rat and mouse hepatic cells. (A) TG turnover in McArdle cells transfected with empty vector (WT) or Plin2 plasmid (Plin2o/e for overexpression) or transduced with Lenti-shPlin2 (Plin2KD for knockdown). Cellular lipid accumulation was induced by overnight incubation with medium supplemented with 400 μM oleate complexed to BSA. At time zero, cells were washed and replaced with regular medium with or without bafilomycin A1 (BA) and then harvested immediately or allowed to grow for 4 or 8 h. TG was measured at 0, 4 and 8 h with enzymatic kits (n = 6). (B) Rates of TG turnover in cells under different conditions calculated from (A). (C) Immunoblot of autophagy markers in AML-12 cells transfected with empty vector (WT), Plin2 overexpression vector (Plin2o/e), or transduced with Lenti-shPlin2 (Plin2KD) with or without BA (one representative shown). (D) The rate of TG turnover in WT, Plin2o/e and Plin2KD AML-12 cells treated as outlined in (A). Neutral lipase (E) and LIPA/acid lipase (F) activities measured from liver homogenates of WT and plin2−/− mice (n = 4). *, p < 0.05. FA, fatty acid.
The high capacity of intracellular TG clearance in the Plin2-deficient liver led us to examine the contributions of different lipase activities in liver tissues taken from WT and plin2−/− mice. Importantly, hepatic neutral lipase activities were comparable between the 2 genotypes (Fig. 5E). Isoproterenol, a commonly used β-adrenergic agonist, increased the adipose tissue lipolysis (Fig. S7A), but it had no effect on liver neutral lipase activity (Fig. S7B). Conversely, LIPA activity, which is required for the catabolism of lipid cargos in the autolysosome at the final stage of lipophagy, was significantly higher in plin2−/− compared with WT mice (Fig. 5F).
PLIN2 deficiency-mediated TG reduction requires LIPA
To determine the role of LIPA with regard to the cellular TG depletion in hepatocytes missing PLIN2, we treated WT and Plin2KD McArdle cells with the LIPA-specific inhibitor Lalistat2. The cellular TG concentration in WT cells was not significantly affected by Lalistat2 (Fig. 6A, black bars), indicating negligible LIPA functional activity under basal (nutritionally replete) conditions. In contrast, addition of Lalistat2 raised cellular TG content by ∼65% in Plin2KD McArdle cells (Fig. 6A, open bars). However, treatment with Lalistat2 alone failed to fully restore the TG content of Plin2KD cells (9.55 ± 0.48) to the level of Lalistat2-treated WT control cells (11.33 ± 0.10; p < 0.05). We reasoned that the residual difference in TG could be attributable to the elevated VLDL secretion in the Plin2KD cells. Indeed, addition of the MTTP inhibitor CP346086 alone increased TG content by ∼30% in the Plin2KD cells (Fig. 6A), and a combination of CP346086 + Lalistat2 additively raised the cellular TG (10.96 ± 0.39) to the level of WT McArdle cells treated in the same way (11.76 ± 0.75; p = 0.18) (Fig. 6A).
Figure 6.
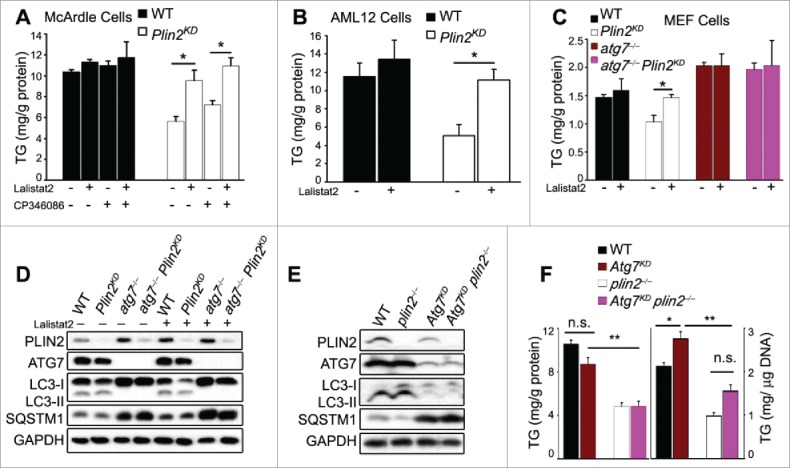
Plin2 deficiency-mediated TG reduction requires LIPA. Intracellular TG levels of control (WT) and Plin2KD McArdle (A) and AML-12 cells (B) grown in the presence or absence of Lalistat2 (20 μM; a LIPA inhibitor) and the presence or absence of CP346086 (10 μM; an MTTP inhibitor). (C) Cellular TG levels of MEF cells grown in the presence or absence of Lalistat2. (D) Immunoblot of MEF cell extracts as outlined in (D). (E) Immunoblot of autophagy markers in liver tissue from WT and plin2−/− mice treated with Ad-shAtg7. (F) Total hepatic TG content as outlined in (E) expressed as mg/g protein (left panel) or mg/g DNA (right panel). n.s., not significant.
We next treated the naturally Mttp-deficient non-VLDL-secreting AML12 cells with Lalistat2 and found that blocking LIPA activity produced a small and insignificant increase in cellular TG content (Fig. 6B, black bars). In contrast, Lalistat2 treatment of Plin2KD AML12 hepatocytes raised the cellular TG level significantly by about 2-fold over vehicle-treated Plin2KD cells to a level similar to that of WT cells (Fig. 6B, open bars).
Role of ATG7 in the enhancement of autophagyand TG reduction in PLIN2 deficiency in vitro and in vivo
We reasoned that LIPA is part of an autophagic pathway in which PLIN2 plays a negative regulatory role and therefore investigated PLIN2s role in atg7−/− MEFs in which a proximal step in autophagosome formation is defective.36 Compared to hepatocytes, MEFs have lower TG levels; nonetheless, lentivirus-shPlin2-knockdown of PLIN2 (∼85% knockdown) in WT MEFs led to a significant (∼30%) reduction in cellular TG (Fig. 6C, black and open bars denoting WT and Plin2KD cells, respectively). In contrast, atg7−/− MEFs exhibited elevated basal cellular TG, indicating significant basal autophagy in WT MEF cells that was absent in atg7−/− MEFs (Fig. 6C, brown bars). Importantly, Plin2 knockdown in these cells (∼85% knockdown) had no effect on cellular TG content (Fig. 6C, compare brown and purple bars), confirming that the Plin2KD-associated TG reduction depended on constitutive Atg7-dependent autophagic function. We next treated these MEFs with Lalistat2, which raised the TG content of the Plin2KD MEF cells to a level comparable to that of WT MEFs. In contrast to Atg7+/+ McArdle cells (Fig. 5A), Lalistat2 had no effect on the TG content of the atg7−/− MEFs, with or without Plin2KD (Fig. 6C, brown and purple bars), indicating the absence of significant autophagic function in autophagy-deficient atg7−/− cells.
Immunoblotting showed that Plin2KD MEFs displayed reduced LC3-II but comparable levels of SQSTM1 protein as WT MEFs (Fig. 6D). Inhibition of LIPA by Lalistat2 did not detectably affect the level of LC3-II, but slightly elevated that of SQSTM1, though there was no difference between WT and Plin2KD MEFs in their response to Lalistat2. Interestingly, in the atg7−/− MEFs, although LC3-II was not detectable and SQSTM1 was elevated, presumably due to compromised autophagy initiation, knockdown of PLIN2 in atg7−/− cells (Plin2KD atg7−/−) did not affect the level of these 2 proteins (Fig. 6D). Therefore, in atg7−/− cells that were devoid of autophagic function, the presence or absence of Plin2 had no effect on autophagy markers (Fig. 6D) or cellular TG content (Fig. 6C). Using mouse AML12 hepatoma cells, we were able to repeat these results (Fig. S8A and B).
The data on the role of Plin2 in autophagy in WT and Atg7-deficient cells are interesting. We decided to extend our observations from MEFs to mouse liver in vivo.
The effects of Atg7 deficiency on hepatic TG content in mice have been reported by 2 different groups: (i) Singh et al.10 found that the amount of hepatic TG/liver was significantly elevated in liver-specific atg7−/− mice; these authors reported the data only as TG/μg DNA or TG per whole liver organ, and did not provide data on liver weight, or protein concentration; (ii) in contrast, Kim et al.37 reported that atg7−/−− mice displayed hepatomegaly but reduced hepatic TG content whether the mice were fed regular chow or high-fat diet. We examined the effect of Atg7 deficiency in vivo by knocking down Atg7 expression using Atg7-shRNA-adenovirus in WT and plin2−/− mice. Ten days after Ad-mediated shAtg7 delivery, the hepatic cellular ATG7 protein level was reduced in WT mice by 90% compared with AdGFP-treated controls (Fig. 6E). The effect of Atg7 knockdown was marked by a concomitant reduction of LC3-II and an increase in SQSTM1 (Fig. 6E), indicating retarded autophagy flux when Atg7 was deficient, in agreement with ATG7 being required for the initiation of autophagosome formation. Importantly, the enhanced autophagic flux in plin2−/− compared with wild-type mouse liver was no longer seen with shAtg7-knockdown in vivo, as evidenced by similar levels of LC3-II and SQSTM1 proteins in Atg7KD plin2−/− and Atg7KD plin2+/+ mice (Fig. 6E).
We observed that Atg7KD mice developed significant hepatomegaly as reported by other groups.38 However, we detected no difference in the hepatic TG level in Atg7KD and control AdGFP-treated WT mice (Fig. 6F). Furthermore, although plin2−/− mice exhibited significantly reduced hepatic TG compared with WT, the cellular TG level remained the same in Atg7KD plin2−/− and plin2−/− mice (Fig. 6F). In other words, Plin2 deficiency-mediated TG reduction did not appear to require a functional ATG7. As shAtg7-treated mice uniformly developed significant hepatomegaly, possibly secondary to protein accumulation in the absence of optimal autophagy, we also measured the hepatic TG:DNA and found that hepatic TG was increased approximately 30% in the Atg7KD plin2+/+ compared with the WT (Atg7+/+ plin2+/+) mice. However, the TG in the Atg7KD plin2−/− mice remained significantly lower than that in the Atg7KD plin2+/+ mice (Fig. 6F).
Loss of PLIN2 protects against ER stress via augmented autophagy
The data thus far indicate that absence of PLIN2 or partial PLIN2 deficiency increases autophagic flux in hepatocytes. The liver is involved in multiple metabolic processes and liver dysfunction is associated with many diseases. Fatty liver disease (hepatosteatosis and hepatosteatitis) is a serious condition of the liver that has reached epidemic proportions.39 Fatty liver disease is associated with endoplasmic reticulum (ER) stress, which underlies many of the pathological consequences of the disease.40-43 We treated mice with tunicamycin44 to produce acute hepatosteatitis. TM inhibits protein N-linked glycosylation in the ER,45 causing protein misfolding, which activates the unfolded protein response (UPR) to forestall ER stress. One effect of TM treatment is an acute accumulation of lipids in the liver, which subsequently subsides when the activated UPR results in resolution.41 TM-induced ER stress and its resolution involve 3 canonical UPR pathways: ERN1/IRE1α, EIF2AK3/PERK and ATF6.41 Importantly, autophagy has been linked to the resolution of UPR and ER stress.42,46 We found that TM injection (0.5 mg/kg i.p.) led to severe hepatosteatosis at 24 h in WT mice (Fig. 7A), which persisted at 48 h; the hepatic TG accumulation started trending toward improvement at 72 h. Whereas TM also induced hepatosteatosis in plin2−/− mice, the TG response was attenuated, peaking at a level ∼50% that in WT mice and returning to baseline much earlier, at 48 h (Fig. 7A). Properly folded hepatic APOB production is essential for VLDL assembly.47 TM suppressed hepatic VLDL secretion by interfering with the proper glycosylation of APOB and promoting its degradation. Plasma TG levels plummeted in both WT and plin2−/− mice at 12 h after TM treatment and stayed at these low levels for at least 72 h (Fig. 7B).
Figure 7.
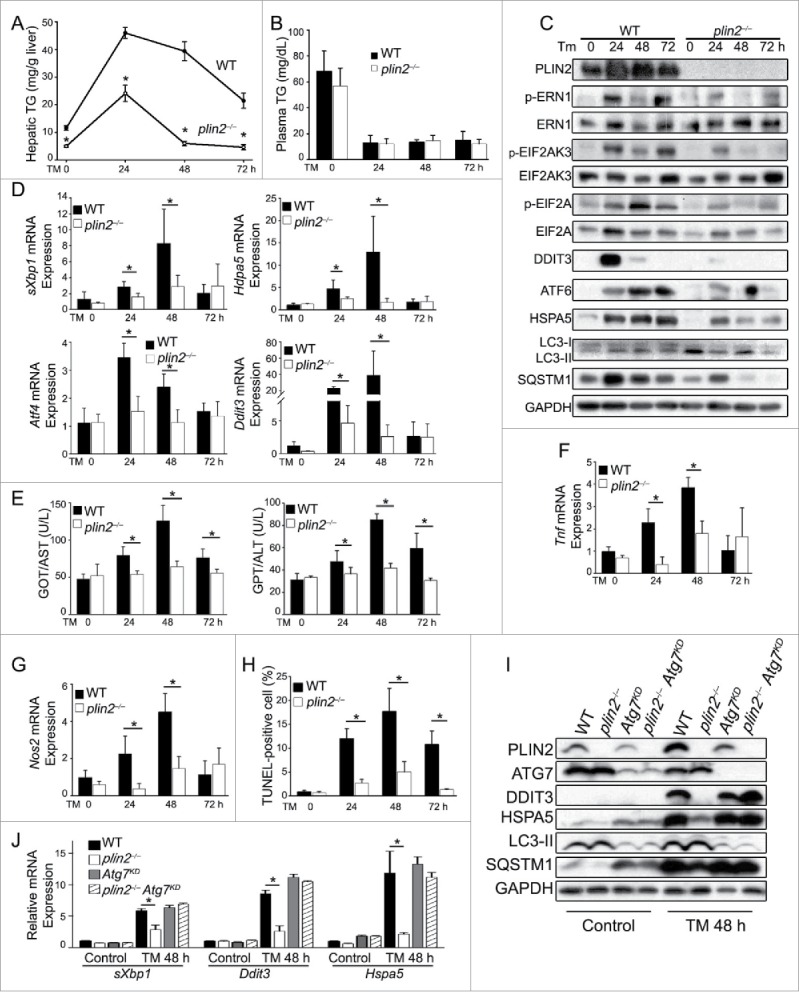
Loss of Plin2 protects against tunicamycin (TM)-induced ER stress via augmented autophagy. TM was injected i.p. (0.5 mg/kg body weight) at 0 h. Hepatic TG (A) and plasma TG (B) were measured in WT and plin2−/− mice before (0 h) or 24, 48, and 72 h after TM (n = 6). (C) Immunoblots of ER stress and autophagy markers in the liver before and after TM injection (one representative shown). (D) Quantitative real-time RT-PCR analyses of ER stress markers sXbp1, Atf4, Ddit3, and Hspa5 on liver RNA isolated before (0 h) or at the indicated times after TM. (E) Plasma GPT/ALT and GOT/AST (n = 6). Quantitative real-time RT-PCR analysis of hepatic Tnf (F) and Nos2 (G) (n = 6). (H) TUNEL-positive cells were identified in liver sections of WT and plin2−/− mice (n = 6). (I) Immunoblots of ER stress and autophagy markers in the livers of WT and plin2−/− mice injected with Ad-GFP (WT and plin2−/−) or Ad-shAtg7 (Atg7KD and plin2−/− Atg7KD) before (Control)and 48 h (TM 48 h) after TM injection (one representative shown). (J) Quantitative real-time RT-PCR analyses of ER stress markers sXbp1, Ddit3, and Hspa5 on liver RNA isolated before (Control) or 48 h after TM (TM 48 h). *, p < 0.05 between WT and plin2−/− mice.
To determine if the hypotriglyceridemia was the result of decreased secretion or enhanced degradation of the hepatic-derived VLDL, we treated the mice with Pluronic F127, which blocks VLDL catabolism. This treatment revealed a mildly increased VLDL secretion in plin2−/− mice under basal conditions compared with WT (Fig. S9A). It further showed that TM injection inhibited hepatic VLDL secretion within 12 h in both groups of mice, an effect that lasted at least 48 h (Fig. S9B and C). We quantified the mRNA level of genes pertinent to VLDL secretion (Mttp, Pdia and Cideb), β-oxidation (Cpt2/CptII and Cpt1a/Cpt-1a), and lipid synthesis (Srebf1/Srebp1c, Dgat1, Dgat2 and Scd1) and found that, with the exception of Dgat1 whose transcript was lower at 24 h and 48 h after TM treatment in plin2−/− mice, all these other transcripts were similar in both genotypes after exposure to TM (Fig. S10).
Immunoblot analysis revealed that TM activated all 3 UPR signaling pathways, ATF6, ERN1 and EIF2AK3, in WT mice; markers for these pathways were strongly activated at 24 h and remained activated at 72 h after TM treatment (Fig. 7C). In comparison, although TM also activated these markers in plin2−/− mice (e.g., appearance of the phosphorylated forms of ERN1, EIF2AK3 and EIF2A/EIF2α), the degree of activation was lower, with markers returning toward baseline much sooner, often by 48 h, after TM treatment (Fig. 7C). Many UPR downstream protein markers (p-EIF2A, DDIT3/CHOP, ATF6, and HSPA5/BIP, Fig. 7D) and mRNA levels (spliced Xbp1 [sXbp1], Hspa5, Atf4 and Ddit3, Fig. 7D) showed similar trends as the upstream UPR markers. Together these data indicate that plin2−/− mice resolved TM-induced UPR much more efficiently than did WT mice.
The TM-induced injury was accompanied by acute inflammation,48,49 as reflected by the increased serum GOT/AST and GPT/ALT levels in WT mice, a response that was markedly attenuated in plin2−/− mice (Fig. 7E). Furthermore, TM also stimulated the hepatic mRNA expression levels of Tnf/Tnf-α (Fig. 7F) and Nos2/iNos (Fig. 7G) in WT mice, a response that was consistently attenuated in plin2−/− mice.
ER stress induces autophagy via multiple mechanisms;50-53 we found that TM-induced ER stress activated markers of autophagy in both WT and plin2−/− liver cells. However, the levels of LC3 and SQSTM1 expression in the immunoblots indicated higher autophagic flux in plin2−/− mice (Fig. 7C), which is consistent with a key role for activated autophagy in the more effective resolution of the ER stress and UPR of plin2−/− cells under basal conditions and after TM treatment.
The TM-induced ER stress and UPR would adjust ER abundance and put in motion adaptations that limit cell injury.54,55 Notably, cells will apoptose if they fail to reestablish homeostasis and continue to experience unmitigated ER stress.54 We found that TM-treated WT mice displayed a massive accumulation of TUNEL-positive cells at 24, 48, and 72 h (Fig. 7H). In contrast, plin2−/− mice, which exhibited significantly enhanced autophagic flux under basal conditions (Fig. 2A-F, also see LC3 and SQSTM1 in the 0 h lane in Fig. 7C), displayed a greatly attenuated apoptotic response with a markedly reduced number of TUNEL-positive cells (Fig. 7H).
We further tested whether ATG7 is required for the faster ER stress resolution in the plin2−/− mice. We injected Ad-shAtg7 or control AdGFP into WT and plin2−/− mice. Ten days after adenovirus transduction we treated these mice with TM and examined the UPR in the isolated liver 48 h after TM. As readouts we assayed the levels of DDIT3 and HSPA5 by immunoblot analysis and mRNA expression; in addition, we also measured the spliced Xbp1 mRNA in these mice. Overall, the UPR was unremarkable in the groups treated with control virus. In the TM-treated groups, however, we detected faster UPR resolution in the liver of the plin2−/− mice compared with the WT with much lower levels of DDIT3 and HSPA5 both at the protein (Fig. 7I) and mRNA (Fig. 7J) levels as well as a lower level of sXbp1 mRNA. Atg7KD showed a similar UPR as the WT in response to TM treatment. Plin2 deficiency in the Atg7KD background failed to produce an accelerated UPR resolution (Fig 7I and J), indicating the requirement of a functional Atg7 in this situation. We were able to repeat these findings in mouse AML12 hepatocytes in vitro, although Atg7KD in AML12 cells worsened the TM-induced ER stress compared with the WT (Fig. S11 A and B).
Discussion
Lipid droplets, also known as lipid bodies, are found in essentially all cells in diverse organisms, including yeast, plants and animals. Londos et al. first isolated PLIN1 from lipid droplets of adipocytes and uncovered its function in the regulation of lipolysis.56 Upon identification of PLIN2 as a second “lipid droplet protein,” Londos made the insightful deduction that lipid droplets are not merely a repository for fat, but are functionally active organelles.57 Subsequently, the lipid droplet proteome was shown to encompass many different proteins with diverse functions, including, e.g., lipid synthetic enzymes, as well as proteins involved in membrane trafficking and in signaling.58-61
The PLIN family of proteins was isolated/identified on the basis of their association with lipid droplets. PLIN2 is the only lipid droplet protein that is ubiquitously expressed. As a constitutive lipid droplet protein, PLIN2 has been used as a surrogate marker in histopathological examination of human tissues for lipid droplets of different sizes, including those that are too small to be visible by conventional light microscopy.62 Shortly after its initial description as a lipid droplet protein about 20 years ago, PLIN2 was postulated to be a lipid droplet stabilizer.23,63 Indeed, genetic ablation of Plin2 leads to loss of lipid droplets,25-27 whereas its induced overexpression causes them to accumulate.24,64,65 This protective action of PLIN2 on lipid droplets was attributed to its effect on PNPLA2 activity.66 In this study, we found that expression of PLIN2 indeed stabilizes lipid droplets. However, the neutral lipases appear not to be involved in PLIN2s effect on cellular TG homeostasis. Instead, we showed that overexpression of PLIN2 protects against, and loss of PLIN2 enhances, autophagy.
Recent studies have shown that autophagy is an important pathway in the catabolism of lipids stored in lipid droplets.10,67 A number of autophagy markers, including LC3, have been found to be also located on lipid droplets,18,19,68-70 which suggests that lipid droplets are more than a target of autophagy, but perhaps a location of autophagosome assembly, or a source for nascent phagophore (the precursor to the autophagosome) membrane growth. Our study is consistent with these possibilities. For example, as a constitutive surface protein on lipid droplets, PLIN2 normally may limit the accessibility of this organelle for autophagosome biogenesis. In its absence, lipid droplets may become more accessible to other protein factors; it is also possible that loss of PLIN2 enables autophagy-related factors to associate with other reconfigured lipid droplet proteins to facilitate autophagosome assembly. Thus, our findings may open the door for the discovery of other factors on the lipid droplet, or of factors that associate with lipid droplet proteins that enable autophagosome biogenesis.
The role of Atg7 inactivation in hepatic TG homeostasis is a controversial issue (reviewed in ref. 71) as some studies showed Atg7 deficiency increased total hepatic TG content,10 whereas other studies found a reduced hepatic TG content.72 Our study showed that Atg7 knockdown caused hepatomegaly and a minor increase of hepatic TG (Fig. 6G) per μg DNA. Furthermore, shAtg7 treatment of plin2−/− mice failed to alter the hepatic TG, which remained much lower than shAtg7-treated WT mice. The expression level of the 2 commonly used autophagy markers, LC3-II and SQSTM1, remained unchanged in shAtg7-treated and control plin2−/− mice, which indicates that the autophagy pathway is blocked by the shAtg7 treatment. It is possible that ATG7 is not required for lipophagy, or, alternatively, knockdown Atg7 may trigger a compensatory mechanism to cause the TG reduction.
Enhancement of autophagy in liver helped resolve TM-induced UPR faster in the plin2−/− mice than in the WT mice. It was shown that one way in which UPR stimulates autophagy is by the transcriptional activation of ATF4 and DDIT3, which turns on many Atg genes.73 While this helps the WT mice to resolve TM-induced UPR within 72 h (Fig. 7D and E), the plin2−/− mice did not require similar levels of stress response to return to the basal state. We reason that the heightened basal autophagy in the plin2−/− mice might cause the cells to rapidly resolve the TM-mediated unfolded glycoprotein accumulation in the ER, enabling an abbreviated UPR. The accelerated UPR resolution in the plin2−/− mice appears to be contingent on a functional Atg7 as it was no longer observed in the Ad-shAtg7-treated Atg7KD plin2−/− mice.
Enhancement of autophagy in the plin2−/− mice potentially could generate more fatty acids for β-oxidation, although our previous study failed to find a significant difference in hepatic mitochondrial β-oxidation between WT and plin2−/− mice.25 We re-examined this issue using the Seahorse analyzer to quantify β-oxidation at the cellular level in primary hepatocytes (isolated from WT and plin2−/− mice; Fig. S12A) or AML12 hepatoma cells (the control and CRISPR-targeted plin2-null cells; Fig. S12B). Corroborating prior data, we again found no significant difference in the rate of oxygen consumption (a measure of fatty acid oxidation using Seahorse) between WT and plin2−/− cells in the presence of exogenous palmitate. We speculate that the fatty acids released from the lysosomes in the plin2−/− hepatocytes might not be channeled toward β-oxidation. It may be relevant that Rambold et al.74 found that fatty acids released from lipophagy were used for TG synthesis in the LD. Alternatively, lipids in LDs could be used for biogenesis of autophagosomes, as postulated in a recent study.75
Two recent studies showed that the LD proteins PLIN2 and PLIN3 are degraded by chaperone-mediated autophagy before the onset of lipolysis,76 and that autophagy in the central nervous system (CNS) regulates brown adipose tissue lipid breakdown through both autophagy and cellular lipases.77 These studies present a more complex system in the regulation of lipid breakdown that involves crosstalk among lipases, lipid droplet proteins, and autophagy that is not only controlled locally in the tissue in question, but which may also receive input from the CNS.
In conclusion, triglyceride homeostasis is modulated by anabolic and catabolic mechanisms that involve multiple bioactive proteins, including different lipid-related enzymes and lipid droplet proteins. In lipid-poor cells, PLIN2 can be degraded by the proteasome pathway.78 PLIN2 is expressed at a high level in the liver, a central metabolic powerhouse involved in TG production, storage and secretion. In this tissue, PLIN2 controls its own fate by guarding its own house, the lipid droplet. Experiments presented herein reveal that increasing PLIN2, a major constitutive lipid droplet protein, suppresses autophagy, whereas its downregulation stimulates autophagy, a central mechanism regulating cellular lipid content via lipid droplet catabolism.10
Materials and methods
Chemicals
Chemicals are obtained from Sigma unless otherwise indicated. PCR primers used in this study are listed in Tables S1.
Mice
We conducted all animal studies according to the “Principles of Laboratory Animal Care” (NIH publication No. 85023, revised 1985) and the guidelines of the IACUC of Baylor College of Medicine. plin2−/− mice and mttpLKO mice were generated previously in our lab.25,47 Mice were maintained in a temperature-controlled facility with 12 h light/dark cycles and free access to regular chow and water. Male mice in the C57BL/6 background that were 8- to 12-wk old were used throughout this study unless otherwise indicated. Tunicamycin (T7765) was administered to mice through i.p. injection at a dose of 0.5 mg/kg body weight.
Plasma lipids and VLDL triglyceride secretion
We used enzymatic kits to measure plasma TG (Thermo Scientific, TR22421), free cholesterol (Thermo Scientific, TR13421), and fatty acid (Wako Chemicals, 999–34691). To determine VLDL TG secretion, we injected Pluronic F-127 (2 mg/g body weight in phosphate-buffered saline (Mediatech, 21–040-CV); a gift from BASF Corporation) intraperitoneally (i.p.) to 4 h fasted mice and monitored the plasma TG before, and 1, 2, 3, and 4 h afterwards using an enzymatic kit.
Liver lipid analysis
We homogenized 200 mg liver tissues in 2 ml of phosphate-buffered saline, and extracted lipids from these homogenates according to Bligh and Dyer.79 We analyzed the lipids by thin-layer chromatography (TLC) using a solvent mix containing petroleum ether:ether:glacial acetic acid (85:25:1). For enzymatic analysis of hepatic lipids, we followed the method of Schartz and Wolins80 by first partitioning lipids from water-soluble components of the tissue extracts with organic extraction followed by colorimetric enzymatic detection kits for TG (Thermo Scientific, TR22421) and cholesterol (Thermo Scientific, TR13421).
TUNEL staining
Liver tissues were frozen in optimum cutting temperature (O.C.T.) compound (Sakura Finetek USA, 4583) on dry ice, and finely cut using a cryostat by the Comparative Pathology Laboratory at Baylor College of Medicine. Apoptotic cells were detected by terminal deoxynucleotidyltransferase-mediated dUTP nick end labeling (TUNEL) assay using an In Situ Cell Death Detection kit (Roche Diagnostics, 1684795910) according to the manufacturer's instructions. We analyzed images under a Zeiss Axioplan-2 fluorescence microscope Imaging System.
Cells and cell culture
We isolated mouse primary hepatocytes as described previously.25 Rat hepatoma McArdle-RH7777 cells and mouse hepatocyte AML-12 cells were obtained from American Type Culture Collection (ATCC, CRL-2254) and cultured following instructions from ATCC. Wild-type and Atg7-deficient mouse embryonic fibroblasts (MEFs) were gifts from Dr. Masaaki Komatsu (Tokyo Metropolitan Institute of Medical Science); they were cultured in high glucose DMEM (Corning, 10–013-cv) with 10% fetal bovine serum (Hyclone, SH30071.03), 100 U/ml penicillin and streptomycin (Life Technologies, 15140122). All cells were grown at 37°C in 5% CO2. The following chemicals were used as indicated in the figure legends: Chloroquine (100 µM; Sigma-Aldrich, C6628), bafilomycin A1 (5 nM; Sigma-Aldrich, B1793), CP-346086 (10 µM; a gift from H.J. Harwood, Jr., Pfizer, Groton, CT, USA),81 and Lalistat2 (20 µM; a gift from Dr. P. Helquist, Chemical Tools, South Bend, IN, USA).82
Subcellular compartment isolation
Lipid droplet fractions were isolated from tissue following the method outlined in our previous study.28 Lysosomes were isolated from the tissues or cells using a Lysosome Organelle Enrichment Kits (Fisher Scientific, PI89839) following the instructions of the manufacturer. The autophagosomes were isolated as described by Stromhaug et al.83
Transfections, lentivirus, and adenoviral infections
Full-length mouse Plin2 cDNA, green fluorescent protein (GFP), and GFP-microtubule-associated protein 1 light chain 3 (GFP-LC3) cDNA was subcloned in the pcDNA3.1 vector (Invitrogen, V790–20) and transfected into McArdle-RH7777 or AML-12 cells using the PolyJet™ DNA Transfection Reagent (SignaGen Laboratories, SL100688). After selection in 1500 µg/ml G418 (A G Scientific Inc., G-1035) for 4 passages, cells that stably expressed Plin2 or eGFP were maintained in DMEM medium containing 10% fetal bovine serum with the addition of 300 µg/ml G418. Plasmid shRNA and lentivirus packaging mix for Plin2 or eGFP knockdown were purchased from Sigma-Aldrich (TRCN0000134012) and used according to the manufacturer's instructions. Recombinant adenoviruses AdPnpla2/ATGL, AdLipe/HSL, and AdAPOA4/apoA-IV were produced as described.84,85
CRISPR-mediated gene deletion in cells
We used pSQT1313 (Addgene, 53370; deposited by Keith Joung) and pSQT1601 (Addgene, 53369; deposited by Keith Joung) plasmids to generate Plin2-null cells targeting the exon 4 of the Plin2 gene following the method developed by Tsai et al.86
GFP-LC3 puncta cell imaging
We transfected McArdle RH7777 cells with a pcDNA-GFP-LC3 plasmid, changed the media 48 h after transfection, and incubated the cells in the presence or absence of CQ (100 µM) for 4 h. Cells were then fixed in 4% paraformaldehyde, counterstained with Hoechst 33342 (Sigma-Aldrich, B2261), and then mounted using ProLong Gold (Life Technology, P36931). We acquired digital images using an inverted confocal laser-scanning microscope (Olympus IX71, with Fluoview 300 scanning-head) and analyzed them by Olympus FV10-ASW 4.0 Viewer software.
Neutral lipase and acid lipase activity
We measured hepatic LIPE/neutral TG hydrolase activity and LIPA/acid lipase activity by following the protocol outlined in Lass et al.,87 and Cahova et al.,88 separately.
TG turnover study
We cultured cells in the presence of 400 µM oleic acid (Sigma-Aldrich, O1383) for 16 h, washed them, and replaced the medium with regular growth media without oleic acid. At different times TG were extracted from the cells and quantified by colorimetric enzymatic detection kits (Thermo Scientific, TR22421).
RNA isolation and quantitative PCR analysis
We isolated total RNAs were isolated using Trizol reagent (Life Technologies, 15596018) and synthesized cDNA using iScript Reverse Transcription Supermix (Bio-Rad Laboratories, 1708897). All primers synthesized from Sigma-Aldrich are listed in Table S1.
Protein isolation and western blotting
We extracted proteins using RIPA buffer, resolved them by SDS-PAGE (Bio-Rad Laboratories, 161–1104), and electroblotted onto PVDF membranes (Bio-Rad Laboratories, 162–0174). Membranes were incubated with different primary antibodies followed by incubation with HRP-conjugated anti-goat (Fisher, AP106P), or -mouse (Bio-Rad, 1721011), or -rabbit secondary antibody (Bio-Rad, 1706515). Blots were analyzed by ImageJ (NIH) or quantified using Gel pro Analyzer 3.1 software (Media Cybernetics). The primary antibodies used were: APOA4 (generated in the lab), ATF6 (Abcam, ab11909), ATG7 (Cell Signaling Technology, 8558), DDIT3/CHOP (Cell Signaling Technology, 2895), EIF2A/EIF2α (Cell Signaling Technology, 5324),
EIF2AK3/PERK (Cell Signaling Technology, 3192), ERN1/IRE1α (Cell Signaling Technology, 3294), GAPDH (Millipore, MAB374MI), HSPA5/BIP (Cell Signaling Technology, 3183), LC3 (Novus Biologicals, NB100–2220), LIPE/HSL (Cell Signaling Technology, 4107), MTTP (BD Tranduction Laboratories, 612022), p-EIF2A/EIF2α (Cell Signaling Technology, 9721), p-EIF2AK3/PERK (Cell Signaling Technology, 3179), p-ERN1/IRE1α (Novus Biologicals, NB100–2323), PLIN2 (generated in the lab), PNPLA2/ATGL (Cell Signaling Technology, 2138), and SQSTM1/p62 (Abnova, H00008878-M01).
Fatty acid oxidation measurement using Seahorse
The increased oxygen consumption rate following BSA-conjugated palmitate (Sigma-Aldrich, P5585) addition was measured using the XF24 extracellular flux analyzer (Seahorse Bioscience) following the manufacturer's instruction.
Statistical analysis
Student t test was used for statistical analysis. The Mann-Whitney test was used when sample size was small (n<5). P<0.05 was considered a significant difference.
Supplementary Material
Abbreviations
- Atg7
autophagy-related 7
- CE
cholesteryl ester
- i.p.
intraperitoneal
- MEFs
mouse embryonic fibroblasts
- Plin
perilipin
- TG
triglyceride
- TM
tunicamycin
- UPR
unfolded protein response
- VLDL
very low-density lipoprotein
Disclosure of potential conflicts of interest
No potential conflicts of interest were disclosed..
Acknowledgments
We thank Dr. H.J. Harwood, Jr. of Pfizer for a gift of CP-346086 and Dr. P. Helquist, of University of Notre Dame and Chemical Tools (South Bend, IN, USA) for Lalistat.
Funding
Supported by United States National Institute of Health R01 grants HL051586/DK105527 to LC, DK84495 and American Heart Association Grant 16GRNT30990040 to BH-JC, P30 DK079638 for a Diabetes Research Center at Baylor College of Medicine, and P01HL49373 to GSS. T-HT was supported by American Diabetes Association grant #1–14-MN-01 to LC. The work was also supported in part by the T.T. and W.F. Chao Global Foundation. L.C. was supported by the Betty Rutherford Chair in Diabetes Research from the Baylor St. Luke's Medical Center in Houston, Texas, USA. This work was also supported by grants from the National Institutes of Health P01HL49373 (GSS). This research was done while Gregory S. Shelness was used by Wake Forest School of Medicine. His opinions expressed in this article are the author's own and do not reflect the view of the National Institutes of Health, the Department of Health and Human Services, or the United States government.
References
- [1].Kawano Y, Cohen DE. Mechanisms of hepatic triglyceride accumulation in non-alcoholic fatty liver disease. J Gastroenterol 2013; 48(4):434-41; https://doi.org/ 10.1007/s00535-013-0758-5 [DOI] [PMC free article] [PubMed] [Google Scholar]
- [2].Quiroga AD, Lehner R. Liver triacylglycerol lipases. Biochim Biophys Acta 2012; 1821(5):762-9; https://doi.org/ 10.1016/j.bbalip.2011.09.007 [DOI] [PubMed] [Google Scholar]
- [3].Czaja MJ, Ding WX, Donohue TM Jr., Friedman SL, Kim JS, Komatsu M, Lemasters JJ, Lemoine A, Lin JD, Ou JH, et al.. Functions of autophagy in normal and diseased liver. Autophagy 2013; 9(8):1131-58. [DOI] [PMC free article] [PubMed] [Google Scholar]
- [4].Sekiya M, Osuga J, Yahagi N, Okazaki H, Tamura Y, Igarashi M, Takase S, Harada K, Okazaki S, Iizuka Y, et al.. Hormone-sensitive lipase is involved in hepatic cholesteryl ester hydrolysis. J Lipid Res 2008; 49(8):1829-38; https://doi.org/ 10.1194/jlr.M800198-JLR200 [DOI] [PubMed] [Google Scholar]
- [5].Wu JW, Wang SP, Alvarez F, Casavant S, Gauthier N, Abed L, Soni KG, Yang G, Mitchell GA. Deficiency of liver adipose triglyceride lipase in mice causes progressive hepatic steatosis. Hepatology 2011; 54(1):122-32; https://doi.org/ 10.1002/hep.24338 [DOI] [PubMed] [Google Scholar]
- [6].Goldstein JL, Dana SE, Faust JR, Beaudet AL, Brown MS. Role of lysosomal acid lipase in the metabolism of plasma low density lipoprotein. Observations in cultured fibroblasts from a patient with cholesteryl ester storage disease. J Biol Chem 1975; 250(21):8487-95. [PubMed] [Google Scholar]
- [7].Du H, Heur M, Duanmu M, Grabowski GA, Hui DY, Witte DP, Mishra J. Lysosomal acid lipase-deficient mice: depletion of white and brown fat, severe hepatosplenomegaly, and shortened life span. J Lipid Res 2001; 42(4):489-500. [PubMed] [Google Scholar]
- [8].Du H, Sheriff S, Bezerra J, Leonova T, Grabowski GA. Molecular and enzymatic analyses of lysosomal acid lipase in cholesteryl ester storage disease. Mol Genet Metab 1998; 64(2):126-34; https://doi.org/ 10.1006/mgme.1998.2707 [DOI] [PubMed] [Google Scholar]
- [9].Du H, Duanmu M, Witte D, Grabowski GA. Targeted disruption of the mouse lysosomal acid lipase gene: long-term survival with massive cholesteryl ester and triglyceride storage. Hum Mol Genet 1998; 7(9):1347-54; https://doi.org/ 10.1093/hmg/7.9.1347 [DOI] [PubMed] [Google Scholar]
- [10].Singh R, Kaushik S, Wang Y, et al.. Autophagy regulates lipid metabolism. Nature 2009; 458(7242):1131-5; https://doi.org/ 10.1038/nature07976 [DOI] [PMC free article] [PubMed] [Google Scholar]
- [11].Weidberg H, Shvets E, Elazar Z. Lipophagy: selective catabolism designed for lipids. Dev Cell 2009; 16(5):628-30; https://doi.org/ 10.1016/j.devcel.2009.05.001 [DOI] [PubMed] [Google Scholar]
- [12].Liang XH, Yu J, Brown K, Levine B. Beclin 1 contains a leucine-rich nuclear export signal that is required for its autophagy and tumor suppressor function. Cancer Res 2001; 61(8):3443-9. [PubMed] [Google Scholar]
- [13].Bi X, Liao G. Autophagic-lysosomal dysfunction and neurodegeneration in Niemann-Pick Type C mice: lipid starvation or indigestion? Autophagy 2007; 3(6):646-8; https://doi.org/ 10.4161/auto.5074 [DOI] [PubMed] [Google Scholar]
- [14].Ebato C, Uchida T, Arakawa M, Komatsu M, Ueno T, Komiya K, Azuma K, Hirose T, Tanaka K, Kominami E, et al.. Autophagy is important in islet homeostasis and compensatory increase of beta cell mass in response to high-fat diet. Cell Metab 2008; 8(4):325-32; https://doi.org/ 10.1016/j.cmet.2008.08.009 [DOI] [PubMed] [Google Scholar]
- [15].Yang L, Li P, Fu S, Calay ES, Hotamisligil GS. Defective hepatic autophagy in obesity promotes ER stress and causes insulin resistance. Cell Metab 2010; 11(6):467-78; https://doi.org/ 10.1016/j.cmet.2010.04.005 [DOI] [PMC free article] [PubMed] [Google Scholar]
- [16].Brunk UT, Terman A. The mitochondrial-lysosomal axis theory of aging: accumulation of damaged mitochondria as a result of imperfect autophagocytosis. Eur J Biochem 2002; 269(8):1996-2002; https://doi.org/ 10.1046/j.1432-1033.2002.02869.x [DOI] [PubMed] [Google Scholar]
- [17].Del RA, Vittorini S, Cavallini G, Donati A, Gori Z, Masini M, Pollera M, Bergamini E. Ageing-related changes in the in vivo function of rat liver macroautophagy and proteolysis. Exp Gerontol 2003; 38(5):519-27; https://doi.org/ 10.1016/S0531-5565(03)00002-0 [DOI] [PubMed] [Google Scholar]
- [18].Shibata M, Yoshimura K, Furuya N, Koike M, Ueno T, Komatsu M, Arai H, Tanaka K, Kominami E, Uchiyama Y. The MAP1-LC3 conjugation system is involved in lipid droplet formation. Biochem Biophys Res Commun 2009; 382(2):419-23; https://doi.org/ 10.1016/j.bbrc.2009.03.039 [DOI] [PubMed] [Google Scholar]
- [19].Shibata M, Yoshimura K, Tamura H, Ueno T, Nishimura T, Inoue T, Sasaki M, Koike M, Arai H, Kominami E, et al.. LC3, a microtubule-associated protein1A/B light chain3, is involved in cytoplasmic lipid droplet formation. Biochem Biophys Res Commun 2010; 393(2):274-9; https://doi.org/ 10.1016/j.bbrc.2010.01.121 [DOI] [PubMed] [Google Scholar]
- [20].Liu K, Czaja MJ. Regulation of lipid stores and metabolism by lipophagy. Cell Death Differ 2013; 20(1):3-11; https://doi.org/ 10.1038/cdd.2012.63 [DOI] [PMC free article] [PubMed] [Google Scholar]
- [21].Brasaemle DL. Thematic review series: adipocyte biology. The perilipin family of structural lipid droplet proteins: stabilization of lipid droplets and control of lipolysis. J Lipid Res 2007; 48(12):2547-59; https://doi.org/ 10.1194/jlr.R700014-JLR200 [DOI] [PubMed] [Google Scholar]
- [22].Brasaemle DL, Wolins NE. Packaging of fat: an evolving model of lipid droplet assembly and expansion. J Biol Chem 2012; 287(4):2273-9; https://doi.org/ 10.1074/jbc.R111.309088 [DOI] [PMC free article] [PubMed] [Google Scholar]
- [23].Brasaemle DL, Barber T, Wolins NE, Serrero G, Blanchette-Mackie EJ, Londos C. Adipose differentiation-related protein is an ubiquitously expressed lipid storage droplet-associated protein. J Lipid Res 1997; 38(11):2249-63. [PubMed] [Google Scholar]
- [24].Imamura M, Inoguchi T, Ikuyama S, Taniguchi S, Kobayashi K, Nakashima N, Nawata H. ADRP stimulates lipid accumulation and lipid droplet formation in murine fibroblasts. Am J Physiol Endocrinol Metab 2002; 283(4):E775-E783; https://doi.org/ 10.1152/ajpendo.00040.2002 [DOI] [PubMed] [Google Scholar]
- [25].Chang BH, Li L, Paul A, Taniguchi S, Nannegari V, Heird WC, Chan L. Protection against fatty liver but normal adipogenesis in mice lacking adipose differentiation-related protein. Mol Cell Biol 2006; 26(3):1063-76; https://doi.org/ 10.1128/MCB.26.3.1063-1076.2006 [DOI] [PMC free article] [PubMed] [Google Scholar]
- [26].Russell TD, Schaack J, Orlicky DJ, Palmer C, Chang BH, Chan L, McManaman JL. Adipophilin regulates maturation of cytoplasmic lipid droplets and alveolae in differentiating mammary glands. J Cell Sci 2011; 124(Pt 19):3247-53; https://doi.org/ 10.1242/jcs.082974 [DOI] [PMC free article] [PubMed] [Google Scholar]
- [27].McManaman JL, Bales ES, Orlicky DJ, Jackman M, MacLean PS, Cain S, Crunk AE, Mansur A, Graham CE, Bowman TA, et al.. Perilipin-2-null mice are protected against diet-induced obesity, adipose inflammation, and fatty liver disease. J Lipid Res 2013; 54(5):1346-59; https://doi.org/ 10.1194/jlr.M035063 [DOI] [PMC free article] [PubMed] [Google Scholar]
- [28].Chang BH, Li L, Saha P, Chan L. Absence of adipose differentiation related protein upregulates hepatic VLDL secretion, relieves hepatosteatosis, and improves whole body insulin resistance in leptin-deficient mice. J Lipid Res 2010; 51(8):2132-42; https://doi.org/ 10.1194/jlr.M004515 [DOI] [PMC free article] [PubMed] [Google Scholar]
- [29].Chandler CE, Wilder DE, Pettini JL, Savoy YE, Petras SF, Chang G, Vincent J, Harwood HJ Jr.. CP-346086: an MTP inhibitor that lowers plasma cholesterol and triglycerides in experimental animals and in humans. J Lipid Res 2003; 44(10):1887-901; https://doi.org/ 10.1194/jlr.M300094-JLR200 [DOI] [PubMed] [Google Scholar]
- [30].Klionsky DJ, Abdelmohsen K, Abe A, Abedin MJ, Abeliovich H, Acevedo Arozena A, Adachi H, Adams CM, Adams PD, Adeli K, et al.. Guidelines for the use and interpretation of assays for monitoring autophagy (3rd edition). Autophagy 2016; 12(1):1-222; PMID:26799652; https://doi.org/ 10.1080/15548627.2015.1100356 [DOI] [PMC free article] [PubMed] [Google Scholar]
- [31].Badr CE, Wurdinger T, Nilsson J, Niers JM, Whalen M, Degterev A, Tannous BA. Lanatoside C sensitizes glioblastoma cells to tumor necrosis factor-related apoptosis-inducing ligand and induces an alternative cell death pathway. Neuro Oncol 2011; 13(11):1213-24; https://doi.org/ 10.1093/neuonc/nor067 [DOI] [PMC free article] [PubMed] [Google Scholar]
- [32].VerHague MA, Cheng D, Weinberg RB, Shelness GS. Apolipoprotein A-IV expression in mouse liver enhances triglyceride secretion and reduces hepatic lipid content by promoting very low density lipoprotein particle expansion. Arterioscler Thromb Vasc Biol 2013; 33(11):2501-8; https://doi.org/ 10.1161/ATVBAHA.113.301948 [DOI] [PubMed] [Google Scholar]
- [33].Lajoie P, Guay G, Dennis JW, Nabi IR. The lipid composition of autophagic vacuoles regulates expression of multilamellar bodies. J Cell Sci 2005; 118(Pt 9):1991-2003; https://doi.org/ 10.1242/jcs.02324 [DOI] [PubMed] [Google Scholar]
- [34].Klionsky DJ, Elazar Z, Seglen PO, Rubinsztein DC. Does bafilomycin A1 block the fusion of autophagosomes with lysosomes? Autophagy 2008; 4(7):849-50; https://doi.org/ 10.4161/auto.6845 [DOI] [PubMed] [Google Scholar]
- [35].Pfisterer SG, Bakula D, Cezanne A, Robenek H, Proikas-Cezanne T. WIPI beta-propellers at the crossroads of autophagosome and lipid droplet dynamics. Biochem Soc Trans 2014; 42(5):1414-7; https://doi.org/ 10.1042/BST20140152 [DOI] [PubMed] [Google Scholar]
- [36].Komatsu M, Waguri S, Ueno T, Iwata J, Murata S, Tanida I, Ezaki J, Mizushima N, Ohsumi Y, Uchiyama Y, et al.. Impairment of starvation-induced and constitutive autophagy in Atg7-deficient mice. J Cell Biol 2005 May 9;169(3):425-34; https://doi.org/ 10.1083/jcb.200412022 [DOI] [PMC free article] [PubMed] [Google Scholar]
- [37].Kim KH, Jeong YT, Oh H, Kim SH, Cho JM, Kim YN, Kim SS, Kim DH, Hur KY, Kim HK, et al.. Autophagy deficiency leads to protection from obesity and insulin resistance by inducing Fgf21 as a mitokine. Nat Med 2013; 19(1):83-92; https://doi.org/ 10.1038/nm.3014 [DOI] [PubMed] [Google Scholar]
- [38].Kim KH, Jeong YT, Oh H, Kim SH, Cho JM, Kim YN, Kim SS, Kim DH, Hur KY, Kim HK, et al.. Autophagy deficiency leads to protection from obesity and insulin resistance by inducing Fgf21 as a mitokine. Nat Med 2013; 19(1):83-92; https://doi.org/ 10.1038/nm.3014 [DOI] [PubMed] [Google Scholar]
- [39].Loomba R, Sanyal AJ. The global NAFLD epidemic. Nat Rev Gastroenterol Hepatol 2013; 10(11):686-90; https://doi.org/ 10.1038/nrgastro.2013.171 [DOI] [PubMed] [Google Scholar]
- [40].Lake AD, Novak P, Hardwick RN, Flores-Keown B, Zhao F, Klimecki WT, Cherrington NJ. The Adaptive Endoplasmic Reticulum Stress Response to Lipotoxicity in Progressive Human Nonalcoholic Fatty Liver Disease. Toxicol Sci 2013; 137(1):26-35. [DOI] [PMC free article] [PubMed] [Google Scholar]
- [41].Wang S, Kaufman RJ. How does protein misfolding in the endoplasmic reticulum affect lipid metabolism in the liver? Curr Opin Lipidol 2014; 25(2):125-32; https://doi.org/ 10.1097/MOL.0000000000000056 [DOI] [PubMed] [Google Scholar]
- [42].Zhang K, Wang S, Malhotra J, Hassler JR, Back SH, Wang G, Chang L, Xu W, Miao H, Leonardi R, et al.. The unfolded protein response transducer IRE1alpha prevents ER stress-induced hepatic steatosis. EMBO J 2011; 30(7):1357-75; https://doi.org/ 10.1038/emboj.2011.52 [DOI] [PMC free article] [PubMed] [Google Scholar]
- [43].Malhi H, Kaufman RJ. Endoplasmic reticulum stress in liver disease. J Hepatol 2011; 54(4):795-809; https://doi.org/ 10.1016/j.jhep.2010.11.005 [DOI] [PMC free article] [PubMed] [Google Scholar]
- [44].Takatsuki A, Arima K, Tamura G. Tunicamycin, a new antibiotic. I. Isolation and characterization of tunicamycin. J Antibiot (Tokyo) 1971; 24(4):215-23; https://doi.org/ 10.7164/antibiotics.24.232 [DOI] [PubMed] [Google Scholar]
- [45].Heifetz A, Keenan RW, Elbein AD. Mechanism of action of tunicamycin on the UDP-GlcNAc:dolichyl-phosphate Glc-NAc-1-phosphate transferase. Biochemistry 1979; 18(11):2186-92; https://doi.org/ 10.1021/bi00578a008 [DOI] [PubMed] [Google Scholar]
- [46].Carloni S, Albertini MC, Galluzzi L, Buonocore G, Proietti F, Balduini W. Increased autophagy reduces endoplasmic reticulum stress after neonatal hypoxia-ischemia: role of protein synthesis and autophagic pathways. Exp Neurol 2014; 255:103-12; https://doi.org/ 10.1016/j.expneurol.2014.03.002 [DOI] [PubMed] [Google Scholar]
- [47].Chang BH, Liao W, Li L, Nakamuta M, Mack D, Chan L. Liver-specific inactivation of the abetalipoproteinemia gene completely abrogates very low density lipoprotein/low density lipoprotein production in a viable conditional knockout mouse. J Biol Chem 1999; 274(10):6051-5; https://doi.org/ 10.1074/jbc.274.10.6051 [DOI] [PubMed] [Google Scholar]
- [48].Zhang K, Kaufman RJ. From endoplasmic-reticulum stress to the inflammatory response. Nature 2008 July 24;454(7203):455-62; https://doi.org/ 10.1038/nature07203 [DOI] [PMC free article] [PubMed] [Google Scholar]
- [49].Zhang K, Shen X, Wu J, Sakaki K, Saunders T, Rutkowski DT, Back SH, Kaufman RJ. Endoplasmic reticulum stress activates cleavage of CREBH to induce a systemic inflammatory response. Cell 2006; 124(3):587-99; https://doi.org/ 10.1016/j.cell.2005.11.040 [DOI] [PubMed] [Google Scholar]
- [50].Yorimitsu T, Nair U, Yang Z, Klionsky DJ. Endoplasmic reticulum stress triggers autophagy. J Biol Chem 2006; 281(40):30299-304; https://doi.org/ 10.1074/jbc.M607007200 [DOI] [PMC free article] [PubMed] [Google Scholar]
- [51].Ogata M, Hino S, Saito A, Morikawa K, Kondo S, Kanemoto S, Murakami T, Taniguchi M, Tanii I, Yoshinaga K, et al.. Autophagy is activated for cell survival after endoplasmic reticulum stress. Mol Cell Biol 2006; 26(24):9220-31; https://doi.org/ 10.1128/MCB.01453-06 [DOI] [PMC free article] [PubMed] [Google Scholar]
- [52].Deegan S, Saveljeva S, Gorman AM, Samali A. Stress-induced self-cannibalism: on the regulation of autophagy by endoplasmic reticulum stress. Cell Mol Life Sci 2013; 70(14):2425-41; https://doi.org/ 10.1007/s00018-012-1173-4 [DOI] [PMC free article] [PubMed] [Google Scholar]
- [53].Yorimitsu T, Nair U, Yang Z, Klionsky DJ. Endoplasmic reticulum stress triggers autophagy. J Biol Chem 2006; 281(40):30299-304; https://doi.org/ 10.1074/jbc.M607007200 [DOI] [PMC free article] [PubMed] [Google Scholar]
- [54].Walter P, Ron D. The unfolded protein response: from stress pathway to homeostatic regulation. Science 2011; 334(6059):1081-6; https://doi.org/ 10.1126/science.1209038 [DOI] [PubMed] [Google Scholar]
- [55].Bernales S, McDonald KL, Walter P. Autophagy counterbalances endoplasmic reticulum expansion during the unfolded protein response. PLoS Biol 2006; 4(12):e423; https://doi.org/ 10.1371/journal.pbio.0040423 [DOI] [PMC free article] [PubMed] [Google Scholar]
- [56].Greenberg AS, Egan JJ, Wek SA, Garty NB, Blanchette-Mackie EJ, Londos C. Perilipin, a major hormonally regulated adipocyte-specific phosphoprotein associated with the periphery of lipid storage droplets. J Biol Chem 1991; 266(17):11341-6. [PubMed] [Google Scholar]
- [57].Londos C, Brasaemle DL, Schultz CJ, Segrest JP, Kimmel AR. Perilipins, ADRP, and other proteins that associate with intracellular neutral lipid droplets in animal cells. Semin Cell Dev Biol 1999; 10(1):51-8; https://doi.org/ 10.1006/scdb.1998.0275 [DOI] [PubMed] [Google Scholar]
- [58].Brasaemle DL, Dolios G, Shapiro L, Wang R. Proteomic analysis of proteins associated with lipid droplets of basal and lipolytically stimulated 3T3-L1 adipocytes. J Biol Chem 2004; 279(45):46835-42; https://doi.org/ 10.1074/jbc.M409340200 [DOI] [PubMed] [Google Scholar]
- [59].Hodges BD, Wu CC. Proteomic insights into an expanded cellular role for cytoplasmic lipid droplets. J Lipid Res 2010; 51(2):262-73; https://doi.org/ 10.1194/jlr.R003582 [DOI] [PMC free article] [PubMed] [Google Scholar]
- [60].Larsson S, Resjo S, Gomez MF, James P, Holm C. Characterization of the lipid droplet proteome of a clonal insulin-producing beta-cell line (INS-1 832/13). J Proteome Res 2012; 11(2):1264-73; https://doi.org/ 10.1021/pr200957p [DOI] [PubMed] [Google Scholar]
- [61].Yang L, Ding Y, Chen Y, Zhang S, Huo C, Wang Y, Yu J, Zhang P, Na H, Zhang H, et al.. The proteomics of lipid droplets: structure, dynamics, and functions of the organelle conserved from bacteria to humans. J Lipid Res 2012; 53(7):1245-53; https://doi.org/ 10.1194/jlr.R024117 [DOI] [PMC free article] [PubMed] [Google Scholar]
- [62].Straub BK, Gyoengyoesi B, Koenig M, Hashani M, Pawella LM, Herpel E, Mueller W, Macher-Goeppinger S, Heid H, Schirmacher P. Adipophilin/perilipin-2 as a lipid droplet-specific marker for metabolically active cells and diseases associated with metabolic dysregulation. Histopathology 2013; 62(4):617-31; https://doi.org/ 10.1111/his.12038 [DOI] [PubMed] [Google Scholar]
- [63].Londos C, Brasaemle DL, Schultz CJ, Segrest JP, Kimmel AR. Perilipins, ADRP, and other proteins that associate with intracellular neutral lipid droplets in animal cells. Semin Cell Dev Biol 1999; 10(1):51-8; https://doi.org/ 10.1006/scdb.1998.0275 [DOI] [PubMed] [Google Scholar]
- [64].Larigauderie G, Furman C, Jaye M, Lasselin C, Copin C, Fruchart JC, Castro G, Rouis M. Adipophilin enhances lipid accumulation and prevents lipid efflux from THP-1 macrophages: potential role in atherogenesis. Arterioscler Thromb Vasc Biol 2004; 24(3):504-10; https://doi.org/ 10.1161/01.ATV.0000115638.27381.97 [DOI] [PubMed] [Google Scholar]
- [65].Magnusson B, Asp L, Bostrom P, Ruiz M, Stillemark-Billton P, Lindén D, Borén J, Olofsson SO. Adipocyte differentiation-related protein promotes fatty acid storage in cytosolic triglycerides and inhibits secretion of very low-density lipoproteins. Arterioscler Thromb Vasc Biol 2006; 26(7):1566-71; https://doi.org/ 10.1161/01.ATV.0000223345.11820.da [DOI] [PubMed] [Google Scholar]
- [66].Listenberger LL, Ostermeyer-Fay AG, Goldberg EB, Brown WJ, Brown DA. Adipocyte differentiation-related protein reduces the lipid droplet association of adipose triglyceride lipase and slows triacylglycerol turnover. J Lipid Res 2007; 48(12):2751-61; https://doi.org/ 10.1194/jlr.M700359-JLR200 [DOI] [PubMed] [Google Scholar]
- [67].Ouimet M, Franklin V, Mak E, Liao X, Tabas I, Marcel YL. Autophagy regulates cholesterol efflux from macrophage foam cells via lysosomal acid lipase. Cell Metab 2011; 13(6):655-67; https://doi.org/ 10.1016/j.cmet.2011.03.023 [DOI] [PMC free article] [PubMed] [Google Scholar]
- [68].Velikkakath AK, Nishimura T, Oita E, Ishihara N, Mizushima N. Mammalian Atg2 proteins are essential for autophagosome formation and important for regulation of size and distribution of lipid droplets. Mol Biol Cell 2012; 23(5):896-909; https://doi.org/ 10.1091/mbc.E11-09-0785 [DOI] [PMC free article] [PubMed] [Google Scholar]
- [69].Bakula D, Takacs Z, Proikas-Cezanne T. WIPI beta-propellers in autophagy-related diseases and longevity. Biochem Soc Trans 2013; 41(4):962-7; https://doi.org/ 10.1042/BST20130039 [DOI] [PubMed] [Google Scholar]
- [70].Pfisterer SG, Bakula D, Frickey T, Cezanne A, Brigger D, Tschan MP, Robenek H, Proikas-Cezanne T. Lipid droplet and early autophagosomal membrane targeting of Atg2A and Atg14L in human tumor cells. J Lipid Res 2014; 55(7):1267-78; https://doi.org/ 10.1194/jlr.M046359 [DOI] [PMC free article] [PubMed] [Google Scholar]
- [71].Kwanten WJ, Martinet W, Michielsen PP, Francque SM. Role of autophagy in the pathophysiology of nonalcoholic fatty liver disease: a controversial issue. World J Gastroenterol 2014; 20(23):7325-38; https://doi.org/ 10.3748/wjg.v20.i23.7325 [DOI] [PMC free article] [PubMed] [Google Scholar]
- [72].Kim KH, Jeong YT, Oh H, Kim SH, Cho JM, Kim YN, Kim SS, Kim DH, Hur KY, Kim HK, et al.. Autophagy deficiency leads to protection from obesity and insulin resistance by inducing Fgf21 as a mitokine. Nat Med 2013; 19(1):83-92; https://doi.org/ 10.1038/nm.3014 [DOI] [PubMed] [Google Scholar]
- [73].B'chir W, Maurin AC, Carraro V, Averous J, Jousse C, Muranishi Y, Parry L, Stepien G, Fafournoux P, Bruhat A. The eIF2alpha/ATF4 pathway is essential for stress-induced autophagy gene expression. Nucleic Acids Res 2013; 41(16):7683-99; https://doi.org/ 10.1093/nar/gkt563 [DOI] [PMC free article] [PubMed] [Google Scholar]
- [74].Rambold AS, Cohen S, Lippincott-Schwartz J. Fatty acid trafficking in starved cells: regulation by lipid droplet lipolysis, autophagy, and mitochondrial fusion dynamics. Dev Cell 2015; 32(6):678-92; https://doi.org/ 10.1016/j.devcel.2015.01.029 [DOI] [PMC free article] [PubMed] [Google Scholar]
- [75].Shpilka T, Welter E, Borovsky N, Amar N, Mari M, Reggiori F, Elazar Z. Lipid droplets and their component triglycerides and steryl esters regulate autophagosome biogenesis. EMBO J 2015; 34(16):2117-31; https://doi.org/ 10.15252/embj.201490315 [DOI] [PMC free article] [PubMed] [Google Scholar]
- [76].Kaushik S, Cuervo AM. Degradation of lipid droplet-associated proteins by chaperone-mediated autophagy facilitates lipolysis. Nat Cell Biol 2015; 17(6):759-70; https://doi.org/ 10.1038/ncb3166 [DOI] [PMC free article] [PubMed] [Google Scholar]
- [77].Martinez-Lopez N, Garcia-Macia M, Sahu S, Athonvarangkul D, Liebling E, Merlo P, Cecconi F, Schwartz GJ, Singh R. Autophagy in the CNS and Periphery Coordinate Lipophagy and Lipolysis in the Brown Adipose Tissue and Liver. Cell Metab 2016; 23(1):113-27; https://doi.org/ 10.1016/j.cmet.2015.10.008 [DOI] [PMC free article] [PubMed] [Google Scholar]
- [78].Xu G, Sztalryd C, Lu X, Tansey JT, Gan J, Dorward H, Kimmel AR, Londos C. Post-translational regulation of adipose differentiation-related protein by the ubiquitin/proteasome pathway. J Biol Chem 2005; 280(52):42841-7; https://doi.org/ 10.1074/jbc.M506569200 [DOI] [PubMed] [Google Scholar]
- [79].BLIGH EG, DYER WJ. A rapid method of total lipid extraction and purification. Can J Biochem Physiol 1959; 37(8):911-7; https://doi.org/ 10.1139/o59-099 [DOI] [PubMed] [Google Scholar]
- [80].Schwartz DM, Wolins NE. A simple and rapid method to assay triacylglycerol in cells and tissues. J Lipid Res 2007; 48(11):2514-20; https://doi.org/ 10.1194/jlr.D700017-JLR200 [DOI] [PubMed] [Google Scholar]
- [81].Chandler CE, Wilder DE, Pettini JL, Savoy YE, Petras SF, Chang G, Vincent J, Harwood HJ Jr.. CP-346086: an MTP inhibitor that lowers plasma cholesterol and triglycerides in experimental animals and in humans. J Lipid Res 2003; 44(10):1887-901; https://doi.org/ 10.1194/jlr.M300094-JLR200 [DOI] [PubMed] [Google Scholar]
- [82].Rosenbaum AI, Cosner CC, Mariani CJ, Maxfield FR, Wiest O, Helquist P. Thiadiazole carbamates: potent inhibitors of lysosomal acid lipase and potential Niemann-Pick type C disease therapeutics. J Med Chem 2010; 53(14):5281-9; https://doi.org/ 10.1021/jm100499s [DOI] [PMC free article] [PubMed] [Google Scholar]
- [83].Stromhaug PE, Berg TO, Fengsrud M, Seglen PO. Purification and characterization of autophagosomes from rat hepatocytes. Biochem J 1998; 335 ( Pt 2):217-24; https://doi.org/ 10.1042/bj3350217 [DOI] [PMC free article] [PubMed] [Google Scholar]
- [84].Reid BN, Ables GP, Otlivanchik OA, Schoiswohl G, Zechner R, Blaner WS, Goldberg IJ, Schwabe RF, Jr Chua SC, Huang LS. Hepatic overexpression of hormone-sensitive lipase and adipose triglyceride lipase promotes fatty acid oxidation, stimulates direct release of free fatty acids, and ameliorates steatosis. J Biol Chem 2008; 283(19):13087-99; https://doi.org/ 10.1074/jbc.M800533200 [DOI] [PMC free article] [PubMed] [Google Scholar]
- [85].VerHague MA, Cheng D, Weinberg RB, Shelness GS. Apolipoprotein A-IV expression in mouse liver enhances triglyceride secretion and reduces hepatic lipid content by promoting very low density lipoprotein particle expansion. Arterioscler Thromb Vasc Biol 2013; 33(11):2501-8; https://doi.org/ 10.1161/ATVBAHA.113.301948 [DOI] [PubMed] [Google Scholar]
- [86].Tsai SQ, Wyvekens N, Khayter C, Foden JA, Thapar V, Reyon D, Goodwin MJ, Aryee MJ, Joung JK. Dimeric CRISPR RNA-guided FokI nucleases for highly specific genome editing. Nat Biotechnol 2014; 32(6):569-76; https://doi.org/ 10.1038/nbt.2908 [DOI] [PMC free article] [PubMed] [Google Scholar]
- [87].Lass A, Zimmermann R, Haemmerle G, Riederer M, Schoiswohl G, Schweiger M, Kienesberger P, Strauss JG, Gorkiewicz G, Zechner R. Adipose triglyceride lipase-mediated lipolysis of cellular fat stores is activated by CGI-58 and defective in Chanarin-Dorfman Syndrome. Cell Metab 2006; 3(5):309-19; https://doi.org/ 10.1016/j.cmet.2006.03.005 [DOI] [PubMed] [Google Scholar]
- [88].Cahova M, Dankova H, Palenickova E, et al.. The increased activity of liver lysosomal lipase in nonalcoholic Fatty liver disease contributes to the development of hepatic insulin resistance. Biochem Res Int 2012; 2012:135723; PMID: 21904679; https://doi.org/ 10.1155/2012/135723 [DOI] [PMC free article] [PubMed] [Google Scholar]
Associated Data
This section collects any data citations, data availability statements, or supplementary materials included in this article.