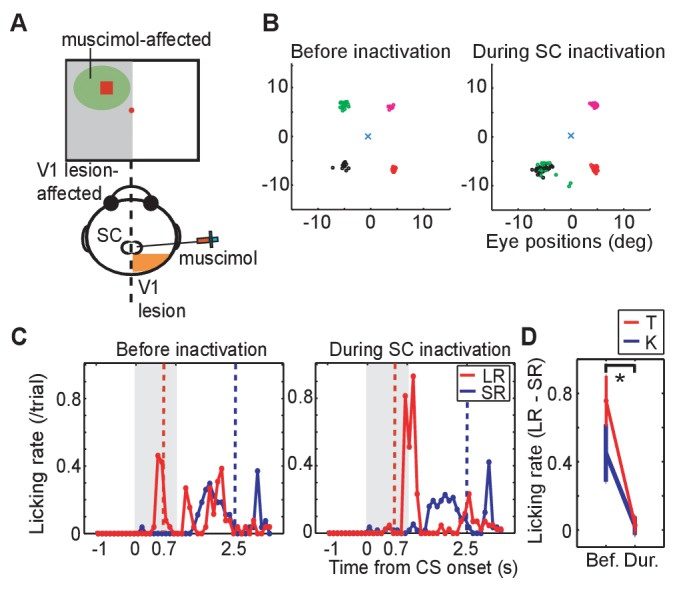
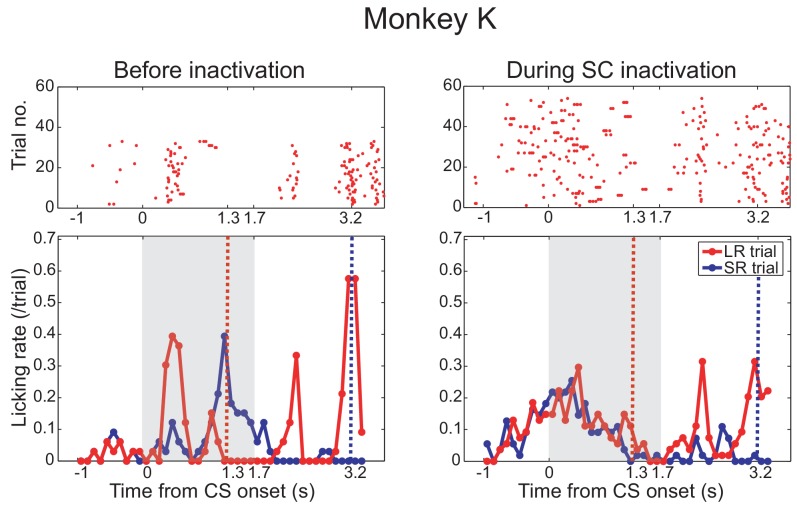
Figure 2. Effect of SC inactivation on conditioned behaviors.
(A) A scheme of the SC inactivation experiments. Muscimol was injected into the point on the ipsi-lesional SC map representing the location of LR-CS in the visual field. (B) End points of saccadic eye movements before and after the SC inactivation (left and right panel). The position of central fixation point is indicated by a blue cross. Circles indicate end points of visually guided saccades, and their colors indicate location of saccadic targets in individual quadrants. Impairment of saccades toward the upper-left target (green) indicates that muscimol effectively suppressed the neuronal activity at the injection site. (C) Licking rates in a daily session before (left panel) and after SC inactivation (right panel) in monkey T. The licking rates are plotted in the same manner as Figure 1C. Red and blue lines indicate the licking rates during the LR and SR trials, respectively. Gray hatched area indicates the CS presentation period. (D) Licking rate during 0.7 s from the CS onset in the SR trials are subtracted from licking rate in LR trials in monkey K (blue line, N = 9) and T (red line, N = 4). The vertical lines indicate the SEM. Bef.: before inactivation, Dur: during inactivation. (p=2.4 × 10⁻⁴, Wilcoxon signed-ranks test, α <0.05).


