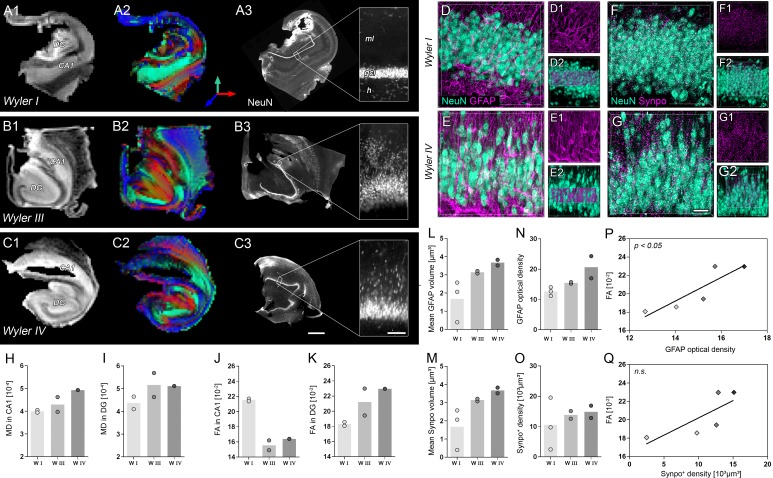
Figure 7. Validation of DWI biomarkers in human mTLE.
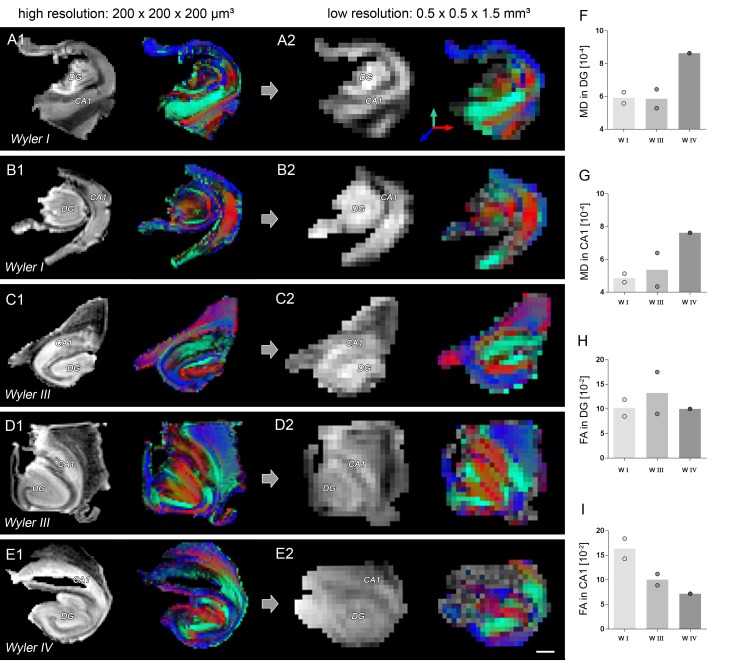
(A1–C1) T2-weighted images of sclerotic human hippocampi from mTLE patients scanned ex vivo. (A2–C2) Corresponding FA maps (color-coded for orientation: dorsoventral, turquoise; mediolateral, red; rostrocaudal: blue). Mean diffusivity (MD) and fractional anisotropy (FA) values for CA1 and DG are denoted in the lower-left, respectively. (A3–C3) Representative NeuN staining of scanned sections. Different Wyler grades according to the severity of neuronal loss (W I: mild, W III: moderate; W IV: strong). Scale bars, 3 mm; inset, 200 µm. (D–E) Representative confocal images of hippocampal sections (Wyler I and IV) double immunolabeled for NeuN (turquoise, neurons) and GFAP (magenta, astrocytes and radial glia cells) or (F–G) NeuN and Synaptoporin (magenta, mossy fiber synapses), respectively, revealing differences in the microstructure of the human DG between Wyler grades. (D1–E1, F1–G1) GFAP and Synaptoporin staining alone. (D2–E2, F1–G2) NeuN staining displayed together with reconstructed radial glia processes and mossy fiber boutons within the GCL, respectively. (H–I, J–K) Quantitative analysis for MD and FA in CA1 and in the DG, respectively (nWI = 2, nWIII = 2, nWIV = 1; no statistical test performed). Refer to ‘Figure 7—figure supplement 1' for MRI metrics acquired lower scanning resolution. (L) Quantitative analysis for the mean volume of GFAP-labeled radial glia processes as well as (M) Synaptoporin-labeled mossy fiber synapses, (N) and for GFAP optical density as well as (O) the density of Synaptoporin-labeled profiles within the GCL (nWI = 3, nWIII = 2, nWIV = 2; no statistical test performed). (P, Q) Correlation of FA values with the GFAP optical density and the density of Synaptoporin-labeled profiles, respectively (nWI = 2, nWIII = 2, nWIV = 1; Pearson’s correlation).


