

Abstract
Metabolism is altered in many highly prevalent diseases and it is controlled by a complex network of intracellular regulators. Monitoring cell metabolism during treatment is extremely valuable to investigate cellular response and treatment efficacy. Here we describe a nuclear magnetic resonance-based method for screening the metabolomic response of drug treated mammalian cells in 96-well format. We validate the method using drugs having well characterized targets and report the results of a screen of a library of kinase inhibitors. Four hits are validated because of their action on an important clinical parameter, the lactate to pyruvate ratio. An eEF-2 kinase inhibitor and an NF-kB activation inhibitor increased lactate/pyruvate ratio while an MK2 inhibitor and an inhibitor of PKA, PKC and PKG induced a decrease. The method is validated in cell lines and in primary cancer cells, and has therefore potential applications to both drug development and personalized therapy.
Introduction
Metabolism plays a central role in many diseases and recent genome-wide reconstructions have defined the number of metabolic enzymes in the human genome and their relationships1. The large size and the connectivity of the metabolic network suggest that multiple controllers are needed for a robust control of its function and indeed metabolism is regulated within cells by large combinations of regulators, including transcription factors, microRNAs (miRs), allosteric effects of metabolites and signal transduction pathways. Therefore there is a clear need for a well-characterized set of drugs and research tools that act on metabolism.
To accelerate drug discovery, over the last decade, high-throughput screening (HTS) has gained widespread popularity in pharmaceutical companies and increasingly in academia to conduct a large number of biochemical, genetic or pharmacological tests2-4. Most screens monitor a single variable, often related to the action on a single target. Screening with a multivariate readout, also called high-content screening (HCS), has recently become more popular, and might facilitate the identification of interventions for more complex phenotypes. Until now, HCS has been mainly associated with automated digital microscopy3-5. Using omic measurements for HCS would have the advantage of providing multivariate readouts more clearly linked to the drug targets and more easily amenable to network-based modeling and therefore to mechanistic insight. For example, a model could include the kinases targeted by kinase inhibitors (KIs), metabolic enzymes regulated by these kinases and the metabolites affected by these enzymes. We are not aware of any report of a drug library screen on mammalian cells that uses metabolomics.
High resolution nuclear magnetic resonance (NMR) spectroscopy and mass spectrometry (MS) are the most common analytical platforms for the identification and quantification of intracellular and extracellular metabolites6-11. Regardless of sample volume and analytical techniques employed, several crucial steps are required for separating the culture media from the cells, and extracting the intracellular metabolites using organic solvents7,10. Depending on the characteristics of the cells being extracted, the overall extraction process typically includes centrifugation steps, organic phase separation and lengthy drying procedures. The dried intracellular extract is then re-dissolved in solvents suitable for the analytical technique. A recent high-throughput metabolomic study has been applied to a 96-well plate to study the intracellular yeast metabolome12. To maximize the information contained in a multi-well plate, the authors have optimized cultivation, quenching and extraction of yeast pellets before chemical derivatization and subsequent gas chromatography/time of flight MS analysis. Although all the above-mentioned approaches are extremely useful for obtaining clear and detailed information from both intra- and extra-cellular metabolism, they have not been optimized and used for the rapid preparation and metabolomic screening of hundreds of drug- treated mammalian cell samples.
In this paper, we describe a high-resolution NMR-based method for screening the global metabolic changes induced by drug interventions in primary cells and cell lines performed in a 96-well plate format with a simple and rapid sample preparation. We first validated the screening method using both suspension and adherent carcinoma cell lines, and primary cells treated with a small number of drugs having well characterized targets. To validate this approach, we applied unsupervised multivariate statistical modeling and calculated the Z-factor value, a commonly used parameter for monitoring the quality of high-throughput screening assays13-15. Then, as a large screening application, we profiled the metabolomic response of cancer cells to a library of KIs. The development of a robust high-content metabolomic platform would be extremely valuable to accelerate the understanding of the in vitro and in vivo actions of drugs and aid their incorporation into therapeutic settings.
Results
Metabolomic NMR-based drug screening validation
A crucial step in the development of a metabolomics screening method exploiting a NMR platform is to design a quick, simple, robust and reproducible sample preparation protocol. Here, we have developed a procedure for screening the response of a sub-selection of metabolites from cells seeded in a 96-well plate without a lengthy sample preparation.
The cells of interest were seeded in a 96-well plate and treated with several drugs (Fig. 1a). To lyse the cells and immediately quench their metabolism we used the procedure detailed in Methods section and Fig. 1. Briefly, sodium dodecyl sulfate (SDS; final concentration 0.5% w/v) was added to each well of the 96-well plate and the cells (in medium and SDS) were immediately ultrasonicated by immersing the plate in an ice-cold sonicating water bath. The entire well content (endo- and exo-metabolome) was then transferred into a 3 mm NMR tube containing phosphate buffer and trimethylsilylpropionate-2,2,3,3-d4 (TMSP). This simple and rapid sample preparation was then followed by NMR spectra acquisition. The overall time for lysing the cells and quenching their enzymatic activity was approximately 5 minutes.
Figure 1. Validation and workflow for NMR-based metabolomic drug screening.
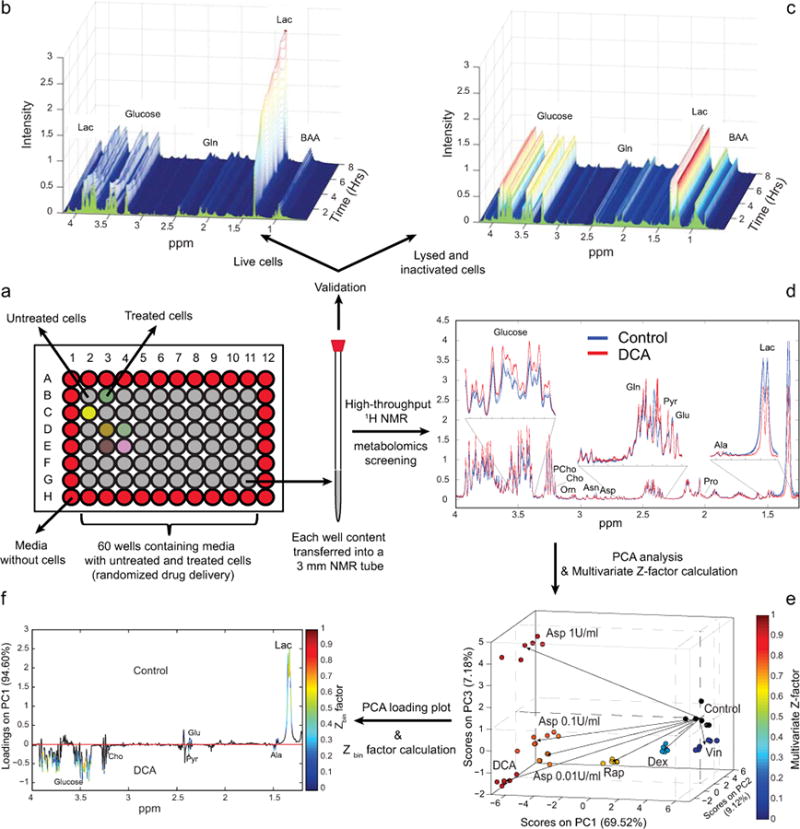
(a) The cells are seeded and treated in a 96-well plate. At the end of the 24 hours treatment period, cells are lysed and their metabolism quenched by combined ultrasonication and addition of SDS-d25. The well content is then transferred into a 3 mm NMR tube. To validate the quenching of any residual enzymatic activity, metabolic changes were monitored by NMR in live cells (b) and cells lysed and inactivated by addition of SDS-d25 and ultrasonication (c). 1D NMR spectra were acquired every 30 minutes for a total of eight hours. (d) 1H-NMR spectra showing the metabolomic perturbations induced in CCRF-CEM cells after 24 hours of drug treatment (dexamethasone (Dex), rapamycin, (Rap) dichloroacetate (DCA), vincristine (Vin) and three different doses of asparaginase (A1, 1 U/ml; A01, 0.1 U/ml; A001, 0.01 U/ml)). Overlay of 6 replicate spectra (1.3-4 ppm section) per treatment condition (with and without DCA treatment) highlights the degree of reproducibility. The metabolic changes detected determine a good separation between the different treatment groups, as shown in the three dimensional scores plot (e), obtained from the PCA of the CPMG NMR spectra. Each treatment group is color-coded according to the multivariate Z-factor value (color bar) obtained by the pair-wise PCA comparison of each drug treatment vs. solvent control (Dex (Z = 0.15), DCA (Z = 0.91), Rap (Z = 0.74), Vin (Z = -1.97), A1 (Z = 0.91), A01 (Z = 0.86), A001 (Z = 0.84)). (f) PCA loadings plot and the superimposed Zbin values identify both the contribution and the Z-factor values of every bin of NMR spectra from the comparison of control and DCA intervention (Lac, lactate; Ala, alanine; Pro, proline; Glu, glutamate; Pyr, pyruvate; Gln, glutamine; Asp, aspartate; Asn, asparagine; Orn, ornithine; Cho, choline; PCho, phosphocholine).
To evaluate the robustness and reproducibility of this method in stopping the cellular enzymatic activity, we compared the effect of adding different concentrations of SDS (final concentration 0.01%-2% w/v) on cell viability and ATP levels (Supplementary Figure S1). No enzymatic activity was detected upon addition of 0.1% SDS; however, we decided to exceed the critical micelle concentration of this detergent and use a final concentration 0.5% w/v to guarantee the complete quenching of cellular metabolism.
To further validate these results, we monitored the metabolic variations in CCRF-CEM (non-adherent) samples by acquiring a series of NMR spectra every 30 minutes over a period of 8 hours. We compared live cells (Fig. 1b), cells lysed using only ultrasonication (Supplementary Figure S2) and cells lysed and inactivated using combined 0.5% SDS-d25 and ultrasonication (Fig. 1c). All the samples prepared using the combined SDS/ultrasonication method displayed no detectable metabolic alteration for the entire period of acquisition (8 hours). On the contrary, metabolic changes (e.g. glucose consumption and lactate production; Fig. 1a and Supplementary Figure S2) were observed for samples containing live or ultrasonicated cells (incomplete quenching process). Multivariate statistical modeling using principal component analysis (PCA) was also performed on the spectra acquired on live, lysed and on simultaneously lysed and inactivated cells (Supplementary Figure S3). The PCA plot shows important metabolic perturbation for live as well as lysed cells; the extremely tight grouping of the time-series NMR spectra acquired on samples of cells previously lysed and SDS-inactivated clearly demonstrates the absence of residual metabolic activity.
Notably, the use of labeled SDS (98% SDS-d25) minimizes the signal interference of the resonances arising from the detergent in the NMR analysis. The small signals deriving from residual unlabeled SDS were constant through all the samples since the same amount of SDS was added to each well. Therefore SDS does not interfere with NMR processing and multivariate analysis.
A legitimate question might arise regarding the relative contribution of the intracellular metabolome to the NMR spectrum acquired on the well content including both medium and thelysed cell metabolomes. To address this question we acquired NMR spectra on the entire well content (endo- and exo-metabolomes), the exo-metabolome, the endo-metabolome and medium (Supplementary Figure S4). The samples containing only the endo-metabolome were prepared by extracting PBS-washed cells from one well using the combined SDS/ultrasonication method. As expected, the major NMR signals arose from the extracellular metabolites; however, several signals arising from the intracellular metabolites were detected (e.g. glutamate, choline, phosphocholine, etc.). Similarly, in spectra acquired on samples containing both endo- and extracellular metabolomes, signals arising exclusively from the endo-metabolome and not overlapping with other extracellular resonances were clearly identified (e.g. phosphocholine and glycerophosphocholine; Supplementary Figure S4).
To validate the robustness of the method across multiple 96-well plates, we applied PCA to 1H-NMR spectra acquired on samples seeded with either solvent control or L-asparaginase in randomized positions within one plate as well as in different plates. No plate-to-plate variability was observed and further details are reported in Supplementary Figure S5.
Metabolic changes induced by drug treatment in cell lines
To evaluate the sensitivity of this method for monitoring metabolic perturbations induced by a 24 hours drug treatment, we compared the metabolic changes of both suspension (human leukemia cells, CCRF-CEM) and adherent mammalian carcinoma cell lines (human ovarian cancer cells, SKOV-3) in response to different drug treatments (dexamethasone (Dex), rapamycin, (Rap) dichloroacetate (DCA), vincristine (Vin) and three different doses of L-asparaginase (A1, 1 U/ml; A01, 0.1 U/ml; A001, 0.01 U/ml)). For each cell line, we compared spectra acquired using three different 1H NMR pulse sequences: 1D spectra (Fig. 2a), Carr-Purcell-Meiboom-Gill(CPMG) spin echo (Fig. 2b) and two-dimensional (2D) 1H J-resolved (JRES; included in Fig. 2c as 1D projections of 2D JRES spectra, pJRES) sequences. The enlarged sections (0.7-1.1 and 6.6-7.5 ppm) of 1H NMR spectra acquired on CCRF-CEM cells using the aforementioned techniques, highlight the efficacy of relaxation-edited CPMG and pJRES pulse sequences in removing the residual broad signals from cell debris including macromolecules (e.g. proteins and lipoproteins). This enables identification and relative quantification of small metabolites in both the aliphatic and the aromatic regions of the spectra (e.g. valine (Val), leucine (Leu), tyrosine (Tyr)) without the need of centrifugation steps. In addition, pJRES spectra provide proton-decoupled NMR spectra useful for reducing congestion and increasing metabolite specificity. Similar groupings and separation among all the eight treatments (6 replicates per treatment) were observed comparing the PCA scores plots (PC1 and PC3) of CCRF-CEM leukemia cells of 1D (Fig. 2d) and CPMG spectra (Fig. 2e). The PCA scores plot (PC1 and PC2), obtained using JRES pulse sequence (Fig. 2f), shows an excellent separation and superior groupings for all the treatments compared to the score plots using the other two techniques.
Figure 2. Comparison of different NMR pulse sequences.
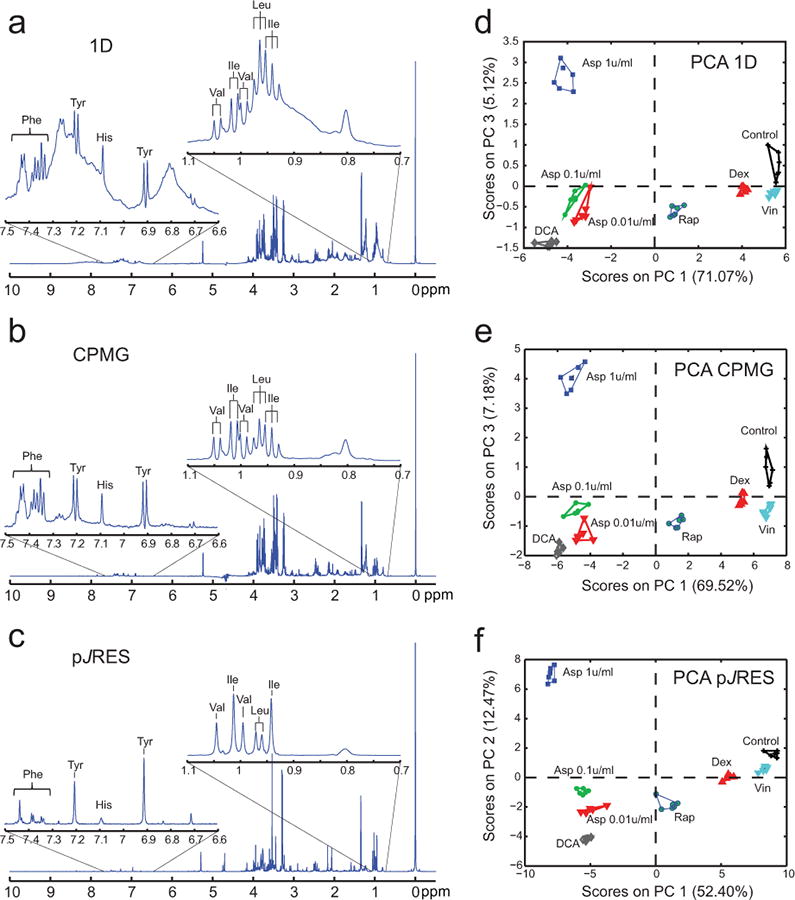
Full spectra and expanded sections (07-1.1 and 6.6-7.5 ppm) of 1H NMR spectra acquired using (a) 1D 1H NMR, (b) Carr-Purcell-Meiboom-Gill (CPMG) spin echo pulse sequence and (c) by projecting the acquired 2D JRES (pJRES). Spectra were acquired on CCRF-CEM leukemia cells treated with solvent control (Control), dexamethasone (Dex, 50nM), dichloroacetate (DCA, 20mM), rapamycin (Rap, 100nM) vincristine (Vin, 1nM) and asparaginase at three different doses (A1, 1 u/ml; A01, 0.1 u/ml; A001, 0.01 u/ml) following cell lysis and metabolism inactivation via addition of SDS and ultrasonication. The spectra acquired using the aforementioned pulse sequences show important alterations on the resonance intensities of selected metabolites (Ile, isoleucine; Leu, leucine; Val, valine; Tyr, tyrosine, His histidine; Phe, phenylalanine) as highlighted by the PCA scores plots obtained from analysis of spectra acquired using (d) 1D (PC1 versus PC3), (e) CPMG (PC1 versus PC3) and (f) JRES pulse sequences (PC1 versus PC2) on CCRF-CEM cells with and without drug treatments.
We also performed pair-wise PCAs comparing each of the drug treatments to the control samples. The percent variability obtained from these analyses (PC1 and PC2) and the multivariate Z-factor (Supplementary Methods Equation S2) values (Supplementary Table S2) show again the benefits of JRES in particular for Dex and Vin drug treatments. These differences of JRES can be in part attributed to a smaller number of variables, due to simplification of the spectra by decoupling of the multiplets, but also to the reduced sensitivity, due to smaller number of scans in direct dimension, compared to 1D and CPMG techniques.
The loadings plot (Fig. 1e) indicates the weighting to the first component of the PCA score plot (Fig. 1d) of different spectral bins; in a similar manner, we have introduced Z-factor values at each bin of the NMR spectra (Supplementary Methods Equation S2). The Zbin values, superimposed to the loadings plots for each comparison of control and individual drug intervention (Fig. 1e), indicate that treatment with DCA induced relevant metabolic changes (e.g. pyruvate, glutamate, lactate) characterized by Zbin factor values greater than 0.2 satisfying the requirements for a high-throughput assay15.
To test the general applicability of high-content NMR-based metabolomic screening, we delivered the same drug treatments administered to non-adherent CCRF-CEM cells to the adherent ovarian SKOV-3 cells, a more drug resistant mammalian cell line. As expected, the responses to drugs treatments in SKOV-3 cells were less pronounced compared to CCRF-CEM cells, as indicated by the smaller percent variation of the first and second principal components (Fig. 3a). However, the observed metabolic variations (Fig. 3a) support the applicability of this approach also to drug resistant and adherent cell lines.
Figure 3. NMR-based metabolomic screening of drug treatment in acute myeloid leukemia primary cells.
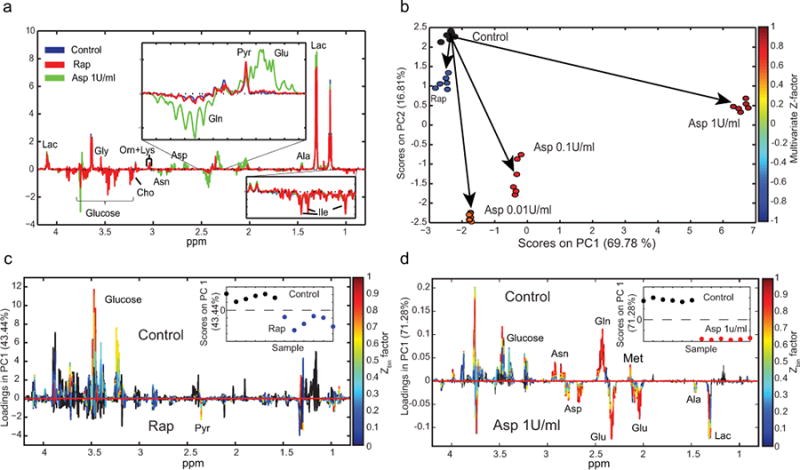
(a) Difference spectra obtained by subtracting the average NMR spectrum of the medium, incubated without the cells in the 96-well plate subtracted from the average NMR spectra of AML primary cells with and without 24 hours of 100 nM Rap or 1 U/ml Asp drug treatment. (b) PCA scores plot (PC1 versus PC2) color-coded according to the multivariate Z-factor values foreach treatment group (Rap (Z = -0.90), A1 (Z = 0.83), A01 (Z = 0.77) and A001 (Z = 0.42)). (c-d) PCA loadings plots and the superimposed Zbin values identify both the contribution and the Z-factor values of each bin of NMR spectra from a pairwise comparison of control and drug intervention ((c) rapamycin and (d) asparaginase treatments) (Ile, isoleucine; Lac, lactate; Ala, alanine; Glu, glutamate; Pyr, pyruvate; Gln, glutamine; Asp, aspartate; Asn, asparagine; Orn, ornithine; Lys, lysine; Cho, choline; Gly, glycine).
We believe that the applicability of high-content NMR-based metabolomic screening might be extended also to other types of intervention such as microRNAs treatments. Indeed, the extent of the metabolic responses in human cell lines following transfection of miRs is not known16. Therefore, we tested whether the sensitivity of our HCS method was sufficient to detect metabolic changes in HeLa cells transfected with mir-121 and mir-16. We used pre-miRs as negative controls, which are chemically modified double-stranded RNA molecules designed to mimic endogenous miR molecules (Supplementary Methods). These miRs were selected because they were computationally predicted to target multiple metabolic enzymes. We found that the developed method was capable of detecting metabolic perturbation induced by miRs treatments as observed by the PCA scores plot (PC1 and PC2) and the multivariate Z-factor values (Fig. 3b). More specifically, mir-16 induced a more pronounced metabolomic alteration on HeLa cells compared to mir-121.
Metabolomic NMR-based drug screening in AML primary cells
Owing to the small amount of cells required for our high-throughput metabolomic screening method, we believe that this procedure could be valuable to study the response to treatment in primary cells, while avoiding phenotypic changes induced by growth in culture. Cells isolated from bone marrow specimens of an untreated AML patient were treated for 24 hours with Rap and L-asparaginase at different doses. Following treatment, the samples were prepared for the NMR analysis as detailed above.
To emphasized metabolic changes in the primary cell samples after the 24 hours of treatment, we subtracted the NMR spectra acquired on unconditioned medium (incubated without cells in the same 96-well plate; Fig. 1a) from those acquired on AML primary cells with and without drug intervention (e.g. L-asparaginase 1 U/ml, Fig. 4a). The difference spectra clearly indicated distinct changes in the metabolome of primary cells, including changes in isoleucine, alanine and ornithine. An unsupervised multivariate analysis was then performed on the acquired 1H NMR spectra (Fig. 4b). PCA scores plot (PC1 and PC2) and related multivariate Z-factor values for Rap (Z = -0.90), A1 (Z = 0.83), A01 (Z = 0.77) and A001 (Z = 0.42) confirm that different responses of primary cells to the drug treatments are detected (Fig. 4b). The overall response of AML primary cells to treatment was limited for Rap treatment (as observed from the negative multivariate Z-factor values) and increasingly more pronounced following treatment with increasing doses of L-asparaginase. In addition, for Rap treatment few metabolic changes (e.g. pyruvate and glucose) had Zbin factor values greater than 0.5 (Fig. 4c). This point-by-point analysis of Z values for the L-asparaginase treatment indicated that, besides the metabolites directly affected by the enzymatic activity of L-asparaginase (i.e. asparagine and glutamine17,18), other compounds, including glucose, lactate, alanine and methionine, were affected by this drug intervention (Fig. 4d).
Figure 4. High-content NMR-based metabolomic screening in adherent cell lines.
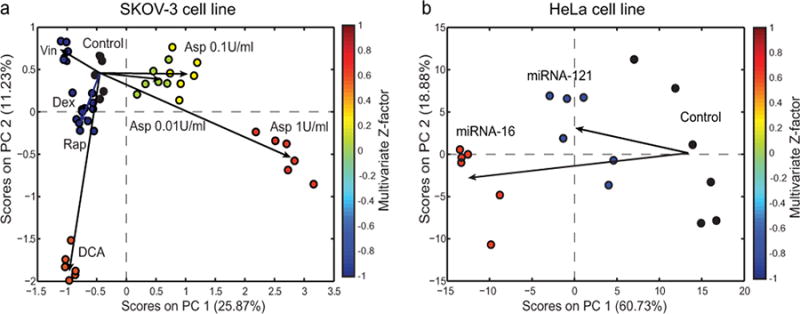
PCA scores plots (PC1 versus PC2) obtained from the analysis of the 1H-NMR spectra of (a) human ovarian carcinoma cell line (SKOV-3) after 24 hours of treatment with different types of drugs and (b) human epithelial carcinoma cell lines (HeLa) after 24 hours of microRNAs (miRNA-16 and miRNA-121) treatment. Each treatment-group on the PCA scores plots is color-coded according to the multivariate Z-factor value (color bar) obtained from the pair-wise PCA comparison of treatment vs. control for SKOV-3 (Dex (Z = -5.83), DCA (Z = 0.45), Rap (Z = -3.07), Vin(Z = -1.84), A1(Z = 0.70), A01(Z = 0.01), A001(Z = 0.24)) and HeLa (mir-16 (Z = 0.34) and mir-121 (Z = -0.55)) cell lines.
High-content NMR-based metabolomic screening of KI library
Protein kinases control a wide range of cellular processes including cell metabolism19,20. Therefore, monitoring cell metabolism during treatment is extremely valuable to investigate cellular response and treatment efficacy, in particular as an evaluation criterion complimentary to standard screening methods. As a first application, here we applied the high-content NMR-based metabolomic screening combined with the ATP assay to monitor the cellular metabolomic response for a library of KIs (Supplementary Table S4).
We first used the ATP bioluminescence measurements to investigate changes in CCRF-CEM cell viability following treatment with approximately 250 KIs at 24 and 72 hours. We then selected 56 KIs based on ATP values showing very low to moderate changes. Compounds causing very pronounced changes in viability after 24 hours were excluded. Cell viability measurements (Fig. 5a) and the NMR-based metabolomic screening were performed after 24 hours of treatment with 56 KIs in CCRF-CEM cells (in triplicate). We calculated the multivariate Z-factor for each KI treatment (Fig. 5b), and for a subset of metabolites we determined the Z-bin values (Fig. 5c) and their relative concentration (as a percent of control; Fig. 5d). Several metabolic changes induced by the drugs were clearly correlated (Supplementary Figure S6).
Figure 5. NMR-based metabolomic screening of a library of KIs.
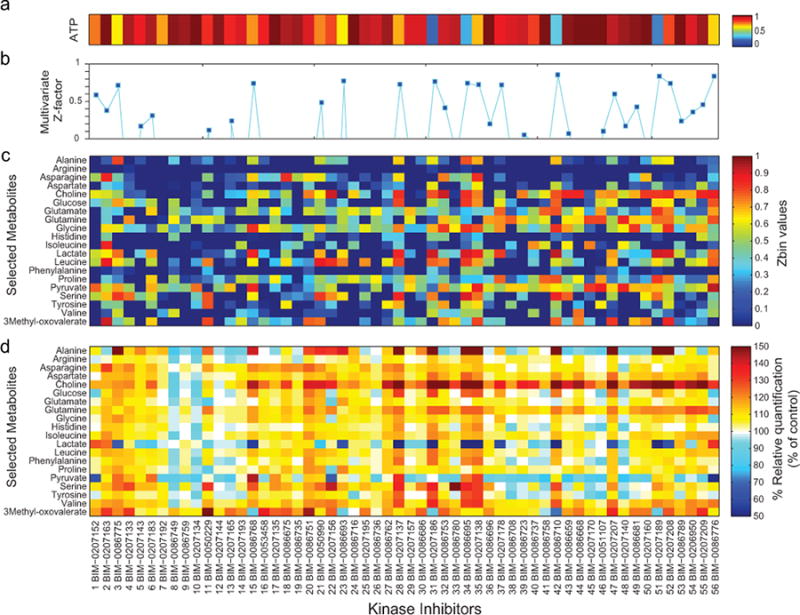
(a) ATP assay was used to measure the cell viability of CCRF-CEM cells following 24 hours of treatment with 56 KIs (1-56 BIM). The final concentration of each drug treatment was 1 μM. The mean luminescence values of cells treated with KI were normalized to the average ATP value for untreated cells (solvent control). (b) Principal component analysis was performed on the 1H NMR spectra acquired in triplicates and a multivariate Z-factor value was calculated for each KI. For a subset of all the observed metabolites we determined the Zbin values (c) and their relative concentration (d, as percent of control).
To confirm some of the hits of the first metabolomic screen (Fig. 5), nine KIs were chosen for a secondary screen (Supplementary Figures. S7-S9). Four of the repeated compounds were selected because of the action on a well known clinical phenotype, the lactate/pyruvate ratio (Fig. 6a-d). Five more compounds were chosen to provide additional data on measurement reproducibility. The results of the second screen (Supplementary Figures. S7a-b) were consistent with the first assay and the average coefficient of variation in metabolite changes between the two screens was 0.09 +/- 0.01 (mean +/- SEM). Most of the metabolites showed comparable changes in the two screenings (Supplementary Figures. S7c-d). The second screen was also performed on CCRF-CEM cells treated using a 10-fold lower dose of KIs (0.1 μM; Supplementary Figure S8). Most low-dose treatments did not affect the ATP cell viability, however significant metabolic alterations were observed for some treatments (e.g. BIM-00866768 and BIM-0086776; Supplementary Figure S8). To confirm the observed results, hit follow-up dose response experiments were performed using six different concentrations21 of KI in the range of 0.05-2 μM (Supplementary Figure S9). These concentrations were chosen with the intent of investigating the metabolomic response of CCRF-CEM cells to KI treatment without affecting their cell biomass. IC50 values were calculated based on the 50% reduction of ATP levels induced by treatment (Supplementary Table S5).
Figure 6. Metabolic modulation induced in CCRF-CEM cells by four KI hits.
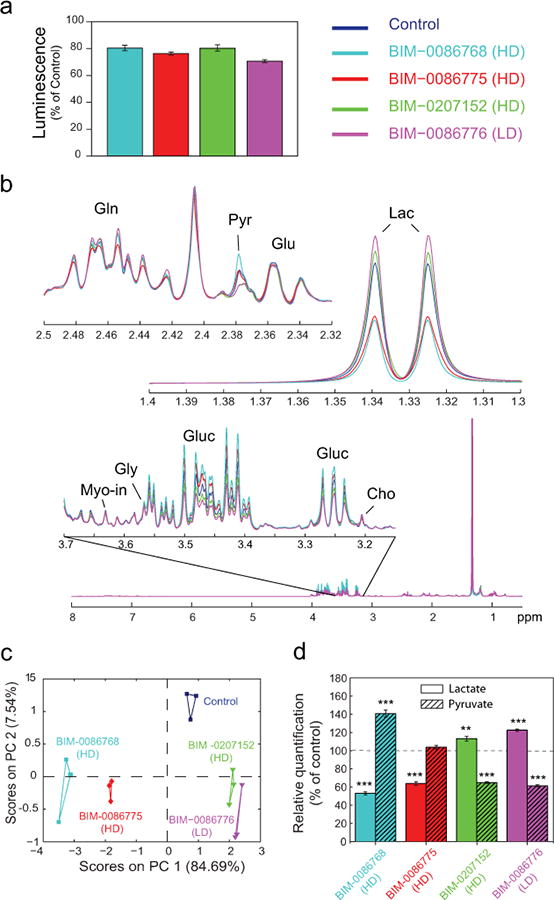
Four KIs found to cause similar drop (by ∼20%) of ATP values in CCRF-CEM cells were selected. The drugs eEF-2 kinase inhibitor (BIM-0207152), MK2 inhibitor (BIM-0086775) and an inhibitor of PKA, PKC and PKG (BIM-0086768) were administered at the high dose (1 μM), and NF-KB activation inhibitor (BIM-0086776) at low dose (0.1 μM). (a) ATP assay (as % of control) following KI treatments is reported as the mean values (bars) +/- SEM (error bars; N=3).(b) Representative sections of average 1H NMR spectra acquired on CCRF-CEM cells with and without KI treatment are expanded (Gln, glutamine; Pyr, pyruvate; Glu, glutamate; Cho, choline; Gluc, glucose; Gly, glycine; Myo-in, myo-inositol). (c) Principal component analysis (PC1 versus PC2) was performed on the 1H NMR spectra of treated and untreated CCRF-CEM cells acquired in triplicates. (d) Relative concentrations of lactate and pyruvate calculated as percent of control are reported as the mean values (bars) +/- SEM (error bars; N=3). Statistical comparison between data obtained from untreated and KIs treatment was performed using an unpaired Student's t-test (statistical significance: *P< .05, **P< .01, and ***P< .001).
Four of the 9 KIs considered above were then chosen, selecting the compounds inducing moderate ATP level drops to prevent relevant changes in cell biomass. These four KIs reproducibly affected the relative concentrations of lactate and pyruvate in opposite directions (Figs. 5-6 and Supplementary Figures. S7-S9). An eEF-2 KI (BIM-0207152), and an NF-kB activation inhibitor (BIM-0086776) increased lactate/pyruvate ratio (Fig. 6d) while an MK2 inhibitor (BIM-0086775), and an inhibitor of PKA, PKC and PKG (BIM-0086768) induced a decrease. Concurrently, mild and comparable effects on ATP levels were observed, consistent with reduced cell proliferation (Fig. 6a). Moreover, these inhibitors were not identical in their action in fact engendered distinct metabolic changes, including glucose, alanine, serine, choline and glutamine (Fig. 6b). Multivariate statistical analysis (Fig. 6c) indicates that BIM-0207152 and BIM-0086776 induced similar alterations in cellular metabolic profiles, different from those induced by BIM-0086775 and BIM-0086768, and distinct from untreated controls. The two inhibitors (BIM-0207152 and BIM-0085776) that induce similar metabolic modulations in CCRF-CEM cells (Fig. 6) also show similar responses in cell survival of primary cells from acute leukemia patients. Preliminary results from 4 leukemia patients indeed showed a high correlation in the individual response between these two drugs after 24 hours in culture (Supplementary Figure S10).
Discussion
Cultured cell lines are well-established models for the study of cancer22-24. Despite the numerous in vitro and ex vivo studies, a high-content metabolomic assay for screening drug libraries using mammalian cells has not been reported. The methodology developed in this work describes an innovative approach using NMR-based metabolomics for drug screening. The rationale for using NMR as the platform of choice was dictated by the ability of this analytical technique to handle samples containing complex and relatively unrefined mixtures of compounds. More specifically, the samples considered in this study required only minimal sample preparation without the need of additional separation or filtration step (e.g. proteins removal). Also advantageous are the low experimental variability and reasonable cost per sample.
The main drawback associated with the use of NMR is the relatively limited number of compounds that can be detected. Owing to this limitation, our metabolomic HCS method does not provide metabolic profiles as detailed as those described by us and others using more in depth metabolomic techniques8,11,21,22,25-28. Nonetheless, the assay we describe is suitable for a high-throughput primary screen, and should be followed, as it is commonly the case, by secondary assays analyzing the exo- and endo-metabolomes of selected hits likely using a combination of different analytical platforms8,11,21,22,25-28. Other techniques including turbulent flow chromatography interfaced with MS might represent a valid tool for a metabolomic screening capable of increasing the number of identified metabolites compared to NMR techniques29 with additional sample preparation steps.
Although not comprehensive of all metabolites, the wealth of information obtained from the multivariate metabolic readout is of great advantage for drug screening purposes. In fact, while most primary drug screens on mammalian cells are based on single readout, high-content metabolomic screening allows the parallel measurements of an array of metabolites and is designed to provide additional valuable information and criteria for the selection of the most effective individual or combinatorial drug interventions.
To allow the rapid preparation and metabolomic screening of hundreds of samples, we validated a novel protocol for lysing the cells and immediately quenching cellular metabolism, employing SDS, a powerful denaturating detergent widely employed in protein biochemistry30 and in micelle-assisted diffusion-ordered spectroscopy for stereoisomer resolution31. The content of a single well from a 96-well plate was used for the assay without the need of pooling the content of several wells, enabling maximized yield per plate. Moreover, the sensitivity of our high-content metabolomic screening method was proven adequate to monitor metabolic perturbations induced by drug intervention in both cultured cell lines and in AML primary cells as well as following treatment with miRs. The metabolomic study of miRs could potentially be extended to the entire set all known human miRs (around 500), and therefore contribute to the understanding of this complex intracellular regulatory system.
Altogether, using our approach, hundreds of samples can metabolically be inactivated in approximately 5 minutes and a metabolomic screening of around 100 samples can be performed in 24 hours. Progress in NMR spectroscopy, e.g. in probe hardware design, will increase the sensitivity of this method and allow the applicability to volumes obtained from higher density plates (e.g. 384-well plates). In particular, the relatively new area of microprobe and multiple coil probe-heads shows great promises for high-throughput NMR experiments32. In the area of NMR data processing, continuous efforts are devoted to the development of new algorithms for reducing multiple readout parameters and automating identification and quantification of metabolites33. Here, we capitalized on NMR pulse sequences (CPMG and JRES) which warrant highly reproducible analyses of small molecules even in the presence of residual proteins or cell debris in the sample. Multivariate Z-factor values derived from PCA were used to evaluate the quality of the NMR-based metabolomic screening assay. Furthermore, because NMR spectra produce arrays of complex data (as opposed to a single outcome), we also introduced the Zbin value as a localized parameter assessing the effect of drug treatment on each metabolite.
Since the development of imatinib (known as CGP 5714834) and subsequent application for treatment of chronic myeloid leukemia, KIs have received increasing attention as anticancer drugs. Activation of oncogenic pathways including PI3K/AKT/mTOR, involved with altered bioenergetic pathways, such as glycolysis, fatty acid and glutamine metabolisms, has suggested novel targets for cancer treatment23,24,27,35,36. Therefore, monitoring cell metabolism during treatment is extremely valuable to investigate cellular response and treatment efficacy. Here, we screened a library of KIs and shown different metabolic adaptations following 24 hours of treatment. Metabolomic data showed that inhibitors can modulate metabolic substrates uptake and product excretion in the presence of similar ATP levels. In our first application, we focused on four KIs that can change the lactate/pyruvate ratio, an important and clinically validated measure of the intracellular redox potential and of cellular respiration37,38. The lactate/pyruvate ratio is a potential therapeutic target relevant not only to hypoxic and ischemic disease but also to many other pathologies, including genetic mitochondrial diseases37,38. The focus on compounds acting on this important parameters emerged after the first screen, demonstrating one advantage (hypothesis generation) of the metabolomic method we describe as compared to drug screens based on the measurement of one or two metabolites.
There are many other possible applications of this method, for example lactate production and substrate utilization in cancer versus non-cancer cells24,36 or gluconeogenesis from different substrates in hepatocytes, relevant to diabetes39,40. Importantly, because the measurements are performed within a global metabolic profile, they can also provide a series of compounds with partially different mechanisms of actions, which can be explored for potential synergies41-44. Because the inhibitors we used have known targets, the screen can also be used to generate hypotheses about metabolic relevant signal transduction mechanisms. For example, the two most closely related KIs (Fig. 4c) target eEF-2 kinase45 and NF-kB46. Additionally eEF-2 kinase has been linked to other metabolically relevant pathways and to the autophagic process47. These relationships can be followed up experimentally, with the caveat that we might not know all the targets of the inhibitors we have used.
We believe that this NMR-based assay might find an immediate relevant application for screening a large number of individual or combinatorial drug interventions reducing the number of possible drugs to be studied more in detail. In addition, it might find an immediate relevant application into clinical studies. The possibility of using cells directly taken from patients might open new routes for the development of personalized drug treatment48,49.
Methods
Primary AML cells and cell lines
Bone marrow specimens from untreated acute myeloid and lymphoblastic leukemia patients were obtained from Rady Children's hospital, San Diego, CA. Informed consent was obtained from all patients involved and study was performed in accordance with IRB guidelines. Within 6 hours after sampling, mononuclear cells were isolated by Ficoll-paque (GE Healthcare, CA) density gradient centrifugation (1.077 g/cm3) at 400 g for 30 minute followed by three washes in PBS. Isolated mononuclear cells were allowed to adhere to the 96-well plate overnight in RPMI 1640 medium (HyClone, CA). Non-adherent mononuclear cells were collected in order to enrich lymphocyte population.
CCRF-CEM and SKOV-3 cell lines were maintained in exponential proliferation in RPMI 1640 medium (HyClone, CA) while HeLa cells were grown in DMEM (HyClone, CA). Both media were supplemented with 10% FBS (HyClone, CA), 1% 200 mM L-glutamine (Omega, CA), and 1% penicillin/streptomycin (Omega, CA). The cells were cultured in a humidified chamber at 37 °C with 5% CO2.
Isolated non-adherent mononuclear, CCRF-CEM, SKOV-3 and HeLa cells were seeded in 96-well plates (Greiner bio-one, CA) at the density of 3×10⁵, 1×10⁵, 3 ×10⁴, 1.5×10⁴ cells/well, respectively and allowed to adapt/attach for 6 hours prior to treatment. Doubling time was 24, 48, and 24 hours for CCRF-CEM, SKOV-3 and HeLa cells, respectively.
For each cell type, the number of cells seeded per well was determined using a luminescent ATP-detection assay (Perkin Elmer, MA; Supplementary Methods) such that the cells remained in their linear range of growth and the maximum number of cells per well was obtained 30 hours after seeding (accounting for 6 hours of adaptation and 24 hours of treatment).
Drug treatments
Both CCRF-CEM and SKOV-3 cells were treated for 24 hours with the following drugs: dichloroacetate (20 uM; Sigma-Aldrich, MO), dexamethasone (50 nM, Calbiochem, CA), rapamycin (100 nM; Sigma-Aldrich, MO), vincristine (1 nM; Sigma-Aldrich, MO) and 3 different concentrations of L-asparaginase (0.01, 0.1, 1 U/ml; BioVendor Inc., Czech Republic). An untreated control group (solvent control) was also included in all the assays. All the drug treatments were performed in 6 replicates per condition. No alterations in cell numbers were observed following 24 hours of drug treatment. To reduce bias, the treatments were administered based on a randomized list of well positions.
Sample preparation for HCS experiments
The cells of interest were seeded in a 96-well plate with 200 μl of appropriate medium Ten μl of SDS was added to the culture medium via a multichannel electronic pipette. The final concentration of SDS in each well was 0.5% weight volume unless otherwise noted (all experiments with the exception of the optimization procedure detailed below). Immediately after addition of SDS, the 96-well plates were sealed and sonicated in an ice-cold ultrasonicating water bath for 5 minutes. The water bath temperature at the beginning of sonication was 4 °C and during sonication never exceeded 6 °C. At the end of sonication 160 μl were transferred from each well into a 3 mm NMR tube (Norell, Landis ville, NJ 08326 USA) containing TMSP-d4 (Cambridge Isotope Laboratories; final concentration 0.5 mM), phosphate buffer (final concentration 100 mM) and 10% of D2O (Cambridge Isotope Laboratories) to obtain a total volume of 200 μl. The overall time between dispensing SDS to the 96-well plate and sonicating the entire well content for lysing the cells and quenching their enzymatic activity was approximately 5 minutes.
NMR experiments
One dimensional standard 1H NMR and CPMG and 2D 1H JRES spectra were acquired on 500MHz Bruker and 600-MHz Bruker Avance equipped with a TCI cryoprobe spectrometers (BrukerBioSpin Corp., Billerica, MA, USA) both equipped with autosampler at 30 °C50-52. All the pulse sequences were implemented with excitation sculpting to suppress the water signal53. One-D and CPMG spectra were acquired using a 90° flip angle, 6 kHz spectral width, relaxation delay of 1 s, 16k data points, 8 dummy scans and 256 or 512 transients (approximately 15 or 30 minutes of acquisition per sample). Spin-spin relaxation delay of CPMG was set to 100 ms. Double spin echo sequence suppressing strong coupling artifacts was employed to acquire 2D JRES spectra52. Thirty-two increments were recorded in the indirect dimension using 16 transients per increment, 16k data points with 8 dummy scans and a recycle delay of 2 s; spectral widths of 6 kHz and 50 Hz were set in direct and indirect dimension, respectively (approximately 45 minutes of acquisition per sample).
Prior to Fourier transformation (FT), 1D and CPMG spectra were zero-filled and processed by multiplying the free induction decay by an exponential line broadening function of 0.5 Hz. Before FT, 2D JRES spectra were zero-filled in both dimensions, and apodization using combined sine-bell/exponential window function in the direct dimension and by a sine bell function in the incremented dimension has been applied54. Following Fourier transformation, the magnitude mode spectra were tilted by 45°, symmetrized and skyline projected (pJRES). All the NMR datasets were processed using NMRLab55 in the MATLAB programming environment (The MathWorks, Inc., Natick, MA). Post-processing of NMR spectra included scaling according to the probabilistic quotient method56, alignment, exclusion of selected signals arising from solvents, TMSP and DCA, binning at 0.005 ppm, and application of a generalized log transformation57. NMR resonances of metabolites were assigned using the Chenomx NMR Suite (version 6.0; Chenomx Inc., Edmonton, Canada) and other available libraries58,59.
Optimization and validation of metabolomics HCS method
To optimize the amount of SDS required to completely quench cell metabolism we monitored residual cell viability and metabolic activity in samples prepared without or with various amounts of SDS. Ten different concentration of SDS were considered ranging between 0.01 and 2% weight/volume (final concentration per well). Cellular viability and residual metabolism were monitored using both ATPlite assay (Supplementary Methods) and cell count (Countess automated cell counter, Invitrogen, CA) measurements in samples prepared using ultrasonication and with and without the addition of SDS. All the measurements were performed with 6 replicates per condition.
Additionally, to check for residual metabolism, a series of 1D NMR spectra were collected every 30 minutes over a period of 8 hours for live CCRF-CEM cells, cell lysed using only ultrasonication and cells simultaneously lysed and SDS inactivated. Subsequent multivariate analysis (PCA) was performed on 16 spectra per condition. For these experiments, the NMR spectra were acquired at 37 °C to maintain more suitable conditions for live cells.
To further validate the sample preparation method developed and assess a possible metabolomics bias arising from plate-to-plate variability, we acquired 1D 1H-NMR spectra of six wells perplate and per treatment condition over five different plates (in total 60 1H-NMR spectra, 30 replicates per condition) for CCRF-CEM cells with and without 1 U/ml L-asparaginase treatment.
Screening of kinase inhibitors library
Fifty-six KIs from the 384-well protein kinase inhibitor library I (InhibitorSelect, EMD Chemicals Inc.; Supplementary Table S4) were dissolved in DMSO, administered to CCRF-CEM cells at 1 μM (final concentration) for 24 hours and luminescence and NMR experiments were performed at least in triplicate. NMR spectra of the medium, containing solvent control and incubated with and without the cells in the same 96-well plate, were acquired in triplicate. To confirm initial hits, nine KIs were chosen and ATP assay and NMR experiments were acquired for three or more independent repeats on CCRF-CEM cells following 24 hours of treatment of KI at two different doses. For every plate, NMR spectra of two different controls, cells receiving solvent control and media incubated in the same 96-well plate without the cells but containing solvent control were acquired as well. The drugs were eEF-2 kinase inhibitor (BIM-0207152), 5-Iodo-indirubin-3′-monoxime (BIM-0207163), MK2a inhibitor (BIM-0086775), ERK Inhibitor II (BIM-0086749), PKC inhibitor (BIM-0050229), K-252a, Nocardiopsis sp. (BIM-0086768), Fascaplysin, Synthetic (BIM-0086751), Wee1 Inhibitor II (BIM-0207209), and NF-KB activation inhibitor (BIM-0086776) all administered at 1 μM (high dose) and 0.1 μM (low dose).
Hit follow-up studies were performed using dose response experiments for the above mentioned nine KIs. Dose response experiments were performed treating CCRF-CEM cells using six different clinically relevant concentrations of KI in the range of 0.05-2 μM. The intent of our study was to investigate the metabolomic response to KI treatment without affecting the cell biomass. IC50 values were calculated (Supplementary Table S4) based on the 50% reduction of ATP levels induced by treatment. No alterations in cell numbers were observed after 24 hours induced by KI treatments.
Statistical and chemometric analysis
After post-processing, NMR spectra were mean-centered and then subjected to PCA60 using MATLAB. Multivariate Z-factor values were calculated as indicated in Equations S1-S213,15(Supplementary Methods).
The relative concentrations of selected metabolites (as percent of control) are reported as mean values ± SEM. Statistical comparison between data obtained from untreated and individual KIs treatment was performed using an unpaired Student's t-test (statistical significance: *P< .05, **P< .01, and ***P< .001).
Supplementary Material
Acknowledgments
We thank Ziming Zhang and Jinghua Yu for their technical support for NMR experiments, Professor Maurizio Pellecchia (Sanford-Burnham Medical Research Institute) for access to his instrumentation. This work was supported by grants NIH R21AG030685, NSF CCF-0829891 and NIH P01-HL098053.
Footnotes
Author contribution S.T: Planning, experimentation, data analysis and manuscript writing, Y.K: Experimentation cell biology (primary cells and miRNA treatments), J.C: Experimentation cell biology (cell lines), R.W: Clinical leadership, G.P.: Scientific leadership and manuscript writing.
References
- 1.Duarte IF, et al. Analytical Approaches toward Successful Human Cell Metabolome Studies by NMR Spectroscopy. Anal Chem. 2009;81:5023–5032. doi: 10.1021/ac900545q. [DOI] [PubMed] [Google Scholar]
- 2.Abraham VC, Taylor DL, Haskins JR. High content screening applied to large-scale cell biology. Trends Biotechnol. 2004;22:15–22. doi: 10.1016/j.tibtech.2003.10.012. [DOI] [PubMed] [Google Scholar]
- 3.Baker M. Academic screening goes high-throughput. Nat Methods. 2010;7:787–792. [Google Scholar]
- 4.Neumann B, et al. High-throughput RNAi screening by time-lapse imaging of live human cells. Nat Methods. 2006;3:385–390. doi: 10.1038/nmeth876. [DOI] [PubMed] [Google Scholar]
- 5.Zanella F, Lorens JB, Link W. High content screening: seeing is believing. Trends Biotechnol. 2010;28:237–245. doi: 10.1016/j.tibtech.2010.02.005. [DOI] [PubMed] [Google Scholar]
- 6.Bradley SA, et al. Fermentanomics: Monitoring Mammalian Cell Cultures with NMR Spectroscopy. J Am Chem Soc. 2010;132:9531–9533. doi: 10.1021/ja101962c. [DOI] [PubMed] [Google Scholar]
- 7.Dietmair S, Timmins NE, Gray PP, Nielsen LK, Kromer JO. Towards quantitative metabolomics of mammalian cells: Development of a metabolite extraction protocol. Anal Biochem. 2010;404:155–164. doi: 10.1016/j.ab.2010.04.031. [DOI] [PubMed] [Google Scholar]
- 8.Kell DB, et al. Metabolic footprinting and systems biology: The medium is the message. Nat Rev Microbiol. 2005;3:557–565. doi: 10.1038/nrmicro1177. [DOI] [PubMed] [Google Scholar]
- 9.Sellick CA, et al. Effective Quenching Processes for Physiologically Valid Metabolite Profiling of Suspension Cultured Mammalian Cells. Anal Chem. 2009;81:174–183. doi: 10.1021/ac8016899. [DOI] [PubMed] [Google Scholar]
- 10.Wu HF, Southam AD, Hines A, Viant MR. High-throughput tissue extraction protocol for NMRand MS-based metabolomics. Anal Biochem. 2008;372:204–212. doi: 10.1016/j.ab.2007.10.002. [DOI] [PubMed] [Google Scholar]
- 11.Fischer E, Sauer U. Metabolic flux profiling of Escherichia coli mutants in central carbon metabolism using GC-MS. Eur J Biochem. 2003;270:880–891. doi: 10.1046/j.1432-1033.2003.03448.x. [DOI] [PubMed] [Google Scholar]
- 12.Ewald JC, Heux S, Zamboni N. High-throughput quantitative metabolomics: workflow for cultivation, quenching, and analysis of yeast in a multiwell format. 2009;81:3623–3629. doi: 10.1021/ac900002u. [DOI] [PubMed] [Google Scholar]
- 13.Kummel A, et al. Integration of Multiple Readouts into the Z' Factor for Assay Quality Assessment. J Biomol Screen. 2010;15:95–101. doi: 10.1177/1087057109351311. [DOI] [PubMed] [Google Scholar]
- 14.Malo N, Hanley JA, Cerquozzi S, Pelletier J, Nadon R. Statistical practice in high-throughput screening data analysis. Nat Biotechnol. 2006;24:167–175. doi: 10.1038/nbt1186. [DOI] [PubMed] [Google Scholar]
- 15.Zhang JH, Chung TDY, Oldenburg KR. A simple statistical parameter for use in evaluation and validation of high throughput screening assays. J Biomol Screen. 1999;4:67–73. doi: 10.1177/108705719900400206. [DOI] [PubMed] [Google Scholar]
- 16.Blower PE, et al. MicroRNA expression profiles for the NCI-60 cancer cell panel. Mol Cancer Ther. 2007;6:1483–1491. doi: 10.1158/1535-7163.MCT-07-0009. [DOI] [PubMed] [Google Scholar]
- 17.Avramis VI, Tiwari PN. Asparaginase (native ASNase or pegylatedASNase) in the treatment of acute lymphoblastic leukemia. Int J Nanomed. 2006;1:241–254. [PMC free article] [PubMed] [Google Scholar]
- 18.Pui CH, Campana D, Evans WE. Childhood acute lymphoblastic leukaemia -current status and future perspectives. Lancet Oncol. 2001;2:597–607. doi: 10.1016/S1470-2045(01)00516-2. [DOI] [PubMed] [Google Scholar]
- 19.Cohen P. Protein kinases - the major drug targets of the twenty-first century? Nat Rev Drug Discov. 2002;1:309–315. doi: 10.1038/nrd773. [DOI] [PubMed] [Google Scholar]
- 20.Manning G, Whyte DB, Martinez R, Hunter T, Sudarsanam S. The protein kinase complement of the human genome. Science. 2002;298:1912–+. doi: 10.1126/science.1075762. [DOI] [PubMed] [Google Scholar]
- 21.Gottschalk S, Anderson N, Hainz C, Eckhardt SG, Serkova NJ. Imatinib (STI571)-mediated changes in glucose metabolism in human leukemia BCR-ABL-positive cells. Clin Cancer Res. 2004;10:6661–6668. doi: 10.1158/1078-0432.CCR-04-0039. [DOI] [PubMed] [Google Scholar]
- 22.Griffin JL, Shockcor JP. Metabolic profiles of cancer cells. Nat Rev Cancer. 2004;4:551–561. doi: 10.1038/nrc1390. [DOI] [PubMed] [Google Scholar]
- 23.Hsu PP, Sabatini DM. Cancer cell metabolism: Warburg and beyond. Cell. 2008;134:703–707. doi: 10.1016/j.cell.2008.08.021. [DOI] [PubMed] [Google Scholar]
- 24.DeBerardinis RJ, Lum JJ, Hatzivassiliou G, Thompson CB. The biology of cancer: Metabolic reprogramming fuels cell growth and proliferation. Cell Metab. 2008;7:11–20. doi: 10.1016/j.cmet.2007.10.002. [DOI] [PubMed] [Google Scholar]
- 25.Beloueche-Babari M, et al. Magnetic resonance spectroscopy monitoring of mitogen-activated protein kinase signaling inhibition. Cancer Res. 2005;65:3356–3363. doi: 10.1158/10.1158/0008-5472.CAN-03-2981. [DOI] [PubMed] [Google Scholar]
- 26.Lodi A, et al. Hypoxia Triggers Major Metabolic Changes in AML Cells without Altering Indomethacin-Induced TCA Cycle Deregulation. ACS Chem Biol. 2011;6:169–175. doi: 10.1021/cb900300j. [DOI] [PMC free article] [PubMed] [Google Scholar]
- 27.Romanska HM, et al. Nuclear Magnetic Resonance Detects Phosphoinositide 3-Kinase/Akt-Independent Traits Common to Pluripotent Murine Embryonic Stem Cells and Their Malignant Counterparts. Neoplasia. 2009;11:1301. doi: 10.1593/neo.09850. [DOI] [PMC free article] [PubMed] [Google Scholar]
- 28.Tiziani S, et al. Metabolomic profiling of drug responses in acute myeloid leukaemia cell lines. 2009;4:e4251. doi: 10.1371/journal.pone.0004251. [DOI] [PMC free article] [PubMed] [Google Scholar]
- 29.Shushan B. A review of clinical diagnostic applications of liquid chromatographytandem mass spectrometry. Mass Spectrom Rev. 2010;29:930–944. doi: 10.1002/mas.20295. [DOI] [PubMed] [Google Scholar]
- 30.Howell SC, Mesleh MF, Opella SJ. NMR structure determination of a membrane protein with two transmembrane helices in micelles: MerF of the bacterial mercury detoxification system. Biochemistry. 2005;44:5196–5206. doi: 10.1021/bi048095v. [DOI] [PubMed] [Google Scholar]
- 31.Evans R, Haiber S, Nilsson M, Morris GA. Isomer Resolution by Micelle-Assisted Diffusion-Ordered Spectroscopy. Anal Chem. 2009;81:4548–4550. doi: 10.1021/ac9005777. [DOI] [PubMed] [Google Scholar]
- 32.Raftery D. High-throughput NMR spectroscopy. Anal Bioanal Chem. 2004;378:1403–1404. doi: 10.1007/s00216-003-2437-5. [DOI] [PubMed] [Google Scholar]
- 33.Mercier P, Lewis MJ, Chang D, Baker D, Wishart DS. Towards automatic metabolomic profiling of high-resolution one-dimensional proton NMR spectra. J Biomol NMR. 2011;49:307–323. doi: 10.1007/s10858-011-9480-x. [DOI] [PubMed] [Google Scholar]
- 34.Druker BJ, et al. Effects of a selective inhibitor of the Abl tyrosine kinase on the growth of Bcr-Abl positive cells. Nat Medicine. 1996;2:561–566. doi: 10.1038/nm0596-561. [DOI] [PubMed] [Google Scholar]
- 35.Harrington LS, Findlay GM, Lamb RF. Restraining PI3K: mTOR signalling goes back to the membrane. Trends BiochemSci. 2005;30:35–42. doi: 10.1016/j.tibs.2004.11.003. [DOI] [PubMed] [Google Scholar]
- 36.Heiden MGV, et al. Evidence for an Alternative Glycolytic Pathway in Rapidly Proliferating Cells. Science. 2010;329:1492–1499. doi: 10.1126/science.1188015. [DOI] [PMC free article] [PubMed] [Google Scholar]
- 37.Larach DB, Kofke WA, Le Roux P. Potential Non-Hypoxic/Ischemic Causes of Increased Cerebral Interstitial Fluid Lactate/Pyruvate Ratio: A Review of Available Literature. Neurocrit Care. 2011:1–14. doi: 10.1007/s12028-011-9517-8. [DOI] [PubMed] [Google Scholar]
- 38.DePinieux G, et al. Lipid-lowering drugs and mitochondrial function: Effects of HMG-CoA reductase inhibitors on serum ubiquinone and blood lactate/pyruvate ratio. 1996;42:333–337. doi: 10.1046/j.1365-2125.1996.04178.x. [DOI] [PMC free article] [PubMed] [Google Scholar]
- 39.Yang LL, et al. Metabolomic and mass isotopomer analysis of liver gluconeogenesis and citric acid cycle - II. Heterogeneity of metabolite labeling pattern. J Biol Chem. 2008;283:21988–21996. doi: 10.1074/jbc.M803455200. [DOI] [PMC free article] [PubMed] [Google Scholar]
- 40.Bain JR, et al. Metabolomics Applied to Diabetes Research Moving From Information to Knowledge. Diabetes. 2009;58:2429–2443. doi: 10.2337/db09-0580. [DOI] [PMC free article] [PubMed] [Google Scholar]
- 41.Feala JD, et al. Systems approaches and algorithms for discovery of combinatorial therapies. Rev SystBiol Med. 2010;2:181–193. doi: 10.1002/wsbm.51. [DOI] [PubMed] [Google Scholar]
- 42.Bollenbach T, Kishony R. Resolution of gene regulatory conflicts caused by combinations of antibiotics. Mol Cell. 2011;42:413–425. doi: 10.1016/j.molcel.2011.04.016. [DOI] [PMC free article] [PubMed] [Google Scholar]
- 43.Geva-Zatorsky N, et al. Protein Dynamics in Drug Combinations: a Linear Superposition of Individual-Drug Responses. Cell. 2010;140:643–651. doi: 10.1016/j.cell.2010.02.011. [DOI] [PubMed] [Google Scholar]
- 44.Calzolari D, et al. Search Algorithms as a Framework for the Optimization of Drug Combinations. PLoS Comput Biol. 2008;4 doi: 10.1371/journal.pcbi.1000249. [DOI] [PMC free article] [PubMed] [Google Scholar]
- 45.Arora S, et al. Identification and characterization of an inhibitor of eukaryotic elongation factor 2 kinase against human cancer cell lines. Cancer Res. 2003;63:6894–6899. [PubMed] [Google Scholar]
- 46.Kane LP, Shapiro VS, Stokoe D, Weiss A. Induction of NF-kappa B by the Akt PKB kinase. CurrBiol. 1999;9:601–604. doi: 10.1016/s0960-9822(99)80265-6. [DOI] [PubMed] [Google Scholar]
- 47.Cheng Y, et al. Cytoprotective Effect of the Elongation Factor-2 Kinase-Mediated Autophagy in Breast Cancer Cells Subjected to Growth Factor Inhibition. PLoS One. 2010;5 doi: 10.1371/journal.pone.0009715. [DOI] [PMC free article] [PubMed] [Google Scholar]
- 48.Clayton TA, et al. Pharmaco-metabonomic phenotyping and personalized drug treatment. Nature. 2006;440:1073–1077. doi: 10.1038/nature04648. [DOI] [PubMed] [Google Scholar]
- 49.Serkova NJ, Spratlin JL, Eckhardt SG. NMR-based metabolomics: Translational application and treatment of cancer. Curr Opin Mol Ther. 2007;9:572–585. [PubMed] [Google Scholar]
- 50.Beckonert O, et al. Metabolic profiling, metabolomic and metabonomic procedures for NMR spectroscopy of urine, plasma, serum and tissue extracts. Nat Protoc. 2007;2:2692–2703. doi: 10.1038/nprot.2007.376. [DOI] [PubMed] [Google Scholar]
- 51.Aue W, Karhan J, Ernst R. Homonuclear broad-band decoupling and 2-dimensional J-resolved NMR spectroscopy. J Chem Phys. 1976;64:4226–4227. [Google Scholar]
- 52.Thrippleton MJ, Edden RAE, Keeler J. Suppression of strong coupling artefacts in J-spectra. J Magn Reson. 2005;174:97–109. doi: 10.1016/j.jmr.2005.01.012. [DOI] [PubMed] [Google Scholar]
- 53.Hwang TL, Shaka AJ. Water suppression that works - Excitation sculpting using arbitrary wave-forms and pulsed-field gradients. J Magn Reson Ser A. 1995;112:275–279. [Google Scholar]
- 54.Tiziani S, Lodi A, Ludwig C, Parsons HM, Viant MR. Effects of the application of different window functions and projection methods on processing of H-1 J-resolved nuclear magnetic resonance spectra for metabolomics. Anal Chim Acta. 2008;610:80–88. doi: 10.1016/j.aca.2008.01.030. [DOI] [PubMed] [Google Scholar]
- 55.Gunther UL, Ludwig C, Ruterjans H. NMRLAB - Advanced NMR data processing in MATLAB. J Magn Reson. 2000;145:201–208. doi: 10.1006/jmre.2000.2071. [DOI] [PubMed] [Google Scholar]
- 56.Dieterle F, Ross A, Schlotterbeck G, Senn H. Probabilistic quotient normalization as robust method to account for dilution of complex biological mixtures. Application in H-1 NMR metabonomics. Anal Chem. 2006;78:4281–4290. doi: 10.1021/ac051632c. [DOI] [PubMed] [Google Scholar]
- 57.Parsons HM, Ludwig C, Gunther UL, Viant MR. Improved classification accuracy in 1-and 2-dimensional NMR metabolomics data using the variance stabilizing generalised logarithm transformation. BMC Bioinformatics. 2007;8 doi: 10.1186/1471-2105-8-234. [DOI] [PMC free article] [PubMed] [Google Scholar]
- 58.Cui Q, et al. Metabolite identification via the Madison Metabolomics Consortium Database. Nat Biotechnol. 2008;26:162–164. doi: 10.1038/nbt0208-162. [DOI] [PubMed] [Google Scholar]
- 59.Wishart DS, et al. HMDB: the human metabolome database. Nucleic Acids Res. 2007;35:D521–D526. doi: 10.1093/nar/gkl923. [DOI] [PMC free article] [PubMed] [Google Scholar]
- 60.Wold S, Esbensen K, Geladi P. Principal Component Analysis. Chemom Intell Lab Syst. 1987;2:37. [Google Scholar]
Associated Data
This section collects any data citations, data availability statements, or supplementary materials included in this article.