

Abstract
Objective
To evaluate the feasibility and cardiometabolic effects of mindfulness‐based stress reduction (MBSR) in women with overweight or obesity.
Methods
Eighty‐six women with BMI ≥ 25 kg/m2 were randomized to 8 weeks of MBSR or health education and followed for 16 weeks. The primary outcome was the Toronto Mindfulness Scale. Secondary outcomes included the Perceived Stress Scale‐10, fasting glucose, and blood pressure.
Results
Compared to health education, the MBSR group demonstrated significantly improved mindfulness at 8 weeks (mean change from baseline, 4.5 vs. −1.0; P = 0.03) and significantly decreased perceived stress at 16 weeks (−3.6 vs. −1.3, P = 0.01). In the MBSR group, there were significant reductions in fasting glucose at 8 weeks (−8.9 mg/dL, P = 0.02) and at 16 weeks (−9.3 mg/dL, P = 0.02) compared to baseline. Fasting glucose did not significantly improve in the health education group. There were no significant changes in blood pressure, weight, or insulin resistance in the MBSR group.
Conclusions
In women with overweight or obesity, MBSR significantly reduces stress and may have beneficial effects on glucose. Future studies demonstrating long‐term cardiometabolic benefits of MBSR will be key for establishing MBSR as an effective tool in the management of obesity.
Introduction
More than two‐thirds of US adults have overweight or obesity, which increases their risk for diabetes and cardiovascular disease 1. Stress could exacerbate obesity and its cardiometabolic comorbidities by impeding the adoption of healthy behaviors, altering the hypothalamic‐pituitary‐adrenal (HPA) axis and sympathetic nervous system and increasing chronic inflammation 2, 3, 4, 5. However, there is a lack of effective interventions targeting stress in obesity.
Mindfulness‐based stress reduction (MBSR), the most researched mindfulness‐based intervention, may be beneficial for reducing stress and cardiometabolic risk in patients with overweight or obesity 6, 7, 8. Potential mechanisms by which MBSR could improve cardiometabolic outcomes include physiological changes in cortisol and catecholamines, psychological changes in depressive and anxiety symptoms, self‐regulation, resilience, and coping, and behavioral changes in diet and physical activity 5, 7, 9, 10. Mindfulness‐based interventions, including MBSR, have been shown to decrease stress in various patient populations 11, 12, 13, 14, 15, 16, 17. Mindfulness‐based eating awareness training, developed for binge eating disorder, reduces binge eating episodes, improves self‐control, and may promote weight loss 18. Mindfulness‐based interventions have also been preliminarily shown to improve glucose and blood pressure in patients with diabetes 19, 20, 21. However, the cardiometabolic effects of MBSR have not been well studied in populations with overweight or obesity. We therefore conducted a randomized clinical trial to evaluate the feasibility and effects of MBSR in women with overweight or obesity.
Methods
Study population
Participants were recruited through Penn State Health Hershey Medical Center clinics and advertisements from November 2011 to December 2013. Inclusion criteria were women, age ≥ 18 years, and BMI ≥ 25 kg/m2. Exclusion criteria were current pregnancy, untreated hyperthyroidism or hypothyroidism, type 1 diabetes, androgen secreting tumor, Cushing syndrome, prolactin > 30 ng/mL, severe active neuropsychological disorder, psychosis or suicidal ideation, severe untreated depression or anxiety, inpatient admission for psychiatric disorder within the past 2 years, active alcohol or drug abuse, inability to read, speak, or write English, inability to commit to the intervention and follow‐up, current enrollment in a stress reduction program, mindfulness practice within the past 6 months (regular formal practice at least once a week), and current enrollment in other studies.
The study was approved by the Institutional Review Board of the Penn State College of Medicine. The trial was registered at clinicaltrials.gov (NCT01464398) prior to enrollment.
Study protocol and design
In this randomized clinical trial, women with overweight or obesity were randomized to MBSR or health education for 8 weeks and were followed for 16 weeks. Randomization was performed using a random number generator. SAS 9.2 proc plan (SAS Corp., Cary, North Carolina) was used to create a list based on a permuted‐blocks randomization scheme, having variable block sizes of 2 and 4, with equal allocation to the two arms. Randomization was stratified based on the presence or absence of polycystic ovarian syndrome (PCOS) to allow for secondary analysis of the effect sizes of MBSR in PCOS. We used the classic National Institutes of Health definition of PCOS as chronic hyperandrogenic anovulation 22. Personnel in the Department of Public Health Sciences generated the randomization scheme and only communicated it to the Class Schedulers.
The principal investigator, study coordinator, and all study personnel involved in the collection and review of outcomes data were blinded to the block size and group assignments. The Class Schedulers, participants, and instructors were directed to keep the group assignments concealed from the blinded study personnel. Details of the design and methods for this study have been described previously 23.
Intervention group: MBSR
Participants randomized to MBSR received the standard MBSR program consisting of instructor‐led weekly 2.5‐hour sessions for 8 weeks and a 6‐hour retreat session 24. One adaptation to standard MBSR was that participants were asked to do only 25 to 30 minutes of daily home practice instead of the standard 45 minutes. We have previously reported positive clinical outcomes and high adherence with 25 to 30 minutes of daily home practice 11, 20, 25. There were no other changes to the standard MBSR curriculum, including no changes to the type or content of meditation practice. The instructor who led the MBSR intervention was well qualified, having completed professional MBSR training and with 9 years of experience training others in mindfulness. During the study, the MBSR instructor received regular guidance from a supervisor highly experienced in teaching MBSR. The MBSR intervention lasted 8 weeks. Between 8 and 16 weeks, participants were encouraged to continue with the daily home practice, but there was no contact from intervention staff.
All participants in the MBSR and health education groups were given the same written guidelines on diet and exercise, which consisted of the American Academy of Nutrition and Dietetics' “General, Healthful Nutrition” handout and the Centers for Disease Control and Prevention's “Physical Activity and Health” webpage. These guidelines were the only information that was the same across both groups. The MBSR group did not receive any additional health education other than these guidelines.
Comparator group: health education
The health education group was taught by a registered dietitian who delivered additional diet and exercise information. To control for instructor attention and group support, the health education group also received instructor‐led, weekly, 2.5‐hour sessions for 8 weeks and a 6‐hour retreat. During sessions, the health education group received lectures and participated in learning activities about diet, exercise, general stress management, and the diagnosis, symptoms, complications, and treatments for obesity. Participants practiced exercising with cans, resistance bands, balls, and chairs and created their own exercise plan. They reviewed their own food logs and identified foods high in sodium and fat and low in fiber, as well as foods that were good protein choices. They created meal plans for themselves. During the stress management session, they wrote down what caused them to be stressed and what they did when they were stressed (e.g., ate more, cried). This was followed by a discussion on how to relieve stress.
General stress management was included in the health education group to minimize the bias of subject expectations. The health education group did not receive any mindfulness. The MBSR group received a more extensive discussion on stress and practiced using mindfulness to respond to stress, which is a key component of the MBSR curriculum 24.
Because weight loss is not a part of the MBSR curriculum, all subjects were informed at enrollment that the primary focus of the study was stress reduction, not weight reduction. They were informed that the study was being done to determine the effects of stress reduction on glucose, blood pressure, and overall health. To limit subject expectation bias, subjects were not told that one program was hypothesized to be more effective than the other. They were told that the study was being done to test two different stress reduction programs, one of which is combined with health education.
Outcomes
Validated questionnaires and focused physical exam and laboratory assessments were obtained at baseline, 8 weeks, and 16 weeks. The primary outcome was the change from baseline in the validated Toronto Mindfulness Scale (TMS), a measure of one's ability to be mindful, that is, in a state of curious, decentered awareness of one's experiences 26. This was selected as the primary outcome to demonstrate that MBSR is feasible in our population and leads to increased mindfulness. Before completing the TMS, participants were instructed to sit quietly for 15 minutes, paying attention to their breathing or anything else that arose. Afterward, they rated the degree to which 13 items described what they experienced on a scale from 0 (not at all) to 4 (very much).
Perceived stress was assessed with the well‐validated Perceived Stress Scale‐10, a measure of the degree to which one perceives his or her life as stressful 27. Quality of life was assessed with the validated Short Form‐36 (SF‐36), which yields an eight‐scale profile of functional health and well‐being scores, as well as a physical component summary score and a mental component summary score 28. Participants completed the validated Brief Symptoms Inventory‐18, which yields three symptom dimensions: somatization (6 items), depression (6 items), and anxiety (6 items), as well as a measure of overall psychological distress based on all 18 items, called the Global Severity Index 29. Participants completed the validated Positive and Negative Affect Schedule, in which they rated the extent to which they felt 20 different feelings and emotions during the past week 30. The Positive and Negative Affect Schedule yields a positive affect measure and a negative affect measure. Sleep‐related impairment was assessed using the validated Patient‐Reported Outcomes Measurement Information System Sleep‐Related Impairment version 1.0 short form 31, 32.
Participants were weighed while dressed in light clothing, without shoes. Weight was followed during the study because it is an important metabolic outcome, but participants were informed that the primary focus of the study was stress reduction, not weight reduction. Three separate blood pressure measurements were obtained in the right arm in accordance with American Heart Association recommendations 33.
Fasting blood samples were obtained and analyzed using validated assays for glucose (glucose oxidase method), insulin (radioimmunoassay‐double antibody [EMD Millipore, Billerica, Massachusetts]), hemoglobin A1c (immunoturbidimetry, COBAS INTEGRA 800 [Roche Diagnostics USA, Indianapolis, Indiana]), lipid profile (spectrophotometric, Olympus 5400 [Olympus, Center Valley, Pennsylvania]), and high sensitive C‐reactive protein (enzyme immunoassay [ALPCO, Salem, New Hampshire]). Salivary cortisol was determined by enzyme immunoassay (Salimetrics, State College, Pennsylvania) using saliva samples collected by participants three times a day for 2 days before each visit: 1 immediately upon waking in the morning, 2 30 minutes later, and 3 at night just before going to sleep 23. Assays for hemoglobin A1c and lipid profile were performed at Quest Laboratories (Chantilly, Virginia). All other assays were performed at the General Clinical Research Center and Core Endocrine Lab at Penn State College of Medicine (Hershey, Pennsylvania). All assays had intra‐ and interassay coefficients of variation less than 15%.
Statistical analysis
It was determined that a sample size of 72 (36 per group, which included a 15% dropout factor) would provide 90% power to detect an absolute difference in TMS total score change from baseline to week 8 means between the MBSR and health education groups, assuming change from baseline TMS total score group means of 0.3 in the health education group and 7.6 in the MBSR group; a standard deviation (SD) of 8.6; and a two‐sided test having a type I error of 0.05. Additional participants were randomized in order to maintain reasonable class sizes while achieving recruitment targets. Conservative estimates of effect size and variability for sample size estimation for TMS total score were primarily based on a study by Gayner et al. and assumed a within‐subject correlation coefficient of 0.6 34.
Data analysis followed the principle of intent‐to‐treat. Linear mixed‐effects models were fit and contrasts constructed to assess changes from baseline within the treatment groups and differences of those changes between treatment groups with respect to continuous outcomes over time. The independent variables were treatment group, time of the visit, and their interaction. We also controlled for PCOS as a covariate in the mixed‐effects models. Residual diagnostics were assessed to determine the appropriateness of the model fit, and, if necessary, transformations of the response were used to meet modeling assumptions.
Results
Eighty‐six women with BMI ≥ 25 kg/m2 were randomized to 8 weeks of MBSR (n = 42) or health education (n = 44). The two groups were similar in age, BMI, and other baseline characteristics (Table 1). Although it looks like the MBSR group had higher baseline TMS scores, this difference was not significant. We followed up on all participants regardless of how regularly they participated in the intervention sessions. Sixty‐one participants (71%) completed the 8‐week follow‐up visit (MBSR 35/42 = 83.3%; health education 26/44 = 59.1%). Fifty‐three participants (62%) completed the 16‐week follow‐up visit (MBSR 31/42 = 73.8%; health education 22/44 = 50.0%). At 8 weeks, the dropout rate was significantly higher in the health education group than in the MBSR group (P = 0.01). The flow of participants through the study is shown in Figure 1.
Table 1.
Baseline characteristics of randomized participants
|
Total (n = 86) |
Mindfulness‐based stress reduction (n = 42) |
Health education (n = 44) |
|
|---|---|---|---|
| Age, y | 44.5 (12.5) | 47.0 (11.5) | 42.2 (13.1) |
| Race, n (%) | |||
| White | 77 (89.5) | 37 (88.1) | 40 (90.9) |
| Black | 5 (5.8) | 3 (7.1) | 2 (4.6) |
| Other | 4 (4.7) | 2 (4.8) | 2 (4.6) |
| Hispanic, n (%) | 4 (4.7) | 1 (2.4) | 3 (6.8) |
| Weight, kg | 103.2 (24.1) | 104.2 (21.5) | 102.3 (26.6) |
| BMI, kg/m2 | 38.9 (8.7) | 39.0 (7.7) | 38.8 (9.7) |
| Waist circumference, cm | 111.3 (19.0) | 112.6 (20.3) | 110.0 (17.8) |
| Systolic blood pressure, mm Hg | 124.3 (16.2) | 126.2 (16.7) | 122.4 (15.7) |
| Diastolic blood pressure, mm Hg | 77.7 (8.5) | 79.2 (8.6) | 76.2 (8.3) |
| Prediabetes, n (%) | 35 (40.7) | 17 (40.5) | 18 (40.9) |
| Type 2 diabetes, n (%) | 21 (24.4) | 10 (23.8) | 11 (25.0) |
| Polycystic ovary syndrome, n (%) | 32 (37.2) | 15 (35.7) | 17 (38.6) |
| Laboratory measures | |||
| Fasting glucose, mg/dL | 105.1 (46.0) | 101.7 (45.0) | 108.2 (47.3) |
| Fasting insulin, μU/mL | 31.3 (28.3) | 30.3 (22.0) | 32.4 (33.6) |
| HOMA‐IR | 3.9 (3.2) | 3.7 (2.7) | 4.0 (3.7) |
|
Hemoglobin A1c (%)
[mmol/mol] |
6.3 (1.6) [45] |
6.2 (1.4) [44] |
6.4 (1.7) [46] |
| Total cholesterol, mg/dL | 191.5 (36.5) | 190.8 (41.9) | 192.2 (30.9) |
| HDL cholesterol, mg/dL | 41.6 (15.0) | 41.7 (14.7) | 41.4 (15.3) |
| LDL cholesterol, mg/dL | 117.4 (32.9) | 118.7 (39.9) | 116.1 (24.5) |
| Triglycerides, mg/dL | 181.1 (187.3) | 159.7 (83.4) | 201.5 (248.7) |
| HsCRP, mg/L | 10.2 (9.7) | 9.7 (9.9) | 10.7 (9.6) |
| Toronto Mindfulness Scale a | |||
| TMS Total a | 22.6 (11.1) | 24.3 (10.1) | 20.9 (11.8) |
| TMS Decentering a | 11.8 (5.6) | 12.7 (5.5) | 10.9 (5.6) |
| TMS Curiosity a | 10.8 (6.5) | 11.6 (5.8) | 10.0 (7.0) |
| Perceived Stress Scale‐10 score b | 22.2 (3.0) | 22.8 (3.2) | 21.6 (2.8) |
| PROMIS Sleep‐Related Impairment T‐score c | 55.9 (9.2) | 55.9 (9.3) | 56.0 (9.2) |
| Quality of life and psychological measures | |||
| SF‐36 Mental Component Summary c | 41.5 (11.6) | 40.5 (11.7) | 42.4 (11.5) |
| SF‐36 Physical Component Summary c | 46.3 (11.6) | 45.9 (12.2) | 46.6 (11.2) |
| BSI‐18 Global Severity Index T‐score c | 55.3 (10.1) | 55.4 (9.7) | 55.3 (10.6) |
| BSI‐18 Depression T‐score c | 54.4 (9.8) | 54.5 (10.3) | 54.4 (9.3) |
| BSI‐18 Anxiety T‐score c | 53.5 (10.0) | 54.0 (9.9) | 53.0 (10.2) |
| BSI‐18 Somatization T‐score c | 55.6 (11.0) | 55.6 (10.6) | 55.6 (11.5) |
| PANAS Positive Affect score d | 28.3 (8.8) | 28.2 (9.0) | 28.3 (8.6) |
| PANAS Negative Affect score d | 21.1 (7.7) | 22.3 (7.9) | 19.8 (7.3) |
Data are expressed as mean (SD) unless otherwise noted.
Range of possible scores for TMS: 0 to 28 for TMS Decentering subscore; 0 to 24 for TMS Curiosity subscore; 0 to 52 for TMS total score, which is the arithmetic sum of the two subscores. Higher values indicate a greater ability to be mindful, a state of curious, decentered awareness.
Range of possible scores for Perceived Stress Scale‐10: 0 to 40. Higher values indicate greater perceived stress.
T‐scores and SF‐36 summary scales rescale the raw score into a standardized score with a mean of 50 and a SD of 10. For example, a T‐score of 60 is 1 SD greater than the mean for the general population.
Range of possible scores for each of the PANAS scores: 10 to 50. Higher Positive Affect scores indicate greater positive affect. Higher Negative Affect scores indicate greater negative affect.
Abbreviations: BSI‐18, Brief Symptom Inventory‐18; HOMA‐IR, homeostatic index of insulin resistance; HsCRP, high sensitive C‐reactive protein; LDL, low‐density lipoprotein; HDL, high‐density lipoprotein; PANAS, Positive and Negative Affect Schedule; PROMIS, Patient‐Reported Outcomes Measurement Information System; SF‐36, Short Form‐36; TMS, Toronto Mindfulness Scale.
Figure 1.
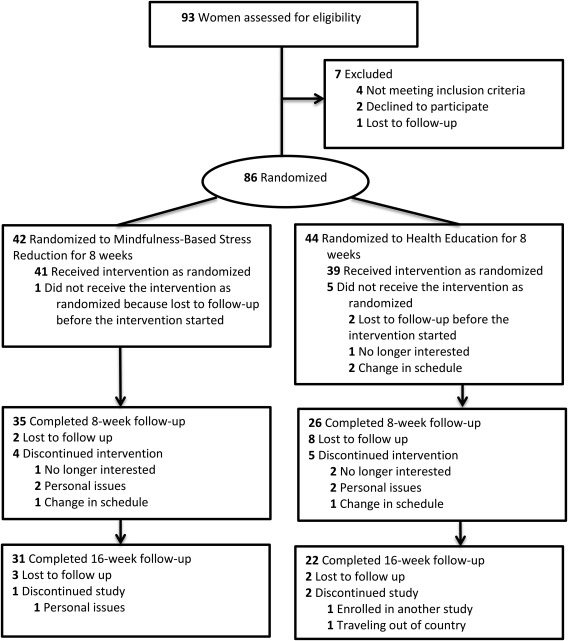
CONSORT flow diagram showing the progress of participants through each stage of this randomized clinical trial.
There was significant improvement in the primary outcome of mindfulness, as demonstrated by increased TMS total score with MBSR (19% increase from baseline) compared to health education at 8 weeks (P = 0.03) (Table 2). There was a significant between‐group difference of 5.4 in the change in TMS total score at 8 weeks, favoring the MBSR group (95% CI: 0.7‐10.2). Significance was not sustained at 16 weeks (Figure 2).
Table 2.
Changes from baseline in mindfulness, quality of life, and psychological measures (intent‐to‐treat analysis)
|
Mindfulness‐based stress reduction (n = 42) |
Health education (n = 44) |
Mindfulness‐based stress reduction vs. health education |
||||
|---|---|---|---|---|---|---|
|
8‐week mean (95% CI) (n = 35) |
16‐week mean (95% CI) (n = 31) |
8‐week mean (95% CI) (n = 26) |
16‐week mean (95% CI) (n = 22) |
8‐week between‐group difference (95% CI) |
16‐week between‐group difference (95% CI) |
|
| TMS | ||||||
| TMS Total | 4.5 (1.2 to 7.7)* | 2.2 (−2.2 to 6.7) | −1.0 (−4.4 to 2.5) | −2.0 (−7.0 to 2.9) | 5.4 (0.7 to 10.2)* | 4.2 (−2.4 to 10.9) |
| TMS Decentering | 3.0 (1.1 to 4.9)** | 1.5 (−0.9 to 3.8) | −0.6 (−2.7 to 1.4) | −1.1 (−3.8 to 1.5) | 3.6 (0.9 to 6.4)* | 2.6 (−0.9 to 6.1) |
| TMS Curiosity | 1.4 (−0.5 to 3.3) | 0.7 (−1.7 to 3.2) | −0.4 (−2.5 to 1.6) | −0.8 (−3.5 to 1.8) | 1.8 (−1.0 to 4.6) | 1.6 (−2.1 to 5.2) |
| Quality of life and psychological measures | ||||||
| Perceived Stress Scale‐10 score | −2.2 (−3.3 to −1.2)*** | −3.6 (−4.7 to −2.5)*** | −1.3 (−2.5 to −0.2)* | −1.3 (−2.6 to −0.0) | −0.9 (−2.5 to 0.7) | −2.3 (−4.0 to −0.6)* |
| PROMIS Sleep‐Related Impairment T‐score | −5.7 (−8.0 to −3.3)*** | −4.3 (−7.1 to −1.5)** | −7.8 (−10.3 to −5.2)*** | −7.8 (−11.0 to −4.6)*** | 2.1 (−1.3 to 5.6) | 3.5 (−0.8 to 7.7) |
| SF‐36 Mental Component Summary | 8.0 (4.9 to 11.1)*** | 5.3 (1.8 to 8.8)** | 4.1 (0.6 to 7.6)* | 3.3 (−0.7 to 7.2) | 3.9 (−0.8 to 8.5) | 2.1 (−3.2 to 7.3) |
| SF‐36 Physical Component Summary | −0.2 (−2.2 to 1.8) | 1.6 (−0.8 to 4.1) | −0.4 (−2.7 to 1.9) | 2.8 (0.1 to 5.5)* | 0.2 (−2.8 to 3.3) | −1.2 (−4.8 to 2.5) |
| BSI‐18 Global Severity Index T‐score | −3.2 (−5.4 to −0.9)* | −2.8 (−5.5 to −0.2)* | −4.4 (−6.9 to −1.9)*** | −3.7 (−6.7 to −0.6)* | 1.2 (−2.2 to 4.6) | 0.8 (−3.2 to 4.9) |
| BSI‐18 Depression T‐score | −3.8 (−6.6 to −1.0)* | −2.9 (−6.0 to 0.3) | −2.7 (−5.7 to 0.4) | −2.6 (−6.2 to 0.9) | −1.1 (−5.3 to 3.0) | −0.2 (−5.0 to 4.5) |
| BSI‐18 Anxiety T‐score | −4.0 (−6.7 to −1.3)** | −4.2 (−7.1 to −1.3)** | −3.6 (−6.6 to −0.7)* | −3.0 (−6.3 to 0.2) | −0.4 (−4.4 to 3.6) | −1.2 (−5.5 to 3.2) |
| BSI‐18 Somatization T‐score | −1.8 (−4.1 to 0.5) | −1.5 (−4.4 to 1.4) | −4.2 (−6.7 to −1.7)** | −3.4 (−6.7 to −0.2)* | 2.4 (−1.0 to 5.8) | 2.0 (−2.4 to 6.4) |
| PANAS Positive Affect Score | 4.1 (1.6 to 6.6)** | 3.6 (0.4 to 6.8)* | 5.0 (2.2 to 7.8)*** | 4.3 (0.7 to 7.9)* | −0.9 (−4.6 to 2.8) | −0.7 (−5.5 to 4.1) |
| PANAS Negative Affect Score | −5.6 (−7.7 to −3.6)*** | −4.2 (−6.8 to −1.6)** | −2.3 (−4.5 to −0.0) | −2.1 (−5.1 to 0.8) | −3.4 (−6.4 to −0.3)* | −2.1 (−6.0 to 1.8) |
P < 0.05.
P < 0.01.
P < 0.001.
Abbreviations: BSI‐18, Brief Symptom Inventory‐18; PANAS, Positive and Negative Affect Schedule; PROMIS, Patient‐Reported Outcomes Measurement Information System; SF‐36, Short Form‐36; TMS, Toronto Mindfulness Scale.
Figure 2.
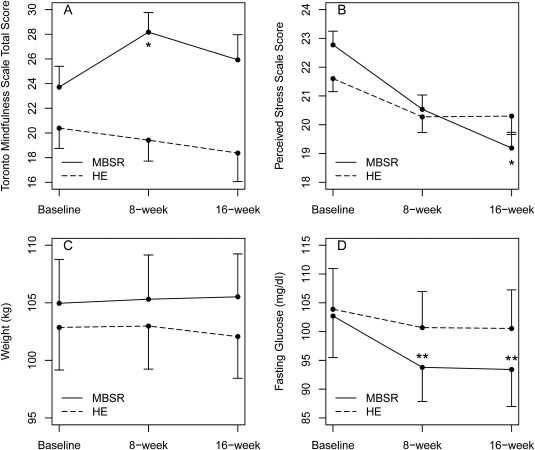
(A) Effect of mindfulness‐based stress reduction (MBSR) on mindfulness. *Between‐group change from baseline, P < 0.05. (B) Effect of MBSR on perceived stress. *Between‐group change from baseline, P < 0.05. (C) Lack of effect of MBSR on weight. (D) Effect of MBSR on fasting glucose. **Within‐group change from baseline, P < 0.05. Data are presented as means and SE for MBSR (solid line) and health education (HE) (dashed line) groups. All analyses are by intention‐to‐treat.
Perceived Stress Scale‐10 score significantly decreased with MBSR (15.8% decrease from baseline) compared to health education at 16 weeks (P = 0.01) (Table 2; Figure 2). There was a significant between‐group difference of −2.3 in the change in Perceived Stress Scale‐10 score at 16 weeks, favoring the MBSR group (95% CI: −4.0 to −0.6). Compared to health education, MBSR significantly reduced negative psychological affect at 8 weeks (P = 0.03) (Table 2). There were no significant differences in depression between the two groups. However, within the MBSR group, there was a significant reduction in depression at 8 weeks compared to baseline (P = 0.01), whereas no significant differences were seen in depression within the health education group. Within both groups, anxiety and SF‐36 mental component summary significantly improved at 8 weeks compared to baseline. At 16 weeks, improvements in anxiety and SF‐36 mental component summary from baseline remained significant only within the MBSR group and were no longer significant within the health education group; however, the between‐group differences were not statistically significant. Within both groups, overall psychological distress, positive psychological effect, and sleep‐related impairment significantly improved compared to baseline. There were no adverse events in the MBSR or health education group.
Within the MBSR group only, there were significant reductions in fasting glucose at 8 weeks (P = 0.02) and at 16 weeks (P = 0.02) compared to baseline (Figure 2). Fasting glucose did not significantly improve within the health education group. However, the between‐group difference did not reach statistical significance. Adjusting for diabetic status did not alter the glucose findings (results not shown). There was a significant reduction in systolic blood pressure at 8 weeks compared to baseline within the health education group (P < 0.05), but not within the MBSR group. However, the between‐group differences in blood pressure were not statistically significant. There were no significant changes in weight, BMI, waist circumference, fasting insulin, homeostatic index of insulin resistance, hemoglobin A1c, lipid profile, high sensitive C‐reactive protein, or salivary cortisol in the MBSR or health education group (Table 3; Figure 3).
Table 3.
Changes from baseline in metabolic measures (intent‐to‐treat analysis)
|
Mindfulness‐based stress reduction (n = 42) |
Health education (n = 44) |
Mindfulness‐based stress reduction vs. health education |
||||
|---|---|---|---|---|---|---|
|
8‐week mean (95% CI) (n = 35) |
16‐week mean (95% CI) (n = 31) |
8‐week mean (95% CI) (n = 26) |
16‐week Mean (95% CI) (n = 22) |
8‐week between‐group difference (95% CI) |
16‐week between‐group difference (95% CI) |
|
| Weight, kg | 0.4 (−0.6 to 1.3) | 0.6 (−0.5 to 1.7) | 0.1 (−0.9 to 1.2) | −0.8 (−2.1 to 0.5) | 0.2 (−1.2 to 1.6) | 1.4 (−0.3 to 3.0) |
| BMI, kg/m2 | 0.1 (−0.2 to 0.5) | 0.3 (−0.1 to 0.7) | 0.1 (−0.3 to 0.5) | −0.2 (−0.6 to 0.3) | 0.1 (−0.5 to 0.6) | 0.4 (−0.2 to 1.0) |
| Systolic blood pressure, mm Hg | −3.2 (−6.9 to 0.5) | −0.9 (−5.6 to 3.8) | −5.0 (−9.2 to −0.8)* | −1.8 (−7.1 to 3.5) | 1.8 (−3.8 to 7.4) | 0.9 (−6.2 to 7.9) |
| Diastolic blood pressure, mm Hg | −1.6 (−3.8 to 0.7) | −0.5 (−3.1 to 2.2) | −1.7 (−4.2 to 0.8) | −0.9 (−3.8 to 2.0) | 0.1 (−3.3 to 3.5) | 0.4 (−3.5 to 4.4) |
| Fasting glucose, mg/dL | −8.9 (−16.5 to −1.3)* | −9.3 (−17.1 to −1.5)* | −3.2 (−12.2 to 5.8) | −3.3 (−12.1 to 5.4) | −5.7 (−17.5 to 6.0) | −6.0 (−17.6 to 5.7) |
| Fasting insulin, μU/mL | 1.0 (−5.0 to 6.9) | −1.3 (−5.7 to 3.2) | 3.9 (−3.4 to 11.3) | −2.5 (−7.7 to 2.7) | −3.0 (−12.4 to 6.5) | 1.3 (−5.6 to 8.1) |
| HOMA‐IR | 0.2 (−0.4 to 0.9) | −0.1 (−0.6 to 0.4) | 0.4 (−0.4 to 1.3) | −0.3 (−0.9 to 0.3) | −0.2 (−1.3 to 0.9) | 0.2 (−0.6 to 1.0) |
| Hemoglobin A1c, % | −0.0 (−0.1 to 0.1) | 0.0 (−0.1 to 0.2) | 0.1 (−0.1 to 0.2) | 0.1 (−0.1 to 0.3) | −0.1 (−0.3 to 0.1) | −0.1 (−0.3 to 0.1) |
| LDL cholesterol, mg/dL | 6.1 (−1.5 to 13.8) | −1.0 (−8.2 to 6.3) | 8.0 (−1.0 to 17.0) | 4.0 (−4.7 to 12.7) | −1.9 (−13.7 to 9.9) | −5.0 (−16.3 to 6.3) |
| HsCRP, mg/L | 0.2 (−1.8 to 2.1) | 0.0 (−3.3 to 3.3) | −0.1 (−2.4 to 2.2) | 1.4 (−2.5 to 5.3) | 0.3 (−2.7 to 3.3) | −1.4 (−6.5 to 3.7) |
P < 0.05.
Abbreviations: HOMA‐IR, homeostatic index of insulin resistance; HsCRP, high sensitive C‐reactive protein; LDL, low‐density lipoprotein.
Figure 3.
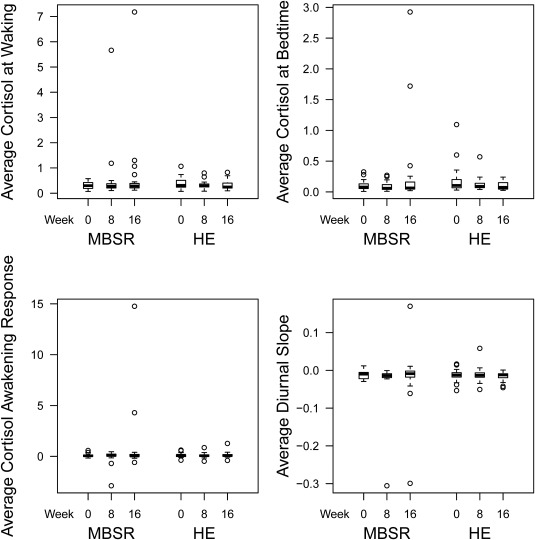
Boxplots of salivary cortisol at baseline, 8 weeks, and 16 weeks in the mindfulness‐based stress reduction (MBSR) group and the health education (HE) group.
Among the participants who attended at least one session, average adherence (defined as [hours of classes taken/26 hours] × 100) was not significantly different between groups (73.1 ± 28.5% [n = 41] in the MBSR group vs. 68.4 ± 29.0% [n = 39] in the health education group; P = 0.46). Class sizes, defined as number randomized, ranged from 2 to 11 in the MBSR group and 2 to 12 in the health education group. There was no correlation between adherence or class size and the change in TMS at 8 weeks in the MBSR group.
Discussion
In this study of women with overweight or obesity, MBSR significantly increased mindfulness and decreased perceived stress compared to health education. Additionally, fasting glucose significantly decreased within the MBSR group at 8 weeks and at 16 weeks, but not within the health education group. The between‐group difference did not reach statistical significance, possibly because this study was not powered to detect a difference in glucose.
The reason for the reduced fasting glucose in the MBSR group remains unclear. There were no changes in weight, cortisol, or insulin resistance to explain the reduction in glucose. One possible explanation is that the increased mindfulness could have made it easier for the MBSR group to adhere to the diet and exercise guidelines we gave them. If, as our study suggests, MBSR lowers glucose in people with overweight or obesity, then it could be an effective tool for preventing or treating type 2 diabetes.
Few studies have shown that mindfulness per se can improve metabolic parameters. One recent study of adults with obesity reported maintenance of fasting glucose in the mindfulness with diet‐exercise arm compared to increased fasting glucose of 2.5 mg/dL in the diet‐exercise alone arm 35. Another study in women with overweight or obesity found no differences in fasting glucose in the mindfulness group compared to a waitlist control group 36. The different results could be due to differences in the type or duration of the mindfulness intervention, whether or not the mindfulness intervention included diet‐exercise components, and the comparator group used.
A potential mechanism by which MBSR may reduce glucose is through the HPA axis 37. We did not observe any effects on salivary cortisol in the present study. As cortisol is secreted in a diurnal pattern, it may be important to evaluate effects on more integrated measures of cortisol, such as 24‐hour urine free cortisol. In addition, there may be changes in the HPA axis beyond cortisol levels, such as alterations in cortisol receptor sensitivity, that may be worth exploring further. Another potential mechanism by which MBSR may reduce glucose is through the sympathetic nervous system. In support of this, a previous study demonstrated that MBSR significantly reduced catecholamine levels at 1 year; however, we did not evaluate this in our study 38.
Although the sample size was moderate, our study was not powered to detect a difference in glucose. It was powered to detect a difference in mindfulness in order to establish the feasibility of MBSR in women with overweight or obesity. The present study has provided us with a more precise estimate of effect size and variability of glucose for future trials. A future randomized, clinical trial having at least 80% statistical power would require a sample size of 122 subjects per group (i.e., a total of 244 subjects) to detect a difference in the change in fasting glucose from baseline to week 8 of 7.1 mg/dL (SD = 19.7 mg/dL) between MBSR and health education using a two‐sided test having a significance level of 0.05.
The only metabolic improvement noted within the health education group was a significant 5 mm Hg reduction in systolic blood pressure at 8 weeks. The MBSR group also demonstrated a 3.2 mm Hg reduction, so the between‐group difference was not significant.
One limitation of our study is that 71% of all the participants completed the 8‐week study visit and 62% of all participants completed the 16‐week study visit. Reasons for dropout included personal issues and changes in participants' schedules that made it difficult for them to continue to participate in the study given the nonflexible timing of sessions, long duration of sessions, and difficulty commuting. The majority of dropouts were in the health education group, which actually lends support to the feasibility and acceptability of MBSR in women with overweight or obesity. Retention rates in the MBSR group were 83.3% at the 8‐week study visit and 73.8% at the 16‐week study visit, which is comparable to what has been reported in other MBSR studies 19, 20, 38, 39, 40. The relatively high attrition in the health education group is evidence that the current standard of care is ineffective and unappealing to patients, but it also limits the generalizability of our findings. Due to the sample size decreasing over time, statistically insignificant results must be viewed with caution because of the increased probability of a type II error; however, we have provided effect sizes and corresponding 95% CIs to quantify the strength of any differences. In future research, better strategies for minimizing attrition and enhancing retention in the health education group will be needed, such as more flexible scheduling of sessions, online delivery to minimize traveling burden for participants, more engaging learning activities instead of lectures, and compensating participants for attending each session. Future studies should also consider that attrition in the comparator group may be minimized with the use of an actual control group with no intervention instead of a health education intervention. Another benefit of such a study design is that MBSR would be the only difference between the two groups.
A second limitation is that we did not assess dietary intake. Future studies should evaluate whether changes in dietary intake could explain the improvement in glucose and other outcomes. Another limitation is that with a behavioral intervention, it was not possible to blind participants. Additionally, as our study population only included women, the results may not be generalizable to men. Finally, the duration of follow‐up was relatively short, so future studies are needed to assess long‐term effects of MBSR in obesity.
Conclusion
In conclusion, MBSR significantly increased mindfulness and decreased perceived stress compared to health education in women with overweight or obesity. Fasting glucose significantly decreased compared to baseline in the MBSR group but not in the health education group. Future studies are needed to determine whether a sustained increase in mindfulness with a longer mindfulness‐based intervention would result in even greater and more long‐term benefits.
Acknowledgments
We thank all study participants, coordinator Barbara Scheetz, BS, and schedulers Lisa Doster and Carol Creter, Penn State Health Hershey Medical Center (PSHMC). Donald McCown, PhD, West Chester University, supervised the MBSR instructor. The PSHMC Core Endocrine Lab ran the assays. The Data and Safety Monitoring Board was led by Tom Lloyd, PhD, PSHMC, and included Michael J. Baime, MD, University of Pennsylvania, Michele L. Shaffer, PhD, Seattle Children's Hospital, and Stephanie Estes, MD, PSHMC.
Funding agencies: This work was supported by a grant from the National Institutes of Health (NIH), National Center for Complementary and Alternative Medicine (NCCAM) (K23AT006340 to NR). This work was also supported by a grant from the National Center for Research Resources and the National Center for Advancing Translational Sciences, NIH (UL1TR000127). The content is solely the responsibility of the authors and does not necessarily represent the official views of NCCAM or NIH.
Disclosure: RSL reports consulting fees from Euroscreen, Astra Zeneca, Clarus Therapeutics, Takeda, and Kindex and research funding from Ferring and Astra Zeneca. ARK reports owning stock in Merck. The other authors declared no conflicts of interest.
Clinical trial registration: ClinicalTrials.gov identifier NCT01464398.
References
- 1. Ogden CL, Carroll MD, Kit BK, Flegal KM. Prevalence of childhood and adult obesity in the United States, 2011‐2012. JAMA 2014;311:806‐814. [DOI] [PMC free article] [PubMed] [Google Scholar]
- 2. Chrousos GP, Gold PW. A healthy body in a healthy mind—and vice versa—the damaging power of “uncontrollable” stress. J Clin Endocrinol Metab 1998;83:1842‐1845. [DOI] [PubMed] [Google Scholar]
- 3. Black PH. The inflammatory response is an integral part of the stress response: implications for atherosclerosis, insulin resistance, type II diabetes and metabolic syndrome X. Brain Behav Immun 2003;17:350‐364. [DOI] [PubMed] [Google Scholar]
- 4. Miller GE, Freedland KE, Carney RM, Stetler CA, Banks WA. Pathways linking depression, adiposity, and inflammatory markers in healthy young adults. Brain Behav Immun 2003;17:276‐285. [DOI] [PubMed] [Google Scholar]
- 5. Raja‐Khan N, Stener‐Victorin E, Wu X, Legro RS. The physiological basis of complementary and alternative medicines for polycystic ovary syndrome. Am J Physiol Endocrinol Metab 2011;301:E1‐E10. [DOI] [PMC free article] [PubMed] [Google Scholar]
- 6. Godsey J. The role of mindfulness based interventions in the treatment of obesity and eating disorders: an integrative review. Complement Ther Med 2013;21:430‐439. [DOI] [PubMed] [Google Scholar]
- 7. O'Reilly GA, Cook L, Spruijt‐Metz D, Black DS. Mindfulness‐based interventions for obesity‐related eating behaviours: a literature review. Obes Rev 2014;15:453‐461. [DOI] [PMC free article] [PubMed] [Google Scholar]
- 8. Camilleri GM, Mejean C, Bellisle F, Hercberg S, Peneau S. Association between mindfulness and weight status in a general population from the NutriNet‐Sante Study. PLoS One 2015;10:e0127447. doi:10.1371/journal.pone.0127447 [DOI] [PMC free article] [PubMed] [Google Scholar]
- 9. Mantzios M, Wilson JC. Mindfulness, eating behaviours, and obesity: a review and reflection on current findings. Curr Obes Rep 2015;4:141‐146. [DOI] [PubMed] [Google Scholar]
- 10. Loucks EB, Schuman‐Olivier Z, Britton WB, et al. Mindfulness and cardiovascular disease risk: state of the evidence, plausible mechanisms, and theoretical framework. Curr Cardiol Rep 2015;17:112. doi:10.1007/s11886-015-0668-7 [DOI] [PMC free article] [PubMed] [Google Scholar]
- 11. Reibel DK, Greeson JM, Brainard GC, Rosenzweig S. Mindfulness‐based stress reduction and health‐related quality of life in a heterogeneous patient population. Gen Hosp Psychiatry 2001;23:183‐192. [DOI] [PubMed] [Google Scholar]
- 12. Carlson LE, Speca M, Patel KD, Goodey E. Mindfulness‐based stress reduction in relation to quality of life, mood, symptoms of stress and levels of cortisol, dehydroepiandrosterone sulfate (DHEAS) and melatonin in breast and prostate cancer outpatients. Psychoneuroendocrinology 2004;29:448‐474. [DOI] [PubMed] [Google Scholar]
- 13. Ludwig DS, Kabat‐Zinn J. Mindfulness in medicine. JAMA 2008;300:1350‐1352. [DOI] [PubMed] [Google Scholar]
- 14. Nyklicek I, Kuijpers KF. Effects of mindfulness‐based stress reduction intervention on psychological well‐being and quality of life: is increased mindfulness indeed the mechanism? Ann Behav Med 2008;35:331‐340. [DOI] [PMC free article] [PubMed] [Google Scholar]
- 15. Kimbrough E, Magyari T, Langenberg P, Chesney M, Berman B. Mindfulness intervention for child abuse survivors. J Clin Psychol 2010;66:17‐33. [DOI] [PubMed] [Google Scholar]
- 16. Goyal M, Singh S, Sibinga EM, et al. Meditation programs for psychological stress and well‐being: a systematic review and meta‐analysis. JAMA Intern Med 2014;174:357‐368. [DOI] [PMC free article] [PubMed] [Google Scholar]
- 17. Black DS, O'Reilly GA, Olmstead R, Breen EC, Irwin MR. Mindfulness meditation and improvement in sleep quality and daytime impairment among older adults with sleep disturbances: a randomized clinical trial. JAMA Intern Med 2015;175:494‐501. [DOI] [PMC free article] [PubMed] [Google Scholar]
- 18. Kristeller JL, Wolever RQ. Mindfulness‐based eating awareness training for treating binge eating disorder: the conceptual foundation. Eat Disord 2011;19:49‐61. [DOI] [PubMed] [Google Scholar]
- 19. Gregg JA, Callaghan GM, Hayes SC, Glenn‐Lawson JL. Improving diabetes self‐management through acceptance, mindfulness, and values: a randomized controlled trial. J Consult Clin Psychol 2007;75:336‐343. [DOI] [PubMed] [Google Scholar]
- 20. Rosenzweig S, Reibel DK, Greeson JM, et al. Mindfulness‐based stress reduction is associated with improved glycemic control in type 2 diabetes mellitus: a pilot study. Altern Ther Health Med 2007;13:36‐38. [PubMed] [Google Scholar]
- 21. Youngwanichsetha S, Phumdoung S, Ingkathawornwong T. The effects of mindfulness eating and yoga exercise on blood sugar levels of pregnant women with gestational diabetes mellitus. Appl Nurs Res 2014;27:227‐230. [DOI] [PubMed] [Google Scholar]
- 22. Zawadzki JK, Dunaif A. Diagnostic criteria for polycystic ovary syndrome: towards a rational approach In: Dunaif A, Givens JR, Haseltine F, eds. Polycystic Ovary Syndrome. Boston: Blackwell Scientific; 1992:377‐384. [Google Scholar]
- 23. Raja‐Khan N, Agito K, Shah J, et al. Mindfulness‐based stress reduction for overweight/obese women with and without polycystic ovary syndrome: design and methods of a pilot randomized controlled trial. Contemp Clin Trials 2015;41:287‐297. [DOI] [PMC free article] [PubMed] [Google Scholar]
- 24. Kabat‐Zinn J. Full Catastrophe Living: Using the Wisdom of Your Body and Mind to Face Stress, Pain, and Illness. New York: Delta; 1990. [Google Scholar]
- 25. Frank JL, Reibel D, Broderick P, Cantrell T, Metz S. The effectiveness of mindfulness‐based stress reduction on educator stress and well‐being: results from a pilot study. Mindfulness 2015;6:208‐216. [Google Scholar]
- 26. Lau MA, Bishop SR, Segal ZV, et al. The Toronto Mindfulness Scale: development and validation. J Clin Psychol 2006;62:1445‐1467. [DOI] [PubMed] [Google Scholar]
- 27. Cohen S, Williamson G. Perceived stress in a probability sample of the United States In: Spacapan S, Oskamp S, eds. The Social Psychology of Health: The Claremont Symposium on Applied Social Psychology. Newbury Park, CA: Sage; 1987. [Google Scholar]
- 28. Ware JE, Snow KK, Kosinski M, Gandek B. SF‐36® Health Survey Manual and Interpretation Guide. Boston, MA: New England Medical Center, The Health Institute; 1993. [Google Scholar]
- 29. Derogatis LR. Brief Symptom Inventory 18: Adminsitration, Scoring and Procedures Manual. Minneapolis, MN: National Computer Systems; 2000. [Google Scholar]
- 30. Watson D, Clark LA, Tellegen A. Development and validation of brief measures of positive and negative affect: the PANAS scales. J Pers Soc Psychol 1988;54:1063‐1070. [DOI] [PubMed] [Google Scholar]
- 31. Buysse DJ, Yu L, Moul DE, et al. Development and validation of patient‐reported outcome measures for sleep disturbance and sleep‐related impairments. Sleep 2010;33:781‐792. [DOI] [PMC free article] [PubMed] [Google Scholar]
- 32. Yu L, Buysse DJ, Germain A, et al. Development of short forms from the PROMIS sleep disturbance and Sleep‐Related Impairment item banks. Behav Sleep Med 2012;10:6‐24. [DOI] [PMC free article] [PubMed] [Google Scholar]
- 33. Pickering TG, Hall JE, Appel LJ, et al. Recommendations for blood pressure measurement in humans and experimental animals: Part 1: blood pressure measurement in humans: a statement for professionals from the Subcommittee of Professional and Public Education of the American Heart Association Council on High Blood Pressure Research. Hypertension 2005;45:142‐161. [DOI] [PubMed] [Google Scholar]
- 34. Gayner B, Esplen MJ, Deroche P, et al. A randomized controlled trial of mindfulness‐based stress reduction to manage affective symptoms and improve quality of life in gay men living with HIV. J Behav Med 2012;35:272‐285. [DOI] [PubMed] [Google Scholar]
- 35. Daubenmier J, Moran PJ, Kristeller J, et al. Effects of a mindfulness‐based weight loss intervention in adults with obesity: a randomized clinical trial. Obesity (Silver Spring) 2016;24:794‐804. [DOI] [PMC free article] [PubMed] [Google Scholar]
- 36. Daubenmier J, Lin J, Blackburn E, et al. Changes in stress, eating, and metabolic factors are related to changes in telomerase activity in a randomized mindfulness intervention pilot study. Psychoneuroendocrinology 2012;37:917‐928. [DOI] [PMC free article] [PubMed] [Google Scholar]
- 37. O'Leary K, O'Neill S, Dockray S. A systematic review of the effects of mindfulness interventions on cortisol. J Health Psychol 2016;21:2108‐2121. [DOI] [PubMed] [Google Scholar]
- 38. Kopf S, Oikonomou D, Hartmann M, et al. Effects of stress reduction on cardiovascular risk factors in type 2 diabetes patients with early kidney disease ‐ results of a randomized controlled trial (HEIDIS). Exp Clin Endocrinol Diabetes 2014;122:341‐349. [DOI] [PubMed] [Google Scholar]
- 39. van Son J, Nyklicek I, Pop VJ, et al. The effects of a mindfulness‐based intervention on emotional distress, quality of life, and HbA(1c) in outpatients with diabetes (DiaMind): a randomized controlled trial. Diabetes Care 2013;36:823‐830. [DOI] [PMC free article] [PubMed] [Google Scholar]
- 40. Tovote KA, Fleer J, Snippe E, et al. Individual mindfulness‐based cognitive therapy and cognitive behavior therapy for treating depressive symptoms in patients with diabetes: results of a randomized controlled trial. Diabetes Care 2014;37:2427‐2434. [DOI] [PubMed] [Google Scholar]