Liver stiffness is a sensitive but nonspecific indicator of hepatic disease, while damping ratio is an independent parameter that can complement liver stiffness to distinguish inflammation from fibrosis in the early stages of chronic liver disease, even before the development of histologically detectable necroinflammation and fibrosis.
Abstract
Purpose
To investigate the utility of magnetic resonance (MR) elastography–derived mechanical properties in the discrimination of hepatic inflammation and fibrosis in the early stages of chronic liver diseases.
Materials and Methods
All studies were approved by the institutional animal care and use committee. A total of 187 animals were studied, including 182 mice and five pigs. These animals represented five different liver diseases with a varying combination and extent of hepatic inflammation, fibrosis, congestion, and portal hypertension. Multifrequency three-dimensional MR elastography was performed, and shear stiffness, storage modulus, shear loss modulus, and damping ratio were calculated for all animals. Necroinflammation, fibrosis, and portal pressure were either histologically scored or biochemically and physically quantified in all animals. Two-sided Welch t tests were used to evaluate mean differences between disease and control groups. Spearman correlation analyses were used to evaluate the relationships between mechanical parameters and quantitative fibrosis extent (hydroxyproline concentration) and portal pressure.
Results
Liver stiffness and storage modulus increased with progressively developed fibrosis and portal hypertension (mean stiffness at 80 Hz and 48-week feeding, 0.51 kPa ± 0.12 in the steatohepatitis group vs 0.29 kPa ± 0.01 in the control group; P = .02). Damping ratio and shear loss modulus can be used to distinguish inflammation from fibrosis at early stages of disease, even before the development of histologically detectable necroinflammation and fibrosis (mean damping ratio at 80 Hz and 20-week feeding, 0.044 ± 0.012 in the steatohepatitis group vs 0.014 ± 0.008 in the control group; P < .001). Damping ratio and liver stiffness vary differently with respect to cause of portal hypertension (ie, congestion- or cirrhosis-induced hypertension). These differentiation abilities have frequency-dependent variations.
Conclusion
Liver stiffness and damping ratio measurements can extend hepatic MR elastography to potentially enable assessment of necroinflammatory, congestive, and fibrotic processes of chronic liver diseases.
© RSNA, 2017
Introduction
Chronic liver disease has many different causes, including viral infections, alcohol abuse, exposure to toxic chemicals, drug use, metabolic diseases (eg, nonalcoholic fatty liver disease [NAFLD]), autoimmune diseases, congestion (eg, right-sided heart failure), and others. All of these cause chronic damage to the liver via necroinflammation and activation of hepatic stellate cells and lead to the accumulation of extracellular matrix protein, which distorts the hepatic architecture by forming hepatic fibrosis with abnormal collagen deposition. Many investigations have shown that mechanical properties are promising surrogates with which to monitor and characterize various pathophysiologic conditions of cells and soft tissues (1,2). The mechanical properties of liver tissue appear promising in the differentiation of several abnormal conditions of the liver (3–6). Magnetic resonance (MR) elastography is a noninvasive imaging technology that can be used to measure tissue stiffness. This technique is beginning to see widespread clinical use in assessing hepatic fibrosis as a safer, more comfortable, and less expensive alternative to biopsy; it can also reduce biopsy-related complications and sampling errors (7–10).
Many investigations have shown that liver stiffness can have a static component that is mainly determined by extracellular matrix composites and structure (eg, hepatic fibrosis) and a dynamic component that is affected by intrahepatic hemodynamic changes (eg, inflammation, congestion, and portal hypertension) (11–13). The ability to distinguish how these components contribute to tissue stiffness and how the contributions change with different diseases temporally over the course of disease development will have important diagnostic and prognostic implications and will direct translational research. However, the value of mechanical properties other than shear stiffness in distinguishing different pathophysiologic states of the liver has yet to be established. These quantities include both model-free properties (eg, the complex shear modulus, volumetric strain, and frequency dispersion of mechanical properties) and model-based viscoelastic parameters (Appendix E1 [online]).
In this study, we evaluated the utility of the complex shear modulus  where G’ is storage modulus and G’’ is shear loss modulus; shear stiffness
  and damping ratio
  as measured with multifrequency three-dimensional MR elastography in five well-established in vivo animal models with hepatic inflammation, fibrosis, congestion, and portal hypertension. The main purpose of this study was to investigate the utility of MR elastography–derived mechanical properties in the discrimination of hepatic inflammation and fibrosis in the early stages of chronic liver diseases.
Materials and Methods
Animal Use
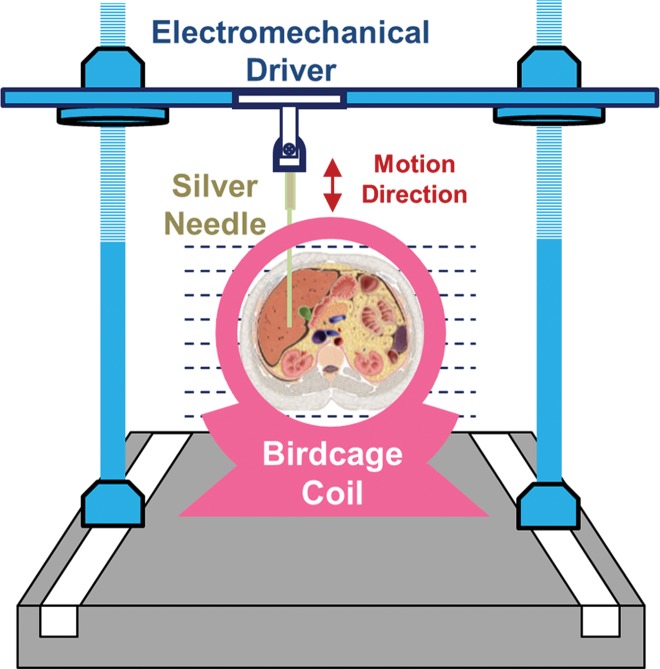
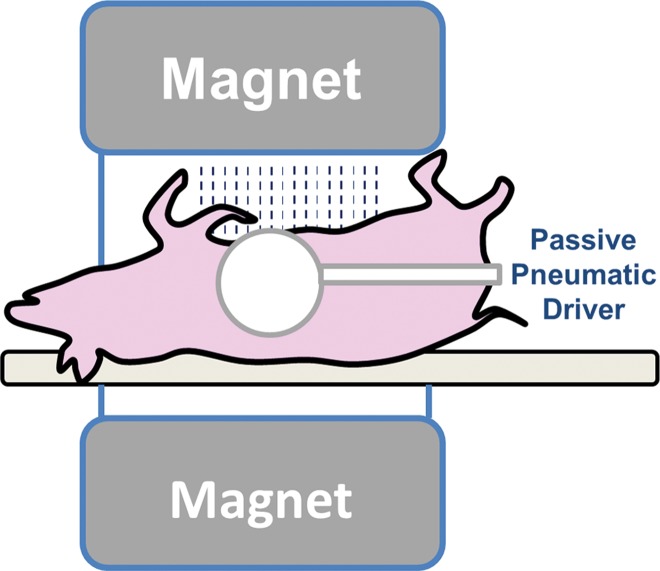
All activities related to animal subjects were reviewed and approved by the Mayo Clinic institutional animal care and use committee. A total of 182 mice and five pigs were used in this study. These animals represent models of five different liver diseases (knockout autosomal recessive polycystic kidney disease [ARPKD], carbon tetrachloride [CCl4]-induced liver disease, NAFLD, hepatic venous congestion, and fumarylacetoacetate hydrolase–deficient disease), with a prior power analysis performed to justify the number of mice in each subgroup (Appendix E1 [online]). The pigs were used to complete and demonstrate the big picture of varying MR elastography parameters in the long history of chronic liver disease because all the mouse models had moderate to severe liver fibrosis without substantial complications. Twenty-seven mice were assessed in the congestion model and five pigs were assessed in other studies (14,15); these studies were focused on the mechanism of disease, not on imaging techniques. Different protocols involving one-time or repeated MR elastography, tissue harvesting, blood collection, and portal pressure measurement were performed before the specified time for animal euthanasia in each subgroup (Table 1) Details of the imaging and testing protocols are given in Appendix E1 (online). The experimental set-ups for mouse and pig models are shown in Figure 1.
Table 1.
Summary of Age, Number of Subjects, and Mean Body Weight at the Time of Euthanasia in the Five Animal Models
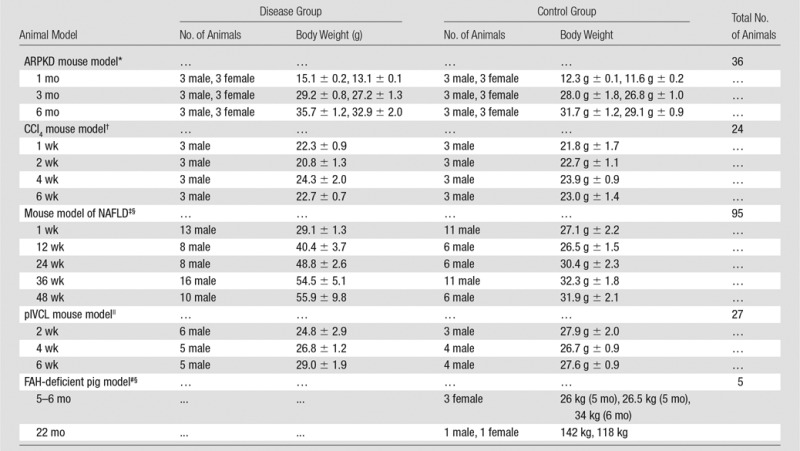
Note.—Body weight is given as mean ± standard deviation. FAH = fumarylacetoacetate hydrolase, pIVCL = partial inferior vena cava ligation.
*Mice were born January 15, 2013. MR elastography was performed between February 12 and August 20, 2013.
†Mice were born between September 27 and October 2. MR elastography was performed between November 16 and December 21, 2014.
‡Mice were born on August 19, 2014. MR elastography was performed between November 17, 2014, and October 13, 2015.
§Monthly MR elastography examinations were performed (Appendix E1 [online]).
||Mice were born between October and November 2014. MR elastography was performed between January 10 and February 7, 2015.
#Pigs were born between January and May 2013. MR elastography was performed between July 3, 2013, and March 13, 2015.
Figure 1a:
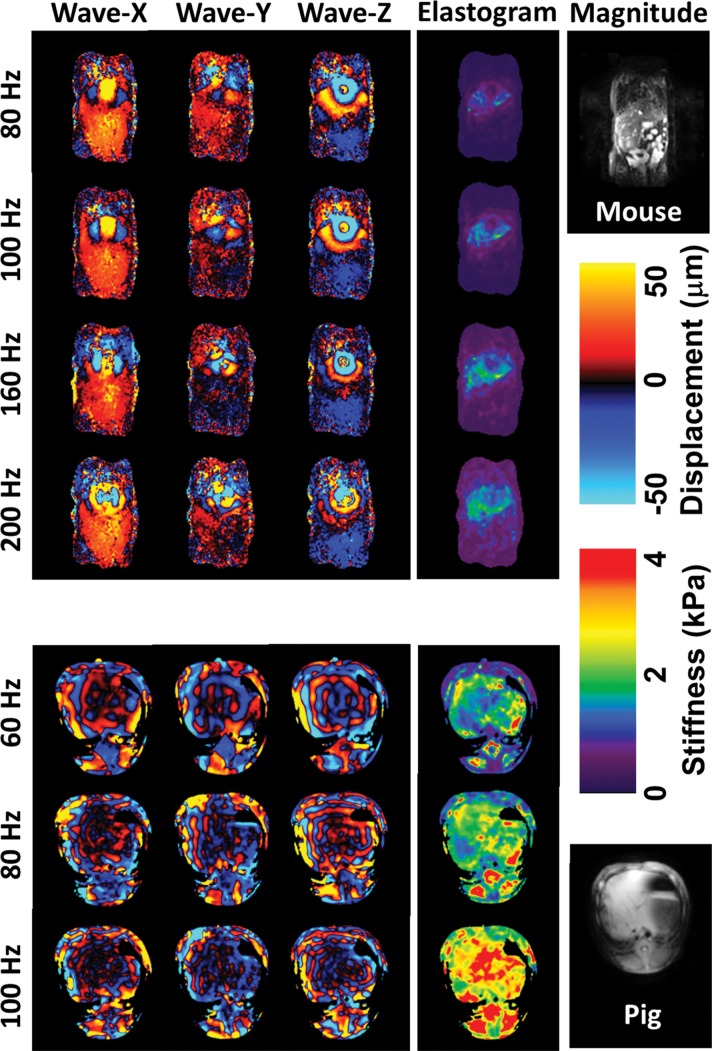
(a, b) Experimental set-up of liver MR elastography imaging in mice (a) and pigs (b) respectively. (c) In vivo multifrequency three-dimensional wave images and elastograms. Wave images at multiple frequencies indicate good shear wave propagation throughout the majority of the liver. The three orthogonal motion directions refer to x (frequency-encoding direction), y (phase-encoding direction), and z (section direction). Elastograms were obtained with the three-dimensional direct inversion algorithm. Transverse magnetization (anatomic) images of a mouse with NAFLD (coronal plane) and a fumarylacetoacetate hydrolase pig (axial plane) are shown in the right column. The white dot in the center of the mouse liver is where the silver needle was applied. The color maps used for the wave and stiffness images are also shown in this column.
Figure 1b:
(a, b) Experimental set-up of liver MR elastography imaging in mice (a) and pigs (b) respectively. (c) In vivo multifrequency three-dimensional wave images and elastograms. Wave images at multiple frequencies indicate good shear wave propagation throughout the majority of the liver. The three orthogonal motion directions refer to x (frequency-encoding direction), y (phase-encoding direction), and z (section direction). Elastograms were obtained with the three-dimensional direct inversion algorithm. Transverse magnetization (anatomic) images of a mouse with NAFLD (coronal plane) and a fumarylacetoacetate hydrolase pig (axial plane) are shown in the right column. The white dot in the center of the mouse liver is where the silver needle was applied. The color maps used for the wave and stiffness images are also shown in this column.
Statistical Analyses
In all animal models, the mean difference of mechanical properties (storage modulus, shear loss modulus, liver stiffness, and damping ratio) or histologic results (steatosis, necroinflammation, and fibrosis, when appropriate) between the animals with disease and those in the control group at the same age or time (Table 1) (ARPKD, age; CCl4, drug administration time; nonalcoholic steatohepatitis [NASH], food feeding time; pIVCL, postsurgery time) were evaluated with two-sided Welch t tests. In the pIVCL congestive liver mouse model, Spearman correlation analysis was used to assess the relationship between the calculated mechanical properties of the liver and the quantitative portal pressure and fibrosis extent measurements. A correlation coefficient (ρ) of 0.7 or more was considered satisfactory, ρ greater than 0.8 was considered good. All statistical analyses were performed with a significance level of P <.05 by using commercially available software (JMP Pro 11; SAS Institute, Cary, NC).
Results
General Findings with Multifrequency Three-dimensional Liver MR Elastography
Shear waves were generated with sufficient amplitude at all frequencies in the various animal models. Four representative frequencies from lowest to highest were selected to illustrate the mouse data in Figure 1c. No important respiratory motion artifacts were observed in the free-breathing mouse imaging protocol. Elastograms (ie, liver stiffness maps) are shown for one section through the middle of the liver. Across all animals, the volumetric liver stiffness values had mean intraregion of interest variabilities of 0.11 kPa ± 0.04 (standard deviation) (range, 0.03–0.50 kPa) in mice and 0.37 kPa ± 0.20 (range, 0.1–1.3 kPa) in pigs, and the mean liver stiffness increased progressively with the vibration frequency.
Figure 1c:
(a, b) Experimental set-up of liver MR elastography imaging in mice (a) and pigs (b) respectively. (c) In vivo multifrequency three-dimensional wave images and elastograms. Wave images at multiple frequencies indicate good shear wave propagation throughout the majority of the liver. The three orthogonal motion directions refer to x (frequency-encoding direction), y (phase-encoding direction), and z (section direction). Elastograms were obtained with the three-dimensional direct inversion algorithm. Transverse magnetization (anatomic) images of a mouse with NAFLD (coronal plane) and a fumarylacetoacetate hydrolase pig (axial plane) are shown in the right column. The white dot in the center of the mouse liver is where the silver needle was applied. The color maps used for the wave and stiffness images are also shown in this column.
We investigated the four mechanical properties (storage modulus, shear loss modulus, liver stiffness, and damping ratio) in the first three animal models (Table E1 [online], four representative frequencies and three or four time intervals were selected to simplify the table). In general, the combination of liver stiffness and damping ratio had a differentiation performance similar to that of storage modulus and loss modulus for all animal models. We selected liver stiffness and damping ratio for the figure presentations. Our findings in each mouse model are described as results of Welch t tests in Table E1 (online) and selected bar plots in Figures 2–4. Figure 5 shows the results and Spearman correlation analysis for the congestive liver model.
Figure 2a:
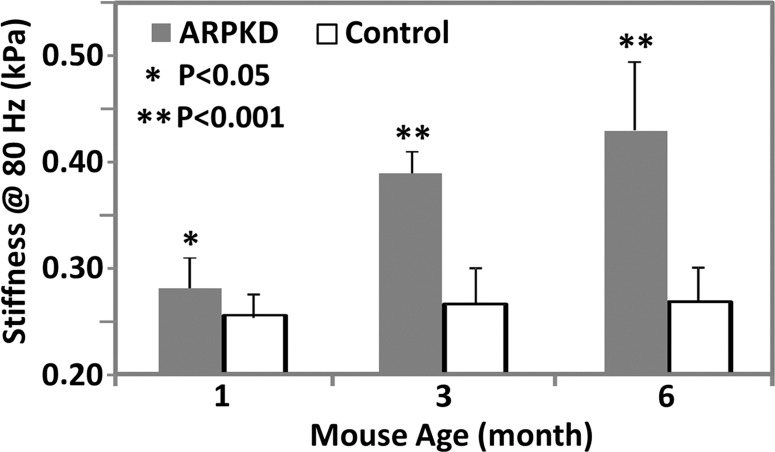
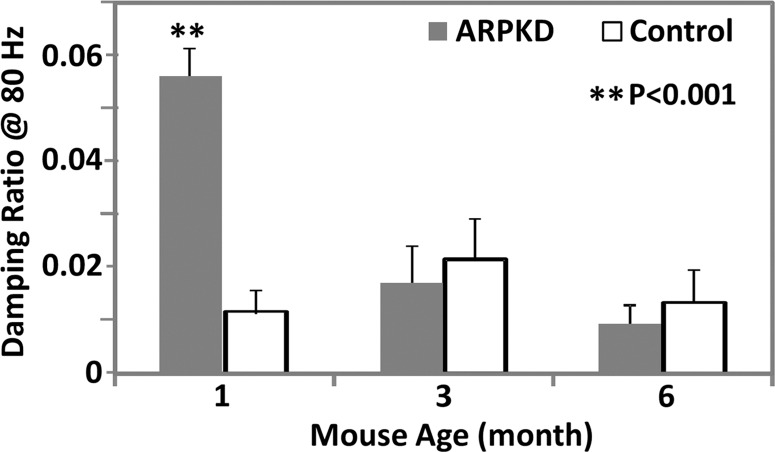
MR elastography results and histologic analyses for the ARPKD mouse model. (a) Histologic analysis shows that mice with ARPKD had mild fibrosis but no observable portal inflammation after weaning (1 month old). They then developed mild inflammation and moderate fibrosis by 3 months. All control animals had normal histologic findings. (b, c) MR elastography results of liver stiffness (b) and damping ratio (c) at 80 Hz. Welch t tests were performed to compare mice with ARPKD and control mice at 1, 3, and 6 months of age. (The number of animals was 6:6 for each comparison.)
Figure 4a:
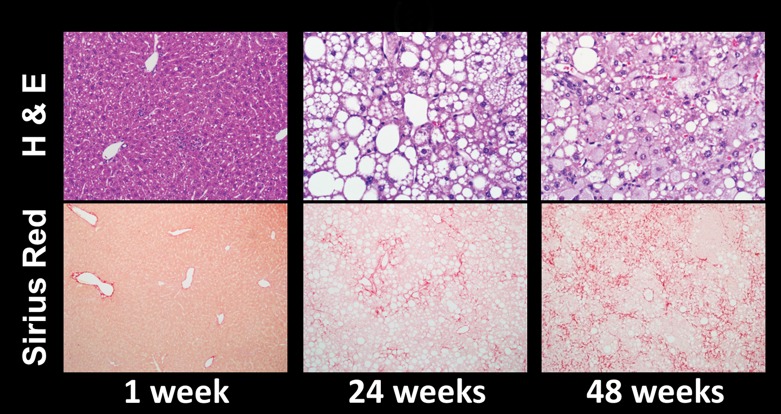
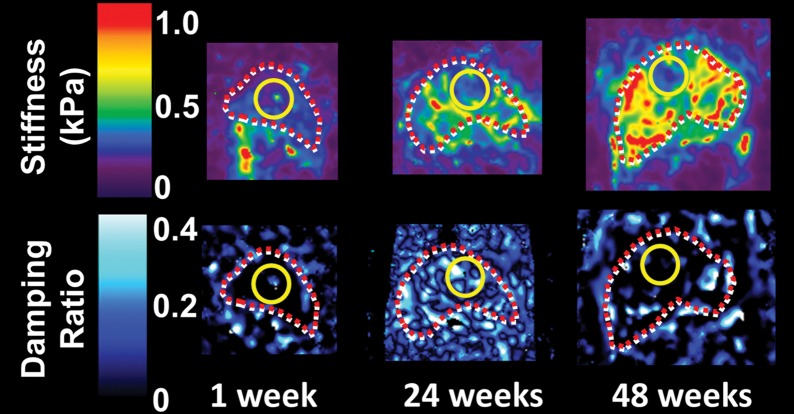
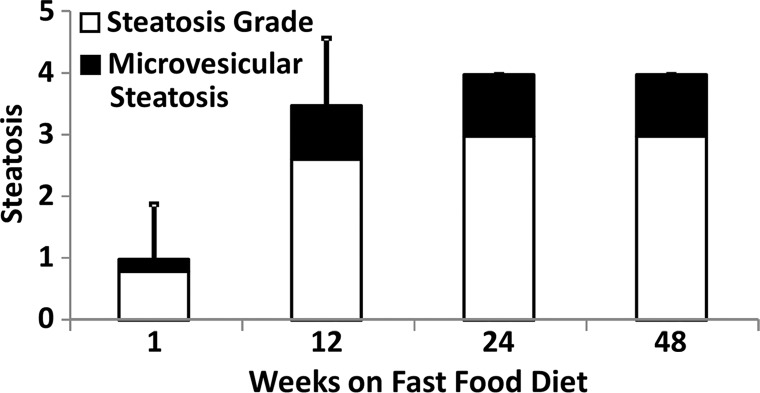
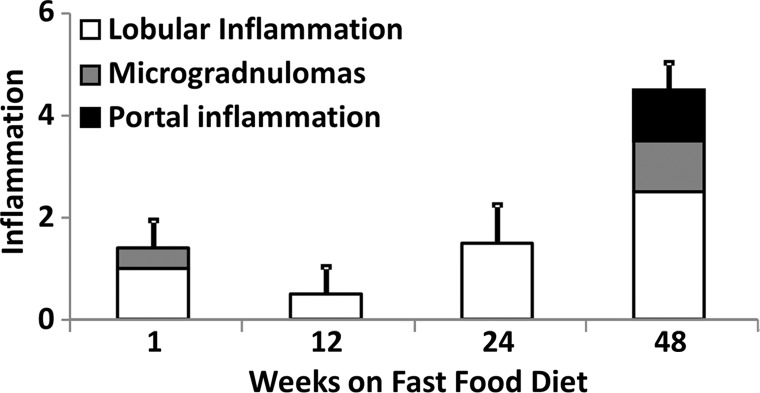
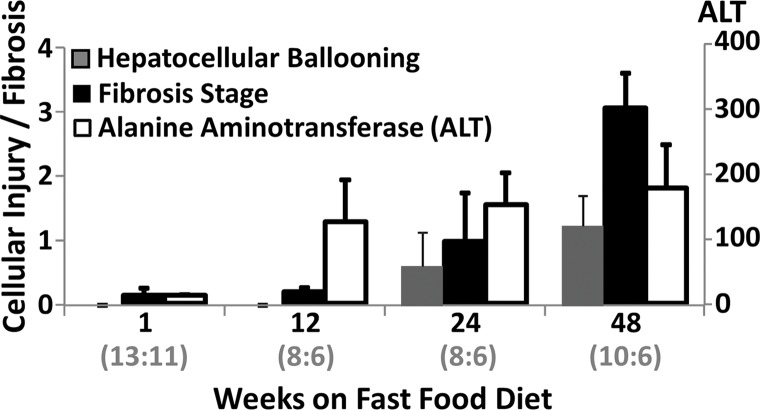
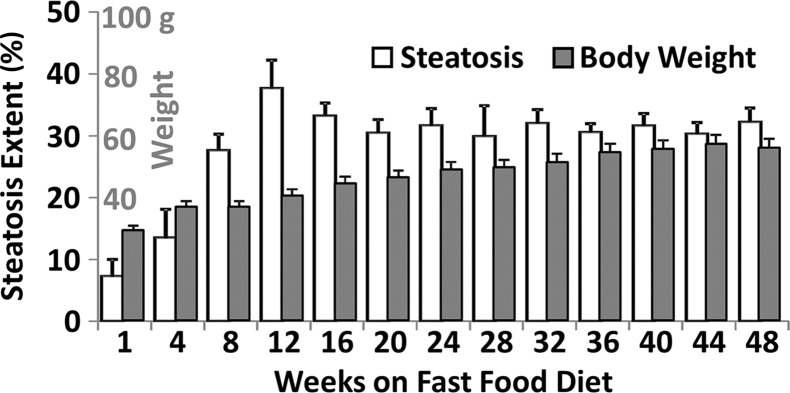
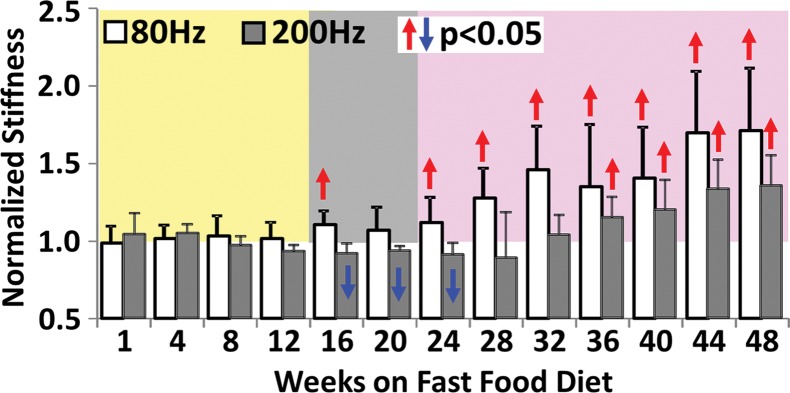
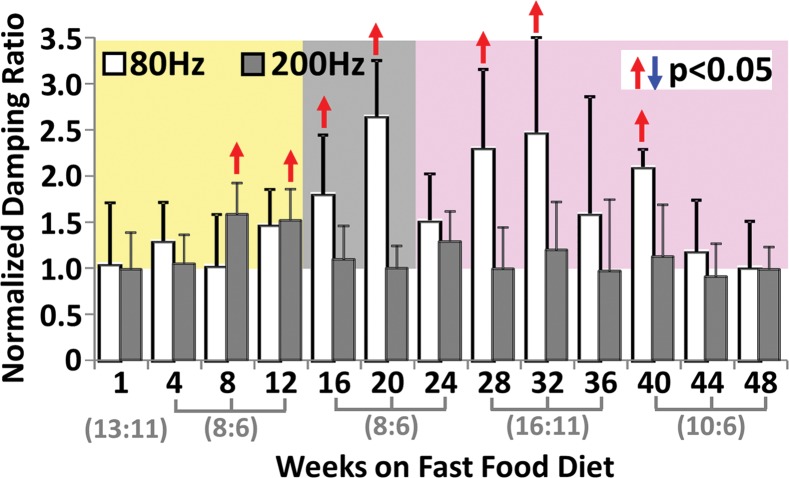
Histologic analyses, MR imaging, and elastography results in mice with NAFLD or NASH. (a, b) Histologic images stained with hematoxylin-eosin (H&E ) or sirius red (a) and MR elastography–assessed liver stiffness (80 Hz) and damping ratio (80 Hz) maps (b) in selected mice with NAFLD or NASH on 1, 24, and 48 weeks of a fast-food diet. Livers are delineated with dotted lines. Locations of the vibrating needle (yellow ○) were excluded from calculation. (c–e) Graphs show steatosis and weight analyses (c and f ), inflammation analyses of cellular injury and fibrosis (d), and alanine aminotransferase analyses (e) of the mice with NAFLD or NASH. At each individual frequency (80–200 Hz), comparisons of MR elastography parameters were performed between mice with NASH and control mice at every different feeding time from 1 week to 48 weeks (selected time points and frequencies are given in Appendix E1 [online]). (g, h) To simplify graphic illustration, liver stiffness (g) and damping ratio (h) were normalized with regard to the same age control groups (ie, means in animals with disease were divided by means in control animals). All comparisons were performed with Welch t tests between the disease and control subgroups at different frequencies prior to normalization. Significant increases (red arrow) and decreases (blue arrow) are indicated for each comparison. The number of animals (animals with disease vs control animals) is also indicated in gray at the bottom of the horizontal axis in e and h. Data for control animals are not shown in all bar plots.
Figure 5a:
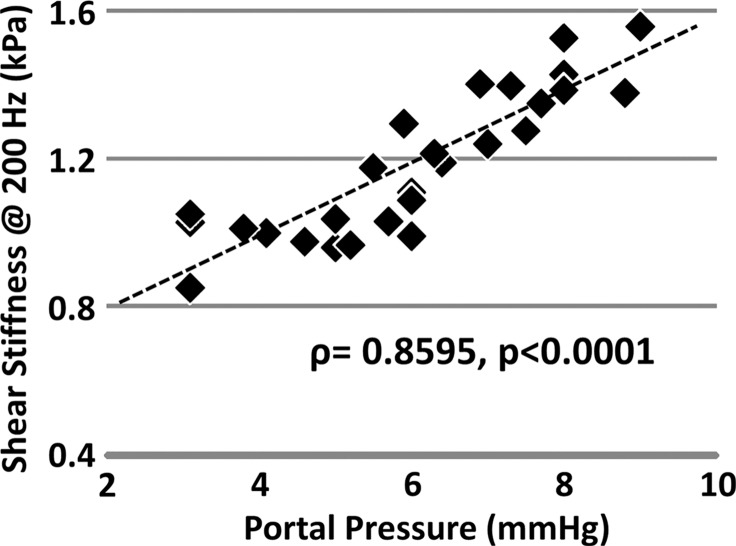
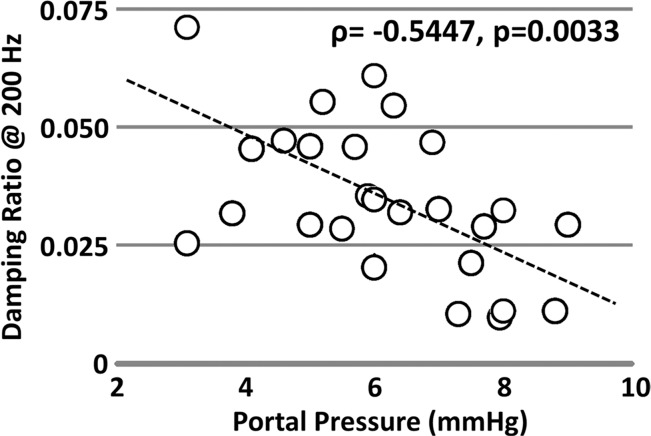
Mechanical properties of the liver in the pIVCL mouse model assessed with MR elastography. (a) Chart shows portal pressure measurement and hydroxyproline concentration in mice with pIVCL as compared with control mice. (b, c) Scatterplots show that liver stiffness (200 Hz) and damping ratio (200 Hz) assessed with MR elastography significantly correlated with portal pressure measurements.
Figure 4b:
Histologic analyses, MR imaging, and elastography results in mice with NAFLD or NASH. (a, b) Histologic images stained with hematoxylin-eosin (H&E ) or sirius red (a) and MR elastography–assessed liver stiffness (80 Hz) and damping ratio (80 Hz) maps (b) in selected mice with NAFLD or NASH on 1, 24, and 48 weeks of a fast-food diet. Livers are delineated with dotted lines. Locations of the vibrating needle (yellow ○) were excluded from calculation. (c–e) Graphs show steatosis and weight analyses (c and f ), inflammation analyses of cellular injury and fibrosis (d), and alanine aminotransferase analyses (e) of the mice with NAFLD or NASH. At each individual frequency (80–200 Hz), comparisons of MR elastography parameters were performed between mice with NASH and control mice at every different feeding time from 1 week to 48 weeks (selected time points and frequencies are given in Appendix E1 [online]). (g, h) To simplify graphic illustration, liver stiffness (g) and damping ratio (h) were normalized with regard to the same age control groups (ie, means in animals with disease were divided by means in control animals). All comparisons were performed with Welch t tests between the disease and control subgroups at different frequencies prior to normalization. Significant increases (red arrow) and decreases (blue arrow) are indicated for each comparison. The number of animals (animals with disease vs control animals) is also indicated in gray at the bottom of the horizontal axis in e and h. Data for control animals are not shown in all bar plots.
Figure 4c:
Histologic analyses, MR imaging, and elastography results in mice with NAFLD or NASH. (a, b) Histologic images stained with hematoxylin-eosin (H&E ) or sirius red (a) and MR elastography–assessed liver stiffness (80 Hz) and damping ratio (80 Hz) maps (b) in selected mice with NAFLD or NASH on 1, 24, and 48 weeks of a fast-food diet. Livers are delineated with dotted lines. Locations of the vibrating needle (yellow ○) were excluded from calculation. (c–e) Graphs show steatosis and weight analyses (c and f ), inflammation analyses of cellular injury and fibrosis (d), and alanine aminotransferase analyses (e) of the mice with NAFLD or NASH. At each individual frequency (80–200 Hz), comparisons of MR elastography parameters were performed between mice with NASH and control mice at every different feeding time from 1 week to 48 weeks (selected time points and frequencies are given in Appendix E1 [online]). (g, h) To simplify graphic illustration, liver stiffness (g) and damping ratio (h) were normalized with regard to the same age control groups (ie, means in animals with disease were divided by means in control animals). All comparisons were performed with Welch t tests between the disease and control subgroups at different frequencies prior to normalization. Significant increases (red arrow) and decreases (blue arrow) are indicated for each comparison. The number of animals (animals with disease vs control animals) is also indicated in gray at the bottom of the horizontal axis in e and h. Data for control animals are not shown in all bar plots.
Figure 4d:
Histologic analyses, MR imaging, and elastography results in mice with NAFLD or NASH. (a, b) Histologic images stained with hematoxylin-eosin (H&E ) or sirius red (a) and MR elastography–assessed liver stiffness (80 Hz) and damping ratio (80 Hz) maps (b) in selected mice with NAFLD or NASH on 1, 24, and 48 weeks of a fast-food diet. Livers are delineated with dotted lines. Locations of the vibrating needle (yellow ○) were excluded from calculation. (c–e) Graphs show steatosis and weight analyses (c and f ), inflammation analyses of cellular injury and fibrosis (d), and alanine aminotransferase analyses (e) of the mice with NAFLD or NASH. At each individual frequency (80–200 Hz), comparisons of MR elastography parameters were performed between mice with NASH and control mice at every different feeding time from 1 week to 48 weeks (selected time points and frequencies are given in Appendix E1 [online]). (g, h) To simplify graphic illustration, liver stiffness (g) and damping ratio (h) were normalized with regard to the same age control groups (ie, means in animals with disease were divided by means in control animals). All comparisons were performed with Welch t tests between the disease and control subgroups at different frequencies prior to normalization. Significant increases (red arrow) and decreases (blue arrow) are indicated for each comparison. The number of animals (animals with disease vs control animals) is also indicated in gray at the bottom of the horizontal axis in e and h. Data for control animals are not shown in all bar plots.
Figure 4e:
Histologic analyses, MR imaging, and elastography results in mice with NAFLD or NASH. (a, b) Histologic images stained with hematoxylin-eosin (H&E ) or sirius red (a) and MR elastography–assessed liver stiffness (80 Hz) and damping ratio (80 Hz) maps (b) in selected mice with NAFLD or NASH on 1, 24, and 48 weeks of a fast-food diet. Livers are delineated with dotted lines. Locations of the vibrating needle (yellow ○) were excluded from calculation. (c–e) Graphs show steatosis and weight analyses (c and f ), inflammation analyses of cellular injury and fibrosis (d), and alanine aminotransferase analyses (e) of the mice with NAFLD or NASH. At each individual frequency (80–200 Hz), comparisons of MR elastography parameters were performed between mice with NASH and control mice at every different feeding time from 1 week to 48 weeks (selected time points and frequencies are given in Appendix E1 [online]). (g, h) To simplify graphic illustration, liver stiffness (g) and damping ratio (h) were normalized with regard to the same age control groups (ie, means in animals with disease were divided by means in control animals). All comparisons were performed with Welch t tests between the disease and control subgroups at different frequencies prior to normalization. Significant increases (red arrow) and decreases (blue arrow) are indicated for each comparison. The number of animals (animals with disease vs control animals) is also indicated in gray at the bottom of the horizontal axis in e and h. Data for control animals are not shown in all bar plots.
Figure 4f:
Histologic analyses, MR imaging, and elastography results in mice with NAFLD or NASH. (a, b) Histologic images stained with hematoxylin-eosin (H&E ) or sirius red (a) and MR elastography–assessed liver stiffness (80 Hz) and damping ratio (80 Hz) maps (b) in selected mice with NAFLD or NASH on 1, 24, and 48 weeks of a fast-food diet. Livers are delineated with dotted lines. Locations of the vibrating needle (yellow ○) were excluded from calculation. (c–e) Graphs show steatosis and weight analyses (c and f ), inflammation analyses of cellular injury and fibrosis (d), and alanine aminotransferase analyses (e) of the mice with NAFLD or NASH. At each individual frequency (80–200 Hz), comparisons of MR elastography parameters were performed between mice with NASH and control mice at every different feeding time from 1 week to 48 weeks (selected time points and frequencies are given in Appendix E1 [online]). (g, h) To simplify graphic illustration, liver stiffness (g) and damping ratio (h) were normalized with regard to the same age control groups (ie, means in animals with disease were divided by means in control animals). All comparisons were performed with Welch t tests between the disease and control subgroups at different frequencies prior to normalization. Significant increases (red arrow) and decreases (blue arrow) are indicated for each comparison. The number of animals (animals with disease vs control animals) is also indicated in gray at the bottom of the horizontal axis in e and h. Data for control animals are not shown in all bar plots.
Figure 4g:
Histologic analyses, MR imaging, and elastography results in mice with NAFLD or NASH. (a, b) Histologic images stained with hematoxylin-eosin (H&E ) or sirius red (a) and MR elastography–assessed liver stiffness (80 Hz) and damping ratio (80 Hz) maps (b) in selected mice with NAFLD or NASH on 1, 24, and 48 weeks of a fast-food diet. Livers are delineated with dotted lines. Locations of the vibrating needle (yellow ○) were excluded from calculation. (c–e) Graphs show steatosis and weight analyses (c and f ), inflammation analyses of cellular injury and fibrosis (d), and alanine aminotransferase analyses (e) of the mice with NAFLD or NASH. At each individual frequency (80–200 Hz), comparisons of MR elastography parameters were performed between mice with NASH and control mice at every different feeding time from 1 week to 48 weeks (selected time points and frequencies are given in Appendix E1 [online]). (g, h) To simplify graphic illustration, liver stiffness (g) and damping ratio (h) were normalized with regard to the same age control groups (ie, means in animals with disease were divided by means in control animals). All comparisons were performed with Welch t tests between the disease and control subgroups at different frequencies prior to normalization. Significant increases (red arrow) and decreases (blue arrow) are indicated for each comparison. The number of animals (animals with disease vs control animals) is also indicated in gray at the bottom of the horizontal axis in e and h. Data for control animals are not shown in all bar plots.
Figure 5b:
Mechanical properties of the liver in the pIVCL mouse model assessed with MR elastography. (a) Chart shows portal pressure measurement and hydroxyproline concentration in mice with pIVCL as compared with control mice. (b, c) Scatterplots show that liver stiffness (200 Hz) and damping ratio (200 Hz) assessed with MR elastography significantly correlated with portal pressure measurements.
Figure 5c:
Mechanical properties of the liver in the pIVCL mouse model assessed with MR elastography. (a) Chart shows portal pressure measurement and hydroxyproline concentration in mice with pIVCL as compared with control mice. (b, c) Scatterplots show that liver stiffness (200 Hz) and damping ratio (200 Hz) assessed with MR elastography significantly correlated with portal pressure measurements.
ARPKD Mouse Model with Congenital Chronic Liver Disease
In this mouse model, there were no significant differences between the sexes for either the histologic analysis or the mechanical properties in any age group (P > .05). The extent of fibrosis in the mice with disease increased significantly over time when compared with that in the age-matched control animals (P < .001 for all groups) (Fig 2a). Portal inflammation was not detectable in the 1-month-old mice with disease, and the extent of disease increased significantly but remained consistently mild in 3- and 6-month-old mice with disease (Fig 2a). No necrosis was observed in the mice with ARPKD.
MR elastography–assessed liver stiffness and storage modulus at 80 Hz enabled us to successfully distinguish the mice with ARPKD from control animals for all age groups (Table E1 [online], Fig 2b). At higher frequencies, these two metrics did not enable us to identify fibrosis in younger mice with disease. However, the mean loss modulus and damping ratio values at 80 and 100 Hz were significantly elevated in the 1-month-old mice with disease; however, there was no significant difference in older mice with disease, as shown in Figure 2c. Loss modulus and damping ratio at frequencies higher than 100 Hz did not show significant differences for any age group (Table E1 [online]).
Figure 2b:
MR elastography results and histologic analyses for the ARPKD mouse model. (a) Histologic analysis shows that mice with ARPKD had mild fibrosis but no observable portal inflammation after weaning (1 month old). They then developed mild inflammation and moderate fibrosis by 3 months. All control animals had normal histologic findings. (b, c) MR elastography results of liver stiffness (b) and damping ratio (c) at 80 Hz. Welch t tests were performed to compare mice with ARPKD and control mice at 1, 3, and 6 months of age. (The number of animals was 6:6 for each comparison.)
Figure 2c:
MR elastography results and histologic analyses for the ARPKD mouse model. (a) Histologic analysis shows that mice with ARPKD had mild fibrosis but no observable portal inflammation after weaning (1 month old). They then developed mild inflammation and moderate fibrosis by 3 months. All control animals had normal histologic findings. (b, c) MR elastography results of liver stiffness (b) and damping ratio (c) at 80 Hz. Welch t tests were performed to compare mice with ARPKD and control mice at 1, 3, and 6 months of age. (The number of animals was 6:6 for each comparison.)
CCl4 Mouse Model with Drug-induced Chronic Liver Injury
In this drug-induced chronic liver injury mouse model, significant portal inflammation and confluent necrosis were observed in the liver within 1 week after CCl4 administration. However, no fibrosis was found at this early stage of liver injury, as shown in Figure 3a. With increasing CCl4 exposure, hepatic inflammation and necrosis decreased. Mild to moderate hepatic fibrosis developed in the liver within 2 weeks of CCl4 administration. The fibrosis extent increased to moderate or severe levels after 4–6 weeks of exposure. Necroinflammation and fibrosis were not observed in the liver in the control animals that received olive oil.
Figure 3a:
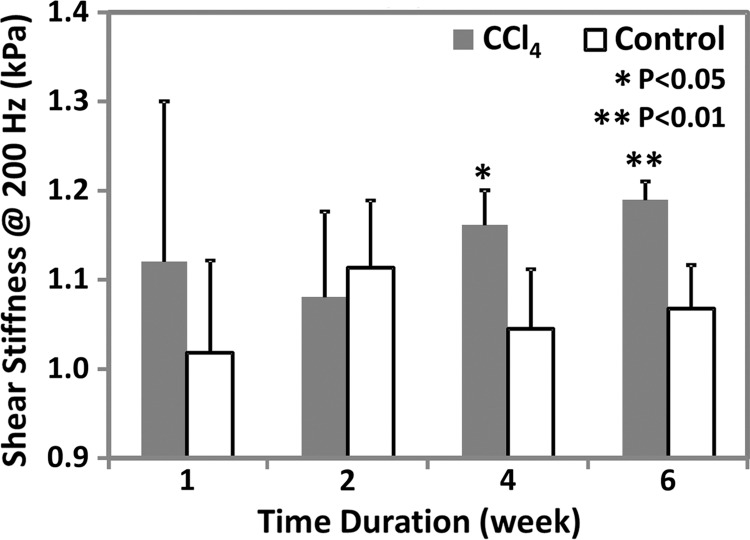
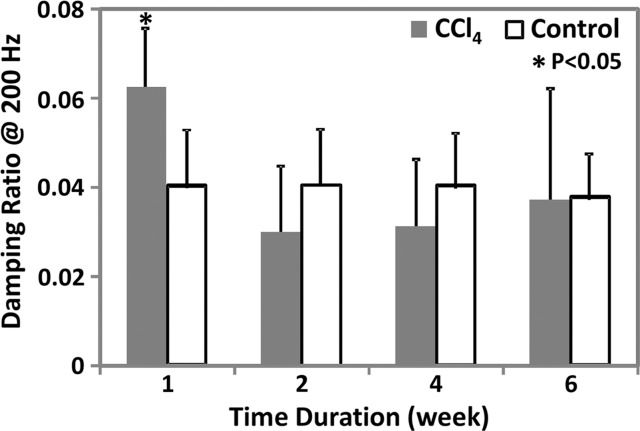
MR elastography results and histologic analyses in the CCl4 mouse model. (a) Chart shows necroinflammation and fibrosis extent in the livers of mice with disease and CCl4 administration. All control animals had normal histologic findings. (b, c) MR elastography results of liver stiffness (b) and damping ratio (c) at 200 Hz. Paired t tests were performed to compare CCl4 mice and age-matched control animals at 1, 2, 4, and 6 weeks of administration. (The number of animals was 3:3 for each comparison.) Shear stiffness (b) and damping ratio (c) showed that the liver stiffness increased gradually with the CCl4 exposure time and could be used to detect significant fibrosis at weeks 4 and 6. Early liver injury could be distinguished with only the significantly increased damping ratio in the treatment group.
As shown in Appendix E1 (online) and Figure 3b, liver stiffness and storage modulus at 200 Hz enabled us to successfully distinguish mice with moderate to severe fibrosis from control animals after 4 and 6 weeks of treatment; however, we were not able to detect inflammation, necrosis, or mild fibrosis after only 1–2 weeks of treatment. Loss modulus and damping ratio could be used to detect the early onset of inflammation and necrosis at 1 week (200 Hz only), but they were not able to detect further increased liver injury after 2 weeks of CCl4 administration (Table E1 [online], Fig 3c). At the lowest frequency of 80 Hz, no significant changes were observed between the mice that received CCl4 and the control animals at any time point for any of the mechanical properties (Table E1 [online]).
Figure 3b:
MR elastography results and histologic analyses in the CCl4 mouse model. (a) Chart shows necroinflammation and fibrosis extent in the livers of mice with disease and CCl4 administration. All control animals had normal histologic findings. (b, c) MR elastography results of liver stiffness (b) and damping ratio (c) at 200 Hz. Paired t tests were performed to compare CCl4 mice and age-matched control animals at 1, 2, 4, and 6 weeks of administration. (The number of animals was 3:3 for each comparison.) Shear stiffness (b) and damping ratio (c) showed that the liver stiffness increased gradually with the CCl4 exposure time and could be used to detect significant fibrosis at weeks 4 and 6. Early liver injury could be distinguished with only the significantly increased damping ratio in the treatment group.
Figure 3c:
MR elastography results and histologic analyses in the CCl4 mouse model. (a) Chart shows necroinflammation and fibrosis extent in the livers of mice with disease and CCl4 administration. All control animals had normal histologic findings. (b, c) MR elastography results of liver stiffness (b) and damping ratio (c) at 200 Hz. Paired t tests were performed to compare CCl4 mice and age-matched control animals at 1, 2, 4, and 6 weeks of administration. (The number of animals was 3:3 for each comparison.) Shear stiffness (b) and damping ratio (c) showed that the liver stiffness increased gradually with the CCl4 exposure time and could be used to detect significant fibrosis at weeks 4 and 6. Early liver injury could be distinguished with only the significantly increased damping ratio in the treatment group.
NAFLD or NASH Mouse Model with Steatosis, Inflammation, Ballooning, and Fibrosis
Figure 4 shows histologic images and corresponding MR lastography–assessed liver stiffness and damping ratio maps at 80 Hz in mice with NAFLD after 1, 24, and 48 weeks of a fast-food diet. The selected intermediate time point of 24 weeks was crucial in this mouse model because the time point represents the beginning of definitive NASH diagnosis with histologic confirmation. According to the fibrosis assessment and the suggested NAFLD (or NAS score) thresholds for NASH diagnosis (Appendix E1, Table E2 [online]), this mouse model had nonalcoholic fatty liver from 1 to 12 weeks, borderline NASH from 16 to 20 weeks, and definite NASH from 24 to 48 weeks.
Statistical analysis results of MR elastography measurements at four selected time points are shown in Table E1 (online). Liver stiffness at all working frequencies could not be used to distinguish NAFLD and early onset of minimal fibrosis from 1 to 12 weeks. From 16 to 32 weeks, liver stiffness increased significantly at low frequency (|G*| at 80 Hz in nonalcoholic fatty liver and NASH groups vs the control group: week 16, 0.31 kPa ± 0.02 vs 0.28 kPa ± 0.02, P = .04; week 32, 0.46 kPa ± 0.08 vs 0.31 kPa ± 0.03, P = .001) but decreased significantly at high frequency (|G*| at 200 Hz for nonalcoholic fatty liver and NASH groups vs the control group: week 16, 0.98 kPa ± 0.06 vs 1.07 kPa ± 0.07, P = .03; week 20, 0.98 kPa ± 0.03 vs 1.06 kPa ± 0.04, P = .003). From 36 to 48 weeks, liver stiffness at all working frequencies progressively increased with time. Damping ratio at the highest frequency of 200 Hz increased significantly as early as week 8–12 (ζ at 200 Hz for NAFLD and NASH groups vs the control group: week 8, 0.07 ± 0.01 vs 0.04 ± 0.01, P = .009; week 12, 0.08 ± 0.02 vs 0.05 ± 0.01, P = .009); however, no significant change was observed at any other time. At the lowest frequency of 80 Hz, damping ratio increased substantially from week 12 to week 40, with peak elevation at week 20. There was no significant change in damping ratio at all frequencies from week 44 to week 48. Throughout the lifespan of mice with NAFLD, damping ratios at high frequencies generally yielded earlier detection of disease than did those at low frequencies, as shown in Figure 4h and Table E1 (online). We also observed that the standard deviation of MR elastography measurements (storage modulus, shear loss modulus, liver stiffness, and damping ratio) decreased with increasing frequency.
Figure 4h:
Histologic analyses, MR imaging, and elastography results in mice with NAFLD or NASH. (a, b) Histologic images stained with hematoxylin-eosin (H&E ) or sirius red (a) and MR elastography–assessed liver stiffness (80 Hz) and damping ratio (80 Hz) maps (b) in selected mice with NAFLD or NASH on 1, 24, and 48 weeks of a fast-food diet. Livers are delineated with dotted lines. Locations of the vibrating needle (yellow ○) were excluded from calculation. (c–e) Graphs show steatosis and weight analyses (c and f ), inflammation analyses of cellular injury and fibrosis (d), and alanine aminotransferase analyses (e) of the mice with NAFLD or NASH. At each individual frequency (80–200 Hz), comparisons of MR elastography parameters were performed between mice with NASH and control mice at every different feeding time from 1 week to 48 weeks (selected time points and frequencies are given in Appendix E1 [online]). (g, h) To simplify graphic illustration, liver stiffness (g) and damping ratio (h) were normalized with regard to the same age control groups (ie, means in animals with disease were divided by means in control animals). All comparisons were performed with Welch t tests between the disease and control subgroups at different frequencies prior to normalization. Significant increases (red arrow) and decreases (blue arrow) are indicated for each comparison. The number of animals (animals with disease vs control animals) is also indicated in gray at the bottom of the horizontal axis in e and h. Data for control animals are not shown in all bar plots.
pIVCL Mouse Model with Congestive Liver Disease
In the pIVCL mouse model of congestive liver disease, portal hypertension developed immediately after surgery. However, no significant fibrosis (ie, hydroxyproline concentration) was found in any time group of these mice with pIVCL (P > .07). The mean portal pressure in the congestive livers of mice with pIVCL was significantly higher than that in control mice at each time point after surgery (P < .001) (Fig 5a). The mean portal pressure also decreased progressively with time, but this decrease was not significant (P > .2). When compared with the control groups, no significant fibrosis developed in the mice with pIVCL at 2, 4, or 6 weeks after surgery (P = .15, P = .25, P = .09, respectively).
Table 2 and Figure 5 show the correlation analysis between the mechanical properties and the measured portal pressure and fibrosis extent in this congestive liver model. We observed either satisfactory (80 Hz, ρ > 0.7) or good (100–200 Hz, ρ > 0.8) positive correlations between the portal pressure and liver stiffness and storage modulus (P < .001). However, neither quantity was correlated with fibrosis extent in this model (ρ < 0.33, P > .07). The loss modulus at 200 Hz had a significant negative correlation with portal pressure (ρ = −0.44, P = .02) but was not correlated with fibrosis extent (P = .22). For damping ratio, measurements at 200 Hz had a significant negative correlation with portal pressure (ρ = −0.54, P = .003) but no correlation with fibrosis extent (P > .2).
Table 2.
Spearman Correlation Coefficient between Selected Mechanical Parameters and Portal Pressure and Fibrosis Extent in Congestive Liver Model

Fumarylacetoacetate Hydrolase Pig Model with Spontaneous Portal Hypertension and Gastrointestinal Bleeding
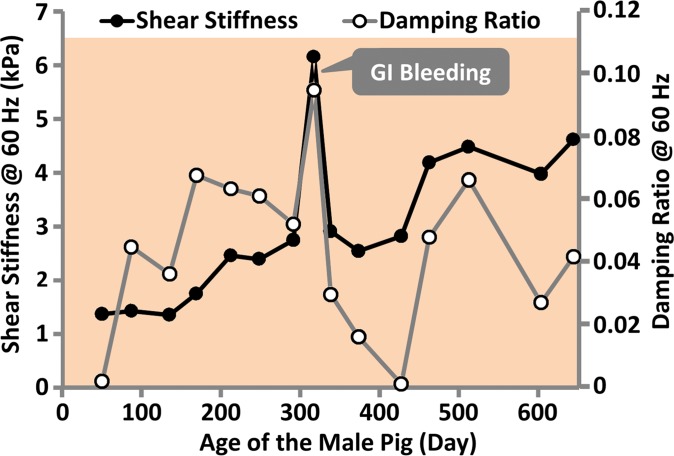
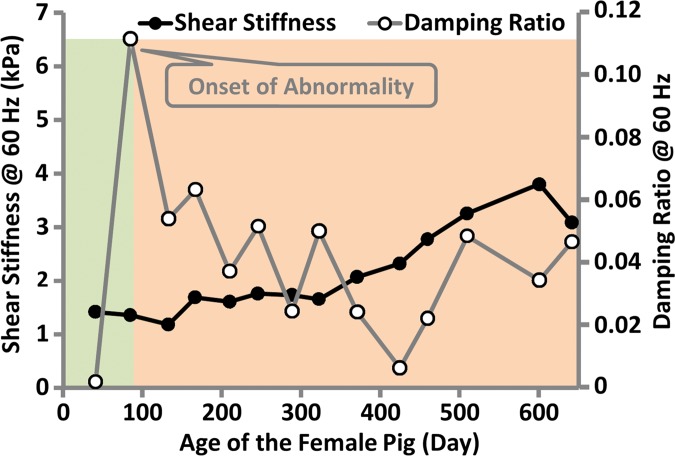
In the fumarylacetoacetate hydrolase–deficient pig model, two pigs (one male, one female) out of five were followed with MR elastography monthly for more than 1 year. The other three pigs were euthanized before the age of 6 months because of poor health (Appendix E1 [online]). The male pig had minimal ascites, steatosis, hepatocellular hypertrophy, and minimal fibrosis at the time of the first MR elastography examination (2 months old). At 11 months of age, this pig had spontaneous gastrointestinal bleeding, consistent with severe portal hypertension. As shown in Figure 6a, shear stiffness and damping ratio increased to their maximum values at this time point. The female pig had no noticable liver change and no ascites at the time of the first MR elastography examination (1.5 months old). At 3 months of age, this pig had minimal ascites, altered hepatocellular architecture with hepatocellular hypertrophy, and hepatocellular cytoplasmic alterations. However, there was not yet evidence of hepatic fibrosis. As shown in Figure 6b, we observed that shear stiffness did not change substantially at this time point when compared with baseline values, while the damping ratio increased to the highest value observed over the lifespan of this pig. At the time of euthanasia (650 days old), both pigs had advanced fibrosis and portal hypertension, with a mean hepatic venous pressure gradient of 8.7 mm Hg ± 1.2. The liver stiffness was near its highest value at this time, while the damping ratio was similar to its lifetime mean value. Both liver stiffness and damping ratio measurements at 60 Hz have better distinguishing performance than those at 80 or 100 Hz.
Figure 6a:
MR elastography–derived mechanical properties of the liver in a fumarylacetoacetate hydrolase–deficient (a) male and (b) female pig throughout each animal’s life span.
Figure 6b:
MR elastography–derived mechanical properties of the liver in a fumarylacetoacetate hydrolase–deficient (a) male and (b) female pig throughout each animal’s life span.
Discussion
It has been well established that both shear storage modulus and shear stiffness of the liver increase with the severity of chronic liver diseases in many animal models with progressively developing NASH, hepatic fibrosis, and necroinflammation (16–20). It has also been found that liver stiffness augmentation positively correlates with hepatic venous pressure gradient in patients with cirrhosis (21–23). Our results similarly show that both liver stiffness and storage modulus increase with all of the studied pathophysiologic conditions of the liver, including clinical diagnoses of definite NASH, inflammation, fibrosis, passive congestion, and portal hypertension. All of these findings support the generally accepted use of hepatic MR elastography for clinical screening or follow-up in patients suspected of having chronic liver diseases (24). Interestingly, liver stiffness and storage modulus at higher frequencies enabled us to distinguish more animals with disease from control animals in mice with fast-food diet–induced liver injury, necroinflammation and portal hypertension in the drug-induced liver injury (CCl4), and congestive (pIVCL) liver, while liver stiffness and storage modulus at lower frequencies enabled us to differentiate more diseased animals from control animals for congenital chronic liver injury in the ARPKD mouse model and the fumarylacetoacetate hydrolase pig model. However, in the NASH mouse model, the monthly measurements of storage modulus and liver stiffness showed a substantial frequency-dependent decrease in the fatty livers. This leads to poor differentiation of these quantities, especially at high frequencies, to detect early onset of mild hepatic fibrosis and hepatocellular ballooning in the animals with NAFLD and borderline NASH diagnoses. This finding may help explain why liver stiffness has better performance in the detection of clinically significant (F ≥2) or advanced (F ≥3) hepatic fibrosis in patients with NAFLD or NASH (25–27) for both US- and MR-based elastography. It suggests that a high level of steatosis may lead to unchanged or even decreased liver stiffness measurements in the early phases of the long history of NAFLD, especially for nonalcoholic fatty liver and borderline NASH phases when lobular inflammation and fibrosis are mild and hepatocellular injury is absent. With increasing level of inflammation, hepatocellular injury, and fibrosis, the effect of steatosis could become progressively less important due to its consistently unchanged content or changed network and location in later phases. With US-based elastography techniques, there is an additional overestimation effect from the mismatched layers between subcutaneous fat and liver tissue (28). The frequency dependency may be attributed to the dominant frequency response of the hierarchical microstructure or unique microvascular changes in the liver tissue with different causes and animal species.
Shear loss modulus has also been associated with the severity of disease but has shown less potential in the detection of mild-to-moderate fibrosis than shear stiffness or storage modulus (20). Recent studies have shown that loss modulus can be used to distinguish malignancy of liver tumors better than storage modulus (29). Our results showed that loss modulus has marginal or poor association with fibrosis extent but that it can be a good predictor of early-onset liver injury before the development of fibrosis. It also has origin-specific frequency dependence. Loss modulus at high frequencies has the potential to be used to assess necroinflammation caused by diet- or drug-induced liver injury (NASH, CCl4) and portal hypertension based on the congestive liver model (pIVCL); at low frequencies, it may be useful in the detection of early onset of liver injury based on the knockout ARPKD mouse model. This difference may be attributed to the coexisting polycystic and fibrotic structures observed in the ARPKD livers, which may have pronounced low-frequency response to the fluidlike microstructure of the cysts.
Damping ratio, ζ, (or the essentially equivalent quantities [eg, phase angle and loss tangent] as described in Appendix E1 [online]) has been shown to have the potential to enable one to distinguish meningiomas from glioblastomas, anaplastic astrocytomas, cerebral metastases, and abscess in 27 patients with intracranial tumors (30). Perepelyuk et al also found the ratio of liver stiffness to storage modulus (loss tangent) to be sensitive to very early onset of liver injury in an ex vivo CCl4 mouse model (31). The ratio increased when edema was pronounced at day 2 of their study, then it decreased when early fibrosis developed at day 14. Our results are in agreement with these findings. In the ARPKD mouse models, damping ratio was indicative of very early onset of liver injury even before histologic detection of cellular invasion of inflammation, while liver stiffness and other parameters were better discriminators for late-stage development of fibrosis. In the CCl4 mouse model, damping ratio detected necroinflammation at week 1 before the onset of fibrosis, then lost its detecting ability afterward with the progressive development of fibrosis and decreased necroinflammation. The NASH mouse model is more complicated since both steatosis and fibrosis exist and progressively increase with time throughout the long history of NAFLD. If steatosis causes an increase in damping ratio and fibrosis causes a decrease in damping ratio, detection of inflammation could be compromised. Fortunately, the effects from steatosis and fibrosis could be frequency dependent. It is promising that damping ratio at high frequencies could be useful to detect hepatic inflammation, which could be narrowed to the early phases of NAFLD or borderline NASH. Our results further expand the potential use of damping ratio to discriminate two different origins of portal hypertension. This suggests that damping ratio has the potential to enable discrimination of congestion-induced portal hypertension (negative correlation) from fibrosis-induced portal hypertension (positive correlation). Damping ratio also has promise in quantification of the degree of liver congestion, which currently can be assessed only with invasive portal pressure measurements.
In summary, our results validated the well-established fact that both shear storage modulus and shear stiffness of the liver increased progressively with the severity of chronic liver diseases with all four disease factors: inflammation, fibrosis, and congestion- and fibrosis-induced portal hypertension. Second, damping ratio and loss modulus increased significantly at early onset of liver injury or necroinflammation, even with coexisting steatosis and fibrosis (NASH), or before histologically detectable macrophage transformation or migration (ARPKD) but were not sensitive to the later progressive development of fibrosis (NASH, ARPKD, CCl4). Both quantities decreased significantly in response to hepatic congestion and increased substantially in response to portal hypertension. The combination of shear stiffness and damping ratio potentially can be used to differentiate early liver injury from significant fibrosis and advanced liver diseases.
One of the primary limitations of this study was that our mouse liver MR elastography approach is more invasive compared with other approaches (16,32). There is potential risk of animal loss (approximately 11% overall) or overestimation in histologic analyses due to the penetration injuries of hepatic parenchyma. One of the benefits of our needle method is the simple wave pattern generated in the liver. Another practical benefit of our method is that it minimizes respiratory-related motion artifacts and largely shortens the image acquisition time by allowing for a free-breathing acquisition strategy. Use of coronal imaging planes perpendicular to the needle driver has been shown to be optimal for wave visualization and calculation with two-dimensional MR elastography methods (17,33). By extending the method to three-dimensional MR elastography coupled with the minimal invasiveness of the needle driver, our goal was to ensure optimal data collection of a simple wave field to produce the most reliable estimates of liver mechanical properties. Another limitation is that we kept the imaging matrix unchanged within a wide field-of-view range to maintain reasonable imaging time in our pig model. However, this effect could have been counted in several repeatability and reproducibility studies (34–36). However, a systematic evaluation is still needed. Finally, MR elastography cannot produce equivalent cellular information (eg, distinguishing viral hepatitis from NASH) regarding the origin of liver disease.
In conclusion, multifrequency three-dimensional hepatic MR elastography provides multiple parameters that can be used to characterize different pathophysiologic states of the liver. Liver stiffness provides a sensitive but nonspecific indicator of hepatic disease, while damping ratio provides an independent parameter that can complement liver stiffness when distinguishing inflammation from fibrosis in the early stages of chronic liver disease, even before the development of histologically detectable necroinflammatory cellular invasion. Damping ratio measurements also show promise in discriminating between congestion-induced portal hypertension and fibrosis-induced portal hypertension. It is anticipated that once MR elastography–assessed liver stiffness and damping ratio are validated for use in the quantification of inflammation and fibrosis in human subjects, this will substantially advance our understanding and ability to detect disease procession in the broad spectrum of chronic liver diseases and enable a large number of therapeutic studies to be conducted to investigate treatment efficacy.
Advances in Knowledge
■ MR elastography–derived measurements of damping ratio and loss modulus can be used to detect inflammation before the onset of fibrosis (eg, steatohepatitis mouse model with 20 weeks of a fast-food diet vs a control mouse of the same age: mean damping ratio, 0.044 ± 0.012 [standard deviation] vs 0.014 ± 0.008, P < .001; mean loss modulus, 0.028 kPa ± 0.010 vs 0.008 kPa ± 0.005, P < .01).
■ With developed fibrosis, liver stiffness increases progressively with fibrosis extent (steatohepatitis mouse model with 48 weeks of a fast-food diet vs a control mouse of the same age, 0.51 kPa ± 0.12 vs 0.29 kPa ± 0.01; P = .02), while damping ratio and loss modulus are not sensitive to advanced abnormalities in the same two groups (damping ratio: 0.031 ± 0.016 vs 0.033 ± 0.007, P = .98; loss modulus: 0.031 kPa ± 0.019 vs 0.019 kPa ± 0.005, P = .35).
■ In animals with hepatic vascular congestion, liver stiffness is positively correlated with portal pressure (ρ = 0.86, P < . 001), while damping ratio is negatively correlated with portal pressure (ρ = −0.54, P = .003).
Implication for Patient Care
■ A combination of liver stiffness and damping ratio may be useful to identify different pathophysiologic states, once validated in human studies.
APPENDIX
SUPPLEMENTAL FIGURES
Acknowledgments
Acknowledgments
The authors thank Diane M. Sauter, RT (R) (MR); Usman Yaqoob, MBBS; and Anuradha Krishnan, PhD, for their excellent technical assistance. One of the mouse models (ARPKD) was provided by Mayo Translational PKD Center (DK090728).
Received March 14, 2016; revision requested May 9; revision received September 12; accepted October 24; final version accepted November 16.
Supported by National Institutes of Health (R41 DK092105) and National Institute of Biomedical Imaging and Bioengineering (EB001981, EB017197).
Disclosures of Conflicts of Interest: M.Y. Activities related to the present article: disclosed no relevant relationships. Activities not related to the present article: receives royalties from and holds stock in Resoundant. Other relationships: has intellectual property rights and a financial interest in MR elastography technology. K.J.G. Activities related to the present article: disclosed no relevant relationships. Activities not related to the present article: holds stock in Resoundant, has patents and intellectual property related to the technology used in this research, and receive royalties from the licensing of this technology. Other relationships: disclosed no relevant relationships. A.M. Activities related to the present article: disclosed no relevant relationships. Activities not related to the present article: received nonfinancial support from Resoundant. Other relationships: disclosed no relevant relationships. T.M. disclosed no relevant relationships. H.M. disclosed no relevant relationships. D.A.S. disclosed no relevant relationships. R.W. disclosed no relevant relationships. L.Y. disclosed no relevant relationships. S.A.M. disclosed no relevant relationships. J.M.G. disclosed no relevant relationships. F.M.E. disclosed no relevant relationships. C.J.W. disclosed no relevant relationships. P.C.H. Activities related to the present article: disclosed no relevant relationships. Activities not related to the present article: received a grant from Otsuka Pharmaceuticals. Other relationships: disclosed no relevant relationships. S.L.N. disclosed no relevant relationships. V.H.S. Activities related to the present article: disclosed no relevant relationships. Activities not related to the present article: has intellectual property rights and a financial interest in MR elastography. Other relationships: disclosed no relevant relationships. R.L.E. Activities related to the present article: disclosed no relevant relationships. Activities not related to the present article: received a grant from and holds patents issued by Resoundant. Other relationships: serves as CEO of Resoundant.
Abbreviations:
- ARPKD
- autosomal recessive polycystic kidney disease
- NAFLD
- nonalcoholic fatty liver disease
- NASH
- nonalcoholic steatohepatitis
- pIVCL
- partial inferior vena cava ligation
References
- 1.Stamenović D. Rheological behavior of mammalian cells. Cell Mol Life Sci 2008;65(22):3592–3605. [DOI] [PMC free article] [PubMed] [Google Scholar]
- 2.Hansma P, Yu H, Schultz D, et al. The tissue diagnostic instrument. Rev Sci Instrum 2009;80(5):054303. [DOI] [PMC free article] [PubMed] [Google Scholar]
- 3.Yin M, Chen J, Glaser KJ, Talwalkar JA, Ehman RL. Abdominal magnetic resonance elastography. Top Magn Reson Imaging 2009;20(2):79–87. [DOI] [PMC free article] [PubMed] [Google Scholar]
- 4.Barry CT, Mills B, Hah Z, et al. Shear wave dispersion measures liver steatosis. Ultrasound Med Biol 2012;38(2):175–182. [DOI] [PMC free article] [PubMed] [Google Scholar]
- 5.Tapper EB, Cohen EB, Patel K, et al. Levels of alanine aminotransferase confound use of transient elastography to diagnose fibrosis in patients with chronic hepatitis C virus infection. Clin Gastroenterol Hepatol 2012;10(8):932–937.e1. [DOI] [PMC free article] [PubMed] [Google Scholar]
- 6.Ding H, Wu T, Ma K, et al. Noninvasive measurement of liver fibrosis by transient elastography and influencing factors in patients with chronic hepatitis B-A single center retrospective study of 466 patients. J Huazhong Univ Sci Technolog Med Sci 2012;32(1):69–74. [DOI] [PubMed] [Google Scholar]
- 7.Yin M, Talwalkar JA, Glaser KJ, et al. Assessment of hepatic fibrosis with magnetic resonance elastography. Clin Gastroenterol Hepatol 2007;5(10):1207–1213.e2. [DOI] [PMC free article] [PubMed] [Google Scholar]
- 8.Asbach P, Klatt D, Hamhaber U, et al. Assessment of liver viscoelasticity using multifrequency MR elastography. Magn Reson Med 2008;60(2):373–379. [DOI] [PubMed] [Google Scholar]
- 9.Huwart L, Sempoux C, Vicaut E, et al. Magnetic resonance elastography for the noninvasive staging of liver fibrosis. Gastroenterology 2008;135(1):32–40. [DOI] [PubMed] [Google Scholar]
- 10.Yin M, Glaser KJ, Talwalkar JA, Chen J, Manduca A, Ehman RL. Hepatic MR elastography: clinical performance in a series of 1377 consecutive examinations. Radiology 2016;278(1):114–124. [DOI] [PMC free article] [PubMed] [Google Scholar]
- 11.Vispo E, Barreiro P, Del Valle J, et al. Overestimation of liver fibrosis staging using transient elastography in patients with chronic hepatitis C and significant liver inflammation. Antivir Ther 2009;14(2):187–193. [DOI] [PubMed] [Google Scholar]
- 12.Wang HK, Lai YC, Tseng HS, et al. Hepatic venous congestion after living donor liver transplantation: quantitative assessment of liver stiffness using shear wave elastography—a case report. Transplant Proc 2012;44(3):814–816. [DOI] [PubMed] [Google Scholar]
- 13.Ronot M, Lambert S, Elkrief L, et al. Assessment of portal hypertension and high-risk oesophageal varices with liver and spleen three-dimensional multifrequency MR elastography in liver cirrhosis. Eur Radiol 2014;24(6):1394–1402. [DOI] [PubMed] [Google Scholar]
- 14.Simonetto DA, Yang HY, Yin M, et al. Chronic passive venous congestion drives hepatic fibrogenesis via sinusoidal thrombosis and mechanical forces. Hepatology 2015;61(2):648–659. [DOI] [PMC free article] [PubMed] [Google Scholar]
- 15.Elgilani F, Mao SA, Glorioso JM, et al. Chronic phenotype characterization of a large-animal model of hereditary tyrosinemia type 1. Am J Pathol 2016;187(1)33–41. [DOI] [PMC free article] [PubMed] [Google Scholar]
- 16.Salameh N, Larrat B, Abarca-Quinones J, et al. Early detection of steatohepatitis in fatty rat liver by using MR elastography. Radiology 2009;253(1):90–97. [DOI] [PubMed] [Google Scholar]
- 17.Yin M, Woollard J, Wang X, et al. Quantitative assessment of hepatic fibrosis in an animal model with magnetic resonance elastography. Magn Reson Med 2007;58(2):346–353. [DOI] [PubMed] [Google Scholar]
- 18.Wang MH, Palmeri ML, Guy CD, et al. In vivo quantification of liver stiffness in a rat model of hepatic fibrosis with acoustic radiation force. Ultrasound Med Biol 2009;35(10):1709–1721. [DOI] [PMC free article] [PubMed] [Google Scholar]
- 19.Guo J, Posnansky O, Hirsch S, et al. Fractal network dimension and viscoelastic powerlaw behavior. II. An experimental study of structure-mimicking phantoms by magnetic resonance elastography. Phys Med Biol 2012;57(12):4041–4053. [DOI] [PubMed] [Google Scholar]
- 20.Ronot M, Lambert SA, Wagner M, et al. Viscoelastic parameters for quantifying liver fibrosis: three-dimensional multifrequency MR elastography study on thin liver rat slices. PLoS One 2014;9(4):e94679. [DOI] [PMC free article] [PubMed] [Google Scholar]
- 21.Serai SD, Yin M, Wang H, Ehman RL, Podberesky DJ. Cross-vendor validation of liver magnetic resonance elastography. Abdom Imaging 2015;40(4):789–794. [DOI] [PMC free article] [PubMed] [Google Scholar]
- 22.Al-Dahshan M. Clinical application of transient elastography in prediction of portal hypertension related complication in patients with chronic liver diseases. J Egypt Soc Parasitol 2012;42(1):79–88. [DOI] [PubMed] [Google Scholar]
- 23.Reiberger T, Ferlitsch A, Payer BA, et al. Noninvasive screening for liver fibrosis and portal hypertension by transient elastography: a large single center experience. Wien Klin Wochenschr 2012;124(11-12):395–402. [DOI] [PubMed] [Google Scholar]
- 24.Dzyubak B, Glaser K, Yin M, et al. Automated liver stiffness measurements with magnetic resonance elastography. J Magn Reson Imaging 2013;38(2):371–379. [DOI] [PMC free article] [PubMed] [Google Scholar]
- 25.Liu H, Fu J, Hong R, Liu L, Li F. Acoustic radiation force impulse elastography for the non-invasive evaluation of hepatic fibrosis in non-alcoholic fatty liver disease patients: a systematic review & meta-analysis. PLoS One 2015;10(7):e0127782. [DOI] [PMC free article] [PubMed] [Google Scholar]
- 26.Loomba R, Wolfson T, Ang B, et al. Magnetic resonance elastography predicts advanced fibrosis in patients with nonalcoholic fatty liver disease: a prospective study. Hepatology 2014;60(6):1920–1928. [DOI] [PMC free article] [PubMed] [Google Scholar]
- 27.Kwok R, Tse YK, Wong GL, et al. Systematic review with meta-analysis: non-invasive assessment of non-alcoholic fatty liver disease—the role of transient elastography and plasma cytokeratin-18 fragments. Aliment Pharmacol Ther 2014;39(3):254–269. [DOI] [PubMed] [Google Scholar]
- 28.Petta S, Maida M, Macaluso FS, et al. The severity of steatosis influences liver stiffness measurement in patients with nonalcoholic fatty liver disease. Hepatology 2015;62(4):1101–1110. [DOI] [PubMed] [Google Scholar]
- 29.Garteiser P, Doblas S, Daire JL, et al. MR elastography of liver tumours: value of viscoelastic properties for tumour characterisation. Eur Radiol 2012;22(10):2169–2177. [DOI] [PubMed] [Google Scholar]
- 30.Reiss-Zimmermann M, Streitberger KJ, Sack I, et al. High resolution imaging of viscoelastic properties of intracranial tumours by multi-frequency magnetic resonance elastography. Clin Neuroradiol 2015;25(4):371–378. [DOI] [PubMed] [Google Scholar]
- 31.Perepelyuk M, Terajima M, Wang AY, et al. Hepatic stellate cells and portal fibroblasts are the major cellular sources of collagens and lysyl oxidases in normal liver and early after injury. Am J Physiol Gastrointest Liver Physiol 2013;304(6):G605–G614. [DOI] [PMC free article] [PubMed] [Google Scholar]
- 32.Thabut D, Routray C, Lomberk G, et al. Complementary vascular and matrix regulatory pathways underlie the beneficial mechanism of action of sorafenib in liver fibrosis. Hepatology 2011;54(2):573–585. [DOI] [PMC free article] [PubMed] [Google Scholar]
- 33.Zhu B, Wei L, Rotile N, et al. Combined magnetic resonance elastography and collagen molecular magnetic resonance imaging accurately stage liver fibrosis in a rat model. Hepatology doi:10.1002/hep.28930. Published November 7, 2016. Accessed January 16, 2017. [DOI] [PMC free article] [PubMed] [Google Scholar]
- 34.Yasar TK, Wagner M, Bane O, et al. Interplatform reproducibility of liver and spleen stiffness measured with MR elastography. J Magn Reson Imaging 2016;43(5):1064–1072. [DOI] [PMC free article] [PubMed] [Google Scholar]
- 35.Lee Yj, Lee JM, Lee JE, et al. MR elastography for noninvasive assessment of hepatic fibrosis: reproducibility of the examination and reproducibility and repeatability of the liver stiffness value measurement. J Magn Reson Imaging 2014;39(2):326–331. [DOI] [PubMed] [Google Scholar]
- 36.Trout AT, Serai S, Mahley AD, et al. Liver stiffness measurements with MR elastography: agreement and repeatability across imaging systems, field strengths, and pulse sequences. Radiology 2016;281(3):793–804. [DOI] [PubMed] [Google Scholar]
Associated Data
This section collects any data citations, data availability statements, or supplementary materials included in this article.


