Abstract
The polytopic membrane protein SCAP transports sterol regulatory element-binding proteins (SREBPs) from the endoplasmic reticulum (ER) to the Golgi, thereby activating cholesterol synthesis. Cholesterol accumulation in the ER membranes changes SCAP to an alternate conformation in which it binds ER retention proteins called Insigs, thereby terminating cholesterol synthesis. Here, we show that the conserved Asp-428 in the sixth transmembrane helix of SCAP is essential for SCAP's dissociation from Insigs. In transfected hamster cells, mutant SCAP in which Asp-428 is replaced by alanine (D428A) remained in an Insig-binding conformation when cells were depleted of sterols. As a result, mutant SCAP failed to dissociate from Insigs, and it failed to carry SREBPs to the Golgi. These data identify an important functional residue in SCAP, and they provide genetic evidence that the conformation of SCAP dictates the rate of cholesterol synthesis in animal cells.
Keywords: Insig, membrane proteins, sterol regulatory element-binding protein
The interaction of two polytopic membrane proteins, SREBP cleavage-activating protein (SCAP) and Insig, is a central event in the control of cholesterol homeostasis in animal cells (1, 2). SCAP is an escort protein for sterol regulatory element-binding proteins (SREBPs) that are membrane-bound transcription factors activating genes encoding enzymes required for synthesis of cholesterol and other lipids. After their synthesis on endoplasmic reticulum (ER) membranes, SREBPs form tight complexes with SCAP. If cells are replete with sterols, the SCAP/SREBP complex binds to one of the two ER retention proteins, Insig-1 or Insig-2, which hold the SCAP/SREBP complex in the ER. When sterols are depleted, the SCAP/SREBP complex dissociates from Insig and becomes incorporated into COPII-coated vesicles that transport the complex to the Golgi apparatus (3, 4). Here, the SREBP is processed sequentially by two proteases that release its active transcription domain so that it can enter the nucleus (5–7).
Three different point mutations in SCAP each prevent binding to Insigs (1, 8). Cells that express any one of these mutant SCAPs overproduce cholesterol because of the inability to retain SCAP in the ER in a sterol-dependent fashion. All three point mutations (Y298C, D443N, and L315F) occur within the membrane-attachment domain of SCAP. This domain consists of eight transmembrane helices separated by hydrophilic loops of various sizes (9). The three mutations occur within the sterol-sensing domain of SCAP, which consists of transmembrane helices 2–6. This domain is shared with several other proteins, most of which either transport sterols or are regulated by sterols (5, 10, 11). A fragment of SCAP containing helices 1–6 is sufficient to undergo sterol-regulated binding to Insigs (1).
Recent studies indicate that cholesterol binds directly to SCAP, thereby triggering a conformational change that causes SCAP to bind to Insig. These studies showed that (i) cholesterol binds with specificity and saturation kinetics to the purified detergent-solubilized membrane domain of SCAP (12); and (ii) addition of cholesterol to cultured cells or to isolated cell membranes causes a conformational change in SCAP, as detected by the exposure of a previously buried arginine to cleavage by trypsin (13–15). This conformational change is enhanced when the membranes contain excess Insigs. Importantly, 25-hydroxycholesterol (25-HC) also triggers SCAP/Insig binding, but it does not bind directly to purified SCAP (12), and it does not cause the same conformational change (15). These findings suggest that 25-HC acts by an indirect mechanism that is still obscure.
The current studies were designed to further define residues in the membrane domain of SCAP that are necessary either for the cholesterol-induced binding of SCAP to Insigs or for the dissociation of this binding upon cholesterol depletion. We identify an important role for Asp-428, a negatively charged amino acid in the middle of the hydrophobic sixth transmembrane helix of SCAP. Mutations that abolish this negative charge produce an altered SCAP that binds tightly to Insigs, even when cells are depleted of cholesterol. In sterol-depleted cells, much of this mutant SCAP remains in the trypsin-sensitive conformation that is associated with Insig binding. As expected from these results, this mutant SCAP is largely inactive in transporting SREBPs to the Golgi apparatus, even under conditions of sterol depletion.
Materials and Methods
Plasmids. The following recombinant expression plasmids have been described: pTK-HSV-BP-2, encoding wild-type herpes simplex virus (HSV)-tagged human SREBP-2 under control of thymidine kinase (TK) promoter (16); pCMV-SCAP, encoding wild-type hamster SCAP under control of cytomegalovirus (CMV) promoter (17); pTK-SCAP and pTK-SCAP(Y298C), encoding wild-type and mutant hamster SCAP, respectively, under control of TK promoter (18); and pTK-Insig-1-Myc and pTK-Insig-2-Myc, encoding wild-type human Insig-1 and Insig-2, respectively, followed by six tandem copies of a c-Myc epitope tag (EQKLISEEDL) under control of TK promoter (Y. Gong, M.S.B., and J.L.G., unpublished work). Site-directed mutagenesis was carried out by using the QuikChange II XL kit (Stratagene). The coding regions of all plasmids were sequenced before use.
Cell Culture. Cells were grown in monolayer at 37°C in an atmosphere of 8–9% CO2. SRD-13A cells are previously described cholesterol and unsaturated fatty acid auxotrophs derived from γ-irradiated CHO cells (19) and maintained in medium A (a 1:1 ratio mixture of Ham's F-12 medium and DMEM containing 5% FCS, 5 μg/ml cholesterol, 1 mM sodium mevalonate, 20 μM sodium oleate, 100 units/ml penicillin, and 100 μg/ml streptomycin sulfate). Lipid auxotrophy results from a loss of the mRNA encoding SCAP.
Transient Transfection of SRD-13A Cells. On day 0, SRD-13A cells were set up in medium A at 6.5 × 10⁵ cells per 60-mm dish. On day 1, cells were transfected with plasmids with FuGENE 6 reagent (19). The total amount of DNA in each transfection was adjusted to 3–5 μg per dish with pcDNA3 (Invitrogen). After transfection, the cells were incubated at 37°C for 16 h. On day 2, cells were washed once with PBS, switched to medium B (a 1:1 ratio mixture of Ham's F-12 medium and DMEM containing 5% newborn calf lipoprotein-deficient serum, 50 μM sodium compactin, 50 μM sodium mevalonate, 100 units/ml penicillin, and 100 μg/ml streptomycin sulfate) containing 1% (wt/vol) hydroxypropyl-β-cyclodextrin (HCD). After incubation at 37°C for 1 h, cells were washed twice with PBS and switched to medium B in the absence or presence of sterols as indicated. After incubation for 3–6 h, cells were harvested for SREBP-2 cleavage or immunoprecipitation. Transfection of SRD-13A cells in 100-mm dishes was performed as above except that cells were set up at 7 × 10⁵ cells per 100-mm dish and transfected on day 2. On day 3, cells were treated as indicated in the figure legends and harvested for blue native PAGE and trypsin cleavage assay.
Trypsin Cleavage of SCAP. Aliquots (100 μg) of the 20,000 × g membrane fraction from transfected SRD-13A cells were subjected to trypsin digestion, followed by electrophoresis on 12% Tris-tricine gels as described (15).
Purification of Recombinant SCAP. Recombinant baculoviruses encoding the eight transmembrane regions of wild-type or D428A mutant version of hamster SCAP with an NH2-terminal His tag, designated His10-SCAP(TM1–8) or His10-SCAP(TM1–8)(D428A), were constructed in pFastBacHTa expression vector (Invitrogen) as described (12). Recombinant proteins were overexpressed in Sf9 insect cells and purified in buffer D [50 mM Tris·HCl, pH 7.5/150 mM NaCl/1 mM DTT/0.1% (wt/vol) Fos-Choline] by using nickel chromatography and gel filtration as described (12).
[3H]Sterol-Binding Assay. In the standard assay, binding reactions were set up in microcentrifuge tubes at room temperature as described (12). Each reaction, in a final volume of 100 μl of buffer D contained 10 pmol (0.8 μg) of purified His10-SCAP(TM1–8) or His10-SCAP(TM1–8)(D428A), 1–40 pmol of [3H]cholesterol or [3H]25-HC solubilized in buffer D (10–400 nM, final concentration), and 25 mM phosphorylcholine chloride. After incubation for 4 h, the mixture was passed through a column packed with 0.3 ml of Ni-nitrilotriacetic acid (NTA) agarose beads. Each column was then washed for ≈20 min with 10 ml of buffer D, after which protein-bound [3H]cholesterol was eluted with 250 mM imidazole as described (12). Dissociation rates were measured by isolating the [3H]cholesterol/SCAP complex as described above, and diluting it 10-fold with buffer D saturated with unlabeled cholesterol. After incubation at room temperature for the indicated time, the mixture was transferred to a tube containing 1 ml of Ni-NTA agarose beads preequilibrated with buffer D, incubated for 2 min, and then centrifuged at 400 × g for 30 s, after which the pellet and supernatant were assayed for radioactivity by scintillation counting (12).
Further information on materials and certain methods used in this study (SREBP-2 Cleavage Assay, Immunoprecipitation, Immunoblot Analysis, Blue Native-PAGE, and Solubilization of Sterols) can be found in Supporting Methods, which is published as supporting information on the PNAS web site.
Results
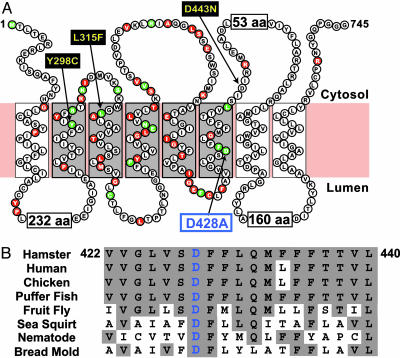
Fig. 1A shows the amino acid sequence and proposed topology of the membrane domain of hamster SCAP. Residues that are identical in SCAP sequences from seven animal species are indicated in red. Residues that are also identical in bread mold are indicated in green. In an initial attempt to identify functionally important residues, we prepared plasmids encoding mutant SCAPs in which the conserved residues were changed individually to alanine. The plasmids were introduced into SRD-13A cells, a line of CHO cells that lacks SCAP, owing to mutations in both copies of the gene (19). The transfected cells were assayed for the ability of the mutant SCAP to support processing of SREBP-2 and to undergo regulation by 25-HC or cholesterol. These preliminary studies revealed an important function for Asp-428, which is in the middle of the sixth membrane-spanning helix. This residue is conserved in all animal species (for which data are available) plus bread mold (Fig. 1B).
Fig. 1.
Amino acid sequence and topology of the membrane domain of hamster SCAP(TM1–8). (A) SCAP topology. Within the sterol-sensing domain (shaded) are shown the D428A mutation (blue box) and three previously reported mutations that confer sterol resistance: Y298C (9), D443N (21), and L315F (8) (yellow boxes). Residues that are identical in seven animal species (hamster, human, chicken, puffer fish, fruit fly, sea squirt, and nematode) are red. Residues that are identical in all of these species plus bread mold are green. Sequences of SCAP were aligned by using the clustalw program (DNASTAR, Madison, WI). (B) Sixth transmembrane domain (TM6) of SCAP. Residues identical to hamster are shaded. GenBank accession nos. are as follows: P97260, Cricetulus griseus (hamster); Q12770, Homo sapiens (human); XP_418485, Gallus gallus (chicken); FuguGenscan 2662, Takifugu rubripes (puffer fish); AAF57291, Drosophila melanogaster (fruit fly); AABS01001141, Ciona intestinalis (sea squirt); CAA87777, Caenorhabditis elegans (nematode); and EAA32215, Neurospora crassa (bread mold).
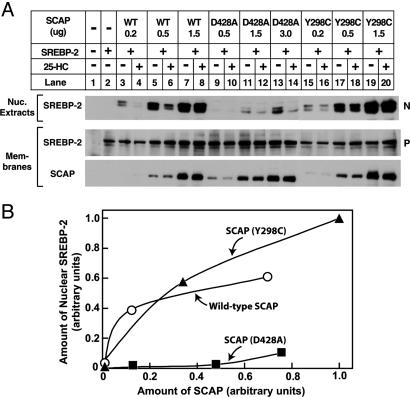
Fig. 2 shows an experiment in which plasmids encoding wild-type SCAP, or two mutant SCAPs, were transfected into SRD-13A cells together with a plasmid encoding SREBP-2. When SREBP-2 was overexpressed by transfection, the full-length protein was visualized in membranes, but it was not processed to the nuclear form (Fig. 2, lane 2). Coexpression of wild-type SCAP at low levels (0.2–0.5 μg of plasmid) restored SREBP-2 processing (Fig. 2, lanes 3 and 5), and this expression was decreased by 25-HC (Fig. 2, lanes 4 and 6). At a higher level of SCAP expression, there was no longer suppression by 25-HC (Fig. 2, lanes 7 and 8), owing to the excess of SCAP over endogenous Insig as previously reported (1). Transfection with 0.5 μg of the SCAP(D428A) plasmid failed to produce SREBP-2 processing (Fig. 2, lanes 9 and 10), despite the fact that the amount of SCAP expression was comparable with that observed with 0.5 μg of wild-type SCAP (see immunoblot of SCAP in membranes; Fig. 2, lanes 5–12). At higher levels of expression, the D428A mutant was able to support some SREBP-2 processing (Fig. 2, lanes 11 and 13), but the amount was much less than observed at similar levels of wild-type SCAP (Fig. 2, lanes 7 and 8).
Fig. 2.
Mutant SCAP(D428A) is defective in mediating SREBP-2 processing. (A) Immunoblot analysis. On day 0, SRD-13A cells were set up in medium A at 6.5 × 10⁵ cells per 60-mm dish. On day 1, cells were transfected with the following plasmids per dish: 2 μg of pTK-HSV-BP2; the indicated amount of wild-type pTK-SCAP (WT) (lanes 3–8) or the D428A (lanes 9–14), or Y298C (lanes 15–20) mutants; and various amounts of pcDNA3 to adjust total DNA to 5 μg. On day 2, cells were washed once with PBS, switched to medium B containing 1% HCD, and incubated for 1 h at 37°C. Cells were then washed twice with PBS and switched to medium B in the absence or presence of 1μg/ml 25-HC. After incubation for 3.5 h at 37°C, cells were harvested and fractionated as described in Materials and Methods. Aliquots of nuclear extracts (20 μg of protein) and membranes (25 μg of protein) were subjected to SDS/PAGE and immunoblot analysis with anti-HSV tag antibody (against SREBP-2) and IgG-R139 (against SCAP). N and P denote the cleaved nuclear and uncleaved precursor forms of SREBP-2, respectively. Filters were exposed to film for 5–15 s. (B) Amount of nuclear SREBP-2 in the absence of sterols. Relative intensity of the bands in A [lanes 3, 5, and 7 (○), lanes 9, 11, and 13 (▪), and lanes 15, 17, and 19 (▴)] were quantified by densitometry.
For comparative purposes in this experiment, we transfected the SRD-13A cells with a plasmid encoding the Y298C mutant of SCAP, which does not bind to Insig, and therefore does not undergo inhibition by 25-HC (1). SCAP(Y298C) stimulated SREBP-2 processing, and there was no inhibition by 25-HC (Fig. 2, lanes 15–20). To quantify these data, the gels were scanned on a densitometer, and the intensity of the nuclear SREBP-2 band was plotted as a function of the density of the SCAP band (Fig. 2B). The data show that wild-type SCAP and SCAP(Y298C) were roughly equivalent in their ability to support SREBP-2 processing, but SCAP(D428A) was markedly deficient.
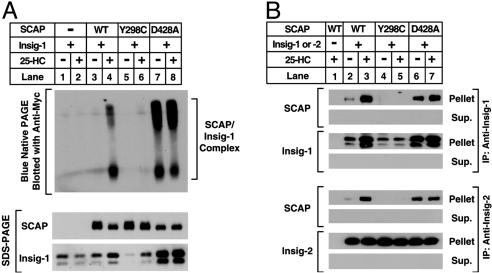
For SCAP to carry SREBPs to the Golgi, SCAP must dissociate from Insig proteins in a reaction that requires sterol depletion. The experiments of Fig. 3 were designed to determine whether SCAP(D428A) binds to Insig, and whether it dissociates in the absence of sterols. We previously showed that the SCAP/Insig complex can be visualized as a slow-moving series of broad bands when cell extracts are processed by blue native PAGE and blotted with an antibody to epitope-tagged Insig-1 (1, 15). When Myc-tagged Insig-1 was expressed alone in SRD-13A cells, no complex with SCAP was observed (Fig. 3A, lanes 1 and 2). Coexpression with wild-type SCAP produced a SCAP/Insig complex that was observed in the presence of sterols (Fig. 3A, lane 4), but disappeared upon sterol depletion (Fig. 3A, lane 3). SCAP(Y298C) did not form a complex with Insig under either condition (Fig. 3A, lanes 5 and 6). In marked contrast, SCAP(D428A) formed a complex with Insig in the absence or presence of sterols (Fig. 3A, lanes 7 and 8). A similar result was observed when the SCAP/Insig complex was isolated by coimmunoprecipitation (Fig. 3B). Immunoprecipitation of Insig-1 or Insig-2 pulled down wild-type SCAP only in the presence of sterols (Fig. 3B, lane 3). It did not pull down SCAP(Y298C) in either condition (Fig. 3B, lanes 4 and 5), and it pulled down SCAP(D428A) under both conditions (Fig. 3B, lanes 6 and 7). These data indicate that the D428A substitution alters SCAP in such a way that it binds to Insig constitutively in the absence and presence of sterols.
Fig. 3.
Binding of mutant SCAP(D428A) to Insig is resistant to sterol depletion. (A) Blue native PAGE of the SCAP/Insig-1 complex. On day 0, SRD-13A cells were set up in medium A at 7 × 10⁵ cells per 100-mm dish. On day 2, cells were transfected with the following plasmids per dish: 1.2 μg of pTK-Insig-1-Myc and 3.5 μg of wild-type pTK-SCAP (WT) (lanes 3–4), the Y298C mutants (lanes 5–6), or the D428A mutants (lanes 7–8) as indicated. On day 3, cells were washed once with PBS, switched to medium B containing 1% HCD, and incubated for 2 h at 37°C. Cells were then washed twice with PBS and switched to medium B in the absence or presence of 1 μg/ml 25-HC. After incubation for 5 h at 37°C, cells were harvested, and aliquots (30 and 10 μg, respectively) of the 1 × 10⁵ g of membrane suspension were subjected to blue native PAGE (Upper) or SDS/PAGE (Lower). Filters were blotted with IgG-9E10 (against Insig-1) and IgG-R139 (against SCAP) and exposed to film for a period of 15 s to 1 min. (B) Coimmunoprecipitation of Insig-1 and Insig-2 with SCAP. On day 0, SRD-13A cells were set up in medium A at 6.5 × 10⁵ cells per 60-mm dish. On day 1, cells were transfected with the following plasmids per dish: 0.3 μg of pTK-Insig-1-Myc (the top four rows); 1.5 μg of pTK-Insig-2-Myc (the bottom four rows); 1.5 μg of wild-type pTK-SCAP (WT) (lanes 1–3), the Y298C mutants (lanes 4–5), or the D428A mutants (lanes 6–7) as indicated; and pcDNA3 to normalize total DNA to 3 μg. On day 2, the cells were washed once with PBS and switched to medium B containing 1% HCD, and incubated for 1 h at 37°C. Cells were then washed twice with PBS and switched to medium B in the absence or presence of 0.2 μg/ml 25-HC. After incubation for 4 h, cells were harvested for immunoprecipitation with monoclonal anti-Myc IgG (9E10) as described in Materials and Methods. Immunoprecipitated pellets (representing 0.3 of a dish of cells) and supernatants (0.035 of a dish of cells) were subjected to SDS/PAGE, and the filters were blotted with polyclonal anti-Myc IgG (against Insig-1 and -2) and IgG-R139 (against SCAP), and exposed to film for a period of 1 s to 1 min.
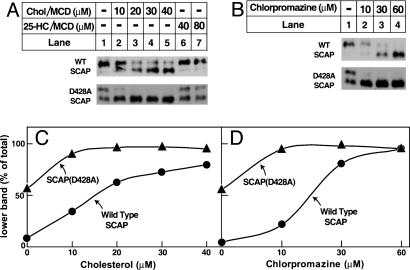
When SCAP binds to cholesterols and Insigs, it undergoes a conformational change that exposes a membrane-proximal arginine residue to protease cleavage (13–15). This change produces a lower band that is visualized when sealed vesicles are treated with trypsin, subjected to SDS/PAGE, and blotted with an antibody against a protected intraluminal loop of SCAP. As shown in Fig. 4A, when sterol-depleted cells expressed wild-type SCAP trypsin digestion produced a predominant upper band (Fig. 4A, lane 1). Preincubation of the membrane vesicles with increasing amounts of cholesterol/cyclodextrin complexes led to a gradual increase in the amount of the lower band (Fig. 4A, lanes 2–5). 25-HC/cyclodextrin treatment did not produce the lower band (Fig. 4A, lanes 6 and 7). When cells expressed SCAP(D428A), the lower band was visualized even in the absence of sterols (Fig. 4A, lane 1), and it reached a near maximum at the lowest cholesterol concentration (10 μM). To quantify these results, the gels were scanned, and the density of the lower band was expressed as a percentage of the total density of both bands (Fig. 4C). In the absence of added cholesterol, >50% of SCAP(D428A) was present in the lower band, and nearly 100% was in this form at 10 μM of cholesterol. This result was markedly different from the result with wild-type SCAP.
Fig. 4.
SCAP(D428A) assumes Insig-binding conformation at low levels of ligand. (A) Trypsin cleavage of SCAP after treatment of membranes with sterols. On day 0, SRD-13A cells were set up in medium A at 7 × 10⁵ cells per 100-mm dish. On day 2, cells were transfected with 2.5 μg of either wild-type pCMV-SCAP (WT) or the D428A mutant as indicated. On day 3, cells were washed once with PBS and switched to medium B containing 1% HCD and incubated for 2 h at 37°C. Replicate dishes were harvested and aliquots (100μg) of the 20,000 × g membrane suspension were incubated for 20 min at room temperature with the indicated concentration of cholesterol/methyl-β-cyclodextrin (MCD) complex (lanes 1–5) or 25-HC/MCD complex (lanes 6–7). At the end of the incubation, the membranes were treated sequentially with 2 μg of trypsin (30°C for 30 min) and 625 units of PNGaseF (37°C for ≈12 h), and then subjected to SDS/PAGE on 12% Tris-tricine SDS gels. Filters were blotted with IgG-R139 (against SCAP) and exposed to film for a period of 30 s to 2 min. (B) Trypsin cleavage of SCAP after treatment of membranes with chlorpromazine. SRD-13A cells were set up, transfected, treated, and harvested as in A. Aliquots (100 μg) of the 20,000 × g membrane suspension were incubated for 20 min at room temperature with the indicated concentration of chlorpromazine. At the end of the incubation, the samples were treated with trypsin and PNGaseF as above. Filters were exposed to film for a period of 30 s to 2 min. (C and D) Relative intensity of the upper and lower bands in A and B was quantified by densitometry.
The conformational change in SCAP can also be elicited by treatment of the cells with certain amphipathic amines like chlorpromazine (14). SCAP(D428A) was also hypersensitive to the conformational change with chlorpromazine (Fig. 4 B and D).
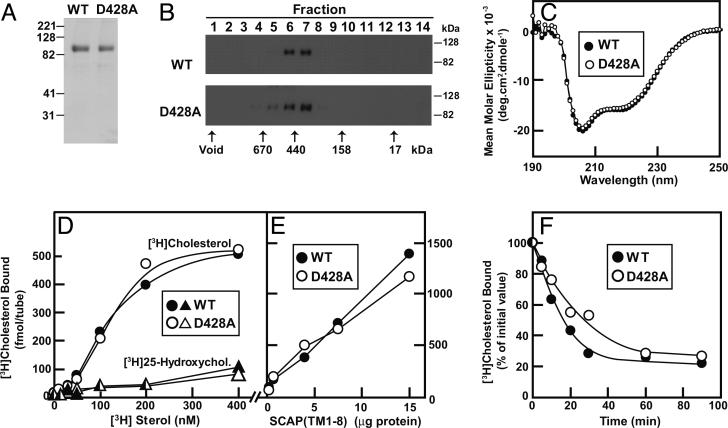
To determine whether the purified membrane domain of SCAP(D428A) shares the properties of wild-type SCAP, we produced a His-tagged protein [amino acids 1–767 by expression in Sf9 insect cells and purified it by Ni affinity chromatography as described for wild-type SCAP (12)]. As with the membrane domain of wild-type SCAP, SCAP(D428A) migrated on SDS/PAGE as a protein of ≈100 kDa (Fig. 5A) and behaved on gel filtration as an apparent tetramer with a molecular mass of ≈430 kDa (Fig. 5B). The CD spectra of wild-type and D428A SCAPs were identical, both showing a high helical content (Fig. 5C). Both membrane domains bound [3H]cholesterol with similar affinities, but neither bound [3H]25-HC (Fig. 5 D and E). The dissociation rate of [3H]cholesterol was similar for the two proteins (Fig. 5F). Thus, the membrane domain of SCAP(D428A) was indistinguishable in biochemical properties from its wild-type counterpart.
Fig. 5.
Physical properties and cholesterol binding of purified wild-type and D428A mutant version of His10-SCAP(TM1–8). (A) Coomassie brilliant blue staining of purified proteins. Recombinant His-tagged proteins were solubilized and purified as described in Materials and Methods. Aliquots (8 μg) of His10-SCAP(TM1–8) and His10-SCAP(TM1–8)(D428A) were subjected to SDS/10% PAGE, and the protein bands were detected with a Coomassie brilliant blue R-250 stain. Molecular masses of protein standards are indicated. (B) Gel filtration chromatography of purified proteins. Buffer D (100 μl) containing 100 μg of either wild-type His10-SCAP(TM1–8) or mutant His10-SCAP(TM1–8)(D428A) was loaded onto a Tricorn 10/300 Superose 6 column (≈24 ml) and chromatographed at a flow rate of 0.4 ml/min. The void volume was 7 ml. Fractions of 1.2 ml were collected, beginning with the void. Aliquots of each fraction were subjected to immunoblot analysis with anti-SCAP IgG-9D5 (exposure time for filter was 5 s). To calibrate the column, standard proteins of known molecular weight (thyroglobulin, Mr = 670,000; ferritin, Mr = 440,000; γ-globulin, Mr = 158,000; and myoglobin, Mr = 17,000) were applied to the same column under identical buffer conditions, and the peaks of elution are indicated by the arrows. (C) CD spectroscopy of purified proteins. CD measurements of 3 μM His10-SCAP(TM1–8) and His10-SCAP(TM1–8)(D428A) in buffer D were carried out on an Aviv 62DS spectrometer by using a 2-mm path length cuvette. The average of 10 spectra are shown. (D) Direct binding of 3H-sterols to purified SCAPs. Each assay tube contained 10 pmol of wild-type His10-SCAP(TM1–8) (• and ▴) or mutant His10-SCAP(TM1–8)(D428A) (○ and ▵) and various amounts of solubilized [3H]cholesterol (121 dpm/fmol) (• and ○)or[3H]25-HC (163 dpm/fmol) (▴ and ▵)in100 μl of buffer D supplemented with 25 mM phosphocholine chloride. Bound 3H-sterols were measured as described in Materials and Methods. Each data point is the average of duplicate assays. Blank values of 3.8–5.7 fmol were subtracted from each data point. (E) Protein concentration curves. Each assay tube contained 100 nM solubilized [3H]cholesterol (121 dpm/fmol) and various amounts of His10-SCAP(TM1–8) or His10-SCAP(TM1–8)(D428A) in 100 μl of buffer D supplemented with 25 mM phosphocholine chloride. Bound [3H]cholesterol was measured as described in Materials and Methods. Each data point is the average of duplicate assays. Blank values of 3.1–8.5 fmol were subtracted from each data point. (F) Dissociation rates of previously bound [3H]cholesterol. Each assay tube contained 10 pmol (100 nM) of solubilized [3H]cholesterol (121 dpm/fmol) and 10 pmol of His10-SCAP(TM1–8) or His10-SCAP(TM1–8)(D428A) in 100 μl of buffer D supplemented with 25 mM phosphocholine chloride. The [3H]cholesterol/SCAP complex was isolated, and bound and dissociated [3H]cholesterol was measured at various time intervals as described in Materials and Methods. Each value (average of duplicate assays) represents the fraction of [3H]cholesterol that remained bound relative to the zero-time value. The “100% of initial” values at time 0 were 263 and 211 fmol per tube for His10-SCAP(TM1–8) and His10-SCAP(TM1–8)(D428A), respectively.
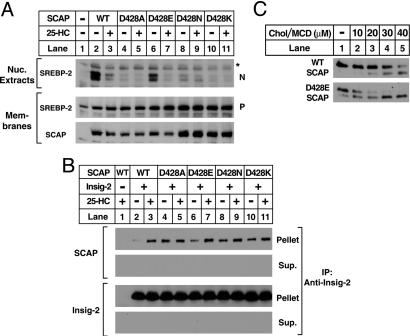
To determine whether the defect in SCAP(428A) is due to the loss of the negative charge, we prepared a series of plasmids encoding SCAP with various substitutions at this position and transfected them into SRD-13A cells (Fig. 6A). Substitution of glutamic acid for aspartic acid preserved most of the ability of SCAP to facilitate SREBP-2 cleavage in the absence of sterols (Fig. 6A, lane 6). Substitution with alanine, asparagine, or lysine destroyed this function (Fig. 6A, lanes 4, 8, and 10). In a coimmunoprecipitation experiment, all of the mutant SCAPs were coimmunoprecipitated with Insig-2 equally in the absence and presence of sterols, except for the D428E mutant, which consistently showed an increased dissociation from Insig-2 in the absence of sterols (Fig. 6B, lane 6). In the trypsin cleavage assay, the D428E mutant showed only a small amount of lower band in the absence of cholesterol, and this amount increased in a normal fashion as the cholesterol concentration increased (Fig. 6C). Considered together, these data suggest that SCAP requires a negatively charged amino acid at position 428 to dissociate from Insigs in the absence of cholesterol. Aspartic acid functions somewhat better than does glutamic acid in this regard.
Fig. 6.
Effect of amino acid substitutions at residue 428 on SCAP's facilitation of SREBP-2 cleavage (A), its binding to Insig (B), and its conformational change in response to cholesterol (C). On day 0, SRD-13A cells were set up in medium A at 6.5 × 10⁵ cells per 60-mm dish (A and B)or7 × 105 cells per 100-mm dish (C). (A) SREBP-2 cleavage. On day 1, cells were transfected with the following plasmids per dish: 2 μg of pTK-HSV-BP2; either 0.5 μg of wild type pTK-SCAP (WT) (lanes 2–3), or 1.1–1.5 μg of the indicated pTK-SCAP mutant (lanes 4–11); and various amounts of pcDNA3 to adjust the total DNA to 3.5 μg. On day 2, the cells were treated, harvested, and fractionated as in Fig. 2 A. Aliquots of nuclear extracts (20 μg of protein) and membranes (25 μg of protein) were subjected to SDS/PAGE and immunoblot analysis with anti-HSV tag antibody (against SREBP-2) and IgG-R139 (against SCAP). N and P denote the cleaved nuclear and uncleaved precursor forms of SREBP-2, respectively. Filters were exposed to film for 5–15 s. The asterisk denotes a nonspecific cross-reacting protein. (B) Coimmunoprecipitation of Insig-2 with SCAP. On day 1, cells were transfected with the following plasmids per dish: 1.5 μg of pTK-Insig-2-Myc (lanes 2–11), either 1.25 μg of wild-type pTK-SCAP (WT) (lanes 1–3) or 1.25 μg of the indicated pTK-SCAP mutant (lanes 4–11), and pcDNA3 to normalize the total DNA to 3 μg. On day 2, cells were treated and harvested for immunoprecipitation with monoclonal anti-Myc IgG (9E10) as in Fig. 3B. Immunoprecipitated pellets (representing 0.3 of a dish of cells) and supernatants (0.035 of a dish of cells) were subjected to SDS/PAGE and immunoblot analysis with polyclonal anti-Myc IgG (against Insig-2) and IgG-R139 (against SCAP). Filters were exposed to film for a 1–10 s. (C) SCAP's conformational change detected by trypsin cleavage assay. On day 2, cells were transfected with 2.5 μg of wild type pCMV-SCAP (WT) or the D428E mutant as indicated. On day 3, cells were treated with 1% HCD, and membranes were prepared for incubation with sterol/MCD complex as in Fig. 4. Aliquots (100 μg) of the 20,000 × g membrane suspension were incubated for 20 min at room temperature with the indicated concentration of cholesterol/MCD complex (lanes 1–5). At the end of the incubation, the membranes were treated sequentially with trypsin and PN-GaseF and then subjected to SDS/PAGE on 12% Tris-tricine SDS gels and immunoblot analysis by using IgG-R139 (against SCAP). Filters were exposed to film for a period of 30 s to 2 min.
Discussion
The current studies disclose a functional role for the universally conserved negatively charged aspartic acid near the middle of the sixth transmembrane helix of SCAP. When Asp-428 was changed to alanine, SCAP bound more tightly to Insigs in sterol-depleted cells, and the mutant protein was no longer able to escort SREBP-2 efficiently to the Golgi. The change in SCAP's behavior was not caused by denaturation or unfolding, as revealed by the normal physical properties of the purified membrane domain of the mutant protein (Fig. 5).
The increased binding of SCAP(D428A) to Insigs in sterol-depleted cells was correlated with an increase in the proportion of SCAP that was in the Insig-binding conformation, as indicated by the abundant lower band on trypsin digestion of isolated membranes (Fig. 4). The proportion of SCAP in this conformation increased in a hypersensitive fashion when SCAP-containing membranes were incubated with low concentrations of cholesterol or amphipathic amines (Fig. 4). These data raise the possibility that SCAP(D428A) may bind to Insigs in sterol-depleted cells because it is hypersensitive to cholesterol, and, therefore, it remains in its Insig-binding conformation, owing to small amounts of cholesterol that may remain in ER membranes even when cells have been treated with HCD.
Although SCAP(D428A) was hypersensitive to cholesterol when embedded in membranes containing Insigs, the mutant protein did not show an increased affinity for cholesterol binding when studied in solution in the absence of Insigs (Fig. 5D). Previous studies (14, 15) with trypsin digestion have shown that the presence of Insigs increases the ability of cholesterol to convert SCAP to the Insig-binding conformation, suggesting a complex three-way interaction between SCAP, cholesterol, and Insigs. It is likely that the hypersensitivity of SCAP(D428A) to cholesterol in Insig-containing membranes results from an enhancement of this three-way interaction, owing to the loss of Asp-428. These data imply that this negatively charged amino acid normally acts either to limit the binding of SCAP to Insigs or to facilitate dissociation of the complex.
It is likely that Asp-428 may play other roles in SCAP function, in addition to accelerating Insig binding. This conclusion follows from the observation that Asp-428 is conserved in SCAP from Drosophila, which do not have a recognizable Insig gene. In Drosophila cells, SCAP movement is not inhibited by sterols; rather, it is inhibited by phosphatidyl ethanolamine (20). Studies in insect cells should reveal whether Asp-428 plays a role in this process.
An important aspect of the current studies is that they provide genetic evidence that our in vitro assays in mammalian cells reflect functionally relevant changes in SCAP. Thus, the D428A mutation increases the proportion of SCAP in the Insig-binding conformation, as determined by the in vitro trypsin cleavage assay, increases the binding of SCAP to Insigs as determined by in vitro blue native PAGE or immunoprecipitation, and decreases the proteolytic processing of SREBP-2 in intact cells. This correlation between in vitro assays and biological effects in intact cells supports the notion that SCAP's conformation is the central determinant that dictates the rate of SREBP processing, and therefore, the rate of lipid synthesis in mammalian cells.
Supplementary Material
Acknowledgments
We thank Jin Ye and Chris Adams for helpful discussion, Angela Carroll and Lisa Beatty for assistance with tissue culture, and Jeff Cormier for DNA sequencing. This work was supported by National Institutes of Health Grant HL20948, the Perot Family Foundation, and National Institutes of Health Medical Scientists Training Grant GM08014 (to J.D.F.). A.R. is a Fellow of the Jane Coffin Childs Memorial Fund for Medical Research. Y.I. is a Fellow of the Banyu Life Science Foundation International.
Author contributions: J.D.F., A.R., M.S.B., and J.L.G. designed research; J.D.F., A.R., Y.I., and J.R. performed research; J.D.F., A.R., M.S.B., and J.L.G. analyzed data; and J.D.F., A.R., M.S.B., and J.L.G. wrote the paper.
Abbreviations: CMV, cytomegalovirus; ER, endoplasmic reticulum; 25-HC, 25-hydroxycholesterol; HCD, hydroxypropyl-β-cyclodextrin; HSV, herpes simplex virus; MCD, methyl-β-cyclodextrin; SREBP, sterol regulatory element-binding protein; TK, thymidine kinase; SCAP, SREBP cleavage-activating protein.
References
- 1.Yang, T., Espenshade, P. J., Wright, M. E., Yabe, D., Gong, Y., Aebersold, R., Goldstein, J. L. & Brown, M. S. (2002) Cell 110, 489-500. [DOI] [PubMed] [Google Scholar]
- 2.Yabe, D., Brown, M. S. & Goldstein, J. L. (2002) Proc. Natl. Acad. Sci. USA 99, 12753-12758. [DOI] [PMC free article] [PubMed] [Google Scholar]
- 3.Nohturfft, A., Yabe, D., Goldstein, J. L., Brown, M. S. & Espenshade, P. J. (2000) Cell 102, 315-323. [DOI] [PubMed] [Google Scholar]
- 4.Espenshade, P. J., Li, W.-P. & Yabe, D. (2002) Proc. Natl. Acad. Sci. USA 99, 11694-11699. [DOI] [PMC free article] [PubMed] [Google Scholar]
- 5.Brown, M. S. & Goldstein, J. L. (1999) Proc. Natl. Acad. Sci. USA 96, 11041-11048. [DOI] [PMC free article] [PubMed] [Google Scholar]
- 6.Edwards, P. A., Tabor, D., Kast, H. R. & Venkateswaran, A. (2000) Biochim. Biophys. Acta 1529, 103-113. [DOI] [PubMed] [Google Scholar]
- 7.Osborne, T. F. (2000) J. Biol. Chem. 275, 32379-32382. [DOI] [PubMed] [Google Scholar]
- 8.Yabe, D., Xia, Z.-P., Adams, C. M. & Rawson, R. B. (2002) Proc. Natl. Acad. Sci. USA 99, 16672-16677. [DOI] [PMC free article] [PubMed] [Google Scholar]
- 9.Nohturfft, A., Brown, M. S. & Goldstein, J. L. (1998) J. Biol. Chem. 273, 17243-17250. [DOI] [PubMed] [Google Scholar]
- 10.Kuwabara, P. E. & Labouesse, M. (2002) Trends Genet. 18, 193-201. [DOI] [PubMed] [Google Scholar]
- 11.Levine, T. (2004) Dev. Cell 7, 152-153. [DOI] [PubMed] [Google Scholar]
- 12.Radhakrishnan, A., Sun, L.-P., Kwon, H. J., Brown, M. S. & Goldstein, J. L. (2004) Mol. Cell 15, 259-268. [DOI] [PubMed] [Google Scholar]
- 13.Brown, A. J., Sun, L., Feramisco, J. D., Brown, M. S. & Goldstein, J. L. (2002) Mol. Cell 10, 237-245. [DOI] [PubMed] [Google Scholar]
- 14.Adams, C. M., Goldstein, J. L. & Brown, M. S. (2003) Proc. Natl. Acad. Sci. USA 100, 10647-10652. [DOI] [PMC free article] [PubMed] [Google Scholar]
- 15.Adams, C. M., Reitz, J., DeBrabander, J. K., Feramisco, J. D., Brown, M. S. & Goldstein, J. L. (2004) J. Biol. Chem. 279, 52772-52780. [DOI] [PubMed] [Google Scholar]
- 16.Hua, X., Sakai, J., Brown, M. S. & Goldstein, J. L. (1996) J. Biol. Chem. 271, 10379-10384. [DOI] [PubMed] [Google Scholar]
- 17.Sakai, J., Nohturfft, A., Cheng, D., Ho, Y. K., Brown, M. S. & Goldstein, J. L. (1997) J. Biol. Chem. 272, 20213-20221. [DOI] [PubMed] [Google Scholar]
- 18.Nohturfft, A., Brown, M. S. & Goldstein, J. L. (1998) Proc. Natl. Acad. Sci. USA 95, 12848-12853. [DOI] [PMC free article] [PubMed] [Google Scholar]
- 19.Rawson, R. B., DeBose-Boyd, R. A., Goldstein, J. L. & Brown, M. S. (1999) J. Biol. Chem. 274, 28549-28556. [DOI] [PubMed] [Google Scholar]
- 20.Dobrosotskaya, I., Seegmiller, A. C., Brown, M. S., Goldstein, J. L. & Rawson, R. B. (2002) Science 296, 879-883. [DOI] [PubMed] [Google Scholar]
- 21.Hua, X., Nohturfft, A., Goldstein, J. L. & Brown, M. S. (1996) Cell 87, 415-426. [DOI] [PubMed] [Google Scholar]
Associated Data
This section collects any data citations, data availability statements, or supplementary materials included in this article.


