

Abstract
Formins are force-sensing proteins that regulate actin polymerization dynamics. Here, we applied stretching tension to individual actin filaments under the regulation of formin mDia1 to investigate the mechanical responses in actin polymerization dynamics. We found that the elongation of an actin filament was accelerated to a greater degree by stretching tension for ADP-G-actin than that for ATP-G-actin. An apparent decrease in the critical concentration of G-actin was observed, especially in ADP-G-actin. These results on two types of G-actin were reproduced by a simple kinetic model, assuming the rapid equilibrium between pre- and posttranslocated states of the formin homology domain two dimer. In addition, profilin concentration dramatically altered the force-dependent acceleration of actin filament elongation, which ranged from twofold to an all-or-none response. Even under conditions in which actin depolymerization occurred, applications of a several-piconewton stretching tension triggered rapid actin filament elongation. This extremely high force-sensing mechanism of mDia1 and profilin could be explained by the force-dependent coordination of the biphasic effect of profilin; i.e., an acceleration effect masked by a depolymerization effect became dominant under stretching tension, negating the latter to rapidly enhance the elongation rate. Our findings demonstrate that the biphasic effect of profilin is controlled by mechanical force, thus expanding the function of mDia1 as a mechanosensitive regulator of actin polymerization.
Introduction
Actin cytoskeleton morphological changes are based on actin filament assembly and disassembly dynamics. These dynamic changes are often force dependent and mediated by several mechanosensitive elements that transduce mechanical force into actin cytoskeleton remodeling (1, 2, 3). Talin and vinculin can construct mechanosensitive machinery that enhances actin filament accumulation on focal adhesions as a result of mechanical response (1). The cadherin-catenin complex collects actin filaments at adherens junctions via a force-dependent binding affinity (3). The actin-severing protein cofilin does not itself constitute a mechanosensitive element but mediates force-dependent actin disassembly. Cofilin senses the conformational change of actin filaments induced by stretching tension (4) and immediately begins severing these after the applied tension is released (2).
Formin family proteins (formins) are also thought to be mechanosensitive regulators of actin polymerization dynamics (5). Formins are bound to the polymerizing (barbed-) end of actin filaments and remain attached with a “processive capping” capability (6). External pulling force on individual actin filaments transmitted as stretching tension to the formin-bound barbed end should thus modify the actin filament polymerization dynamics. The effects of stretching tension have been experimentally confirmed in vitro (7, 8); however, several questions remain. The actin polymerization rate at the formin-bound barbed end is strongly affected by another actin binding protein, profilin (9, 10). It was reported that the elongation rates on both yeast formin Bni1p and mammalian formin mDia1 were accelerated up to twofold by several-piconewton stretching tension in the presence of profilin (7, 8). Conversely, Courtemanche et al. (7) reported that in the absence of profilin, stretching tension inhibited Bni1p-mediated actin filament elongation, whereas Jégou et al. (8) did not show any experimental data under this condition. Accordingly, it remains unclear whether the inhibitory effect of stretching tension in the absence of profilin is common among formin family proteins. Furthermore, the previous models explaining the force-sensing mechanism were constructed without considering the effects of profilin (5, 8).
Here, to investigate the effects of profilin on mDia1-mediated actin polymerization, we analyzed the mechanical response of the actin polymerization dynamics of individual filaments as regulated by formin mDia1, focusing on profilin concentration. Furthermore, we examined actin polymerization by mDia1, using ADP-G-actin, because most prior experiments regarding the mechanical response of formins utilized ATP-G-actin (7, 8).
Materials and Methods
Protein preparations
A nucleotide sequence encoding the 650-aa mammalian homolog of diaphanous-1 (mDia1), including FH1 and FH2 (residues 543–1192), was expressed using a bacterial cell system, as an N-terminally GST-tagged fusion protein and purified. The truncated mDia1 (650 aa), previously designated as “mDia1ΔN3” (6, 11), was here termed “mDia1”. Profilin I was expressed by the bacterial cell system and purified using poly-L-proline sepharose (12, 13). G-actin was purified from acetone powder prepared from rabbit skeletal muscle (14). Further details of protein preparations are provided in the Supporting Materials and Methods.
Microscopy
We used an inverted microscope (IX71; Olympus, Tokyo, Japan) equipped with dual-trap-optical tweezers and capable of simultaneous phase contrast and fluorescent image examination, as we reported previously (4, 15). Green (532 nm) and red (633 nm) lasers were used for excitation. Phase contrast and fluorescent images monitored in real time were used for actin dumbbell construction.
In this study, a microscope port was also connected to a high-speed digital camera (model No. BOBCAT ICL-B0620M; Imperx, Boca Raton, FL). After actin dumbbell construction, the phase contrast images of beads were projected to the high-speed camera and recorded on a computer, using the software LabVIEW (National Instruments, Austin, TX) via a CameraLink PCI Express card (model No. NI PCIe-1427; National Instruments). Size within microscopic images was determined by an objective micrometer (10 μm, Olympus). Optical tweezer stiffness was determined by displacement of a bead from a trap center against the viscous drag of water, where the stage was moved at a constant speed as the beads were trapped with the fixed trap center (F = 6πηrv, where η, r, and v represent viscous drag, bead radius, and stage movement speed, respectively) (16).
Single-trap experiment
A flow cell (∼18 μL) was constructed with two coverslips (24 × 60 mm2 and 18 × 18 mm2; Matsunami, Osaka, Japan). First, one cell volume of 10 mg/mL BSA in Basic buffer (50 mM KCl, 10 mM imidazole-HCl pH 7.4, 1 mM MgCl2, 1 mM EGTA, and 50 μM CaCl2) was injected into the flow cell and incubated for ∼15 min to coat the surface with BSA. Simultaneously, 1 μL rhodamine-phalloidin-labeled actin filament (2.4 μM, 10% biotinylated) was placed in a microtube (0.2 mL), fragmented by sonication for ∼5 s, mixed with 10 μL mDia1 beads, and incubated at room temperature for 10 min in the dark to attach the barbed end of the fragmented fluorescent actin filaments to mDia1 on the bead surface.
For experiments with ATP-actin, 1 μL mDia1 beads and 1 μL avidin beads (diluted 50-fold with Basic buffer) were added to 97 μL Basic buffer containing 10 mM DTT, 1 mM ATP, and an oxygen-scavenging system (0.22 mg/mL glucose oxidase, 0.036 mg/mL catalase, and 4.5 mg/mL glucose). Just before examination under the microscope, the beads were rapidly mixed with 1 μL G-actin (various concentrations) and the mixture was promptly injected into the flow cell because actin polymerization was immediately initiated in solution upon G-actin addition to the mDia1 beads. For experiments with ADP-actin, the assay conditions were changed to 10 mM imidazole-HCl pH 7.4, 50 mM KCl, 1 mM EGTA, 1 mM MgCl2, 50 μM CaCl2, 1 mM ADP, 10 mM DTT, 5 mM glucose, 15 U/mL hexokinase, 25 μM Ap5A, and the oxygen-scavenging system.
A biotinylated and fluorescently labeled short actin filament, which had been bound to the mDia1 bead via its barbed end in advance, became the tip of the actin filament elongating from the mDia1 bead after the initiation of actin polymerization. Then, the tip was attached to the avidin bead by manipulating the mDia1 and avidin beads, using optical tweezers. The connection of two beads via an actin filament was confirmed by shifting one trap center and monitoring the other bead being pulled. After the actin dumbbell formation, the stage height was adjusted to ∼5 μm from the glass surface, using a piezo actuator (Physik Instrumente, Karlsruhe, Germany). Then, the stage was horizontally moved at a constant speed (15 μm/s), using a stepping motor (Sigmakoki, Tokyo, Japan), in the direction parallel to the actin dumbbell and toward the mDia1 bead, followed by release of the mDia1 bead whereas the avidin bead remained trapped. Owing to solvent flow, a tensile force was applied to the actin filament; however, this force was low and had minimal effects on the polymerization rate, as shown in the Results. Phase contrast images of the beads were recorded at 30 frames per second, with simultaneous monitoring of the centroid of the intensity profile of the trapped avidin bead in real time. During horizontal stage movement, stage height was maintained by continuous adjustment of the piezo actuator to maintain the center of the avidin bead in a constant position. Temperature was adjusted to 26 ± 1°C. Experiments for each condition were performed with more than three actin dumbbells to calculate the mean elongation rates (±SDs), with at least two independently prepared samples of actin and mDia1 beads for each measurement.
The recorded images were analyzed using a Particle Track and Analysis plug-in (developed by Yoshiyuki Arai, Osaka University, Osaka, Japan) in ImageJ software (National Institutes of Health, Bethesda, MD) to determine the positions of the two beads. The elongation rate of an individual actin dumbbell was calculated from the linear fitting of the time course of bead-to-bead distance. Note that when the rate of actin depolymerization was calculated (with excess profilin) in the single-trap experiments, the actin filament was polymerized beforehand to some extent to extend the bead-to-bead distance by means of the double-trap setup. The end of the actin filament labeled with rhodamine-phalloidin was not depolymerized by profilin, which enabled us to prepare the actin dumbbell under depolymerization conditions.
Owing to labeling with rhodamine-phalloidin, a small amount of this conjugate remained during microscopic examination; however, this amount was only ∼6 nM, one-third of which was estimated to be bound to actin filaments. Although the affinity of rhodamine-phalloidin for F-actin is high, its association rate at nanomolar concentrations is very low (dissociation equilibrium constant: 17 nM; association rate constant: 2.8 × 10⁴ M−1 s−1; dissociation rate constant: 4.8 × 10⁻⁴ s−1) (17), indicating that the remaining conjugate had almost no effect on the dynamics observed in our experiments. Notably, the fluorescence intensity of an actin filament between its fluorescent tip and the mDia1 bead did not increase during polymerization (Fig. S1 and Movie S1), showing that the probability of free rhodamine-phalloidin binding to the barbed end of the growing actin filament is negligibly low. In addition, a small amount (≤4 nM) of ATP was carried over into the microscopic analysis because fluorescently labeled actin filaments were prepared with ATP-actin. The remaining ATP had been removed in experiments with ADP-actin because the fluorescently labeled actin was incubated in assay buffer including hexokinase and Ap5A before mixing with ADP-G-actin (for details, see Supporting Materials and Methods).
Double-trap experiment
The actin dumbbell was constructed as in the single-trap experiment. To apply a tensile force, the trap center of the mDia1 bead was shifted such that the distance between the two trap centers was increased. However, after this extension, both beads started to return to the respective trap centers owing to actin polymerization, which caused relaxation of the tension applied to the actin filament. To apply a constant tensile force, the tensile force, which was calculated from displacement of the avidin bead from its trap center, was monitored in real time and the mDia1 bead trap center was moved away from the avidin bead step by step when the tensile force decreased. This maintained the tensile force in approximately constant ranges, as strong (3.5–5.5), moderate (2.0–3.5), and weak (1.0–2.0 pN) forces (Fig. S2). Throughout our study, data on the strong force were mainly used for comparison with those in the single-trap experiments, whereas double-trap experiments with moderate and weak forces were performed to assess the elongation rate versus various forces at limited actin or profilin concentrations.
The elongation rate was estimated by linear fitting of the bead-to-bead distance time course; however, in contrast to the single-trap experiment, elongation of this distance could include a displacement owing to bead rotation, behaving as a nonlinear spring (18). Hence, discontinuous plots of the bead-to-bead distance at the same force (in the range of 4.0–4.2 pN; Fig. S2, magenta plots) during many pull-and-relaxation cycles (≥3) were collected and linearly fitted to cancel out the displacement that arose from bead rotation (Fig. S3). Namely, the beads were rotated by repositioning the trap center, then the beads were rotated in the opposite direction by relaxation during filament elongation, so that the instantaneous change of bead-to-bead distance just after the stretching of actin dumbbells canceled out. For experiments with moderate or weak force, the time courses of the bead-to-bead distance in the ranges of 2.9–3.1 pN (Fig. S2, cyan plots) and 1.4–1.6 pN (Fig. S2, orange plots), respectively, were linearly fitted. The elongation rate was thus estimated by means of the discontinuous plots (colored plots, Fig. S2), whereas the corresponding tensile force was assumed to be an average of all continuous plots (black plots, Fig. S2) throughout the period analyzed.
To conduct double-trap after single-trap experiments using the same actin dumbbell, we had to instantly shift the stage height (along the z-axis direction) to catch the mDia1 bead by the other laser trap. The stage height was restored by adjusting the center of avidin bead to the original position. Experiments for each condition were performed with ≥3 actin dumbbells to calculate the mean and SD of elongation rates using at least two independently prepared actin and mDia1 bead samples.
Results
Single-molecule strategy to measure force-dependent acceleration of actin polymerization
The actin dumbbell method was applied to measure the length of polymerizing actin filaments under force. Both ends of individual actin filament were attached to plastic beads, which were trapped with optical tweezers (Fig. 1 A) (4). Truncated mDia1 molecules composed of formin homology domain one (FH1) and two (FH2) of mDia1 (lacking autoinhibitory domains but maintaining a processive capping activity) were immobilized on one of two beads via the interaction between the GST-tag at the N-terminus of mDia1 and the glutathione-coated bead surface. Biotinylated and fluorescently labeled short actin filaments became the tip of the polymerizing actin filament (pointed-end region) during polymerization in the unlabeled G-actin solution (Fig. S1; Movie S1). The pointed-end region was attached to the other bead via the biotin-avidin interaction to form an elongating actin dumbbell. Tension was applied (Fig. 1, B–D) by trapping one bead and moving the microscope stage at a constant rate (single-trap experiment) (15). Here, the tensile force estimated from the viscous drag mainly applied on the free bead was small; i.e., only 0.13 pN at an ∼15 μm/s flow rate (Fig. 1 B, right). Alternatively, tension was applied in the double-trap experiment by trapping and manipulating both beads with optical tweezers, wherein the avidin bead was fixed to measure the applied force and the mDia1 bead was manually moved away to maintain nearly constant tension on the actin filament (Fig. S2; Fig. 1 B, left). The elongation rate was estimated by the time course of bead-to-bead distance. The mDia1 bead displacement reflects the barbed-end polymerization dynamics, because mDia1 moves via the processive capping activity (6) when the actin subunits associate with or dissociate from the barbed end. On the other hand, the pointed-end region of the actin filament bound to the avidin bead was stabilized by rhodamine-phalloidin. Hence, the bead-to-bead distance time course directly reflects the barbed end dynamics.
Figure 1.

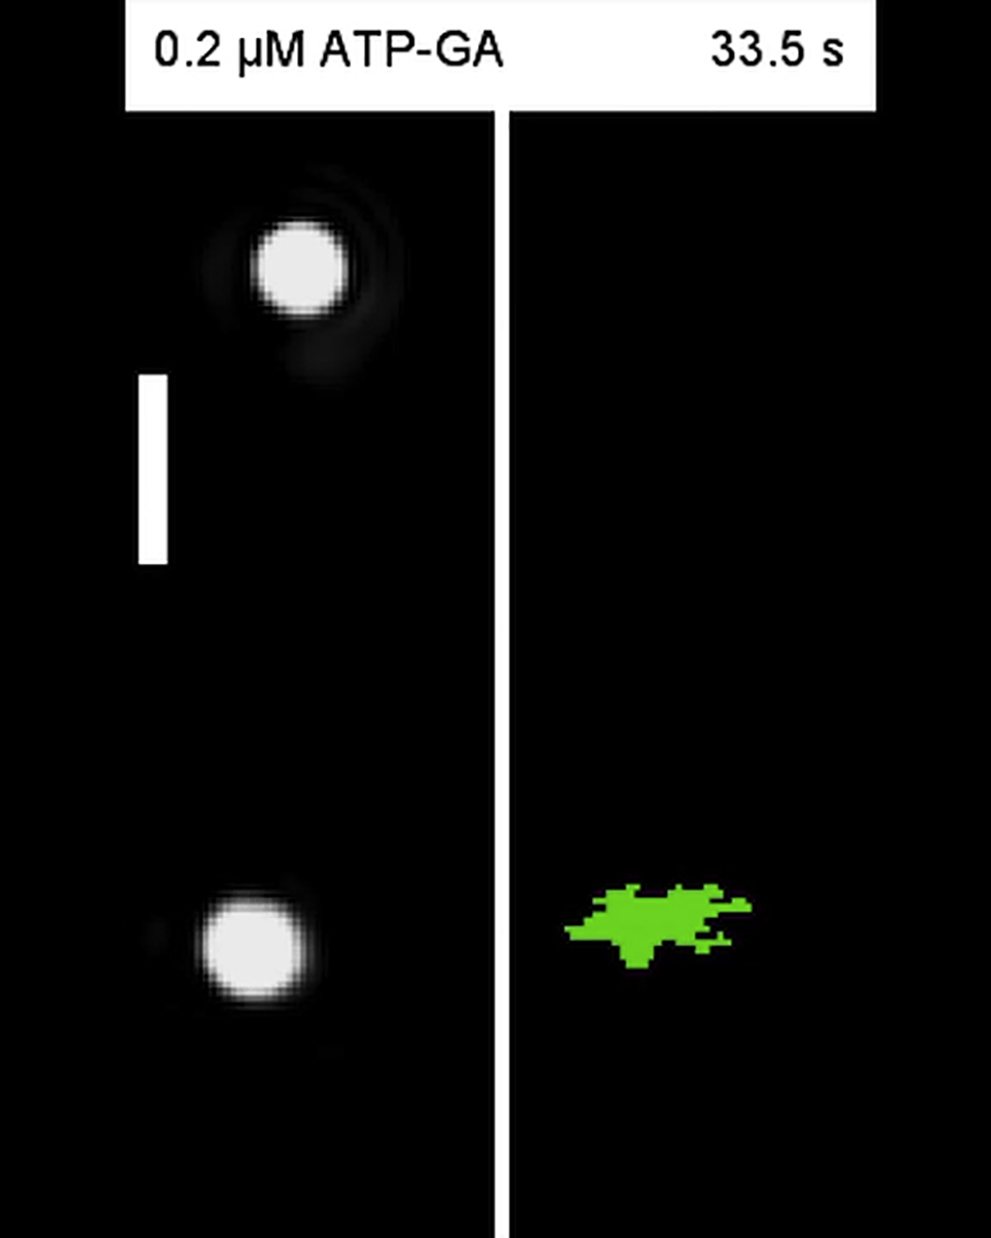
Single-molecule method for observing mDia1-mediated actin polymerization. (A) Shown here is a schematic of the actin dumbbell. The gray ball represents the truncated mDia1-bound bead. Because G-actin is present in solution (small spheres), an actin filament elongates toward the bead (gray), to which an actin filament barbed end is attached via mDia1. (B) Shown here is a schematic of single- and double-trap experiments. In the double-trap experiment (left), the distance between the two trap centers is extended to generate higher tensile force (up to ∼5.5 pN), whereas in the single-trap experiment (right) the avidin bead (orange) is trapped whereas the mDia1 bead is free. (C) Shown here is kymography of the phase-contrast images of two beads. The time course of the two beads on the straight line across their centers (left image, yellow line) is shown. Double-trap experiments were performed until 12 s (blue line), when the mDia1 bead was released and stage movement was begun. Data were collected for 0.2 μM ATP-G-actin. (D) Shown here is the time course of upper bead displacement from the trap center and the bead-to-bead distance (from (C)). Tensile force was estimated by converting the upper (avidin) bead displacement from the trap center (right axis). The instantaneous change of bead-to-bead distance (arrowheads) arose from the rotation, which occurred just after repositioning the trap center, as shown in Fig. S3. To see this figure in color, go online.
Force-dependent acceleration of actin polymerization without profilin
First, we measured the effects of tension on the actin filament elongation rates at various ATP- and ADP-G-actin concentrations in the absence of profilin (Fig. 2, A and B). Under low tension (single-trap experiments; ∼0.13 pN), the elongation rate linearly increased with increasing G-actin concentration (Fig. 3, A and B), consistent with the nature of actin polymerization. The average elongation rate under tensile force (3.5–5.5 pN; average ∼4 pN) also correlated linearly with G-actin concentration (Fig. 3, A and B). Tension-mediated elongation accelerated slightly on ATP-G-actin (Fig. 3 A; Movie S2) but markedly on ADP-G-actin (Fig. 3 B; Movie S3). The effect of tension suggested that the elongation acceleration primarily resulted from the tension-dependent increase of the G-actin association rate with the barbed end (slope, Fig. 3, A and B).
Figure 2.

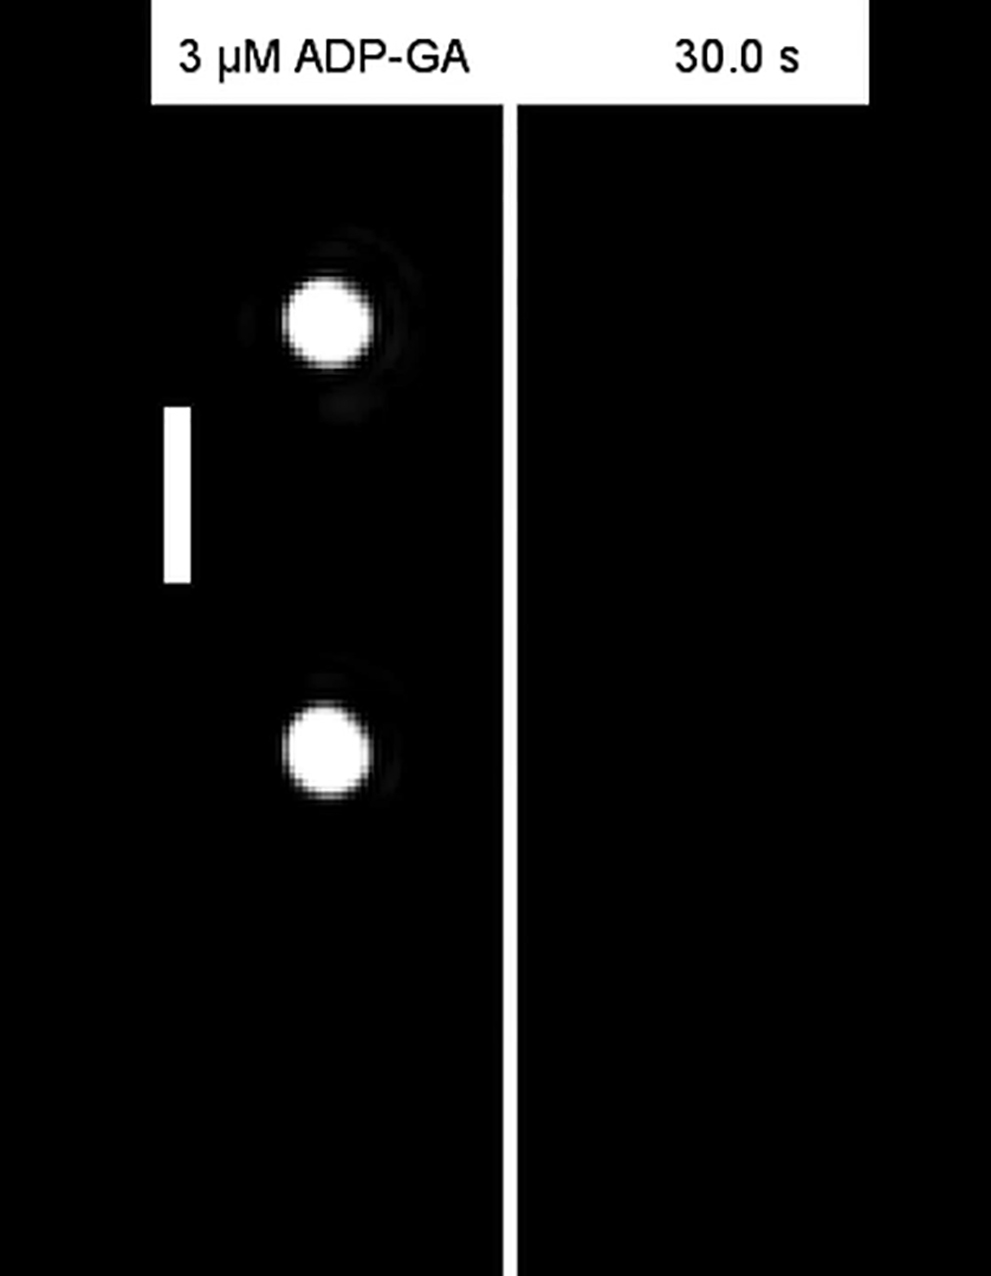
Time course of actin filament elongation in the absence of profilin. (A) Shown here is kymography of the phase contrast images of beads at various G-actin concentrations. The single and double trap experiments shown at each condition were obtained from the same actin dumbbell. (B) Given here are time courses of the bead-to-bead distance. Gray and colored lines indicate traces from single- (∼0.13 pN) and double-trap experiments (3.5–5.5 pN), respectively. The average elongation rate (subunits/s) is shown. To see this figure in color, go online.
Figure 3.

Force-dependence of actin polymerization in the absence of profilin. (A and B) Given here are elongation rates under various ATP-G-actin (A) and ADP-G-actin (B) concentrations. Open and solid symbols represent mean elongation rates in low-tension single- and high-tension double-trap experiments, respectively. The numbers of actin dumbbells examined were as follows: 3, 4, 20, 6, 10, 6, 9, and 9 (single-trap) and 3, 11, 4, 4, and 3 (double-trap) from lower to higher ATP-G-actin concentration; and 5, 5, 6, 6, and 5 (single-trap) and 5, 14, 4, 3, and 5 (double-trap) from lower to higher ADP-G-actin concentration. Low and high-tension plots were globally fitted with Eq. 1 using corresponding tensile forces: 0.13 pN for low-tension experiments (estimated from the viscous drag), and the mean tensile forces 4.3 (ATP-G-actin) or 4.2 pN (ADP-G-actin) for high tension experiments (measured from the avidin bead displacement). Note that the curve with Eq. 2′ is identical to that of Eq. 1 because these two equations are essentially the same, except that the p0c in Eq. 1 is replaced with p0depoly in Eq. 2′. Error bars indicate mean ± SD. The optimal fitting curve values are shown in Table 1. (C and D) Given here is the force dependence of the elongation rate at specific G-actin concentrations: 0.5 μM ATP-G-actin (C) and 3 μM ADP-G-actin (D). Double-trap experiments (solid symbols) were performed at various tensile force ranges (including other than 3.5–5.5 pN). Each plot is from individual actin dumbbells. Parts of these data (3.5–5.5 pN) are included in the plots of (A) and (B). Single-trap experimental data (open symbols) are also shown. Computed curves are shown, constructed by Eq. 1 with values obtained by fitting in (A) and (B); (Table 1). Horizontal error bars indicate mean ± SD of the tensile force during measurement. (E and F) Given here is the force dependence of the open state probability. The open state probability in the stair-stepping model, described as 1 – p0cexp(−fd/kBT), was computed using the values obtained by fitting in (A) and (B) (Table 1). To see this figure in color, go online.
In previous studies, two models explaining formin-mediated actin polymerization—the stair-stepping model and the stepping second model—were proposed (reviewed in (19)). Thus we applied these two models to our experimental results to explain the effect of stretching tension (Fig. 4, A and B) with the assumption of force-dependent property. On the basis of a previous report describing force-dependent elongation (8), both of our models assume that the FH2 dimer translocation is tightly coupled with actin polymerization/depolymerization (i.e., processive capping). In addition, although the stepping second model includes the process of FH2 dimer dissociation from the barbed end (19), we assume that this process is negligible because the detachment frequency was very low during the observation period. Actin filaments usually elongated submicrons to several microns long, which corresponds to the addition of hundreds to thousands of G-actin molecules to the formin-bound barbed end. The low dissociation probability was also reported by the previous study on Bni1p (on the order of once per 20,000 G-actin additions (20)).
Figure 4.

Reaction schemes including force-dependent processes. (A) Given here are simplified schemes for stair-stepping and stepping second models. The polymerization or depolymerization processes of two actin subunits (shown as n − 1 to n + 1) are shown. The processes in rapid equilibrium are shown by broken arrows. The parts corresponding to FH2 dimer-half translocation are surrounded by a rectangle. C, closed state; O, open state. In the stepping second model, the two types of open state, polymerizable and depolymerizable, are shown as O and O∗, respectively. GA, G-actin. (B) Shown here is a schematic illustration of the reaction scheme parts corresponding to FH2 dimer-half translocation. White spheres are actin molecules; magenta/gray rectangles are FH2 dimer halves. Front (magenta) rectangle translocation corresponds to FH2 dimer transition from open to closed states (stair-stepping model) or depolymerizable to polymerizable open states (stepping second model). We assumed that the FH2 dimer half moves over the distance (5.5 nm) during the closed-to-open state transition. Although the FH2 dimer often dissociates from the barbed end during the FH2-half translocation in the stepping second model (19), the dissociation process is not included for simplification. To see this figure in color, go online.
Note that the actin dumbbells were often broken at extremely high tensions (>∼6 pN), owing to the loss of connection between the two beads. However, it was difficult to determine whether the breakage was due to the detachment of formin from the barbed end, severing of the actin filament, or detachment of formin from the bead. Therefore, in this study, we discuss the force-dependent elongation dynamics in conditions where actin dumbbells were highly stable (<∼6 pN).
Stair-stepping model
The stair-stepping model assumes that FH2 dimer bound to the actin filament barbed end has two conformational states, open and closed, derived from the crystal structures (21). The model also assumes that these states are in rapid equilibrium (19) and that G-actin can associate with the barbed end only during the open state and dissociate only during the closed state (19) (Fig. 4, A and B, left). If we assume that the closed state probability decreases by stretching tension applied to the translocating FH2 dimer half (f), the elongation rate velong as a function of f and G-actin concentration (CA), which is obtained by the subtraction of polymerization rate vpoly by depolymerization rate vdepoly, can be expressed using transition state theory (22) as
| (1) |
where kB, T, and pc0 represent the Boltzmann constant, absolute temperature, and probability of the closed state for the entire duration in the absence of an external force. The rate constants kon and koff indicate the G-actin association with, and dissociation from, the formin-bound actin filament barbed end, respectively (but not actin polymerization and depolymerization rates without formin). The probability of the closed state (pc) was changed by the external force as pc = pc0exp(−fd/kBT). The distance (5.5 nm) over which the FH2 dimer-half moves during the closed- to open-state transition was the working distance (d), and the stretching tension measured experimentally was assumed to be applied to the translocating FH2 dimer-half.
Stepping second model
The stepping second model also assumes that the FH2 dimer has open and closed states in rapid equilibrium; however, the definition of these states differs from the stair-stepping model. The closed to open state transition does not correspond to the FH2 dimer translocation along the actin filament (19), but to the stretching of flexible linkers between two FH2 dimer halves. The open state probability (po) was termed the “gating factor,” whose value depends on the isoform of formins, and the model assumes that both polymerization and depolymerization occur when the FH2 dimer is in the open state (19, 23). In addition, this model hypothesizes that actin polymerization and depolymerization, respectively, correspond to before and after FH2 dimer translocation when the FH2 dimer is in the open state. Because translocation is known as the non-rate-limiting step, the pre- and posttranslocated states can also be assumed to be in rapid equilibrium (23), in addition to between the open and closed states (Fig. 4, A and B, right). Accordingly, the elongation rate can be expressed as
| (2) |
where po and p0depoly are, respectively, the gating factor and the depolymerizable state probability for open state in the absence of force. We also assume that po depends on the applied tension to maintain equation generality, and the depolymerizable state probability for the open state is decreased by the application of stretching tension. Although Eq. 2 originally differs from Eq. 1, these equations are identical for mDia1-mediated actin polymerization when po = 1 (previously reported value for mDia1 (23)) is applied and is assumed not to be decreased by force:
| (2′) |
Accordingly, we analyzed the experimental data using Eq. 1. Plots of the elongation rate against G-actin concentrations (Fig. 3, A and B) were globally fitted with Eq. 1 with optimal parameter values (Table 1). The applied force was estimated from the viscous drag (0.13 pN for low-tension single-trap experiment) or measured from avidin bead displacement (4.3 pN for ATP-G-actin and 4.2 pN for ADP-G-actin, the averaged value of all actin dumbbells, for the high-tension double-trap experiment). Although the response of actin filament elongation differed between ATP-G-actin and ADP-G-actin, the difference is quantitatively explained by the single equation (Eq. 1). We can refer to the optimal value for p0c as for p0depoly when the stepping second model is considered. Note that the previous report assumed that the mDia1 gating factor was 0.5 for ADP-G-actin based on elongation rate ratio with and without mDia1 (23), whereas our experimental data could be reproduced by po = 1 with optimal p0depoly value instead of assuming po = 0.5.
Table 1.
Summary of Optimal Kinetic Values Obtained in the Absence of Profilin by Fitting with Eq. 1
| ATP | ADP | |
|---|---|---|
| kon (μM−1 s−1) | 21 ± 0.40 | 3.6 ± 0.04 |
| koff (s−1) | 1.3 ± 1.1 | 3.9 ± 1.3 |
| P0c (p0depoly) | 0.29 ± 0.04 | 0.61 ± 0.04 |
Values were obtained by global fit of the low- and high-tension experiment elongation rates shown in Fig. 3, A and B, with Eqs. 1 and 2′, and the values correspond to the fitting curves (straight lines) in these figures. Fitting was performed using the software Origin (OriginLab, Northampton, MA). Values given are mean ± SE.
We measured the elongation rate at various stretching tensions using double-trap experiments at specific G-actin concentrations (Fig. S2). The relationship between the amount of force and the elongation rate (Fig. 3, C and D) was also well reproduced by Eq. 1 with the values obtained by global fit in Fig. 3, A and B (Table 1). Using the globally fitted optimal p0c values (Table 1), we computed the force dependency of the open state probability in the stair-stepping model described as 1 – pc = 1 – p0cexp(−fd/kBT), which is a part of Eq. 1 (Fig. 3, E and F). The results suggest that the FH2 dimer is most often in the open state (or the polymerizable open state for the stepping second model) under several piconewton stretching tension (>∼3 pN).
Mechanically regulated biphasic effects of profilin on actin polymerization
As previously reported in the literature (10, 23, 24, 25), profilin biphasically affects formin-mediated actin polymerization irrespective of mechanical force. That is, appropriate profilin concentrations accelerate elongation from the formin-bound barbed end, whereas excessive profilin represses actin polymerization. In fact, excess profilin switches the actin filament dynamics from elongation to depolymerization. Here, we examined the mechanical response of actin polymerization mediated by mDia1, focusing on the biphasic effects of profilin. With 0.2 μM ATP-G-actin (Fig. 5, A and B), the low tension single-trap experiments reproduced these effects (Fig. 6 A, open squares). During repression by excess profilin (4–6 μM), high tension markedly altered the elongation rate (Figs. 5, A and B and 6 A, solid squares; Movie S4), accelerating it to levels equivalent to those of optimal profilin concentrations (1–2 μM). We confirmed the reversibility of this effect by alternately performing single-trap (low tension) and double-trap (high tension) experiments (Fig. 6 C; Movie S4).
Figure 5.

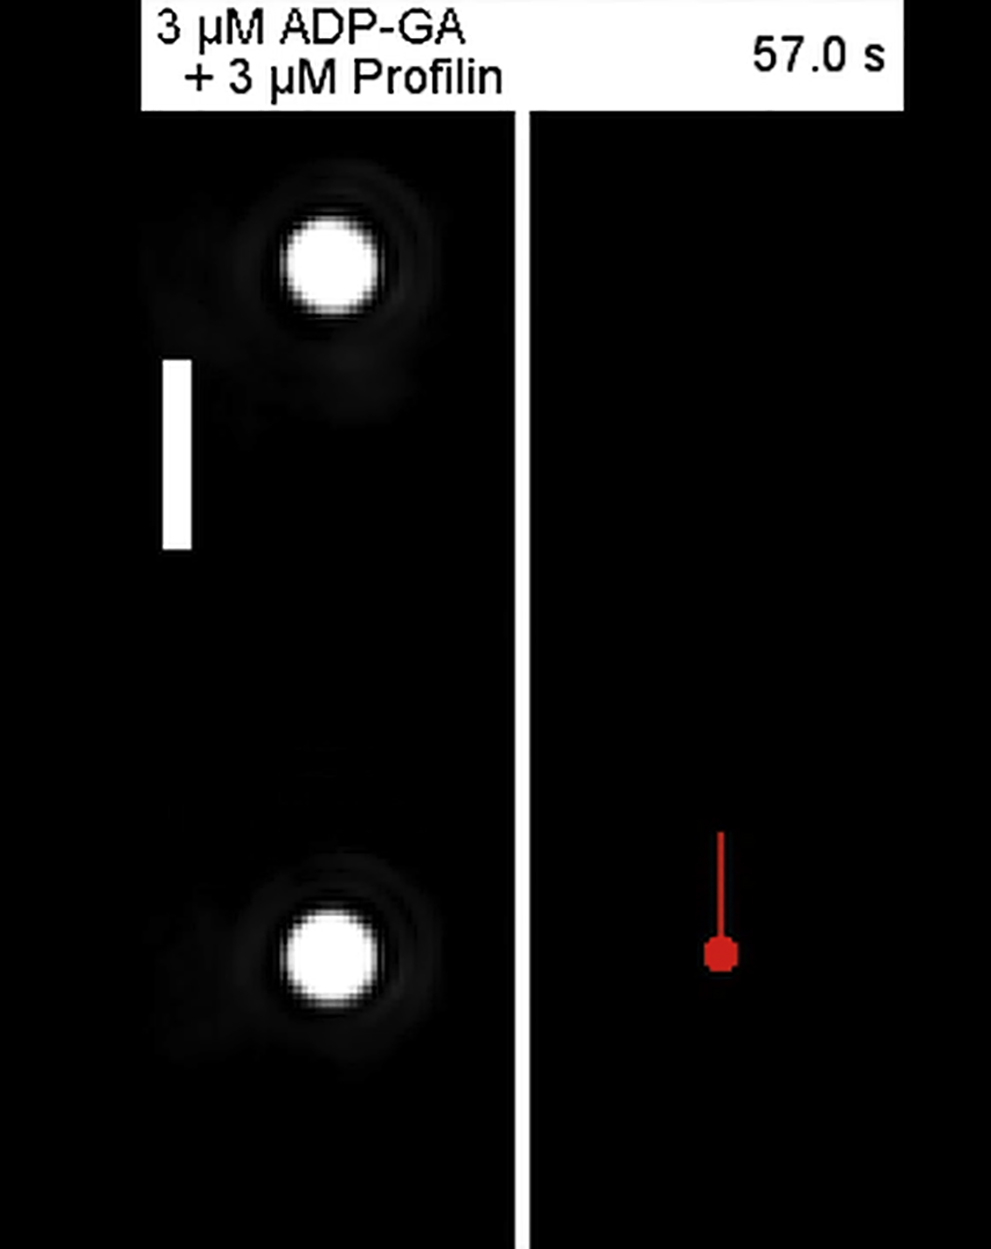
Time course of elongation of actin filaments in the presence of profilin. (A) Given here is kymography of the phase contrast images of beads at various profilin concentrations and constant G-actin concentration. The single- and double-trap experiments shown at each condition were obtained from the same actin dumbbell. (B) Given here are time courses of bead-to-bead distances. Gray and colored lines show single- (moving average) and double-trap experiments (3.5–5.5 pN), respectively, with the average elongation rate (subunits/s). To see this figure in color, go online.
Figure 6.

Involvement of profilin in force-dependent elongation of actin filaments. (A and B) Elongation rates are shown at various profilin concentrations with 0.2 μM ATP-G-actin (A) or 3 μM ADP-G-actin (B). Open and solid symbols represent single- and double-trap experiments, respectively: n = 20, 6, 11, 6, 17, 6, 8, 3, 9, 3, 11, 15, 6, and 6 (single-trap) and 11, 6, 12, 3, 5, 4, 7, 12, 5, and 10 (double-trap) for ATP-G-actin; 5, 4, 5, 3, 4, 3, and 17 (single-trap) and 14, 5, 7, 5, 19, 4, and 3 (double-trap) for ADP-G-actin, from lower to higher profilin concentration. Error bars indicate mean ± SD. Tensile force is 4.1 ± 0.28 (ATP-G-actin) and 4.1 ± 0.33 pN (ADP-G-actin) (mean ± SD). (C and D) Shown here is the reversibility of force-dependent actin filament elongation. The elongation rate force dependence observed upon excess profilin concentration is reversible. The actin filaments, which elongated very slowly, did not elongate, or depolymerized in the single-trap experiments (almost no tension), were shifted into the fast-elongation state by switching to the double-trap experiment (strong tensile force). Upon the mDia1 bead release, actin filament elongation returned to a very slow rate. (C) Shown here are 0.2 μM ATP-G-actin and 6 μM profilin. (D) Shown here are 3 μM ADP-G-actin and 3 μM profilin. To see this figure in color, go online.
In single-trap experiments on ADP-G-actin, profilin slightly accelerated actin filament elongation; however, equimolar profilin to ADP-G-actin ratios induced depolymerization (Figs. 5, A and B and 6 B, open squares). This trend was previously reported by Vavylonis et al. (23). In this study, we clarified that the effects of profilin on ADP-G-actin were obvious in the presence of several piconewton stretching tension (Fig. 6 B, solid squares; Movie S5). Notably, profilin had a potential to rapidly accelerate elongation with ADP-G-actin like that with ATP-G-actin, in contrast to previous studies with an absent (26) or small (23) profilin acceleration effect. Tension converted depolymerizing actin filaments to rapidly elongating filaments more dramatically than for ATP-G-actin. The depolymerization to rapid elongation switch was confirmed to be reversible (Fig. 6 D; Movie S5), as with ATP-G-actin and profilin.
Discussion
Here, we demonstrated several novel mechanical responses of mDia1 that affect the regulation of actin polymerization dynamics. First, we found that stretching tension enhanced actin filament elongation from mDia1 in the absence of profilin. This response is in contrast to the effect of force observed on Bni1p (7), where stretching tension inhibited elongation from Bni1p. We cannot fully explain this difference, although it might reflect different mechanical responses among formin family proteins.
Second, we found that the linear relationship between the elongation rates and the G-actin concentrations in the absence of profilin exhibited decreased critical concentration of polymerization with stretching tension (Fig. 3, A and B). This trend was more obvious for ADP-G-actin (Fig. 3 B) than for ATP-G-actin (Fig. 3 A). Thus, the results of this study experimentally confirmed the predicted force-dependent decrease in the critical concentration (5) and allowed the construction of a model in which stretching tension decreases the critical concentration via FH2 dimer translocation (Eqs. 1 and 2). The model by Jégou et al. (8), wherein the critical concentration was independent of stretching tension, thus could not reproduce our results. In contrast, our models Eqs. 1 and 2, which globally express force-dependent polymerization and depolymerization dynamics, successfully reproduced the experimental results. Although Courtemanche et al. (7) proposed that stretching tension affects the gating factor, it does not change the critical concentration. Therefore, it is more plausible that the probability of closed state in Eq. 1 (or depolymerizable state in Eq. 2) is assumed to be force dependent, as it can explain the force-dependent critical concentration decrease observed in our study.
Our notable result comprises the mechanical response in the presence of profilin, especially at high profilin concentrations. The effect of profilin on formin-mediated actin polymerization was known to be biphasic and the actin filament is in the depolymerization phase at high profilin concentrations (23, 25). This effect is interpreted as the sum of two antagonistic effects; i.e., polymerization and depolymerization at the same barbed end. We observed the biphasic effect in our single-trap experiments. Moreover, the dramatic acceleration of elongation by stretching tension is also explainable by the coordination of the biphasic effect, with accelerated polymerization but repressed depolymerization. Repressed depolymerization is consistent with prior experimental results (8), although these did not detect the net elongation rate switch from minus to plus as the experiments were done in the absence of free G-actin.
On the basis of these findings, we constructed a schematic illustration that explains the effects of stretching tension on the profilin-related processes (Fig. 7). In Fig. 7, association and dissociation of actin at the barbed end in the profilin-related processes occur after and before FH2 dimer translocation (Fig. 7, 3 [3′] and 4 [4′]), respectively, similarly to the profilin-independent processes (Fig. 7, 1 [1′] and 2 [2′]). Note that an important assumption regarding the flexible structure including the FH1 domain is included in our scheme. The acceleration of formin-mediated actin polymerization by profilin without mechanical force had been understood by the capture-and-delivery mechanism in which a flexible-looplike structure including the FH1 domain delivers the profilin-actin complex to the barbed end (23). The previous studies on stretching tension effects (7, 8), however, somewhat complicated the mechanism; although stretching tension applied to the flexible structure was expected to inhibit delivery by repressing flexibility, tension actually facilitated actin filament elongation in the presence of profilin (7, 8). Jégou et al. (8) suggested that part of the flexible structure including the FH1 domain necessary for capture and delivery remained accessible to the barbed end under the stretching tension, and FH2 dimer translocation was also induced. This geometric assumption was also adopted in our scheme but was not specifically drawn in Fig. 7 because the structural evidence remains insufficient (for details, see Fig. S4).
Figure 7.
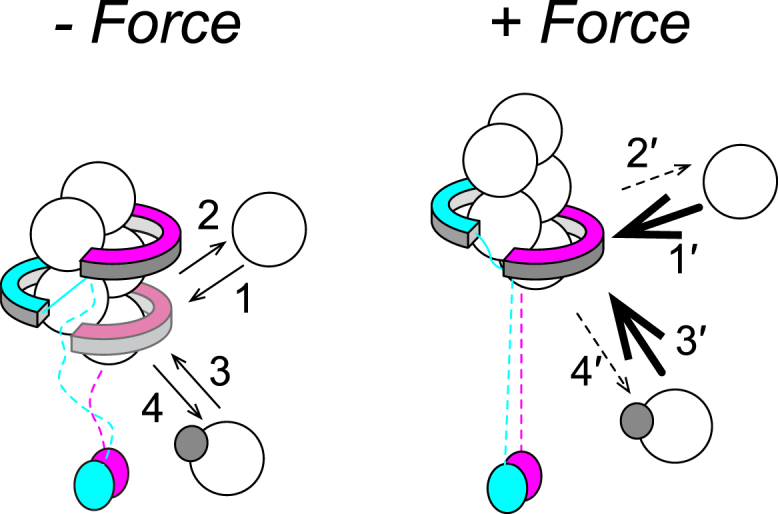
Molecular model of force-dependent actin filament regulation. The large white and small gray spheres represent actin molecules and profilins, respectively. Stretching force enhances FH2 dimer-half (magenta) translocation to increase the open state probability. Numbered steps show G-actin association to and dissociation from the barbed end, independent of (1 [1′] and 2 [2′]) and complexed with (3 [3′] and 4 [4′]) profilin, respectively. Notably, 3 [3′] (and 4 [4′]) include both FH1-dependent and independent processes. The capture-and-delivery mechanism of the profilin-actin complex between the flexible FH1 domain and the barbed end is assumed to remain functional under tension, but the FH1 domains are shown as broken lines because the structure has not yet been clarified (see Discussion). Under tension, steps 1 and 3 are accelerated, as shown by 1′ and 3′ (bold arrows), whereas steps 2 and 4 are repressed, as shown by 2′ and 4′ (broken arrows). To see this figure in color, go online.
Our experimental results also suggest that stretching tension regulates the profilin-dependent processes of depolymerization and polymerization in parallel via force-enhanced FH2 dimer translocation. Our data indicate that tension inhibited profilin-dependent actin depolymerization while retaining the acceleration effect of polymerization. Assuming that stretching tension does not completely inhibit the capture and delivery mechanism as previously suggested in Jégou et al. (8), the dissociation of actin subunits from the barbed end by profilin via the FH1 domain (capturing) would remain along with polymerization via FH1 domain delivery. Thus, actin depolymerization by profilin via the FH1 domain may be inhibited by FH2 dimer translocation, whereas the barbed end after FH2 translocation may accept the profilin-actin complex from the FH1 domain. Although we did not specifically depict the reaction pathways of profilin-dependent polymerization/depolymerization processes in Fig. 7 (3 [3′] and 4 [4′]), these may consist of both capture and delivery by the FH1 domain and direct interaction with the barbed end without the FH1 domain. The direct association of the profilin-actin complex with the barbed end and dissociation of actin subunit from the barbed end by the binding of free profilin might also be regulated by FH2 dimer translocation in the same manner as the capture and delivery process as discussed above. Collectively, FH2 dimer translocation regulates both polymerization and depolymerization processes mediated by profilin in a force-dependent manner, similar to their profilin-independent regulation.
Conclusion
These results indicate that the biphasic effect of profilin may be used to tune actin filament elongation rates in response to stretching tension. The degree of control by force is much higher than previously reported, as twofold acceleration of the polymerization rate (7, 8), suggesting that profilin together with formin plays an important role in force-induced actin cytoskeleton dynamic remodeling. Our findings provide further insight into the cellular function of profilin. Independent of formin, profilin facilitates actin polymerization through accelerating the exchange rate of nucleotides bound to G-actin from ADP to ATP; the slow rate of ADP release from ADP-G-actin in the absence of profilin (0.009 s−1 at physiological conditions) is accelerated >100-fold after profilin binding (27). Additionally, profilin may have another role in collaboration with mDia1, independent of G-actin-bound nucleotide exchange. Mediated by external force, mDia1 accelerates the elongation rate of 3 μM ADP-G-actin from 3.4 to 10.9 subs/s (Fig. 3 B, 3 μM ADP-G-actin; Fig. 6 B, 0 μM profilin). This is further amplified up to 40 subs/s by profilin at concentrations equivalent to that of ADP-G-actin (Fig. 6 B, 3 μM profilin), which is comparable to the 3 μM ATP-G-actin elongation rate (45 subs/s; an extrapolated value in Fig. 3 A). These findings may thus provide evidence for, to our knowledge, a novel role of profilin.
Author Contributions
H.K., M.M., K.K., and S.I. designed the experiments. H.K. performed the experiments and data analysis. H.K., M.M., and S.I. wrote the manuscript. M.M. and T.S. set up the microscope. T.O. prepared glutathione-conjugated BSA. All authors discussed the results.
Acknowledgments
We thank Y. Oguchi and H. Mizuno for helpful discussions and Y. Arai for providing the Particle Track and Analysis plug-in.
This work was supported by Grants-in-Aid for Specially Promoted Research grant 21000011, Scientific Research (S) grants 22227005 and 26221102, Young Scientists (B) grants 24740294 and 15K21444, Scientific Research on Innovative Areas grant 26115715, and Scientific Research (B) Generative Research Fields grant 16KT0077 from the Ministry of Education, Culture, Sports, Science, and Technology, Japan and a Waseda University Grant for Special Research Projects grants 2015B-295, 2015K-214, and 2016K-225.
Editor: Laurent Blanchoin.
Footnotes
Hiroaki Kubota’s present address is Department of Microbiology, Tokyo Metropolitan Institute of Public Health, Shinjuku-ku, Tokyo, Japan.
Taisaku Ogawa’s present address is Laboratory for Integrative Omics, RIKEN Quantitative Biology Center (QBiC), Suita, Osaka, Japan.
Deceased author: Kazuhiko Kinosita Jr.
Supporting Materials and Methods, four figures, and five movies are available at http://www.biophysj.org/biophysj/supplemental/S0006-3495(17)30662-8.
Contributor Information
Makito Miyazaki, Email: makito.miyazaki@aoni.waseda.jp.
Shin’ichi Ishiwata, Email: ishiwata@waseda.jp.
Supporting Citations
Reference (28) appears in the Supporting Material.
Supporting Material
The stage of the microscope was horizontally moved upward in the image whereas the mDia1 bead (the lower one) remained trapped. The object moving upward was the fragment of a fluorescently labeled short actin filament. The unlabeled actin filament bridged it with the mDia1 bead and elongated with time. The scale bar is 2 μm.
In each movie, phase contrast images of beads are shown on the left side, whereas the center of the lower bead calculated by means of the PTA plug-in from the software ImageJ is shown on the right side. Movement of beads during the single-trap experiment is shown as green tracks, whereas that during the double-trap experiment (3.5–5.5 pN, measured by means of the displacement of the upper beads) is shown as red tracks. The difference between the starting points of single-trap and double-trap experiments (∼1 μm) can be attributed to the rotation of the bead due to a difference in the tensile force (18). The scale bar is 2 μm.
For color codes of tracks, see the legend to Movie S2. The scale bar is 2 μm.
For color codes of tracks, see the legend to Movie S2. The scale bar is 2 μm.
For color codes of tracks, see the legend to Movie S2. The scale bar is 2 μm.
References
- 1.del Rio A., Perez-Jimenez R., Sheetz M.P. Stretching single talin rod molecules activates vinculin binding. Science. 2009;323:638–641. doi: 10.1126/science.1162912. [DOI] [PMC free article] [PubMed] [Google Scholar]
- 2.Hayakawa K., Tatsumi H., Sokabe M. Actin filaments function as a tension sensor by tension-dependent binding of cofilin to the filament. J. Cell Biol. 2011;195:721–727. doi: 10.1083/jcb.201102039. [DOI] [PMC free article] [PubMed] [Google Scholar]
- 3.Buckley C.D., Tan J., Dunn A.R. Cell adhesion. The minimal cadherin-catenin complex binds to actin filaments under force. Science. 2014;346:1254211. doi: 10.1126/science.1254211. [DOI] [PMC free article] [PubMed] [Google Scholar]
- 4.Shimozawa T., Ishiwata S. Mechanical distortion of single actin filaments induced by external force: detection by fluorescence imaging. Biophys. J. 2009;96:1036–1044. doi: 10.1016/j.bpj.2008.09.056. [DOI] [PMC free article] [PubMed] [Google Scholar]
- 5.Kozlov M.M., Bershadsky A.D. Processive capping by formin suggests a force-driven mechanism of actin polymerization. J. Cell Biol. 2004;167:1011–1017. doi: 10.1083/jcb.200410017. [DOI] [PMC free article] [PubMed] [Google Scholar]
- 6.Higashida C., Miyoshi T., Watanabe N. Actin polymerization-driven molecular movement of mDia1 in living cells. Science. 2004;303:2007–2010. doi: 10.1126/science.1093923. [DOI] [PubMed] [Google Scholar]
- 7.Courtemanche N., Lee J.Y., Greene E.C. Tension modulates actin filament polymerization mediated by formin and profilin. Proc. Natl. Acad. Sci. USA. 2013;110:9752–9757. doi: 10.1073/pnas.1308257110. [DOI] [PMC free article] [PubMed] [Google Scholar]
- 8.Jégou A., Carlier M.F., Romet-Lemonne G. Formin mDia1 senses and generates mechanical forces on actin filaments. Nat. Commun. 2013;4:1883. doi: 10.1038/ncomms2888. [DOI] [PubMed] [Google Scholar]
- 9.Romero S., Le Clainche C., Carlier M.F. Formin is a processive motor that requires profilin to accelerate actin assembly and associated ATP hydrolysis. Cell. 2004;119:419–429. doi: 10.1016/j.cell.2004.09.039. [DOI] [PubMed] [Google Scholar]
- 10.Kovar D.R., Harris E.S., Pollard T.D. Control of the assembly of ATP- and ADP-actin by formins and profilin. Cell. 2006;124:423–435. doi: 10.1016/j.cell.2005.11.038. [DOI] [PubMed] [Google Scholar]
- 11.Mizuno H., Higashida C., Watanabe N. Rotational movement of the formin mDia1 along the double helical strand of an actin filament. Science. 2011;331:80–83. doi: 10.1126/science.1197692. [DOI] [PubMed] [Google Scholar]
- 12.Tuderman L., Kuutti E.R., Kivirikko K.I. An affinity-column procedure using poly(L-proline) for the purification of prolyl hydroxylase. Purification of the enzyme from chick embryos. Eur. J. Biochem. 1975;52:9–16. doi: 10.1111/j.1432-1033.1975.tb03967.x. [DOI] [PubMed] [Google Scholar]
- 13.Kaiser D.A., Goldschmidt-Clermont P.J., Pollard T.D. Characterization of renatured profilin purified by urea elution from poly-L-proline agarose columns. Cell Motil. Cytoskeleton. 1989;14:251–262. doi: 10.1002/cm.970140211. [DOI] [PubMed] [Google Scholar]
- 14.Kondo H., Ishiwata S. Uni-directional growth of F-actin. J. Biochem. 1976;79:159–171. doi: 10.1093/oxfordjournals.jbchem.a131043. [DOI] [PubMed] [Google Scholar]
- 15.Oguchi Y., Uchimura S., Ishiwata S. The bidirectional depolymerizer MCAK generates force by disassembling both microtubule ends. Nat. Cell Biol. 2011;13:846–852. doi: 10.1038/ncb2256. [DOI] [PubMed] [Google Scholar]
- 16.Nishizaka T., Miyata H., Kinosita K., Jr. Unbinding force of a single motor molecule of muscle measured using optical tweezers. Nature. 1995;377:251–254. doi: 10.1038/377251a0. [DOI] [PubMed] [Google Scholar]
- 17.De La Cruz E.M., Pollard T.D. Transient kinetic analysis of rhodamine phalloidin binding to actin filaments. Biochemistry. 1994;33:14387–14392. doi: 10.1021/bi00252a003. [DOI] [PubMed] [Google Scholar]
- 18.Dupuis D.E., Guilford W.H., Warshaw D.M. Actin filament mechanics in the laser trap. J. Muscle Res. Cell Motil. 1997;18:17–30. doi: 10.1023/a:1018672631256. [DOI] [PubMed] [Google Scholar]
- 19.Paul A.S., Pollard T.D. Review of the mechanism of processive actin filament elongation by formins. Cell Motil. Cytoskeleton. 2009;66:606–617. doi: 10.1002/cm.20379. [DOI] [PMC free article] [PubMed] [Google Scholar]
- 20.Paul A.S., Pollard T.D. The role of the FH1 domain and profilin in formin-mediated actin-filament elongation and nucleation. Curr. Biol. 2008;18:9–19. doi: 10.1016/j.cub.2007.11.062. [DOI] [PMC free article] [PubMed] [Google Scholar]
- 21.Otomo T., Tomchick D.R., Rosen M.K. Structural basis of actin filament nucleation and processive capping by a formin homology 2 domain. Nature. 2005;433:488–494. doi: 10.1038/nature03251. [DOI] [PubMed] [Google Scholar]
- 22.Bell G.I. Models for the specific adhesion of cells to cells. Science. 1978;200:618–627. doi: 10.1126/science.347575. [DOI] [PubMed] [Google Scholar]
- 23.Vavylonis D., Kovar D.R., Pollard T.D. Model of formin-associated actin filament elongation. Mol. Cell. 2006;21:455–466. doi: 10.1016/j.molcel.2006.01.016. [DOI] [PMC free article] [PubMed] [Google Scholar]
- 24.Courtemanche N., Pollard T.D. Determinants of formin homology 1 (FH1) domain function in actin filament elongation by formins. J. Biol. Chem. 2012;287:7812–7820. doi: 10.1074/jbc.M111.322958. [DOI] [PMC free article] [PubMed] [Google Scholar]
- 25.Pernier J., Shekhar S., Carlier M.F. Profilin interaction with actin filament barbed end controls dynamic instability, capping, branching, and motility. Dev. Cell. 2016;36:201–214. doi: 10.1016/j.devcel.2015.12.024. [DOI] [PMC free article] [PubMed] [Google Scholar]
- 26.Romero S., Didry D., Carlier M.F. How ATP hydrolysis controls filament assembly from profilin-actin: implication for formin processivity. J. Biol. Chem. 2007;282:8435–8445. doi: 10.1074/jbc.M609886200. [DOI] [PubMed] [Google Scholar]
- 27.Selden L.A., Kinosian H.J., Gershman L.C. Impact of profilin on actin-bound nucleotide exchange and actin polymerization dynamics. Biochemistry. 1999;38:2769–2778. doi: 10.1021/bi981543c. [DOI] [PubMed] [Google Scholar]
- 28.Uemura S., Higuchi H., Ishiwata S. Mechanochemical coupling of two substeps in a single myosin V motor. Nat. Struct. Mol. Biol. 2004;11:877–883. doi: 10.1038/nsmb806. [DOI] [PubMed] [Google Scholar]
Associated Data
This section collects any data citations, data availability statements, or supplementary materials included in this article.
Supplementary Materials
The stage of the microscope was horizontally moved upward in the image whereas the mDia1 bead (the lower one) remained trapped. The object moving upward was the fragment of a fluorescently labeled short actin filament. The unlabeled actin filament bridged it with the mDia1 bead and elongated with time. The scale bar is 2 μm.
In each movie, phase contrast images of beads are shown on the left side, whereas the center of the lower bead calculated by means of the PTA plug-in from the software ImageJ is shown on the right side. Movement of beads during the single-trap experiment is shown as green tracks, whereas that during the double-trap experiment (3.5–5.5 pN, measured by means of the displacement of the upper beads) is shown as red tracks. The difference between the starting points of single-trap and double-trap experiments (∼1 μm) can be attributed to the rotation of the bead due to a difference in the tensile force (18). The scale bar is 2 μm.
For color codes of tracks, see the legend to Movie S2. The scale bar is 2 μm.
For color codes of tracks, see the legend to Movie S2. The scale bar is 2 μm.
For color codes of tracks, see the legend to Movie S2. The scale bar is 2 μm.