Abstract
Introduction
The most widely used instrument to measure perceived exertion or exercise intensity is the Borg’s Rating of Perceived Exertion (RPE) Scale. Panic attacks are aversive experiences that may be triggered by bodily sensations such as palpitations, breathlessness or dizziness due to increasing autonomic distress, prior sensitisation to panic and fear conditioning. The consequence is catastrophic interpretation of bodily sensations of arousal in general, which can lead to misinterpretation of exertion or exercise intensity.
Purpose
To verify the effectiveness of the Borg’s RPE Scale as a measure of perceived effort in panic disorder subjects.
Methods
The study enrolled 72 subjects: the control group (C, healthy sedentary subjects, n=30) and patients with panic disorder (PD, n=42). All subjects were submitted to an ergospirometry challenge. Perceived exertion RPE scores and heart rate at 90% VO2max were compared between groups.
Results
Patients with PD showed lower levels of maximal oxygen consumption, when compared with C group [VO2max (mL/kg/min): PD=29.42±6.50xC=34.51±5.35; Student's t-test=−3.51; p <0.05]. Furthermore, among PD subjects, the maximum heart rate during ergospirometry challenge was lower than expected [predict max HR (bpm)=200.85±6.33xheart rate test (bpm)=178.86±7.28; Z=−5.64; p<0.05]. Perceived exertion, as measured by RPE, was also overestimated in relation to heart rate at 90% of maximum oxygen consumption compared with controls (RPE90%VO2max: PD=18.93±0.55xC=16.67±0.60; U=8.00; Z=7.42; p<0.05).
Conclusions
The present study findings suggest that the Borg’s RPE Scale may not be an appropriate measure of subjective exertion among subjects with panic disorder performing a cardiopulmonary exercise test.
Keywords: Borg´s Scale, Panic Disorder, Ergospirometry, Anxiety Disorders, Misinterpretation
What are the new findings?
Patients with panic disorder have difficulties in the interpretation of bodily sensations during intense exercise.
Panic disorder patients have a maximum oxygen consumption (VO2max mL/kg/min) lower than healthy subjects.
The heart rate during the ergospirometric test of patients with panic disorder is lower than predicted.
In patients with panic disorder, a simple rating of perceived exertion as indexed by the Borg's Rating of Perceived Exertion Scale may not be sufficient to accurately capture the intensity of physical effort.
How might it impact on clinical practice in the future?
Review the ergospirometric rating protocols in panic disorder patients.
Physical training for patients with panic disorder should not be based only on a subjective perception of effort.
Exercise should be an integral part of treatment for patients with panic disorder in order to develop a better understanding of autonomic sensations.
Introduction
The most widely used instrument to measure perceived exertion or exercise intensity is the Borg’s Rating of Perceived Exertion (RPE) Scale (6–20).1 Objective measures of effort, such as heart rate (HR) and oxygen uptake, have be used in conjunction with RPE scores in clinical settings such as cardiac rehabilitation2–5 and with patients receiving β-blocker therapy.6 Using the Borg's RPE scale improves the safety of the challenge test when used in conjunction with objective measures.
According to its author, RPE scores correlate well with both physiological measures of stress and arousal (eg, HR, ventilatory threshold, blood lactate and creatinine concentration) as well as psychological measures of exhaustion.7
The subjective weighting of these physiological changes generates a response, which is measured by the RPE scale to provide a final score of subjective exertion.8 The putative similar perception of the exercise intensity (corresponding to anaerobic thresholds) among different individuals makes it possible to adequately prescribe exercise intensity.9
Of the many exercise challenge protocols available, Heck's10 test is the most widely used in sedentary subjects,11 12 due to its high reproducibility.10 13 This protocol determines the anaerobic threshold of the individual, which is the point at which the rate of lactate production exceeds that of removal.14
It is possible that patients with panic disorder do not perceive exertion in the same way as the general population. Spontaneous panic attacks (PAs) are bouts of inappropriately released fear. However, it is more likely that the underlying physiological mechanism is another brain defence reaction such as a mammalian suffocation alarm.15 Accordingly, a PA is usually associated with marked air hunger, which is not characteristic of external danger-induced fear. Another important difference is the lack of the emergency activation of the hypothalamic–pituitary–adrenal axis with lower levels of adrenocorticotropic hormone and cortisol observed in PAs.16
Further situational PAs and interpanic tonic anticipatory anxiety evolve due to several factors, one of which is fear conditioning.17 Over time, bodily sensations of arousal such as palpitations, breathlessness or dizziness can come to trigger PA due to increasing autonomic distress, sensitisation to panic and fear conditioning leading to catastrophic interpretation of those sensations as symptoms of an impending medical problem.18 Consequently, avoidance of physical exercise, which share with fear activation the same arousal bodily sensations, has been previously reported (eg, Muotri and Bernik), and was observed in this sample.19
Putatively, catastrophic interpretation of exercise-induced bodily sensations can alter the perception of current state of fatigue. Fatigue compromises exercise performance and is determined by central and peripheral mechanisms. Perceived exertion and fatigue are extremely important in the regulation of self-paced physical activity. These mechanisms have been proposed to interfere with the self-evaluation in the RPE Scale through an altered sensory tolerance limit.20
In the present study, we hypothesise that patients with panic disorder (PD) overestimate their exertion rendering the RPE Scale scores inappropriate for evaluating cardiovascular (CV) capacity in the patient with PD population.
Materials and methods
Ethical approval and study registration
Patients and controls were aware of the objectives, methods, potential risks and benefits of the study and signed consent forms. The Department of Psychiatry, University of São Paulo Medical School and the Hospital Ethics Committee approved the study. The study received a grant towards its total costs by the São Paulo State Foundation for the Development of Science.
Participants
The controls were mostly graduate students and staff of the Institute of Psychiatry, recruited after an internal ad (n=34). All were healthy, sedentary and devoid of any psychiatric disorders (using the Mini International Neuropsychiatric Interview; MINI).21 Patients with PD were recruited in the Emergency Room of the Institute of Cardiology in our hospital or through self-referrals for treatment to our group (Anxiety Disorders Program) after radio announcements, social media outreach and newspaper ads (n=50).
Fifty patients with PD were selected for this trial. Eight patients were excluded from the study for not having PD as the main diagnosis. Thus, 34 healthy, sedentary subjects, aged 18–55 years, who were devoid of any psychiatric disorders, were selected for this trial as controls. Four of these healthy sedentary subjects were unable to complete the challenge test due to personal reasons (figure 1).
Figure 1.
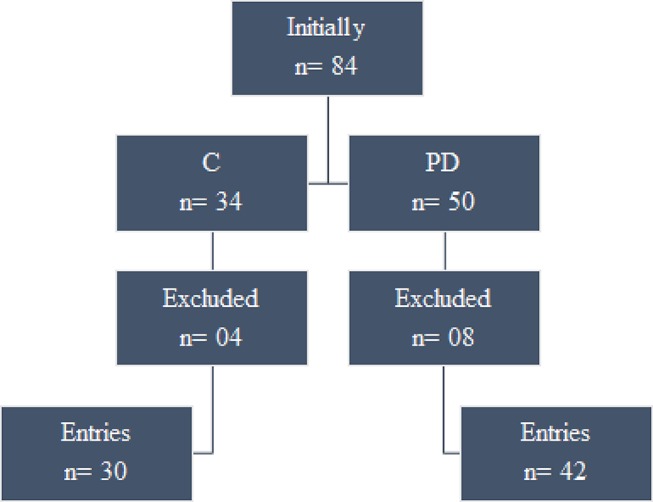
Recruitment and prescreening of sample. C, control group, PD, panic disorder group.
The MINI21 interview was used for the psychiatric diagnosis (or lack of it) in both groups.
Other exclusion criteria were lifetime cardio-circulatory, respiratory or endocrine diseases including hypertension, pregnancy and epilepsy.
Seventy-two subjects were included in this study—patients: 22 women and 20 men (mean age 33.02 years, SD 8.21 years) and controls: 20 women and 10 men (mean age 36.17 years, SD 7.25 years).
There were no differences in baseline characteristics between the PD group and the control (C) group (n=72). The analysed characteristics were (mean±SD): age=34.33±7.92 years, Z=−1.83, U=469.50;
body mass index (BMI)=25.35±3.81 kg/m2, t=1.40; gender (58.33% women, χ2=1); marital status (61.11% married, χ2=0.107) and sedentary status (72.22% sedentary, χ2=0.127).
There were differences between groups in terms of occupational status (73.66% working outside the home, n=26 PD group, n=27 C group, χ2=7.11, p=0.013) and schooling level (26.38%, below the university level, n=16 PD group, n=03 C group, χ2=7.11, p=0.013). No other differences were observed between groups, including the frequency of lifetime smoking (patients, 12 out of 42 and controls, 3 out of 30, χ2=3.66).
General procedure
Subjects were free from psychotropic medications for at least 4 weeks before the evaluation, alcohol free for at least 36 hours and xanthine or caffeine free for at least 8 hours. Smokers were instructed not to smoke for at least 2 hours before the evaluation, and all subjects consumed a light snack 3 hours before the test. The test took place between 11:00 and 00:00.
Eighty-nine per cent of the subjects (patients: 38; controls: 26) had previously undertake an ergospirometry challenge.
The tests took place in an ambient temperature of 22°C–25°C.
Before the test, the Physical Activity Readiness Questionnaire22 was used for assessment of CV risk even though the Heck's test protocol presents a very low risk for cardiac events (1/10.000–1/20.000).
Testing procedure
The ergospirometry challenge assessed CV capacity. The stress test was conducted on a medical grade treadmill (IMBRAMED, ATL – 10 200) with variable speed (km/hour) and slope (%). A modified version of the Heck's stress test protocol was used with fixed speed and increasing slope increments at a rate of 2% per minute.10 13
The test velocity was selected after two pilot tests with different speeds, performed minutes before the test, which also allowed subjects to familiarise themselves with the settings.23 Once the speed was chosen, the subjects had a 1 min rest period, and then began the protocol at the speed previously chosen. In the recovery phase, which lasted 3 mins, the speed was decreased steadily, in 1 min increments.
The perceived exertion was evaluated by the patient at each stage of the cardiopulmonary exercise test on a linear scale with 15 points (6–20) as described by Borg,24 Albouaini et al 25 and Faulkner and Eston26 (figure 2).
Figure 2.
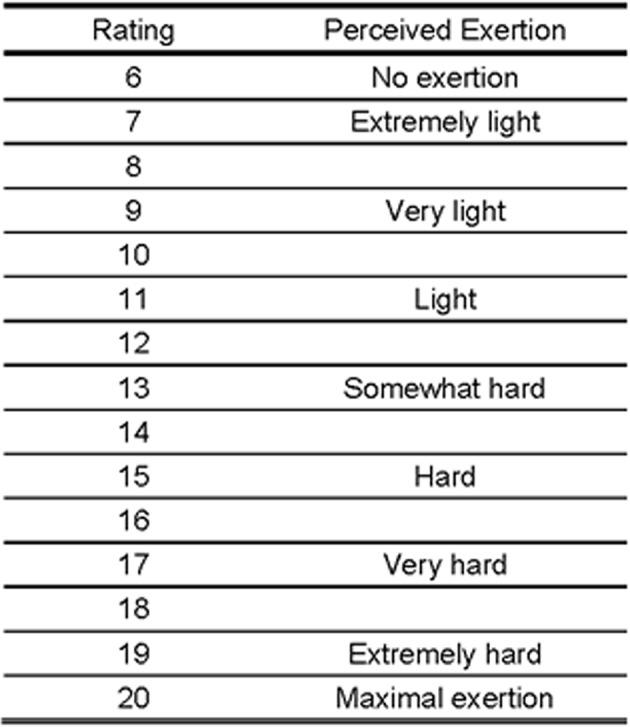
The Borg's Rating of Perceived Exertion Scale.
Measures
The ECG was performed with 13 leads (HeartWere, Ergo 13) at rest, during the effort phase and the recovery phase of the exercise test.
Throughout the test, subjects were blind to their current HR.
The airflow and volume analysis was performed by a two-way pre-pressure differential pressure pneumotachometer with high precision and dead space of 39 mL. The pneumotachometer was calibrated prior to each test with a syringe by 10 movements (five expirations and five inspirations) with a capacity of 3 L and dead space of 100 mL, used as a correction factor that determined the reading of the respiratory volume. The expired oxygen pressures (PETO2) were measured using a zirconia-type cell with a high accuracy and fast response (±0.03% O2), whereas the expired pressures of carbon dioxide (PET CO2) were measured with an infrared system with ±0.05% CO2 accuracy and response <130 ms. The O2 and CO2 analysers were calibrated, before and immediately after each test with two known gas mixtures of nitrogen and atmospheric air.25
The individuals were positioned on the mat wearing a helmet with a sterilised mouthpiece attached and the nose sealed with a catch.
Throughout the test protocol, expired gases were collected and analysed at each respiratory cycle: pulmonary ventilation, respiratory rate, tidal volume (VC), oxygen consumption (VO2), carbon dioxide (VCO2) production, (VCO2/VO2), the ventilatory equivalent of oxygen (VE/VO2), the final expired oxygen pressure (PETO2), the ventilatory equivalent of carbon dioxide (VE/VCO2) and the final expired pressure of dioxide of carbon (PETCO2).
Ventilatory variables were recorded instantaneously, and then means were calculated over 30-second intervals.27
The amount of VO2 is calculated from the difference between the PO2 of the inspired air (atmospheric standard) and the PO2 of the expired air as well as the expired PCO2.25 28 The VO2max was verified when subjects reached at least three of the following physiological validation criteria: (1) VO2 plateau, when there was no increase in VO2 greater than 2.0 mL/kg/min for an increase of inclination between the penultimate and the last stage of the test29; (2) respiratory quotient maximum, equal to or greater than 1.1030; (3) maximum HR, equal to or greater than 95% of the maximum chronotropic response predicted for age to the equation [208 − (0.7 x age)]31 32; (4) a value equal to or greater than 18 on the subjective perception scale of Borg3 33 signs of extreme fatigue such as: intense hyperpnoea, excessive sweating, facial flushing or difficulty in maintaining adequate motor coordination with the increment of speed of the treadmill.33 34 As a subjective criterion, the Borg's RPE Scale of fatigue perception was used in all tests as a means of complementing exercise intensity monitoring.33
After the test, patients were referred for treatment in our group. Controls received information about their CV capacity and individualised recommendations for initiating physical exercises.
Statistical analysis
The data were initially tested for normality using the Kolmogorov–Smirnov test.
When normality assumptions were not confirmed or in variables where scores are natural numbers, non-parametric tests were used. The Mann-Whitney U test with Bonferroni correction was used to compare groups when normality assumptions were not confirmed (age, resting HR, predict maximum HR, HR reached during test, HR at 90% of maximal oxygen consumption, Borg's RPE Scale values at 90% of maximal oxygen consumption and being a smoker). Otherwise, the groups were compared using the Student's t-test.
For quantitative and qualitative variables, Pearson's χ2 test was applied to investigate linear correlation. When there were less than six subjects in the comparisons (as in the variables smoking, schooling level and occupational status) the Fisher's exact test was chosen.
The difference observed between the predicted target HR for the test and the maximal HR in the test for both groups was compared using the Student's t-test and, when checking a significant difference between the groups, we also used the Wilcoxon W test. The Mann-Whitney U test was used to compare the values of HR at 90% of VO2max and the RPE at 90% of VO2max.
The level of significance was set at ≤0.05 (for two-tailed comparisons) throughout the study. Statistical analyses were performed with Statistical Package for the Social Sciences (SPSS) V.14.0.
Results
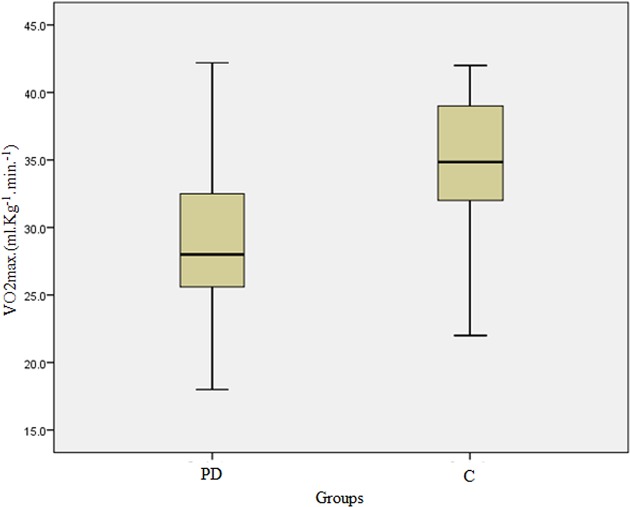
Patients with PD showed lower levels of maximal oxygen consumption when compared with the control group (VO2max(mL/kg/min): PD=29.42 ± 6.50 x C=34.51 ± 5.35; t=− 3.51; p<0.05) (figure 3 and table 1).
Figure 3.
Comparison of the levels of maximum oxygen consumption. C, control group, PD, panic disorder group.
Table 1.
Participants’ physical performance results by group
| Performance characteristics |
PD
n=42 |
C
n=30 |
Total
n=72 |
p Value | Value of statistical test |
| RHR (bpm) | 84.00±7.32 | 85.23±8.09 | 84.51±7.62 | >0.05 | Z=−0.69, U=569.00 |
| PMHR (bpm) | 200.85±6.33 | 207.34±0.95 | 203.55±5.82 | <0.05 | Z=−7.00, U=29.00 |
| HRRDT (bpm) | 178.86±7.28 | 183.03±4.97 | 180.60±6.71 | <0.05 | Z=−2.54, U=408.00 |
| VO2max (mL/kg/min) | 29.42±6.50 | 34.51±5.35 | 31.54±6.51 | <0.05 | t=−3.51 |
| 90%VO2max (mL/kg/min) | 26.48±5.85 | 31.06±4.81 | 28.39±5.86 | <0.05 | t=−3.51 |
| HR 90%Vo2max (bpm) | 160.97±6.55 | 164.73±4.48 | 162.54±6.04 | <0.05 | Z=−2.54, U=408.00 |
| RPE 90%Vo2max | 18.93±0.55 | 16.67±0.60 | 17.99±1.26 | <0.05 | Z=−7.42, U=8.00 |
| RPE scale to 90% VO2max and HR Measured at 90% VO2max in the PD group | Smoker | 2.27±1.28 | >0.05 | Z=−0.87, U=148.50 | |
| Non-smoker | 1.70±1.34 | ||||
| HRRDT x RPE scale to 90% VO2max and HR measured at 90% VO2max | PD | r= −. 511* | |||
| C | r=0.005* | ||||
The results are presented as mean and SD.
*Pearson's correlation. Alpha was set to 0 .05 for all statistical analyses.
HR, heart rate; HRRDT, heart rate reached during test; HR 90%Vo2max, heart rate at 90% of maximal oxygen consumption; PMHR, predict maximum heart rate;RHR, resting heart rate; VO2max, maximal oxygen consumption; 90%VO2max, 90% of the maximal oxygen consumption; RPE 90%Vo2max, Borg's RPE Scale values at 90% of maximal oxygen consumption.
The maximum HR during ergospirometry challenge was lower than expected in patients with PD (predict max HR (bpm)=200.85±6.33xheart rate test (bpm)=178.86±7.28; Z=−5.64; p<0.05).
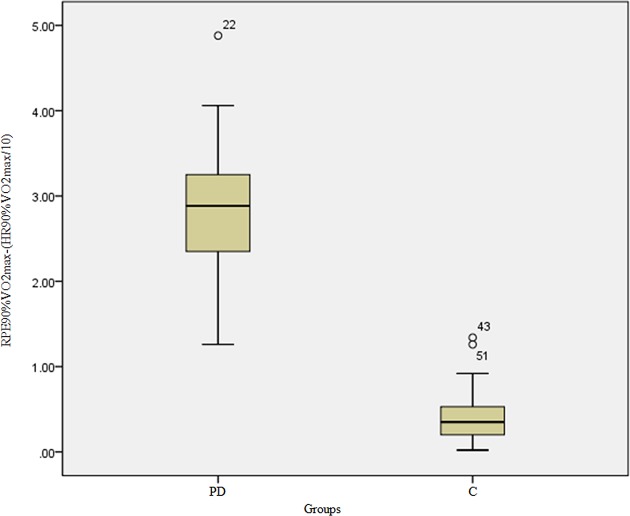
The perceived exertion characterised by RPE was overestimated in relation to HR at 90% of maximum oxygen consumption in patients with PD when compared with the controls (HR90%VO2max(mL/kg/min): PD=160.97±6.55xC=164.73±4.48; U=408.00; Z=−2.54; p<0.05 and RPE90%VO2max: PD=18.93±0.55xC=16.67±0.60; U=8.00; Z=−7.42; p<0.05), as shown in figure 4 and table 1.
Figure 4.
Absolute difference between the effort reported by the groups through the Borg's RPE Scale to 90% VO2max and HR measured at 90% VO2max. HR, heart rate; RPE, rating of perceived exertion.
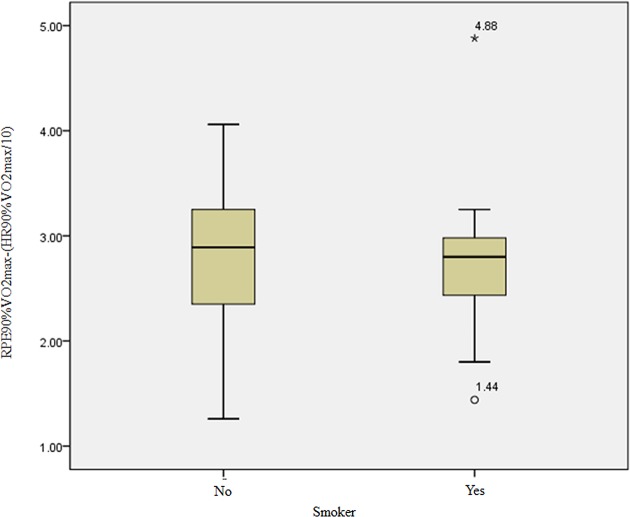
There were no differences between smokers and non-smokers in relation to neither the subjective perception of effort (RPE scores) nor the VO2max (mL/kg/min) (figure 5 and table 1). Accordingly, smokers were not analysed as a separate group as it would reduce the sample size and compromise the data analysis.
Figure 5.
Absolute difference between the effort reported by smokers and non-smokers in the PD group through the RPE scale to 90% VO2max and HR measured at 90% VO2max. HR, heart rate; PD, panic disorder; RPE, rating of perceived exertion. *Maximum value.
Discussion
Demographic characteristics of the present study subjects are similar to those reported in the literature for patients with PD who are selected for treatment programmes—predominantly younger patients and women (eg,35–39). In the present study, which focused on physical performance, we observed that patients with PD tend to be sedentary and slightly overweight (BMI=25.35 kg/m2). This has also been reported previously (eg, Lykouras and Michopoulos40).
There is a wealth of studies reporting on cardiopulmonary exercise testing (CPX) in patients with PD. Evidence suggests that aerobic fitness may be reduced in this clinical condition.41–44 As already noted by other authors,41 42 45 VO2max tends to be lower in patients with PD than in age-matched and sex-matched healthy subjects. This finding has been replicated in the present study (table 1). In addition, patients with PD have been shown to have a significantly higher resting HR and resting tachycardia than healthy subjects.43
There are two possible explanations: the first is that this lower aerobic fitness observed in many patients with PD may result from avoidance of strenuous activity that might trigger PAs. This leads to a reduction of exposure to exercise and outside activities that could improve subjects’ aerobic fitness.41 In fact, regular exercise improves this condition, leading to levels of aerobic fitness similar to that of healthy subjects.42
Alternatively, although the mechanism is not clear, performance of maximal CPX may be hampered by panic anxiety during the challenge. Autonomic manifestations naturally triggered by exercise are similar to those present in a PA.44 It is our view that patients with PD are unwilling to achieve the exhaustion that characterises a maximal CPX due to anticipatory anxiety related to a PA.41 46 In accordance with this idea is the fact that patients with PD overestimate their degree of physical exhaustion as observed in our study (figures 3 and 4).
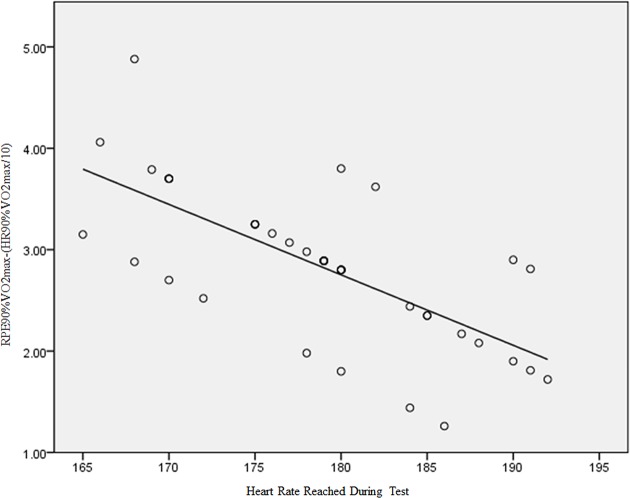
In the control group, there was a clear correlation between the percentage of the target maximum HR reached and the RPE score reported at all score levels (figure 4). This is a finding widely reported in the literature (eg, 48–50). On the other hand, in patients with PD, there was no correlation between the percentages of target HR max with the reported RPE (figure 6 and table 1) in scores lower than 17. This is consistent with the model of ‘catastrophic’ interpretation of autonomic symptoms in panic patients as proposed by Clark9 and corroborated by Carton and Rhodes47 and Noble3. This finding supports our initial hypothesis.
Figure 6.
HR reached during test x Borg's RPE Scale to 90% VO2max and HR measured at 90% VO2max of PD group. HR, heart rate; PD, panic disorder; RPE, rating of perceived exertion.
Finally, in the present study there were no differences between smokers and non-smokers in relation to the subjective perception of effort RPE and VO2max. This is in contrast with previous reports in the literature.48–51 One possible explanation is the small sample size for this comparison, which yielded a power (1-β) of <0.8%, which is too small to rule out type II errors.
Conclusions
Perceived effort comprises several distinct inputs that are perceived differently across the duration of an executed task and among different individuals. Thus, exertion may be only one of many perceptual features experienced during exercise engagement.52–54 For some populations, it may be not appropriate to measure effort solely through the conceptual lens of 'exertion'. This seems to be particularly true for patients with a diagnosis of panic disorder.
Psychological influences on perceived effort are hypothesised to occur when signals arising in the sensory cortex are matched with the so-called ‘perceptual-cognitive reference filter’.3 Therefore, to evaluate perceived effort with only one physiological index is an oversimplification of the psychophysiological construct.
More research is needed to establish a comprehensive concept of perceived effort and to develop an associated multidimensional instrument, including psychophysiological determinants, to measure perceived effort. One alternative would be to understand the role of the central corollary discharge, a copy of the neural drive from the brain to the working muscles that provides a signal from the motor system to sensory systems and is considered a feedforward mechanism that might influence fatigue and consequently exercise performance.20
In summary, these findings suggest that in patients with PD, a simple rating of perceived exertion as indexed by the Borg's RPE Scale may not be sufficient to accurately capture the intensity of physical effort.
Footnotes
Acknowledgements: The authors would like to thank Dr Paul R Santos Silva and Dr Julia Greve for their help in data acquisition and all Movement Laboratory Studies team of orthopaedics and Traumatology Institute of the University of São Paulo Medical School in the realisation of the cardiopulmonary test. We also thank all of the Heart Institute team (INCOR - SP / Brazil) to aid the recruitment of new subjects.
Competing interests: None declared.
Ethics approval: Ethics Committee for Analysis of Research Projects FMUSP (CAPPESQ).
Provenance and peer review: Not commissioned; externally peer reviewed.
Author note: This study contributes to a better cardiorespiratory factor analysis in a specific population.
References
- 1. Noble BJ, Borg G, Exertion Borg’s Perceived, et al. Champaign. IL: Human Kinetics, 1998. [Google Scholar]
- 2. Dunbar CC, Glickman-Weiss EL, Bursztyn DA, et al. A submaximal treadmill test for developing target ratings of perceived exertion for outpatient cardiac rehabilitation. Percept Mot Skills 1998;87:755–9. 10.2466/pms.1998.87.3.755 [DOI] [PubMed] [Google Scholar]
- 3. Noble BJ. Robertson RJ perceived exertion. Champaign: Human Kinetics 1996:280–5. [Google Scholar]
- 4. Clinical applications of perceived exertion. Med Sci Sports Exerc 1982;14:406–11. [DOI] [PubMed] [Google Scholar]
- 5. Robertson RJ. Exercise testing and prescription using RPE as a criterion variable. Int J Sport Psychol 2001;32:177–88. [Google Scholar]
- 6. Eston R, Connolly D. The use of ratings of perceived exertion for exercise prescription in patients receiving beta-blocker therapy. Sports Med 1996;21:176–90. 10.2165/00007256-199621030-00003 [DOI] [PubMed] [Google Scholar]
- 7. Borg GAV. An introduction to Borg’s RPE Scale. New York: Movement Publications, 1985. [Google Scholar]
- 8. Neves AR, Doimo LA. Avaliação da percepção subjetiva de esforço e da freqüência cardíaca em mulheres adultas durante aulas de hidroginástica v. 9. Revista Brasileira de Cineantropometria & Desempenho Humano n 2007;4:386–7. [Google Scholar]
- 9. Purvis JW, Cureton KJ. Ratings of perceived exertion at the anaerobic threshold. Ergonomics 1981;24:295–300. 10.1080/00140138108924852 [DOI] [PubMed] [Google Scholar]
- 10. Heck H, Mader A, Hess G, et al. Justification of the 4-mmol/l lactate threshold. Int J Sports Med 1985;6:117–30. 10.1055/s-2008-1025824 [DOI] [PubMed] [Google Scholar]
- 11. Buchfuhrer MJ, Hansen JE, Robinson TE, et al. Whipp BJ - Optimizing the exercise stress test (or cardiopulmonary assessment). J Appl Physiol 1983;55:1558–64. [DOI] [PubMed] [Google Scholar]
- 12. Baptista RR, Oliveira LG, Figueredo GB, et al. Limiar de lactato em remadores: comparação entre dois métodos de determinação v. 11. Revista Brasileira de Medicina do Esporte n 2005;4:247–50. [Google Scholar]
- 13. Santos-Silva PR, Fonseca AJ, Castro AW, et al. Reproducibility of maximum aerobic power (VO2max) among soccer players using a modified heck protocol. Clinics 2007;62:391–6. 10.1590/S1807-59322007000400004 [DOI] [PubMed] [Google Scholar]
- 14. Mcardle WD, Katch FI, Katch VL. Fisiologia do exercício: energia, nutrição e desempenho humano. 7.ed Rio de Janeiro: Editora Guanabara Koogan, 2011. [Google Scholar]
- 15. Klein DF. Testing the suffocation false alarm theory of panic disorder. Anxiety 1994;1:1–7. 10.1002/anxi.3070010103 [DOI] [PubMed] [Google Scholar]
- 16. Klein DF, developments P. Rev Bras Psiquiatr 2012;34(Suppl 1):S1–2. [DOI] [PubMed] [Google Scholar]
- 17. Klein DF, Gorman JM. A model of panic and agoraphobic development. Acta Psychiatr Scand Suppl 1987;335:87–95. 10.1111/j.1600-0447.1987.tb07753.x [DOI] [PubMed] [Google Scholar]
- 18. Clark DM A cognitive approach to panic. Behaviour Research and Therapy 1986;44:461–70. [DOI] [PubMed] [Google Scholar]
- 19. Muotri RW, Bernik MA, disorder P. And exercise avoidance. Rev Bras Psiquiatr 2014. 36:68–75. [DOI] [PubMed] [Google Scholar]
- 20. Hureau TJ, Romer LM, Amann M. The ‘sensory tolerance limit’: A hypothetical construct determining exercise performance? Eur J Sport Sci 2016;462:1–12. 10.1080/17461391.2016.1252428 [DOI] [PMC free article] [PubMed] [Google Scholar]
- 21. Sheehan DV, Lecrubier Y, Sheehan KH, et al. The Mini-International neuropsychiatric interview (M.I.N.I.): the development and validation of a structured diagnostic psychiatric interview for DSM-IV and ICD-10. J Clin Psychiatry 1998;59(Suppl 20):2234–3357. [PubMed] [Google Scholar]
- 22. Chisholm DM, Collis ML, Kulak LL, et al. ; PAR-Q validation report: the evaluation of a self-administered pre-exercise screening questionnaire for adults. Victoria, Colombie-Britannique: BC Ministry of Health and Health and Welfare Canada, 1978. [Google Scholar]
- 23. Karila C, de Blic J, Waernessyckle S, et al. Cardiopulmonary exercise testing in children: an individualized protocol for workload increase. Chest 2001;120:81–7. [DOI] [PubMed] [Google Scholar]
- 24. Borg G. [Physical training. 3. perceived exertion in physical work]. Lakartidningen 1970;67:4548–57. Swedish. [PubMed] [Google Scholar]
- 25. Albouaini K, Egred M, Alahmar A, et al. Cardiopulmonary exercise testing and its application. Heart 2007;93:675–82. 10.1136/hrt.2007.121558 [DOI] [PMC free article] [PubMed] [Google Scholar]
- 26. Faulkner J, Eston R. Overall and peripheral ratings of perceived exertion during a graded exercise test to volitional exhaustion in individuals of high and low fitness. Eur J Appl Physiol 2007;101:613–20. 10.1007/s00421-007-0536-2 [DOI] [PubMed] [Google Scholar]
- 27. Carey D, Hughes J, Raymond R, et al. The respiratory rate as a marker for the ventilatory threshold: comparison to other ventilatory parameters. Journal of Exercise Physiology 2005;8:30–8. [Google Scholar]
- 28. Casaburi R. Limitation to exercise tolerance in chronic obstructive pulmonary disease: look to the muscles of ambulation. Am J Respir Crit Care Med 2003;168:409–10. 10.1164/rccm.2305013 [DOI] [PubMed] [Google Scholar]
- 29. Shephard RJ. Some further comments on 'cardiac frequency in relation to aerobic capacity for work'. Ergonomics 1971. 14:425–6. 10.1080/00140137108931262 [DOI] [PubMed] [Google Scholar]
- 30. Dupont G, Millet GP, Guinhouya C, et al. Relationship between oxygen uptake kinetics and performance in repeated running sprints. Eur J Appl Physiol 2005;95:27–34. 10.1007/s00421-005-1382-8 [DOI] [PubMed] [Google Scholar]
- 31. Tanaka H, Monahan KD. Seals DR age – Predicted Maximal Heart Revisited. J Am Coll Cardiol 2001;37:153–6. [DOI] [PubMed] [Google Scholar]
- 32. Tanaka H, Monahan KD, Seals DR. Age-predicted maximal heart rate revisited. J Am Coll Cardiol 2001;37:153–6. 10.1016/S0735-1097(00)01054-8 [DOI] [PubMed] [Google Scholar]
- 33. ACSM. Guidelines for exercise testing and prescription. 6th Ed: Williams & Wilkins, 2000. [Google Scholar]
- 34. Welsman JR, Armstrong N. Longitudinal changes in submaximal oxygen uptake in 11- to 13-year-olds. J Sports Sci 2000;18:183–9. 10.1080/026404100365081 [DOI] [PubMed] [Google Scholar]
- 35. Goodwin RD, Faravelli C, Rosi S, et al. The epidemiology of panic disorder and agoraphobia in Europe. Eur Neuropsychopharmacol 2005;15:435–43. 10.1016/j.euroneuro.2005.04.006 [DOI] [PubMed] [Google Scholar]
- 36. Wittchen HU, Nelson CB. Lachner G prevalence of mental disorders and psychosocial impairments in adolescents and young adults psychol. Med 1998;28:109–26. [DOI] [PubMed] [Google Scholar]
- 37. Wittchen HU. Natural course and spontaneous remissions of untreated anxiety disorders—results of the Munich follow-up study (MFS) : Hand I, Wittchen HU, Panic and phobias: 2. treatments and variables affecting course and outcome. Eds Berlin: Springer, 1988:3–17. [Google Scholar]
- 38. Klerman GL, Weissman MM, Ouellette R, Klerman MM, Oulette J, et al. Panic attacks in the community. social morbidity and health care utilization. Jama 1991;265(6):742–6. [PubMed] [Google Scholar]
- 39. Pirkola SE, Isometsä J, Suvisaari H, et al. DSM-IV mood-, anxiety and alcohol use disorders and their comorbidity in the finnish general population. results from the health 2000 study soc. Psychiatry Psychiatr. Epidemiol 2005;40:1–10. [DOI] [PubMed] [Google Scholar]
- 40. Lykouras L, Michopoulos J. Anxiety disorders and obesity. Psychiatriki 2011. 22:307–13. [PubMed] [Google Scholar]
- 41. Caldirola D, Namia C, Micieli W, et al. Cardiorespiratory response to physical exercise and psychological variables in panic disorder. Rev Bras Psiquiatr 2011;33:385–9. 10.1590/S1516-44462011000400013 [DOI] [PubMed] [Google Scholar]
- 42. Meyer T, Broocks A, Bandelow B, et al. Endurance training in panic patients: spiroergometric and clinical effects. Int J Sports Med 1998;19:496–502. 10.1055/s-2007-971951 [DOI] [PubMed] [Google Scholar]
- 43. Taylor CB, King R, Ehlers A, et al. Treadmill exercise test and ambulatory measures in panic attacks. Am J Cardiol 1987;60:J48–J52. 10.1016/0002-9149(87)90683-7 [DOI] [PubMed] [Google Scholar]
- 44. Telch MJ, Harrington PJ, Smits JA, et al. Unexpected arousal, anxiety sensitivity, and their interaction on CO2-induced panic: further evidence for the context-sensitivity vulnerability model. J Anxiety Disord 2011;25:645–53. 10.1016/j.janxdis.2011.02.005 [DOI] [PubMed] [Google Scholar]
- 45. Broocks A, Meyer TF, Bandelow B, et al. Exercise avoidance and impaired endurance capacity in patients with panic disorder. Neuropsychobiology 1997;36:182–7. 10.1159/000119381 [DOI] [PubMed] [Google Scholar]
- 46. Sardinha AA. Nardi AE interval aerobic training as a tool in the cognitive behavioral treatment of panic disorder. J Bras Psiquiatr 2011;60:227–30. [Google Scholar]
- 47. Carton RL, Rhodes EC. A critical review of the literature on ratings scales for perceived exertion. Sports Med 1985;2:198–222. 10.2165/00007256-198502030-00004 [DOI] [PubMed] [Google Scholar]
- 48. Fadda E, Galimberti E, Cammino S, et al. Smoking, physical activity and respiratory irregularities in patients with panic disorder. Riv Psichiatr 2013;48:293–300. 10.1708/1319.14625 [DOI] [PubMed] [Google Scholar]
- 49. Fukuba Y, Takamoto N, Kushima K, et al. [Cigarette smoking and physical fitness]. Ann Physiol Anthropol 1993;12:195–212. 10.2114/ahs1983.12.195 [DOI] [PubMed] [Google Scholar]
- 50. Louie D. The effects of cigarette smoking on cardiopulmonary function and exercise tolerance in teenagers. Can Respir J 2001;8:289–91. 10.1155/2001/701384 [DOI] [PubMed] [Google Scholar]
- 51. Bernaards CM, Twisk JW, Van Mechelen W, et al. A longitudinal study on smoking in relationship to fitness and heart rate response. Med Sci Sports Exerc 2003;35:793–800. 10.1249/01.MSS.0000064955.31005.E0 [DOI] [PubMed] [Google Scholar]
- 52. Hardy CJ, Rejeski WJ. Not what, but how one feels: the measurement of affect during exercise. Journal of Sport and Exercise Psychology 1989;11:304–17. 10.1123/jsep.11.3.304 [DOI] [Google Scholar]
- 53. McAuley E, Courneya KS. The subjective exercise experiences scale (SEES): Development and preliminary validation. Journal of Sport and Exercise Psychology 1994;16:163–77. [Google Scholar]
- 54. Parfitt G, Markland D, Holmes C. Responses to physical exertion in active and inactive males and females. Journal of Sport and Exercise Psychology 1994;16:178–86. 10.1123/jsep.16.2.178 [DOI] [Google Scholar]
- 55. Lissek S, Rabin S, Heller RE, et al. Overgeneralization of conditioned fear as a pathogenic marker of panic disorder. Am J Psychiatry 2010;167:47–55. 10.1176/appi.ajp.2009.09030410 [DOI] [PMC free article] [PubMed] [Google Scholar]
- 56. Hartshorn JE, Lamb KL. The reproducibility of perceptually regulated exercise responses during short-term cycle ergometry. Int J Sports Med 2004;25:362–7. 10.1055/s-2004-815840 [DOI] [PubMed] [Google Scholar]
- 57. British Association of Sport and Exercise Sciences Physiological testing guidelines. 3rd ed, 1997. [Google Scholar]
- 58. Smutok MA, Skrinar GS. Pandolf KB subjective regulation by perceived exertion. Arch Physic Rehab Med 1980;61:569–74. [PubMed] [Google Scholar]


