Abstract
Background
With the increasing use of transcatheter aortic valve replacement (TAVR) in patients with aortic stenosis (AS), computed tomography (CT) remains the standard for annulus sizing. However, 3D transesophageal echocardiography (TEE) has been an alternative in patients with contraindications to CT. We sought to (1) test the feasibility, accuracy, and reproducibility of prototype 3DTEE analysis software (Philips) for aortic annular measurements and (2) compare the new approach to the existing echocardiographic techniques.
Methods
We prospectively studied 52 patients who underwent gated contrast CT, procedural 3DTEE, and TAVR. 3DTEE images were analyzed using novel semi-automated software designed for 3D measurements of the aortic root, which uses multiplanar reconstruction, similar to CT analysis. Aortic annulus measurements included area, perimeter, and diameter calculations from these measurements. The results were compared to CT-derived values. Additionally, 3D echocardiographic measurements (3D planimetry and mitral valve analysis software adapted for the aortic valve) were also compared to the CT reference values.
Results
3DTEE image quality was sufficient in 90% of patients for aortic annulus measurements using the new software, which were in good agreement with CT (r-values: .89–.91) and small (<4%) inter-modality nonsignificant biases. Repeated measurements showed <10% measurements variability. The new 3D analysis was the more accurate and reproducible of the existing echocardiographic techniques.
Conclusions
Novel semi-automated 3DTEE analysis software can accurately measure aortic annulus in patients with severe AS undergoing TAVR, in better agreement with CT than the existing methodology. Accordingly, intra-procedural TEE could potentially replace CT in patients where CT carries significant risk.
Keywords: aortic stenosis, three-dimensional echocardiography, transcatheter aortic valve replacement
1 | BACKGROUND
Aortic stenosis (AS) is the most common valvular lesion in the developed world.1–4 Symptomatic AS is lethal with aortic valve replacement being the only durable treatment option. Recently, transcatheter aortic valve replacement (TAVR) has become a safe, feasible treatment option for patients at high and intermediate surgical risk5–7 that is routinely practiced worldwide. The indications for TAVR, while currently restricted to patients deemed high risk or inoperable in the United States, are rapidly increasing. In addition, novel TAVR devices allow an increasing spectrum of patients to receive treatment. Since the advent of TAVR, the issue of prosthetic aortic valve sizing has been a primary focus, because oversizing valves can cause damage to the aortic root and/or coronary arteries, whereas undersizing can lead to valve dislodgement or, more commonly, paravalvular regurgitation (PVR).
Initially, preprocedural assessment and sizing was made using two-dimensional (2D) transesophageal echocardiography (TEE). However, due to the oval shape of the aortic annulus, 2D TEE was found to often underestimate the size of the aortic annulus,8–12 leading to more frequent and significant PVR. Currently, preprocedural multidetector computed tomography (CT) is the standard of care for aortic annulus sizing. Nevertheless, because the typical population of AS patients has advanced age and some degree of renal dysfunction, contrast CT is contraindicated in a subset of these patients (10%–20%). Accordingly, 3DTEE is frequently used for valve sizing in these select cases, because it has been shown to provide more accurate annular sizing, than 2DTEE. However, 3DTEE measurements reported to date have largely relied on software designed for other purposes9,13 or for other valves, such as mitral valve analysis,14 which can be challenging to use with the aortic annulus.
This study aimed to (1) test the feasibility and accuracy against CT reference of novel semi-automated 3DTEE-based analysis, specifically designed for the aortic valve; (2) compare the results of this analysis to previously used 3DTEE methods (multiplanar reconstruction [MPR]-based planimetry and 3D analysis designed for the mitral valve and adapted for the aortic valve); and (3) compare the reproducibility of these three techniques.
2 | METHODS
We prospectively studied 52 consecutive patients with severe AS who underwent TAVR implantation, gated contrast cardiac CT with aortography, and a complete TEE examination with full-volume 3D acquisition, while in normal sinus rhythm. Basic demographics of the study patients are shown in Table 1.
TABLE 1.
Baseline demographic data of the study patients
| Age, y | 81±8 |
| Male | 28/47 |
| Body surface area | 1.9±0.3 m2 |
| Left ventricular ejection fraction | 57±16% |
| Aortic valve mean gradient | 40±13 mm Hg |
| Aortic valve area | 0.8±0.2 cm2 |
Data for continuous variables are presented as mean±SD.
CT imaging (256-slice scanner; Philips, Best, The Netherlands) was performed using retrospective ECG gating with acquisition triggered by contrast bolus tracking. Total amount of radiation was 2.36±1.01 Gy cm for the entire test, including coverage through the chest, abdomen, and pelvis. Contrast dose was adjusted for individual patients based on body weight and glomerular filtration rate. Offline assessment was performed using commercial software (Vital Images, Inc., Minnetonka, MN, USA). Annular plane was initially located using MPR analysis with axial, coronal, and sagittal planes. From CT datasets, area and perimeter of the aortic annulus were measured and diameter was derived from each area and perimeter (Figure 1). Following recent guidelines,15 analysis was performed at end systole phase of the cardiac cycle in 26 of 47 (55%) patients, while in the 21 of 47 (45%) patients enrolled earlier, the end-diastolic phase was used for analysis. To determine the effects of this inconsistency, we performed separate analysis for the above two CT subgroups.
FIGURE 1.
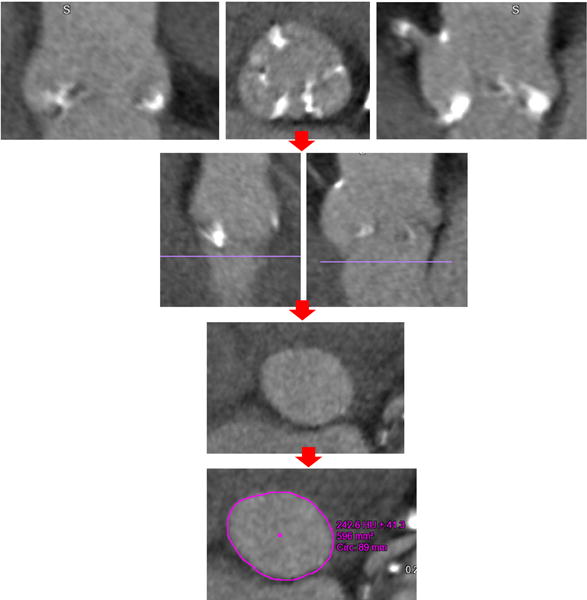
Stepwise approach for measurement of the aortic annulus from computed tomography acquisition in a patient with aortic stenosis. After aortic root identification using multiplanar reconstruction (top row), the aortic annulus is defined by the lowest point of the aortic valve cusps (second row, purple line). Next, the short-axis image just below that level is displayed (3rd row), in which the annulus is traced to obtain area and perimeter measurements (bottom row)
Transesophageal echocardiography images of the aortic valve were acquired with a matrix-array probe (Philips iE33 imaging system; X7-2t transducer) intra-procedurally, just prior to implantation. Imaging included 4-beat 3D full-volume and/or zoomed datasets focused on the aortic root. Whenever possible, ventilation was briefly suspended to avoid stitch artifacts.
All CT and echocardiographic measurements were performed by two independent readers who were blinded to all prior measurements. A minimum of three cardiac cycles were analyzed, and the results were averaged.
3D analysis was performed offline using three different techniques in mid systole from inner edge to inner edge, following the recommendation of the recent guidelines.16 First, we used prototype software (Philips) specially designed for analysis of the aortic root using a stepwise semi-automated approach, based, as depicted in Figure 2. First, the base of each of the aortic valve cusps was located on MPR images and annular plane was approximated by aligning the short-axis plane (Figure 2, red line), perpendicular to the base of the leaflets using the long-axis images making adjustments primarily in the superior/inferior and clockwise/counterclockwise directions. Next, the base of each leaflet was located, based on the long-axis and short-axis planes in MPR (Figure 2, red dots), and the annular plane was established. Following this, borders were adjusted using long- and short-axis views from the 3D dataset and subsequently fine contour adjustments were made to appropriately approximate borders in the annular plane. The software then automatically measured aortic annular area and perimeter and calculated diameters derived from both area and perimeter using standard mathematical formulae.
FIGURE 2.
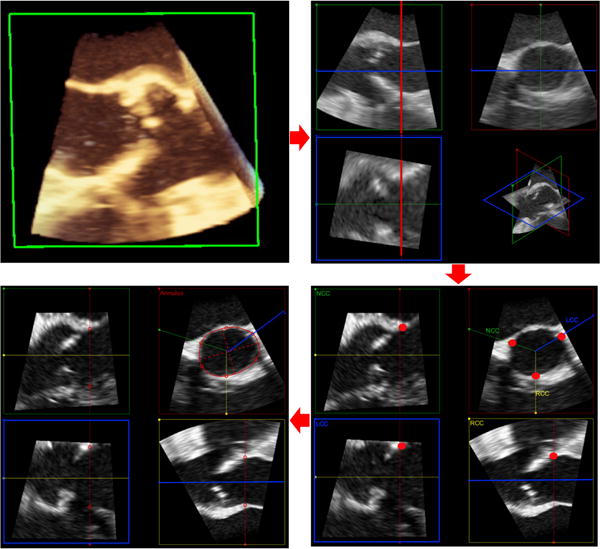
Stepwise approach for measurement of aortic annulus using novel aortic valve software from 3D transesophageal echocardiography acquisition in a patient with aortic stenosis (top left). After aortic root identification using multiplanar reconstruction at the end-systolic phase of the cardiac cycle, the base of the aortic valve leaflets is approximated (top right). Then, the base of each individual aortic valve leaflet is identified (red dots, bottom right) to establish the plane of the aortic annulus. Finally, the borders of the annulus are defined and fine adjustments are made as needed to obtain area and perimeter measurements (bottom left)
Subsequently, the same 3DTEE datasets were analyzed using a commercial software package (3DQ, QLAB version 9.0.1; Philips), as previously described.9,13 This software uses MPR alignment of the aortic annulus at end systole, to allow visualization and planimetry by manual tracing of the annulus in the short-axis plane, which yields annular area, but does not include an option for perimeter measurements.
Finally, 3D analysis software designed for analysis of the mitral valve (Mitral Valve Quantification [MVQ], QLAB version 9.0.1; Philips) was used as previously described14,17 to measure aortic annular area and perimeter. Briefly, this analysis included several steps, starting with MPR alignment of the aortic annulus at end systole, followed by marking of eight pairs of annular points in cross-sectional long-axis views of the valve (2 points per plane), while viewing the annular tracing as it is generated step-by-step and adjusting it as necessary.
The novel semi-automated 3D measurements, as well as the other two 3D analysis techniques, were compared to the corresponding CT values using linear regression with Pearson’s correlation coefficients and Bland-Altman analyses. Significance of the inter-technique biases was tested using paired t tests, after data were tested using the Kolmogorov-Smirnov test and normal distribution was confirmed. In addition, to determine which parameter is measured most accurately, inter-technique differences calculated for each parameter were normalized by the mean measured value of the corresponding parameter, resulting in percent errors. Statistical analysis was performed using Microsoft Excel and SPSS software (Chicago, IL, USA), when necessary. 3DTEE measurements of annular area obtained using the semi-automated approach were used to determine the sizing of an Edwards Sapien XT valve, which was compared to that based on CT-derived area.
To determine the reproducibility of all aortic annular parameters measured by all the techniques used in this study, measurements were repeated in a randomly selected subgroup of 10 study patients. To assess inter- and intra-observer variability, this was performed by two expert readers blinded to all previous measurements, who started their analyses from the raw images and repeated all steps independently. Inter- and intra-observer variability was expressed as the absolute difference for each pair of repeated measurements in percent of their mean as well as intra-class correlation coefficients.
3 | RESULTS
The quality of the 3DTEE images was sufficient in 47 of 52 study patients to allow aortic annulus measurements (90% feasibility). Of the excluded patients, four did not have adequate 3DE images (ie, poor visualization of the aortic annulus), while 1 had image dropout at the aortic annulus. Figure 3 shows an example of CT and 3DTEE images with the tracings of the aortic annulus, obtained in a study patient.
FIGURE 3.
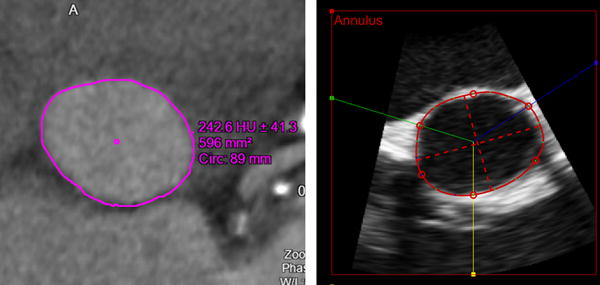
Example of images of the aortic annulus obtained in a patient with aortic stenosis: Multi-detector comuted tomography (left) and the new semi-automated 3D transesophageal echocardiography analysis (right) shown with the aortic annulus tracings. Both modalities clearly depict the oval shape of the annulus
Overall, aortic annulus measurements derived from TEE by the new semi-automated technique were in good agreement with the CT reference values, as reflected by correlation coefficients between .89 and .91. Figures 4 and 5 show the results of the linear regression (top) and Bland-Altman analysis (bottom), which showed small biases in all four measured parameters: area and perimeter (Figure 4) and the derived diameters (Figure 5). Mean values and inter-technique differences are listed in Table 2 (top portion), which shows that the semi-automated 3DTEE measurements were comparable to those obtained from CT, although the CT values were minimally larger with mean difference of 1%–4%, which were not significant for area and area-derived diameter, but significant for perimeter and perimeter-derived diameter. However, SD of the difference in area was the largest at 10%, while it was identical at 5% for the other three parameters. Importantly, the inter-technique differences for area and area-derived diameter were not statistically significant. In contrast, the small inter-technique differences in perimeter and perimeter-derived diameter were significant.
FIGURE 4.
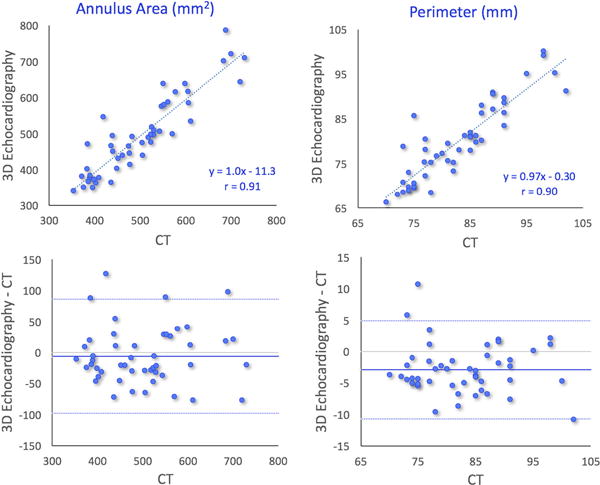
Results of comparisons between 3D transesophageal echocardiography–and multi-detector comuted tomography–based measurements of aortic annulus area (left) and perimeter in 47 patients with aortic stenosis undergoing transcatheter aortic valve replacement: linear regression showing high correlations (top), and Bland-Altman analysis showing minimal biases and limits of agreement <20% of the mean measured value (bottom)
FIGURE 5.
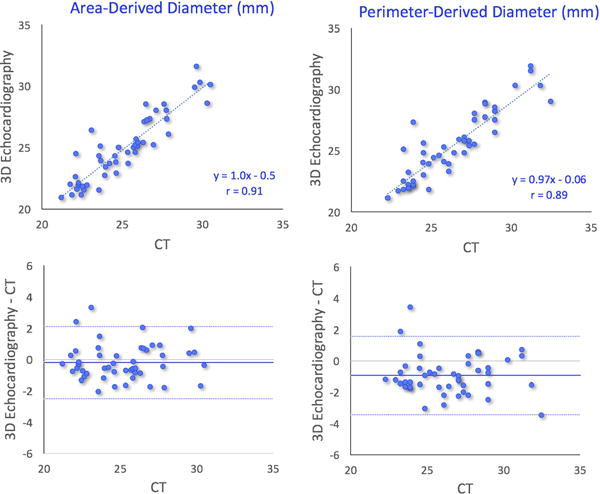
Results of comparisons between 3D transesophageal echocardiography– and multi-detector comuted tomography–based measurements of aortic annulus diameters derived from area (left) and perimeter: linear regression showing high correlations (top), and Bland-Altman analysis showing minimal biases and limits of agreement of the order of magnitude of about 10% of the mean measured value (bottom)
TABLE 2.
MDCT and 3DTEE measurements of the aortic annulus area, perimeter, and derived diameters shown along with inter-technique differences (actual values in line 3 and percent of the mean measured value in line 4). None of the inter-technique differences were statistically significant
| Area (mm2) | Perimeter (mm) | Area-derived diameter (mm) | Perimeter-derived diameter (mm) | |
|---|---|---|---|---|
| MDCT | 504±100 | 83±8 | 25±2 | 26±3 |
| Semi-automated 3D analysis | 498±111 | 80±9 | 25±3 | 25±3 |
| Inter-technique difference | −6.6±46.4 (P=.34) | −3.0±3.9 (P<.001) | −0.2±1.2 (P=.24) | −1.0±1.3 (P<.001) |
| % Difference | −1±10% | −4±5% | −1±5% | −4±5% |
| Mitral valve software | 527±111 | 82±9 | ||
| Inter-technique difference | 23±62 (P=.01) | −0.4±5.5 (P=.61) | ||
| % Difference | 4±12% | −1±7% | ||
| 3D planimetry | 463±108 | |||
| Inter-technique difference | 42±66 (P<.001) | |||
| % Difference | −9±15 |
Data are shown in the same format as the top portion of table, but this time for two subgroups of patients according to the phase of the cardiac cycle at which their computed tomography images were acquired.
MDCT=multi-detector comuted tomography; 3DTEE=three-dimensional transesophageal echocardiography.
These 3DTEE and CT measurements led to the choice of identical valve sizes in 43 of 47 patients, but resulted in a difference of one size in four patients, including two patients in whom 3DTEE suggested a smaller valve than did CT, while in the other two patients, it was the opposite.
Figures 6 and 7 show the results of the same comparisons for the annulus area and perimeter, respectively, in the two subgroups of patients according to the phase of the cardiac cycle at which their CT images were acquired. As expected, comparisons between end-systolic 3DE and end-systolic CT measurements (left panels) correlated slightly better and showed smaller biases than when compared with end-diastolic CT measurements (right panels). Importantly, however, the inter-technique differences in percent of the measured values were very small in both subgroups (Table 3).
FIGURE 6.
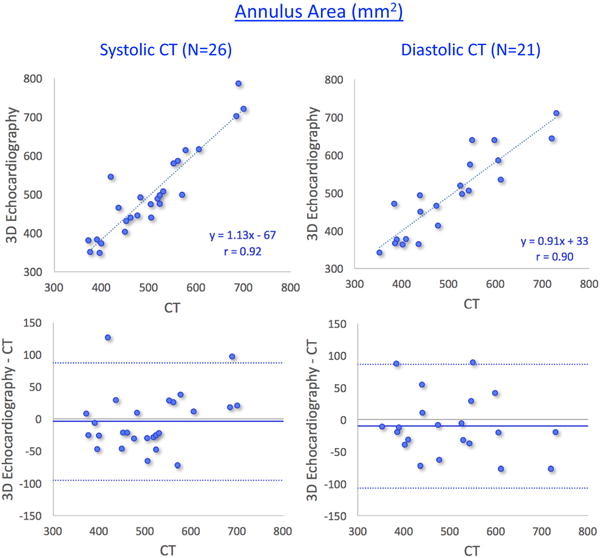
Results of comparisons between 3D transesophageal echocardiography– and multi-detector comuted tomography–based measurements of aortic annulus area in two subgroups of patients: those with systolic computed tomography (CT) measurements (left) and those with diastolic CT measurements (right). See text for details
FIGURE 7.
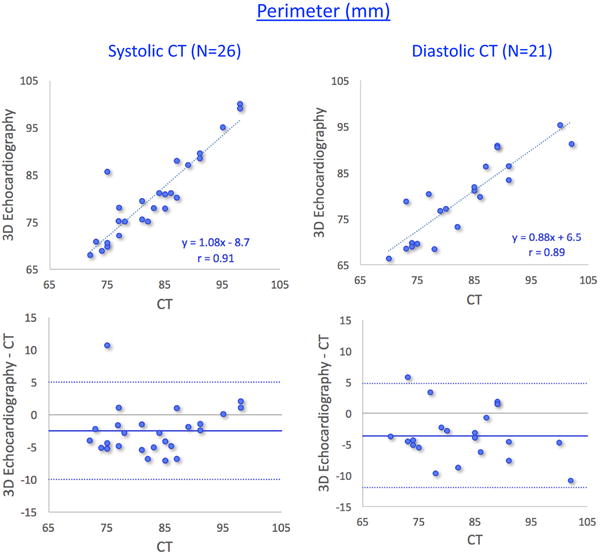
Results of comparisons between 3D transesophageal echocardiography– and multi-detector comuted tomography–based measurements of aortic annulus perimeter in two subgroups of patients: those with systolic computed tomography (CT) measurements (left) and those with diastolic CT measurements (right). See text for details
TABLE 3.
MDCT and 3DTEE measurements of the aortic annulus area, perimeter, and derived diameters, shown along with inter-technique differences (actual values in line 3 and percent of the mean measured value in line 4)
| Area (mm2) | Perimeter (mm) | Area-derived diameter (mm) | Perimeter-derived diameter (mm) | |
|---|---|---|---|---|
| Systolic CT (N=26) | ||||
| MDCT | 506±94 | 83±8 | 25±2 | 26±2 |
| Semi-automated 3D analysis | 502±115 | 80±9 | 25±3 | 26±3 |
| Inter-technique difference | −3.5±45.6 (P=.70) | −2.5±3.7 (P=.003) | −0.1±1.1 (P=.52) | −0.8±1.1 (P=.002) |
| % Difference | −1±9% | −3±5% | −1±5% | −3±5% |
| Diastolic CT (N=21) | ||||
| MDCT | 502±108 | 83±9 | 25±3 | 26±3 |
| Semi-automated 3D analysis | 492±109 | 79±9 | 25±3 | 25±3 |
| Inter-technique difference | −10.4±48.2 (P=.33) | −3.6±4.2 (P<.001) | −0.3±1.2 (P=.31) | −1.1±1.3 (P<.001) |
| % Difference | −2±10% | −4±5% | −1±5% | −4±5% |
MDCT=multi-detector comuted tomography; 3DTEE=three-dimensional transesophageal echocardiography; CT=computed tomography.
Of the three 3D techniques we tested, the new semi-automated approach showed the highest correlations with CT: r=.91, compared to .83 for mitral valve analysis program, and .80 for 3D planimetry for annular area; and r=.90 compared to .79 for annular perimeter measured by the mitral valve program. Table 2 (bottom portion) lists the mean area and perimeter values measured using these 3D techniques, as well as the differences from CT reference in actual units and in percent. Mitral valve software overestimated and 3D planimetry underestimated the aortic annular area (both significantly), whereas mitral valve software measurements of annular perimeter were similar to CT.
Reproducibility analysis resulted in inter- and intra-observer variability values <5% for all CT measurements and the majority (7/8, excluding inter-observer variability for area with 8.4±4.5%) of the new semi-automated 3DTEE measurements (Table 4). For both imaging modalities, inter-observer variability was generally higher than intra-observer variability. The inter-observer variability was higher for 3DTEE compared to CT, while the differences in the intra-observer variability between the two imaging modalities were minimal. In contrast, both in inter- and in intra-observer variability values for the mitral valve software and 3D planimetry measurements of annular area, perimeter, and the derived diameter were higher than both CT and the new semi-automated 3DTEE analysis in the majority of comparisons.
TABLE 4.
Results of reproducibility analysis of MDCT and 3DTEE measurements of the aortic annulus area, perimeter, and derived diameters obtained in a subgroup of 10 study patients
| Area (mm2) | Perimeter (mm) | Area-derived diameter (mm) | Perimeter-derived diameter (mm) | |
|---|---|---|---|---|
| MDCT | ||||
| Inter-observervariability (%) [and ICC] | 4.6±2.5 [.83] | 3.2±1.6 [.74] | 2.3±1.3 [.83] | 3.2±1.6 [.74] |
| Intra-observer variability (%) [and ICC] | 4.6±3.5 [.80] | 1.9±2.1 [.83] | 2.3±1.7 [.80] | 1.9±2.1 [.83] |
| Semi-automated 3D analysis | ||||
| Inter-observer variability (%) [and ICC] | 8.4±4.5 [.70] | 4.2±2.2 [.72] | 4.1±2.2 [.72] | 4.2±2.1 [.71] |
| Intra-observer variability (%) [and ICC] | 4.3±5.6 [.83] | 2.2±2.5 [.85] | 2.1±2.9 [.81] | 2.2±2.5 [.85] |
| Mitral valve software | ||||
| Inter-observer variability (%) [and ICC] | 10.5±7.0 [.64] | 5.7±3.5 [.61] | ||
| Intra-observer variability (%) [and ICC] | 13.8±9.4 [.31] | 7.8±6.8 [.38] | ||
| 3D planimetry | ||||
| Inter-observer variability (%) [and ICC] | 8.0±6.6 [.80] | |||
| Intra-observer variability (%) [and ICC] | 5.7±3.4 [.89] |
Data for inter- and intra-observer variability are shown as absolute differences between pairs of repeated measurements in percent of their mean value.
MDCT=multi-detector comuted tomography; 3DTEE=three-dimensional transesophageal echocardiography; ICC=intra-class correlation coefficient.
4 | DISCUSSION
With the rapidly increasing indications for TAVR and the challenges with contrast CT in elderly patients undergoing treatment for AS, there is a need for an alternative technique for sizing of aortic valve prostheses. In addition, as the use of TAVR is expanding into younger population, the need to reduce radiation exposure will underscore the importance of ultrasound imaging as an alternative in this context. This study showed that a semi-automated aortic valve specific analysis of 3DTEE datasets is both feasible and provides measurements of the annular size that are comparable to contrast CT, indicating that this novel approach provides useful information and may potentially replace preprocedural CT imaging in patients with contraindications to contrast CT.
Although 3DTEE has been shown to favorably compare to CT in several studies that focused on aortic root measurements, previous analysis has been performed with nondedicated software. In contrast, a dedicated aortic valve program, like the one tested in this study, allows for a simpler stepwise analysis that could potentially provide fast and accurate sizing information in real-time, which is critical for optimal workflow and essential for patient outcomes. An important advantage of the approach implemented in software we tested in this study is that it operates in a similar manner to those commonly used to analyze CT images of the aortic root. As a result, it is easy to use and can be quickly learned by cardiac imagers.
In this study, 3D planimetry was relatively inaccurate (Table 3), because it underestimated annular areas. This is probably because of the inherent difficulties with the ability of 2D imaging to reliably depict all three aortic valve cusps simultaneously, precluding correct identification of the true annular plane. The mitral valve software was designed for 3D analysis of the complex bileaflet, saddle-shaped, mitral valve apparatus, and adapted by previous investigators14,17 for aortic valve measurements because of the lack of a dedicated tool. This analysis comprises of multiple steps and is cumbersome, nonintuitive and difficult to learn and operate in the context of aortic valve. As a result, the reproducibility of this analysis is suboptimal. In contrast, the new software was designed to overcome these limitations by specifically tailoring the analysis to the trileaflet aortic valve and thus to improve the simplicity of analysis. This design has resulted in improved accuracy and reproducibility, as noted in this study.
Of note, in a previous study,14 the mitral valve analysis software showed higher correlations with CT reference values for annular area and perimeter than in our study. This is probably related to the fact that this group of investigators has extensive experience with the use of this software in the context of aortic valve. However, our experience with the newly developed aortic valve specific analysis was similar to our experience with the mitral valve analysis, and nevertheless, the new software resulted in higher levels of agreement with CT than the mitral valve software.
While on the average, the semi-automated 3DTEE measurements slightly underestimated annular size compared to CT, as reflected by the negative biases (Table 2), it is important to note that it overestimated annular area in 18 of 47 (38%) and perimeter in 9 of 47 (19%) patients, indicating that systematic underestimation of annular size does not occur in every patient. With the retrospective design of our study, it is impossible to estimate the severity of the regurgitation that this underestimation would have caused, because the size of the prosthesis that was actually implanted was determined based on the CT measurements. Not surprisingly, our subgroup analysis showed that the underestimation was greater in patients in whom end-systolic 3DE measurements were compared to end-diastolic CT measurements. However, the inter-technique (CT vs 3DE) differences were very small in the two subgroups (1%–2% of the measured values); that is, the inconsistent phase of CT reference did not affect the main finding of the study that this new 3DE technique is accurate and seemingly better than the other previously used techniques.
3DTEE imaging of the aortic valve has several inherent limitations relating to motion artifact, calcium, ECG gating, and 3D echo artifacts, which are likely to affect the accuracy of aortic annulus measurements. However, it is reasonable to assume that our study group is representative of patients undergoing TAVR, in whom calcified annuli and valves are common. One of the limitations of our study is that the cardiac phase used for CT measurements was end systole in some of the patients and end diastole in others. Although the retrospectively gated CT datasets could theoretically be remeasured at end systole, the quality of the end-systolic images was suboptimal due to tube current modulation, and we chose to keep the end-diastolic measurements in these patients in order to preserve a high-quality reference. While the differences in some cardiac structures at different times in the cardiac cycle can be substantial, with the aortic root, these changes in diameter are minimal and have been reported to be <5%,18–20 in agreement with our findings. Additionally, the depth of the 3D image acquisition was not standardized, which could account for the higher inter-observer variability with echocardiography. Furthermore, we did not measure and compare the time of analysis for the different techniques, in order to determine which would be the most time efficient. Nevertheless, we would estimate the time analysis to be shorter for the new technique (~1 minute by an experienced reader) compared to 3DQ analysis (~2.5 minute). Finally, our study group was relatively small and from a single-center, warranting additional studies to validate this type of software.
5 | CONCLUSION
Novel semi-automated 3D echocardiographic analysis software specially designed for the aortic root can accurately measure aortic annulus in patients with severe AS, similar to contrast CT. These findings may have clinical implications in terms of prosthesis sizing in patients undergoing TAVR, especially those in whom contrast CT could be harmful.
References
- 1.Nishimura RA, Otto CM, Bonow RO, et al. 2014 AHA/ACC guideline for the management of patients with valvular heart disease: executive summary: a report of the American College of Cardiology/American Heart Association Task Force on Practice Guidelines. Circulation. 2014;129:2440–2492. doi: 10.1161/CIR.0000000000000029. [DOI] [PubMed] [Google Scholar]
- 2.American College of Cardiology/American Heart Association Task Force on Practice Guidelines, Society of Cardiovascular Anesthesiologists, Society for Cardiovascular Angiography and Interventions et al. ACC/AHA 2006 guidelines for the management of patients with valvular heart disease: a report of the American College of Cardiology/American Heart Association Task Force on Practice Guidelines (writing committee to revise the 1998 Guidelines for the Management of Patients With Valvular Heart Disease): developed in collaboration with the Society of Cardiovascular Anesthesiologists: endorsed by the Society for Cardiovascular Angiography and Interventions and the Society of Thoracic Surgeons. Circulation. 2006;114:e84–e231. doi: 10.1161/CIRCULATIONAHA.106.176857. [DOI] [PubMed] [Google Scholar]
- 3.Nkomo VT, Gardin JM, Skelton TN, Gottdiener JS, Scott CG, Enriquez-Sarano M. Burden of valvular heart diseases: a population-based study. Lancet. 2006;368:1005–1011. doi: 10.1016/S0140-6736(06)69208-8. [DOI] [PubMed] [Google Scholar]
- 4.Carabello BA, Paulus WJ. Aortic stenosis. Lancet. 2009;373:956–966. doi: 10.1016/S0140-6736(09)60211-7. [DOI] [PubMed] [Google Scholar]
- 5.Adams DH, Popma JJ, Reardon MJ, et al. Transcatheter aortic-valve replacement with a self-expanding prosthesis. N Engl J Med. 2014;370:1790–1798. doi: 10.1056/NEJMoa1400590. [DOI] [PubMed] [Google Scholar]
- 6.Leon MB, Smith CR, Mack MJ, et al. Transcatheter or surgical aortic-valve replacement in intermediate-risk patients. N Engl J Med. 2016;374:1609–1620. doi: 10.1056/NEJMoa1514616. [DOI] [PubMed] [Google Scholar]
- 7.Smith CR, Leon MB, Mack MJ, et al. Transcatheter versus surgical aortic-valve replacement in high-risk patients. N Engl J Med. 2011;364:2187–2198. doi: 10.1056/NEJMoa1103510. [DOI] [PubMed] [Google Scholar]
- 8.Altiok E, Koos R, Schroder J, et al. Comparison of two-dimensional and three-dimensional imaging techniques for measurement of aortic annulus diameters before transcatheter aortic valve implantation. Heart. 2011;97:1578–1584. doi: 10.1136/hrt.2011.223974. [DOI] [PubMed] [Google Scholar]
- 9.Ng AC, Delgado V, van der Kley F, et al. Comparison of aortic root dimensions and geometries before and after transcatheter aortic valve implantation by 2- and 3-dimensional transesophageal echocardiography and multislice computed tomography. Circ Cardiovasc Imaging. 2010;3:94–102. doi: 10.1161/CIRCIMAGING.109.885152. [DOI] [PubMed] [Google Scholar]
- 10.Calleja A, Thavendiranathan P, Ionasec RI, et al. Automated quantitative 3-dimensional modeling of the aortic valve and root by 3-dimensional transesophageal echocardiography in normals, aortic regurgitation, and aortic stenosis: comparison to computed tomography in normals and clinical implications. Circ Cardiovasc Imaging. 2013;6:99–108. doi: 10.1161/CIRCIMAGING.112.976993. [DOI] [PubMed] [Google Scholar]
- 11.Binder RK, Webb JG, Willson AB, et al. The impact of integration of a multidetector computed tomography annulus area sizing algorithm on outcomes of transcatheter aortic valve replacement: a prospective, multicenter, controlled trial. J Am Coll Cardiol. 2013;62:431–438. doi: 10.1016/j.jacc.2013.04.036. [DOI] [PubMed] [Google Scholar]
- 12.Jilaihawi H, Doctor N, Kashif M, et al. Aortic annular sizing for transcatheter aortic valve replacement using cross-sectional 3-dimensional transesophageal echocardiography. J Am Coll Cardiol. 2013;61:908–916. doi: 10.1016/j.jacc.2012.11.055. [DOI] [PubMed] [Google Scholar]
- 13.Gripari P, Ewe SH, Fusini L, et al. Intraoperative 2D and 3D transoesophageal echocardiographic predictors of aortic regurgitation after transcatheter aortic valve implantation. Heart. 2012;98:1229–1236. doi: 10.1136/heartjnl-2012-301998. [DOI] [PubMed] [Google Scholar]
- 14.Khalique OK, Kodali SK, Paradis JM, et al. Aortic annular sizing using a novel 3-dimensional echocardiographic method: use and comparison with cardiac computed tomography. Circ Cardiovasc Imaging. 2014;7:155–163. doi: 10.1161/CIRCIMAGING.113.001153. [DOI] [PubMed] [Google Scholar]
- 15.Achenbach S, Delgado V, Hausleiter J, Schoenhagen P, Min JK, Leipsic JA. SCCT expert consensus document on computed tomography imaging before transcatheter aortic valve implantation (TAVI)/transcatheter aortic valve replacement (TAVR) J Cardiovasc Comput Tomogr. 2012;6:366–380. doi: 10.1016/j.jcct.2012.11.002. [DOI] [PubMed] [Google Scholar]
- 16.Lang RM, Badano LP, Mor-Avi V, et al. Recommendations for cardiac chamber quantification by echocardiography in adults: an update from the American Society of Echocardiography and the European Association of Cardiovascular Imaging. J Am Soc Echocardiogr. 2015;28:1–39 e14. doi: 10.1016/j.echo.2014.10.003. [DOI] [PubMed] [Google Scholar]
- 17.Hahn RT, Khalique O, Williams MR, et al. Predicting paravalvular regurgitation following transcatheter valve replacement: utility of a novel method for three-dimensional echocardiographic measurements of the aortic annulus. J Am Soc Echocardiogr. 2013;26:1043–1052. doi: 10.1016/j.echo.2013.07.004. [DOI] [PubMed] [Google Scholar]
- 18.de Heer LM, Budde RP, Mali WP, de Vos AM, van Herwerden LA, Kluin J. Aortic root dimension changes during systole and diastole: evaluation with ECG-gated multidetector row computed tomography. Int J Cardiovasc Imaging. 2011;27:1195–1204. doi: 10.1007/s10554-011-9838-x. [DOI] [PMC free article] [PubMed] [Google Scholar]
- 19.Kim WK, Meyer A, Mollmann H, et al. Cyclic changes in area- and perimeter-derived effective dimensions of the aortic annulus measured with multislice computed tomography and comparison with metric intraoperative sizing. Clin Res Cardiol. 2016;105:622–629. doi: 10.1007/s00392-016-0971-3. [DOI] [PubMed] [Google Scholar]
- 20.Murphy DT, Blanke P, Alaamri S, et al. Dynamism of the aortic annulus: effect of diastolic versus systolic CT annular measurements on device selection in transcatheter aortic valve replacement (TAVR) J Cardiovasc Comput Tomogr. 2016;10:37–43. doi: 10.1016/j.jcct.2015.07.008. [DOI] [PubMed] [Google Scholar]


