Significance
Leucine-rich glioma-inactivated 1 (LGI1) is a secreted neuronal protein associated in a multiprotein complex with Kv1 channels. Natural mutations in this protein are found in the early-adulthood–onset disorder “autosomal dominant epilepsy with auditory features” and animal models with Lgi1 genetic deletion display spontaneous seizures. We investigated the potential link between LGI1 depletion and intrinsic neuronal excitability. We found that LGI1 determines neuronal excitability in CA3 pyramidal neurons through the control of axonal Kv1-channel expression. Genetic deletion of Lgi1 induces a robust diminution in Kv1 channels, especially in axons where they colocalize with LGI1, very likely contributing to epileptogenesis. These results strongly suggest that LGI1 controls neuronal excitability by regulating Kv1-channel expression.
Keywords: LGI1, Kv1 channels, D-type current, intrinsic excitability, epilepsy
Abstract
Autosomal dominant epilepsy with auditory features results from mutations in leucine-rich glioma-inactivated 1 (LGI1), a soluble glycoprotein secreted by neurons. Animal models of LGI1 depletion display spontaneous seizures, however, the function of LGI1 and the mechanisms by which deficiency leads to epilepsy are unknown. We investigated the effects of pure recombinant LGI1 and genetic depletion on intrinsic excitability, in the absence of synaptic input, in hippocampal CA3 neurons, a classical focus for epileptogenesis. Our data indicate that LGI1 is expressed at the axonal initial segment and regulates action potential firing by setting the density of the axonal Kv1.1 channels that underlie dendrotoxin-sensitive D-type potassium current. LGI1 deficiency incurs a >50% down-regulation of the expression of Kv1.1 and Kv1.2 via a posttranscriptional mechanism, resulting in a reduction in the capacity of axonal D-type current to limit glutamate release, thus contributing to epileptogenesis.
In autosomal dominant epilepsy with auditory features (ADEAF), lateral temporal seizures are accompanied by acoustic aura or are triggered by auditory stimuli. ADEAF results from mutations in leucine-rich glioma-inactivated 1 (LGI1), a soluble glycoprotein secreted by neurons (1, 2). Most ADEAF mutations impair secretion of the protein (3, 4). Animal models of LGI1 depletion, including Lgi1−/− mice (5–8), mutant rats (9), and knockdown in zebrafish (10), all display spontaneous seizures. However, the mechanisms by which LGI1 deficiency leads to epilepsy are unknown. Analysis of glutamatergic neurotransmission in hippocampal slices from Lgi1−/− mice has yielded conflicting reports. Furthermore LGI1 has been implicated in neural development, and perturbed maturation may thus contribute to the epileptic phenotype (11–13).
In addition to the role of LGI1 in familial epilepsy, a second line of evidence implicates LGI1 in autoimmune seizures and suggests a link with voltage-gated K+ channels (VGKCs). Anti-LGI1 autoantibodies occur in a subset of patients with limbic encephalitis (LE), who display epilepsy and psychiatric symptoms (14, 15). This subset was initially identified by the presence of serum antibodies that immunoprecipitate a VGKC complex labeled with 125I-α dendrotoxin (16, 17), a ligand which binds to channels containing Kv1.1, Kv1.2, or Kv1.6 subunits (18). Immunoprecipitation of the VGKC by LE sera is mainly due to an anti-LGI1 antibody specificity (14, 15), consistent with association of LGI1 with Kv1 channels in a multiprotein complex (19), containing ADAM22 and -23, MAGUKs, Caspr2, and contactin2 (6, 14, 19, 20).
However, whereas some evidence supports a link between LGI1 and K+ channels, other functions for LGI1 have been proposed and the precise mechanisms by which LGI1 depletion results in epilepsy are still unclear. Analysis of glutamatergic neurotransmission in hippocampal slices from Lgi1−/− mice has yielded conflicting evidence, as both enhanced excitatory transmission (7, 21) and reduced AMPA receptor function (6, 22, 23) have been reported.
We have investigated the effects of both supplementation with pure LGI1 and genetic depletion on the intrinsic excitability of hippocampal CA3 neurons, in the absence of synaptic input. Our data indicate that LGI1 regulates action potential firing by setting the density of the axonal Kv1.1 channels that underlie dendrotoxin-sensitive D-type potassium current. LGI1 deficiency results in a reduction in the capacity of presynaptic D-type current to limit glutamate release, thus contributing to epileptogenesis.
Results
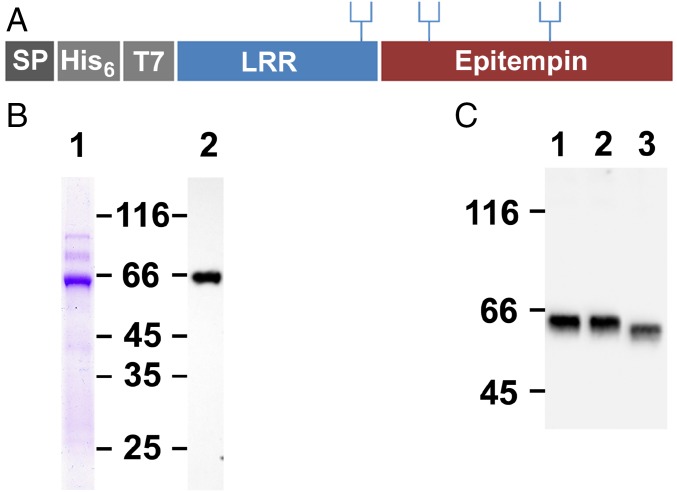
In the present report we addressed the effects of LGI1 on intrinsic electrical excitability in the CA3 region of the hippocampus, a classical focus of epileptogenesis. The complete LGI1 coding sequence, with N-terminal His6 and T7 tags (Fig. 1A), was expressed in sf9 insect cells using the baculovirus system. Affinity purification yielded LGI1 at about 90% purity (Fig. 1B). Western blotting revealed a single band reactive with anti-LGI1 (Fig. 1B) and anti-T7 antibody (Fig. 1C). Treatment with peptide-N-glycosidase F (PNGaseF) (Fig. 1C) confirmed N-glycosylation.
Fig. 1.
Recombinant expression of LGI1. (A) Schematic representation of recombinant glycosylated LGI1 with signal peptide SP, His6, and T7 tags, leucine-rich region (LRR), and epitempin domain. (B) SDS/PAGE of purified LGI1: Coomassie blue-stained LGI1 (lane 1; 1 μg) and Western blot (0.1 μg) probed with anti-LGI1 (lane 2). (C) Western blots of 0.1 μg of purified LGI1 (lane 1) incubated in PNGase buffer (lanes 2 and 3) in the absence (lane 2) or presence of PNGase (lane 3) probed with anti-T7 antibody. To optimize protein resolution, the gel in C was run for a longer time than in B.
Exogenous LGI1 Reduces Intrinsic Excitability in CA3 Neurons.
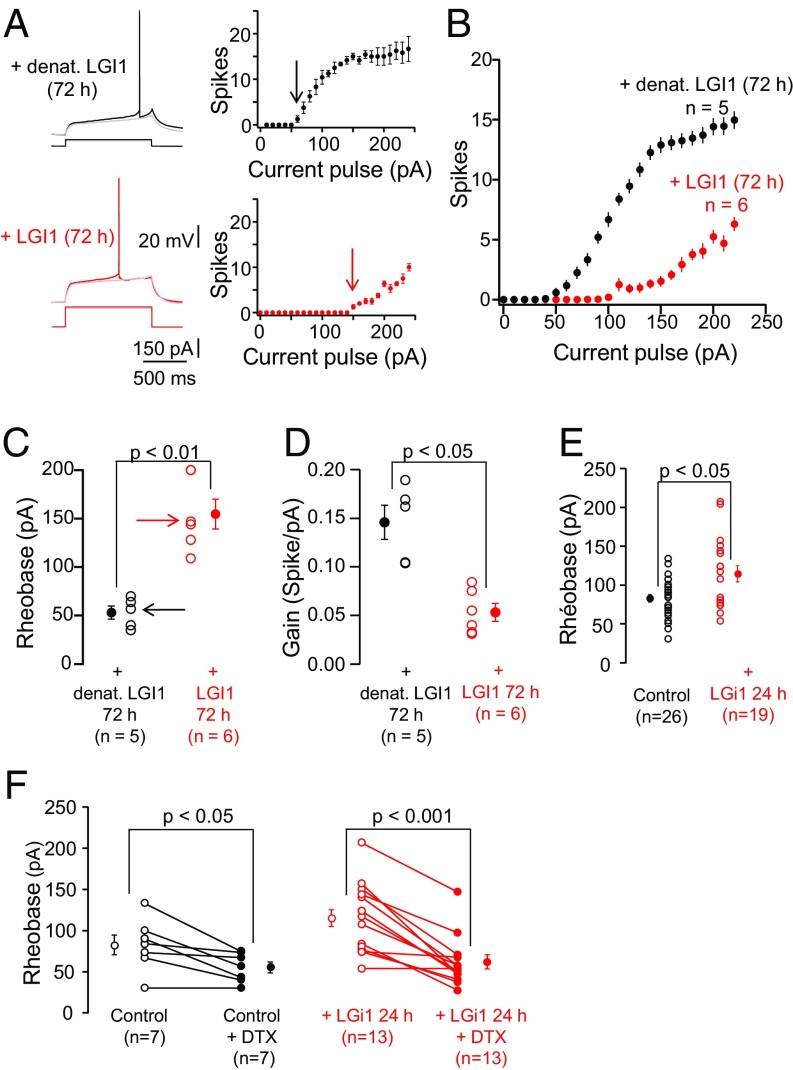
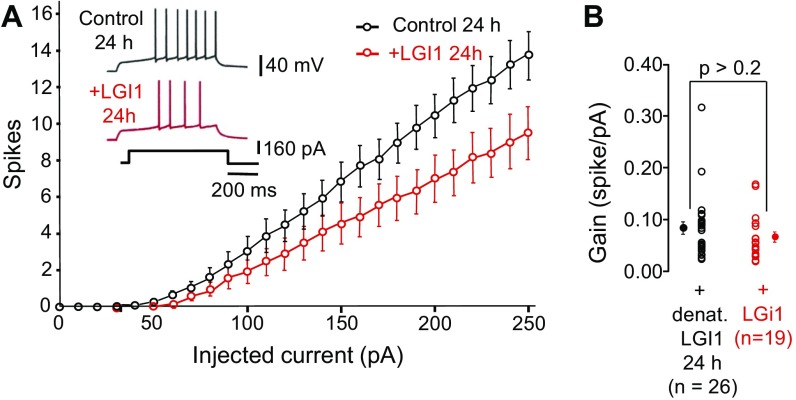
Patch clamp recording was performed to determine whether recombinant LGI1 (rLGI1) modified intrinsic excitability. Organotypic rat hippocampal slice cultures were incubated with rLGI1 and the excitability of CA3 neurons was assessed under current clamp by counting the number of action potentials generated by current injections of increasing intensity, in the presence of blockers of glutamatergic (kynurenate) and GABAergic (picrotoxin) synaptic transmission. Neurons incubated with LGI1 for 72 h displayed a robust decrease in excitability (Fig. 2 A and B), with a significant increase in rheobase (Fig. 2C, 155 ± 15 pA with 100 nM LGI1, vs. a control value with heat-denatured LGI1 = 53 ± 7 pA, P < 0.01) and decrease in gain (Fig. 2D, 0.05 ± 0.009 vs. 0.14 ± 0.02, P < 0.05). Treatment for 24 h with 100 nM LGI1 also decreased excitability (Fig. S1A) and yielded a significant increase in rheobase (Fig. 2E, 114 ± 10 pA vs. 83 ± 5 pA, P < 0.05), but with no modification of the gain (Fig. S1B). The dendrotoxin-sensitive D-type potassium current contributes to setting intrinsic excitability (24) in many types of neurons. In both control and LGI1-treated cultures, bath application of the selective Kv1.1 antagonist DTX-K reduced the rheobase to a similar baseline value of ∼50 pA (Fig. 2F). Thus, exogenous LGI1 generates a DTX-sensitive increment in the rheobase, suggesting that LGI1 attenuates the excitability of CA3 neurons by increasing D-type potassium current.
Fig. 2.
Exogenous LGI1 reduces the intrinsic excitability of hippocampal CA3 neurons. (A) Representative neurons from rat hippocampal slice cultures, treated for 72 h with 100 nM heat-denatured (Top) or native (Bottom) LGI1, recorded under current clamp. (Right) Input–output curves illustrating the number of action potentials elicited plotted against injected current for each neuron. Gray and pink traces represent maximal injected currents that did not elicit an action potential and the corresponding responses upon treatment with native and denatured LGI1, respectively. Black and red arrows indicate threshold currents. (B) Averaged input–output curves. (C) Rheobase; arrows indicate representative neurons in A. (D) Gain in WT and Lgi1−/−. (E) Rheobase of neurons treated ±100 nM LGI1 for 24 h. (F) In some cells DTX-K (100 nM) was bath applied and the effects on rheobase were determined. Error bars represent SEM.
Fig. S1.
Effect of recombinant LGI1 applied for 24 h in rat CA3 neurons. (A) Input–output curves for CA3 neurons treated for 24 h with LGI1 (red) and heat-denatured LGI1 (black). Note the decrease in excitability in LGI1. (B) Lack of effect on the gain. Error bars represent SEM. denat., condition using denatured LGI1.
Increased Intrinsic Neuronal Excitability in Lgi1−/− Animals.
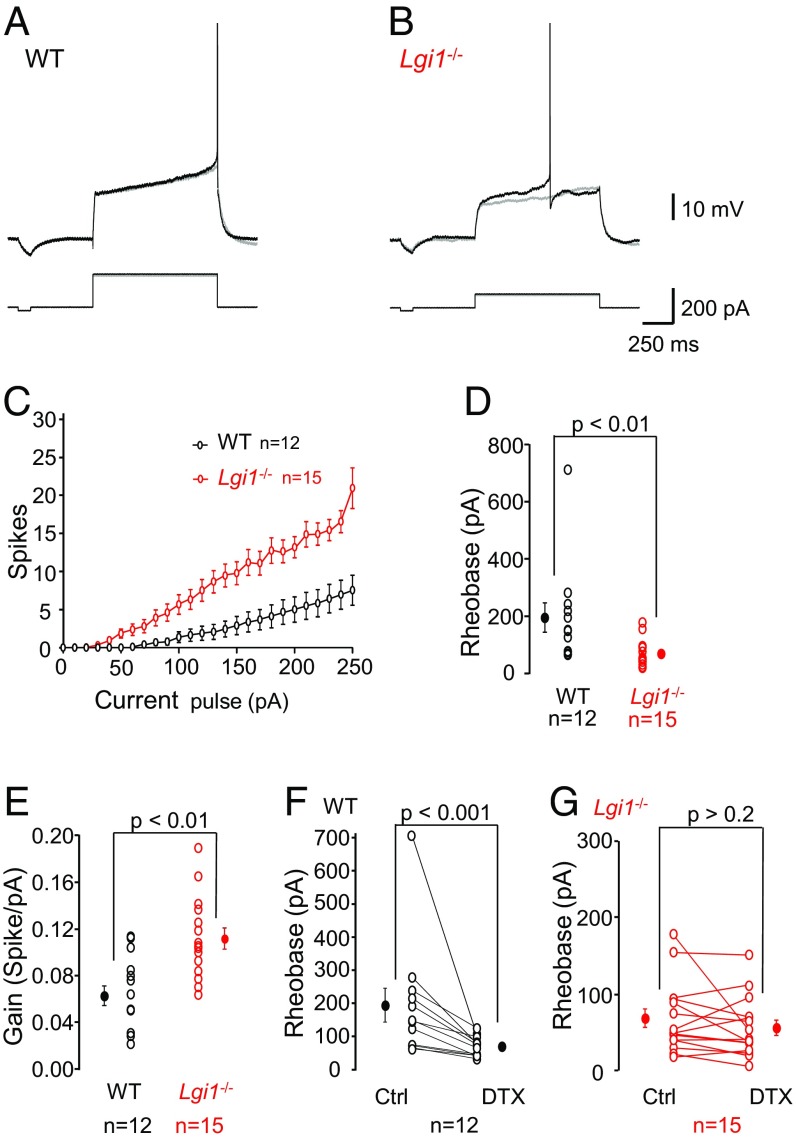
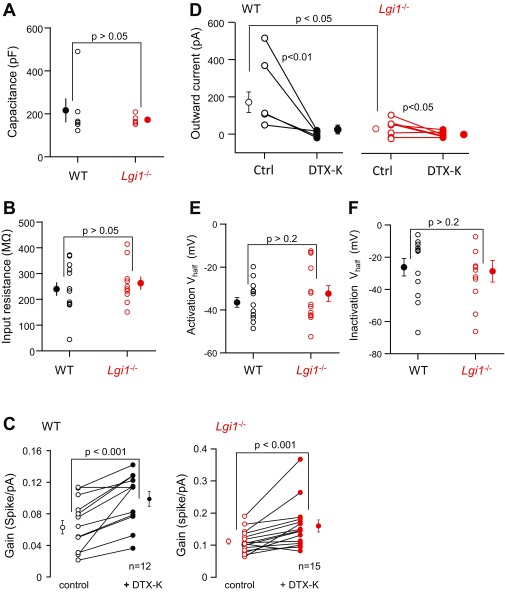
We next asked whether genetic depletion of LGI1 leads to a reduction in D-type current. The intrinsic excitability of CA3 neurons was compared in hippocampal slice cultures from Lgi1-null vs. WT mice. Current clamp recordings (Fig. 3) revealed a robust increase in excitability in Lgi1−/− neurons. Evoked spikes in WT neurons were preceded by a slowly depolarizing ramp (Fig. 3A), which is the signature of D-type current. In contrast, action potentials in Lgi1−/− neurons (Fig. 3B) were elicited at lower current intensities and often triggered at the beginning of the pulse. Analysis confirmed first that there was no significant difference in capacitance or input resistance in WT vs. Lgi1−/− neurons (Fig. S2 A and B). However, a strong increase in the intrinsic excitability of CA3 neurons was measured in Lgi1−/− mice (Fig. 3C), with an almost threefold reduction in rheobase (Fig. 3D) (Lgi1−/− = 68 ± 12 pA vs. WT = 195 ± 51 pA) and an approximately twofold increase in gain (Fig. 3E) (Lgi1−/− = 0.11 ± 0.01 spike/pA vs. WT = 0.06 ± 0.01 spike/pA). We next determined the contribution of D-type currents to these parameters. While DTX-K reduced the rheobase by about 50% in WT littermate mice (Fig. 3F), it had no significant effect in Lgi1-null mice (Fig. 3G). However, DTX-K application induced an ∼50% increase in gain in both WT and Lgi1−/− neurons (Fig. S2 C and D).
Fig. 3.
Increased intrinsic excitability in CA3 neurons from Lgi1−/− mice. (A and B) Representative traces from CA3 neurons of (A) WT and (B) Lgi1−/− mice. Gray traces represent maximal injected currents that did not elicit an action potential and the corresponding responses in WT and Lgi1−/− cells. (C) The number of evoked action potentials was plotted against injected current and the (D) rheobase and (E) gain were calculated. (F and G) The effects of DTX-K (100 nM) on the rheobase in (F) WT and (G) Lgi1−/− neurons were determined. Error bars represent SEM. Ctrl, recording conditions in the absence of DTX.
Fig. S2.
Comparison of electrophysiological parameters in WT and Lgi1−/− neurons. (A and B) No change in capacitance (A) nor in input resistance (B) were observed between WT and Lgi1−/− neurons. (C) DTX-K increased equally the gain in WT and Lgi1−/− neurons. (D) Comparison of the outward currents evoked by a step to −30 mV in WT and Lgi1−/− neurons. Ctrl, control. Note the strong decrease of the outward current in the presence of DTX-K. (E and F) Comparison of steady-state half-activation and half-inactivation of the DTX-K–sensitive current in WT and Lgi1−/− neurons. Error bars represent SEM.
Modification of D-Type Potassium Conductance in Lgi1−/− Background.
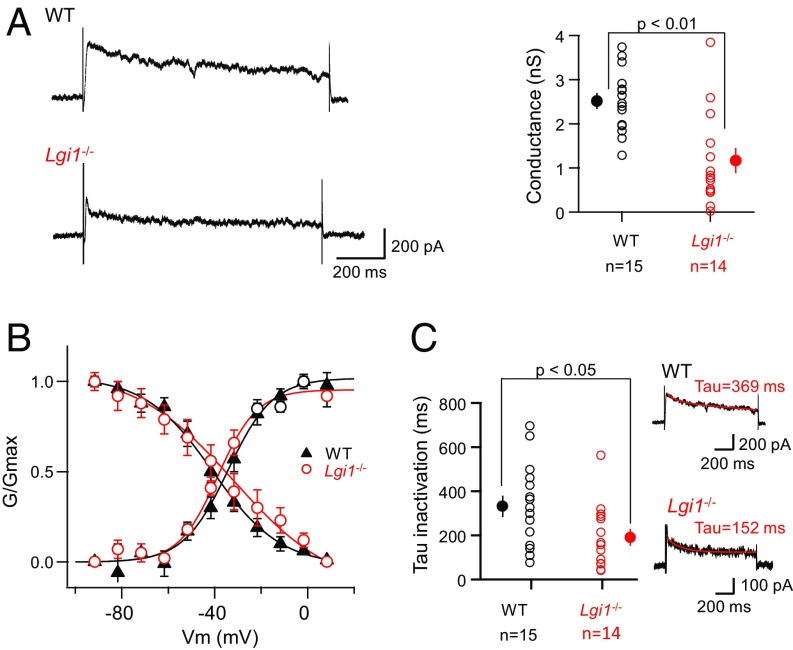
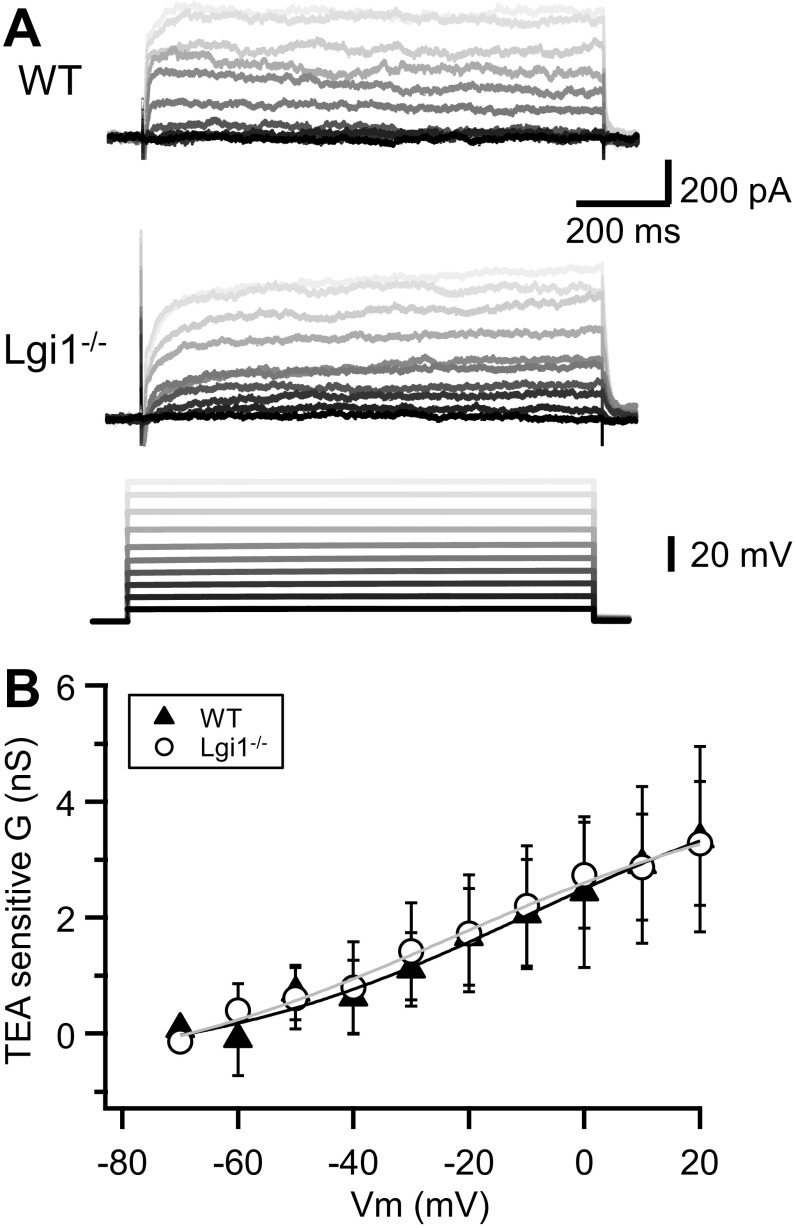
To determine the effects of LGI1 depletion on D-type current more directly, CA3 neurons were recorded in the voltage-clamp mode, and potassium currents were evoked by 10-mV steps from −80 to +10 mV, before and after the addition of DTX-K (Fig. 4). WT neurons displayed slowly inactivating D-type currents (188 ± 51 pA, n = 6, at −30 mV), that were robustly blocked by DTX-K (Fig. S2D). In contrast, outward currents in Lgi1-null neurons (Fig. S2D) were significantly weaker (41 ± 11 pA, n = 8, P < 0.05), but still revealed a small DTX-sensitive component. Analysis of the biophysical properties of the DTX-sensitive component of the outward current in Lgi1−/− vs. WT neurons did not reveal significant difference in the steady-state activation or inactivation parameters (Fig. 4B and Fig. S2 E and F). In contrast to tetraethylammonium (TEA)-sensitive currents that did not significantly change between WT and Lgi1−/− neurons (Fig. S3), DTX-sensitive conductance at −30 mV was significantly reduced in LGI1-null neurons (Fig. 4A, from 2.5 ± 0.2 nS, n = 15–1.2 ± 0.3 nS, n = 14, Mann–Whitney U test P < 0.01). Furthermore the D-type current inactivated more rapidly than in WT cells (Fig. 4C), displaying an approximately twofold decrease in tau inactivation.
Fig. 4.
Reduced D-type conductance in Lgi1−/− neurons. (A, Left) Representative traces of D-type current evoked by a voltage step to −30 mV in CA3 neurons from WT (Upper) and Lgi1−/− (Lower) mice. (Right) Comparison of the conductance in WT and Lgi1−/− mice. (B) Steady-state inactivation properties in WT and Lgi1−/− mice. (C) Inactivation kinetics of the D-current were compared. Red, fit curves generated using the following formula: [y = A∞ + (A0 − A∞)*e(−t/tau)] where A∞, the calculated amplitude after infinite time in picoamperes ; A0, initial amplitude value in picoamperes; t, time in milliseconds; tau, time constant in milliseconds (with A∞ = 168 pA and A0 = 358 pA in WT and A∞ = 85 pA and A0 = 177 pA in Lgi1−/−). Error bars represent SEM.
Fig. S3.
TEA-sensitive current is not affected in Lgi1−/− neurons. (A) Family of TEA-sensitive voltage-gated currents in neurons from WT (Top) and Lgi1−/− (Middle) mice evoked by depolarizing steps from −80 to +20 mV (Bottom). (B) Plot of the TEA-sensitive conductance in neurons from WT and Lgi1−/− mice. No difference was observed between the two groups. Error bars represent SEM.
Decrease in Kv1 Protein Expression in Lgi1−/− Neurons.
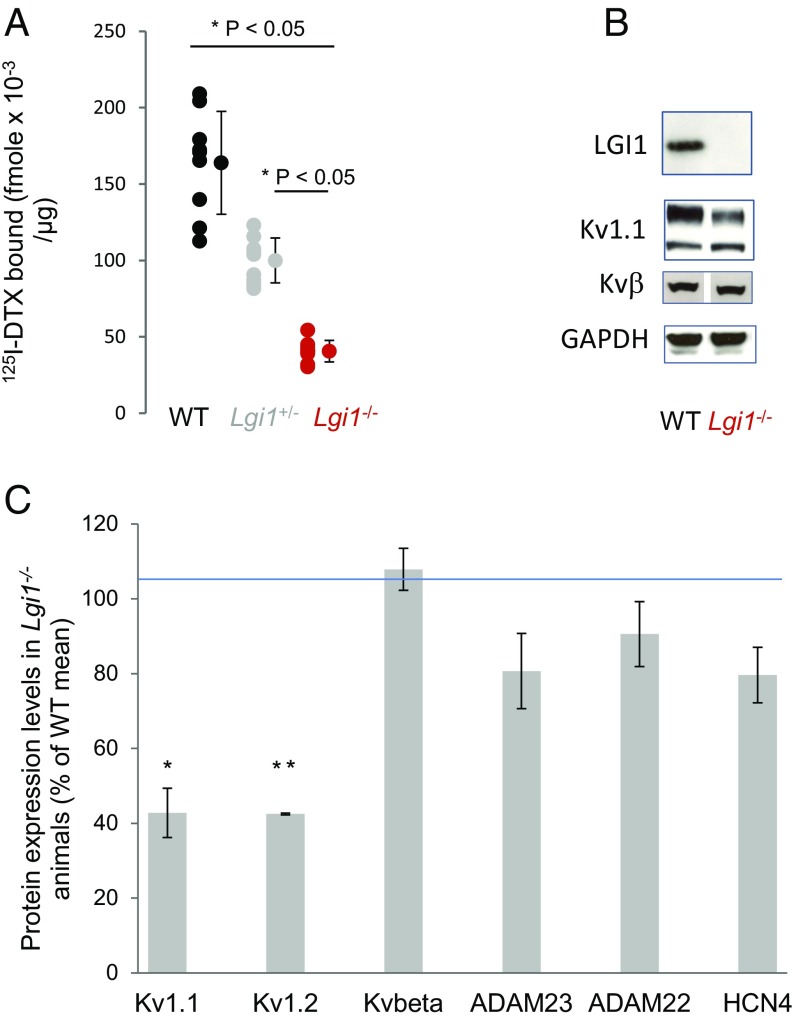
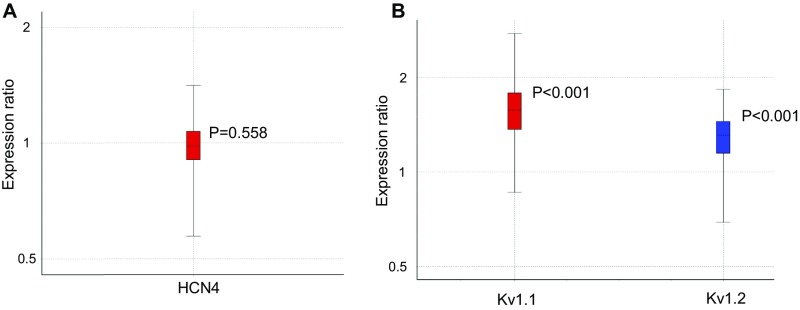
To confirm the hypothesis that Lgi1−/− mice show reduced K+-channel expression at the cell membrane, 125I-αDTX binding experiments were carried out on crude synaptosomal (P2) membrane fractions from the brains of Lgi1+/+, +/−, and −/− mice (Fig. 5A). Membranes were incubated with 0.1 nM 125I-αDTX alone or in the presence of 0.1 μM DTX-K. Membranes from LGI1-null mice showed a 75% reduction in specific binding, whereas heterozygotes displayed an ∼40% decrease. Western blotting of brain homogenates (Fig. 5 B and C) was carried out for VGKC subunits and associated proteins, using GAPDH as a loading control. They were consistent with a marked decrease (>50%) in the total expression of Kv1.1 and Kv1.2α subunits. In contrast, the expression of Kvβ subunits, ADAM22, ADAM23, or the unassociated ion channel subunit HCN4, were unaffected. qPCR analysis of HCN4 mRNA expression [normalization with hypoxanthine phosphoribosyltransferase (HPRT)] showed no change in Lgi1 knockout mice (Fig. S4A). Using HPRT and HCN4 as stable normalizing genes, Kv1.1 and Kv1.2 transcript levels showed a limited however significant (REST 2009 software) increase (FC = 1.535; P < 0.001 and FC = 1.276; P < 0.001, respectively) in Lgi1-null mice compared with WT controls (Fig. S4B). Thus, the observed decrease in Kv1.1 and Kv1.2 protein expression is not a consequence of transcriptional down-regulation.
Fig. 5.
Reduced Kv1.1 expression in Lgi1−/−. (A) Specific binding of 0.1 nM 125I-DTX to brain P2 membranes, determined in the presence or absence of 0.1 µM DTX-K. (B) Representative blots and (C) quantification of protein expression in postnuclear brain homogenates. *P ≤ 0.05, **P ≤ 0.01. Error bars represent SD.
Fig. S4.
qPCR analysis of Kv1.1 and Kv1.2 expression in Lgi1−/−. (A and B) Statistical Rest 2009 whisker plot representing the (A) expression ratio of HCN4 mRNA between WT and Lgi1−/− mice using HPRT as control mRNA and (B) expression ratio of Kv1.1 and Kv1.2 mRNA between WT and Lgi1−/− mice using HCN4 and HPRT as control mRNAs. Error bars represent SD.
Axonal Distribution of Kv1.1 and LGI1.
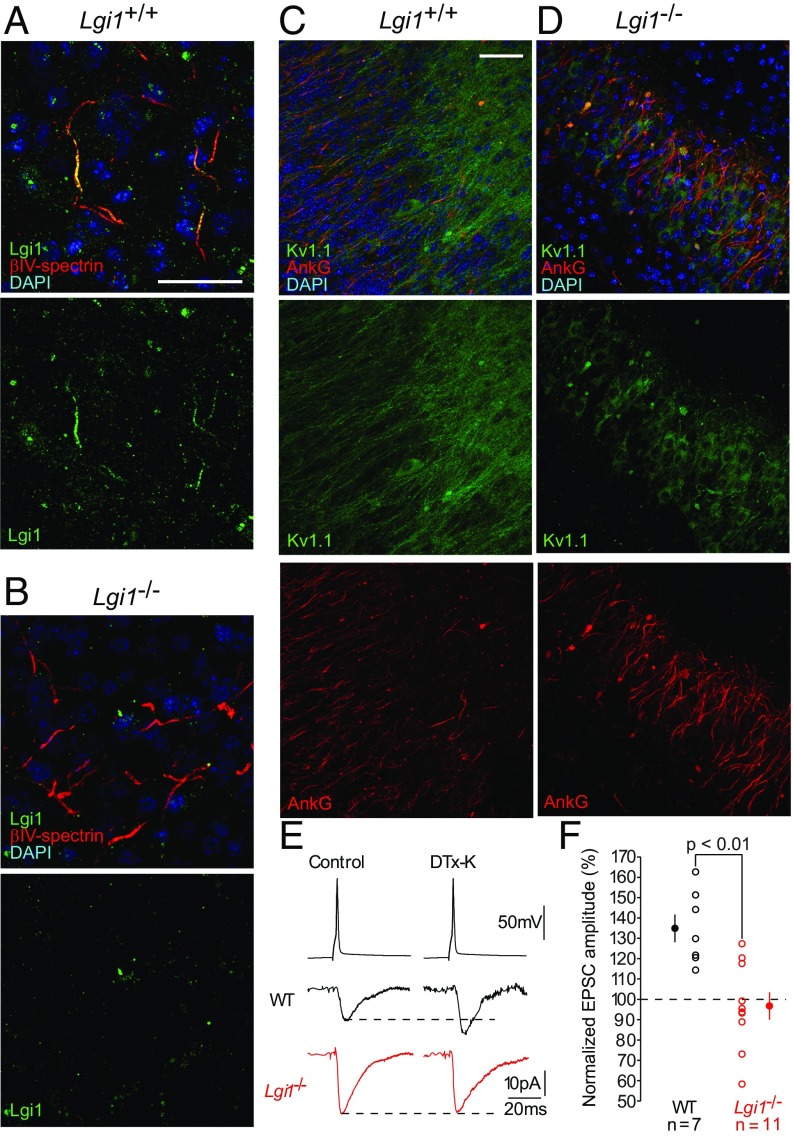
LGI1 is a soluble protein that interacts with membranes by binding to its receptors ADAM22, ADAM23 (22), and NogoR (11). Previous investigation underlined a postsynaptic localization for ADAM22 (22), difficult to reconcile with the view that LGI1 sets the density of axonal Kv1.1 channels (25). However, recent studies in myelinated axons indicated that ADAM22 associates with Kv1 channels at axonal initial segments and juxtaparanodes (20). To clarify the site of action of LGI1, we analyzed its subcellular distribution in hippocampal CA3 sections from Lgi1+/+ and Lgi1−/− mice. Fig. 6A illustrates colocalization of immunostaining for LGI1 (green) and βIV spectrin (red), a marker of axonal initial segments (AISs). In Lgi1−/− mice (Fig. 6B), only background staining for LGI1 was detected. Similar results were obtained in cortex (Fig. S5A). LGI1 is thus principally expressed in AISs. In contrast, in the CA3 of Lgi1+/+ mice, Kv1.1 (green) was present in both neuronal soma, ankyrin G-positive (red) AISs, and along the axons (Fig. 6C). In Lgi1-null mice, the axonal expression of Kv1.1 was strongly reduced and mainly detected in the soma (Fig. 6D).
Fig. 6.
Axonal LGI1 regulates excitatory neurotransmission via presynaptic D-type current. (A and B) Representative images from WT and Lgi1−/− brain sections. (A and B) CA3 neurons from WT and Lgi1−/− animals stained with antibodies against the axon initial segment marker βIV-spectrin (red) and LGI1 (green). (Scale bar, 50 µm.) LGI1 staining is detected at axon initial segment in WT mice, whereas no staining is detected in Lgi1−/−. (C and D) CA3 region in WT (C) and Lgi1−/− slices (D) stained with antibodies against the axon initial segment marker ankyrinG (red) and Kv1.1 (green). (Scale bar, 100 µm.) (E and F) Representative synaptic recordings from paired CA3 neurons to evaluate the effects of DTX-K on EPSC amplitude in WT and Lgi1−/− animals (E) and data analysis (F). Error bars represent SEM.
Fig. S5.
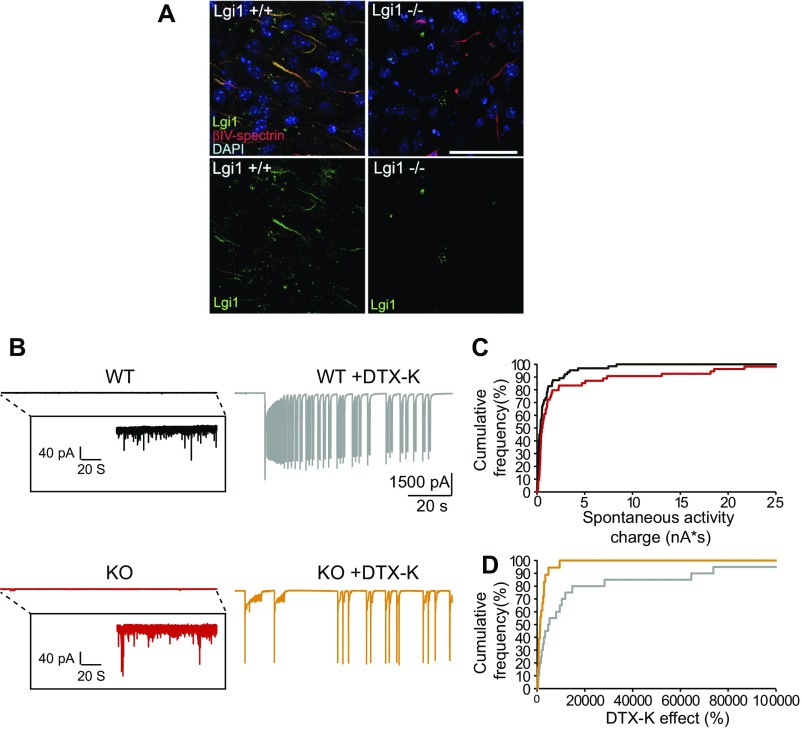
DTX-K differentially enhances spontaneous EPSC activity in WT compared with Lgi1−/− neurons. (A) Cortical sections were stained with DAPI and antibodies against the axon initial segment marker βIV-spectrin (red) and LGI1 (green). (Scale bar, 50 μm.) LGI1 staining is detected at axon initial segment in WT mice, whereas no staining is detected in Lgi1−/−. (B, Left) Comparison of recordings from WT and Lgi1−/− (note the greater spontaneous activity in the Lgi1−/−). (Right) DTX-K induced a much stronger increase in spontaneous currents in WT compared with Lgi1−/− neurons. (C) Comparison of the inward synaptic charge in WT (black) and Lgi1−/− (red) neurons. Note the larger spontaneous activity in Lgi1−/− compared with WT that is seen as a rightward shift in the cumulative frequency plot (P < 0.01, Mann–Whitney U test). (D) Comparison of the enhancement of synaptic drive induced by 100 nM DTX-K in WT vs. Lgi1−/− (P < 0.01, Mann–Whitney U test). Note the larger increase in activity induced by DTX-K in WT compared with Lgi1−/− seen as a rightward shift in the cumulative frequency plot.
Boillot et al. recently reported that LGI1 acts presynaptically as a negative modulator of excitatory synaptic transmission during early postnatal development (21). Pharmacological blockade of Kv1 channels leads to an increase of the spike duration and Ca2+ entry in CA3 presynaptic terminals (26). We therefore asked whether a loss of axonal Kv1 channels resulting from LGI1 deficiency might lead to increased glutamate release, by comparing the effects of DTX-K on both spontaneous and spike-evoked excitatory postsynaptic currents (EPSCs) from WT vs. Lgi1-null CA3 neurons.
Blocking Kv1 channels enhanced spike evoked EPSCs by about 64% in connected pairs of WT CA3 neurons (Fig. 6 E and F). However, in LGI1-deficient neurons, DTX-K failed to boost EPSC amplitude, indicating that in KO mice, glutamate release is no longer controlled by Kv1 channels. To examine the impact of this Kv1 loss on network dynamics, we recorded spontaneous activity in CA3 neurons. Spontaneous activity was stronger but less sensitive to boosting by Kv1 block in Lgi1−/− compared with WT mice (Fig. S5).
Discussion
Investigation into the precise mechanisms by which LGI1 depletion leads to epilepsy has so far emphasized a role in excitatory neurotransmission, but neglected its implication in intrinsic excitability. Furthermore analysis of glutamatergic neurotransmission in hippocampal slices from Lgi1−/− mice has yielded conflicting evidence. Yu et al. (7) reported enhanced excitatory transmission in Lgi1−/− mice, which suggests a basis for the seizure phenotype. In contrast Fukata and colleagues found reduced AMPA receptor function (6, 22, 23) and suggested that LGI1 depletion might induce loss of AMPA receptor function in inhibitory interneurons, thus increasing overall excitability in the hippocampus (6). However, inhibitory synaptic transmission is not affected in LGI1 mutant mice (7, 13) and conditional LGI1 knock out in inhibitory parvalbumin interneurons does not confer an epileptic phenotype (8).
We now report evidence that LGI1 determines neuronal excitability in CA3 pyramidal neurons through the control of Kv1-channel expression. We first showed that addition of recombinant LGI1 decreased neuronal excitability in rat CA3 neurons. Interestingly, the rheobase in the presence of DTX was similar in treated and control neurons, indicating that this effect was likely to be due to a change in Kv1-channel expression. Next, we showed that Lgi1−/− mice display increased excitability compared with the WT mice. To corroborate LGI1-dependent modifications in Kv1 current, we measured the effects of blocking Kv1 channels with DTX in WT and Lgi1−/− neurons. DTX reduced the rheobase in WT neurons, but failed to significantly change the action potential threshold in LGI1-null neurons. These results suggest that LGI1 modulates neuronal excitability via presynaptic Kv1 channels. However, DTX treatment led to a 50% increase in the gain in LGI1-deficient neurons, suggesting that DTX-sensitive current was not totally absent. Voltage clamp recordings in Lgi1−/− CA3 neurons indicated a substantial reduction in D-type conductance and confirmed the persistence of residual current with similar steady-state parameters.
The 125I-αDTX binding to WT and Lgi1−/− synaptosomes indicated a robust decrease in Kv1-channel expression at the membrane. Kv1.2 has been shown to impart axonal and presynaptic targeting to Kv1.1 (7). LGI1 deletion decreased both total Kv1.1 and Kv1.2 protein expression levels by 50%, but did not induce any significant change in the expression levels of Kvβ1 subunit, the Kv1.1 binding partners ADAM22 and ADAM23, or of the unrelated HCN4-channel subunit. Thus, genetic deletion of LGI1 induced a strong elevation in neuronal excitability, due to a reduction in the density of Kv1 channels.
The decrease in Kv1.1 protein levels could be due to either transcriptional repression, reduced translation, or posttranslational degradation. Analysis by qPCR showed surprisingly a small but significant increase in Kv1.1 and Kv1.2 mRNA expression in Lgi1−/− animals (1.5- and 1.2-fold, respectively). The steady-state mRNA expression level was analyzed at P10, corresponding to peak LGI1 protein expression in WT animals. This result suggests that, whereas genetic depletion of LGI1 impacts Kv1.1 and Kv1.2 mRNA expression, this cannot underlie the decrease in protein expression. Specific regulatory mechanisms must be taking place affecting the turnover and/or axonal targeting of Kv1 proteins.
Immunochemical analysis of Kv1.1 expression in the cortex and CA3 of WT animals revealed colocalization of LGI1 and Kv1.1 at the axonal initial segment. The colocalization of LGI1 with Kv1.1 channels at the AIS, is consistent with the observation that ADAM22, a membrane receptor for LGI1, is a component of clustered Kv1 channels in certain distinct axonal domains, including the AIS in dissociated hippocampal cultures (20). The analysis of Lgi1−/− samples corroborated the decrease in Kv1.1 protein expression levels, as immunostaining of Kv1.1 showed a marked depletion especially in axons, compatible with perturbed excitability and the increase of rheobase in Lgi1−/− animals.
Interestingly, the absence of LGI1 accelerated D-current inactivation kinetics. This finding is consistent with oocyte expression studies showing that LGI1 prevents rapid inactivation of Kv1-channel current (19). In the study by Schulte et al. (19), LGI1 was thought to be an intracellular protein that antagonizes rapid inactivation mediated by Kvβ1 subunit, by either steric hindrance or a direct interaction of LGI1 with the inactivation domain of the channel. Our data indicate that Kv1 channels inactivate more rapidly in LGI1-null neurons. It is not clear how this inactivation occurs but it is possible that the reduced expression of Kv1.1 subunits, although Kvβ1 levels are unaffected, leads to an increased Kvβ1/Kv1.1 ratio and hence to an increased probability that Kvβ1 binds to and inactivates residual channels.
LGI1 deficiency was also shown to result in a loss of the capacity of presynaptic D-type current to limit glutamate release; as in contrast to WT mice, release was not stimulated by DTX in Lgi1−/− mice. Our results support and extend reports of enhanced excitatory transmission in Lgi1−/− mice (7, 21). It is possible that conflicting evidence, suggesting reduced AMPA receptor function in Lgi1−/− mice (6, 22, 23), may be the consequence of homeostatic synaptic responses to increased excitatory transmission.
Inhibitory synaptic inputs at AISs can play a significant role in modulating neuronal excitability. Recent studies have shown that ADAM11 is involved in clustering Kv1 channels at cerebellar basket cell terminals, which encapsulate Purkinje cell AISs and exert inhibitory ephaptic control of output (27). Furthermore LGI1 binding to ADAM11 has been reported (28), which suggests that LGI1 may influence synaptic inhibition. However, selective deletion of LGI1 in parvalbumin-positive interneurons did not generate an epileptic phenotype, whereas knock out in glutamatergic neurons resulted in seizures (8), suggesting that loss of LGI1 in excitatory neurons is the predominant factor.
Do our present findings have implications for LE with LGI1 autoimmunity? Lalic et al. (29) have reported that in vitro application of serum from LE patients increased the release probability at mossy-fiber CA3 cell synapses, and this effect was mimicked by DTX. It will be interesting to determine whether the anti-LGI1 autoantibodies identified in LE patients have an impact on Kv1-channel expression.
In conclusion, our results are consistent with the conclusion that LGI1 is located in the axonal initial segment and buffers excitatory neurotransmission by tuning axonal Kv1.1-channel density. Loss of this process in Lgi1-null mice is likely to be a major contributor to epileptogenesis. Further work will be necessary to clarify this issue and dissect the posttranscriptional mechanisms by which LGI1 controls the expression of Kv1.1.
Materials and Methods
Antibodies and Other Reagents.
Details are provided in SI Materials and Methods.
Production of Lgi1−/− Mice.
Heterozygous Lgi1+/− mice (5) were intercrossed to generate Lgi1−/−, Lgi1+/−, and Lgi1+/+ littermates.
All experiments were carried out according to the European and Institutional guidelines for the care and use of laboratory animals (Council Directive 86/609/EEC and French National Research Council).
Production of LGI1.
Recombinant LGI1 was produced using the Bac-to-Bac expression system (Life Technologies). LGI1 was purified using 6-histidine capture on HisTrap Excel columns and aliquots frozen at −80 °C. Details are provided in SI Materials and Methods.
Binding Experiments.
P2 synaptosomal membranes (10 µg) were incubated for 1 h at 25 °C with 0.1 nM 125I-α dendrotoxin in the absence (total binding) or presence of 0.1 µM DTX-K (nonspecific binding) in 25 mM Tris, 150 mM NaCl, and 0.1% BSA at pH 7.2 (TBSA). Samples were filtered over Whatman GF/C filters treated with 0.3% polyethyleneimine, washed three times with 1 mL TBS, and bound radioactivity was measured by gamma counting. Specific binding was the difference between total and nonspecific binding.
Western Blotting.
P10 brains were homogenized in 25 mM Tris⋅HCl pH 7.4, 150 mM NaCl, and homogenates were recovered in supernatants of a 900 × g centrifugation. Ten micrograms of proteins were resolved by SDS/PAGE and processed for Western blotting using the indicated antibodies. Samples from six different brains of both WT and Lgi1−/− were analyzed in triplicate.
RNA Extraction, cDNA Synthesis, and Relative Quantification Assays.
qPCR quantification of mRNAs was performed on P9–11 mouse brains extracts. TaqMan gene expression assays were used for quantifying HPRT and HCN4 genes and a homemade designed assay was used for Kv1.1 and Kv1.2. Details are provided in SI Materials and Methods.
Hippocampal Slice Cultures.
All experiments were carried out according to the European and Institutional guidelines for the care and use of laboratory animals and approved by the local health authority (D13055-08, Préfecture des Bouches du Rhône).
Young Wistar rats (P7–P8) or mice (P9–P11) were deeply anesthetized by i.p. injection of chloral hydrate, the brain was removed, and each hippocampus dissected. Hippocampal slices (350 µm) were placed on 20-mm latex membranes (Millicell) inserted into 35-mm Petri dishes containing 1 mL of culture medium and maintained for up to 21 d in an incubator at 34 °C, 95% O2–5% CO2. The culture medium contained (in milliliters) 25 MEM, 12.5 HBSS, 12.5 horse serum, 0.5 penicillin/streptomycin, 0.8 glucose (1 M), 0.1 ascorbic acid (1 mg/mL), 0.4 Hepes (1 M), 0.5 B27, and 8.95 sterile H2O. To limit glial proliferation, 5 µM Ara-C was added to the culture medium starting at 3 d in vitro (DIV). LGI1 or heat-denatured LGI1 (100 nM) was applied to slice cultures for 24–72 h.
Electrophysiology.
Whole-cell recordings were obtained from CA3 neurons in organotypic cultures. The external solution contained (in millimoles): 125 NaCl, 26 NaHCO3, 3 CaCl2, 2.5 KCl, 2 MgCl2, 0.8 NaH2PO4, and 10 D-glucose, and was equilibrated with 95% O2–5% CO2. Patch pipettes (5–10 MΩ) were filled with a solution containing (in millimoles): K-gluconate 120, KCl 20, Hepes 10, EGTA 0.5, MgCl2 2, Na2ATP 2, and NaGTP 0.3 (pH 7.4). All recordings were made at 29 °C in a temperature-controlled recording chamber (Luigs & Neumann). Neurons were recorded in current clamp or voltage clamp with a Multiclamp 700B Amplifier (Axon Instruments, Molecular Devices). Only neurons with a resting membrane potential more negative than −60 mV were kept for final analysis. Excitability was measured by delivering a range of long (1 s) depolarizing current pulses (10–250 pA, by increments of 10 pA) and counting the number of action potentials. Ionotropic glutamate and GABA receptors were blocked with 2–4 mM kynurenate and 100 µM picrotoxin. Input–ouput curves were determined for each neuron and two parameters were examined; the rheobase (the minimal current eliciting at least one action potential) and the gain (measured on each cell as the linear fit of the spike number as a function of current pulse). Voltage-clamp protocols to measure Kv currents consisted of a family of voltage-step commands from a holding potential of −90 mV (−80–0 mV in 10-mV increments). To block voltage-dependent Ca2+ and Na+ currents, 200 µM Ni2+, 50 µM Cd2+, and 0.5 µM TTX were added to the saline. Algebraic isolation of the D-type and TEA sensitive currents were done by subtracting the currents evoked in the presence of the Kv1-channel blocker, DTX-K, or TEA (10 mM), respectively, from currents evoked in control solution. In all voltage-clamp experiments, leak subtraction was performed using a p/n (n = 4) protocol. The voltage and current signals were low-pass filtered (3 kHz), and acquisition was performed at 10 kHz with pClamp10 (Axon Instruments) or Igor (Wavemetrics). Data were analyzed with ClampFit (Axon Instruments) and Igor (Wavemetrics). Pooled data are presented as mean ± SE and statistical analysis was performed using the Mann–Whitney U test or Wilcoxon rank-signed test.
Paired recordings from CA3 pyramidal neurons were obtained in organotypic slices from WT or Lgi1−/− mice. Presynaptic action potentials were aligned and the postsynaptic currents were averaged over 30–50 trials.
Immunohistochemistry.
Brains from Lgi1+/+ and Lgi1−/− mice were sectioned in 100-μm slices using a Leica Vibratome VT1200S. Slices were fixed in a PBS solution containing 4% PFA and 4% sucrose for 1 h, washed three times in PBS, and treated with NH4Cl for 30 min. Slices were then incubated for 2 h in blocking buffer (PBS, 10% goat serum and 0.1% Triton X-100). Primary antibodies were incubated overnight at 4 °C in PBS, 1% goat serum, and 0.1% Triton X-100, then extensively washed in the same buffer. Nuclei were stained using DAPI. Alexa-Fluor anti-rabbit or anti-mouse IgG2a (AnkyrinG and LGI1), IgG2b (Kv1.1) isoform-specific secondary antibodies were incubated for 2 h at room temperature and washed overnight at 4 °C. Slices were then mounted with Fluoromount G. Sequential confocal sections (0.5 µm) for every image were acquired with a Leica TCS SP5 laser scanning microscope (Leica Microsystem). A Z stack of confocal sections was generated using Fiji ImageJ software. Further image processing and presentation was done using Adobe Photoshop CS4.
Quantification and Statistical Analysis.
Statistical information including n, mean, and statistical significance values is indicated in the text or the figure legends. qPCR significance was obtained using Qiagen Rest 2009 software. Western blot quantifications were made using ImageJ. Pooled data are presented as mean ± SD or SEM and statistical analysis was performed using the Mann–Whitney U test or Wilcoxon rank-signed test.
Data were considered statistically significant at *P ≤ 0.05, **P ≤ 0.01, and ***P ≤ 0.001.
SI Materials and Methods
Antibodies and Other Reagents.
Antibodies were purchased as follows: Anti-Lgi1 (Abcam ab30868, RRID:AB_776017) for Western blots and [University of California (UC), Davis/NIH NeuroMab Facility 75–307, RRID:AB_2315876] for immunofluorescence, anti-T7 (Millipore 69522–4, RRID:AB_11213464), anti-Kv1.1 (UC Davis/NIH NeuroMab Facility 75–105, RRID:AB_2128566), anti-Kv1.2 (UC Davis/NIH NeuroMab Facility 75–008, RRID:AB_2296313), anti-ADAM22 (UC Davis/NIH NeuroMab Facility 75–093, RRID:AB_2223817), anti-pan Kvβ (UC Davis/NIH NeuroMab Facility 75–106, RRID:AB_2131361), and anti-HCN4 (UC Davis/NIH NeuroMab Facility 73–150, RRID:AB_10673158), anti-ADAM23 (Thermo Fisher Scientific PA5-30939, RRID:AB_2548413), anti-GADPH (Millipore AB2302, RRID:AB_10615768), anti-ankyrin G (UC Davis/NIH NeuroMab Facility 75–146, RRID:AB_10673030), anti-βIV-spectrin (gift from Dr. Rasband, Baylor College, Houston). The 125I-α dendrotoxin is from Perkin-Elmer. α-Dendrotoxin, dendrotoxin K, TTX, kynurenate, and picrotoxin are from Sigma.
RNA Extraction, cDNA Synthesis, and Relative Quantification Assays.
P9–11 mouse brains were extracted and incubated in RNALater (Thermo Fisher Scientific) for 24 h at 4 °C. Samples were then kept frozen at −20 °C until processing. Extraction of total RNA was performed using Purelink RNA Mini kit (Thermo Fisher Scientific) followed by DNase I treatment (Thermo Fisher Scientific) to eliminate contaminating genomic DNA. Total RNA amount and purity was checked using a Nanodrop ND-1000 spectrophotometer (Thermo Fisher Scientific). A total of 1.5 µg of total RNA was reverse transcribed using MMLV reverse transcriptase (Thermo Fisher Scientific) according to the manufacturer’s protocol. qPCR reactions were carried out in 20 µL using 150 ng of cDNA with TaqMan universal PCR Master Mix II, no UNG (Thermo Fisher Scientific) on an ABI PRISM 7900HT thermocycler (Applied Biosystems). The thermal cycling conditions were 50 °C for 2 min, 95 °C for 10 min, 50 cycles of 95 °C for 15 s, and 60 °C for 1 min. TaqMan gene expression assays including primers and TaqMan FAM-MGB probe sets were used for quantifying HPRT and HCN4 genes (respectively, Mm00446968_m1 and Mm01176086_m1 from Thermo Fisher Scientific) according to the manufacturer’s protocol. A homemade designed assay was used for Kv1.1 and Kv1.2 under the same conditions. For KCNA1 and KCNA2 (encoding, respectively, Kv1.1 and Kv1.2) primers and FAM-MGB probes were designed and validated according to PrimerExpress software (Thermo Fisher Scientific) and MIQE recommendations (30). Properties of the designed MGB probe were then checked with the Primer Express software tool (Thermo Fisher Scientific) and were as follows: Kv1.1 forward TTACGAGTTGGGCGAGGAAG, Kv1.1 reverse CTGGCGCTGGTACTCCTTCT, Kv1.1 probe CATGGAGAAGTTCCGG. Kv1.2 forward CAGAGGGAGAGGAGCAGGC, Kv1.2 reverse GTCAGGGGAGGACGGGAT, Kv1.2 probe TGCAAGTGACAAGCTG. Relative expression levels were normalized according to the 2−ΔΔCt (31) and using Rest 2009 software (Qiagen). Gene expression was evaluated in triplicate, in three independent PCR reactions in two WT and four Lgi1−/− mice.
Production of LGI1.
Recombinant LGI1 was produced using the Bac-to-Bac Expression System (Life Technologies). Plasmid pFastBac1 was modified by inserting into its BamHI/HindIII sites a synthetic BglII/HindIII DNA fragment (206 nt) encoding the melittin signal peptide with NcoI site 5 codons after the cleavage point. Mouse LGI1 (NM_020278.2) was amplified by PCR from pcDNA3-Flag-LGI1 (32) with a forward primer placing an EcoRI site just before the codon of P37 and a reverse primer across the stop codon with a terminal NotI site. This 1,593-nt fragment was inserted into the EcoRI/NotI sites of pET28a. This plasmid was digested with NotI and partially with NcoI, generating a 1,697-bp fragment encoding a fusion of 6xHis and a T7 tag in the N-terminal part of the secreted form of LGI1. The fragment was subcloned into the NcoI/NotI sites of the modified pFastBac. The encoded N-terminal sequence of the final construct is: MKFLVNVALVFMVVYISYIYAAPHSTMGSSHHHHHHSSGLVP RGSHMASMTGGQQMGRGSEFP… with residues 1–21 encoding the melittin signal peptide, 31–36 the 6xHis, 47–59 the T7 tag, and residue 63 is P37 of mouse LGI1. DH10Bac strain (Thermo Fisher Scientific) was transformed with the pFastBac-LGI1 transfer plasmid and bacmid DNA was isolated with a NucleoBond Xtra BAC kit (Macherey-Nagel). Sf9 cells (ECACC 05011001, RRID:CVCL_0549) were used to produce viral particles and to express recombinant LGI1 (ProRec Facility).
LGI1 was purified as follows: 250 mL of cell culture supernatant was warmed to room temperature, NaCl and EDTA were added to obtain 0.5 M and 1.0 mM final, respectively, and pH was adjusted to 7.4 with 1 M NaOH. The solution was stirred for 1 h at room temperature under slow agitation to let any precipitates form, centrifuged (10 min, 10,000 × g, 25 °C), and then filtered over a 0.02-µm filter unit. The filtrate was degassed under vacuum and Tween 20 was added to a concentration of 0.02%. The solution was cooled and kept on ice during column loading. Purification by 6-histidine capture on HisTrap Excel 1-mL columns (GE Healthcare Life Sciences) was carried out on an ÄKTA Purifier System equipped with a P960 loading pump (GE Healthcare Life Sciences), at a flow rate of 0.5 mL/min. After loading, the column was extensively washed with 80 mL 20 mM NaHPO4, 0.5 M NaCl, 0.05% Tween, pH 7.4, then with 30 mL 20 mM NaHPO4, 0.5M NaCl, 20 mM imidazole, pH 7.4. LGI1 was eluted with 20 mM NaHPO4, 0.5 M NaCl, 250 mM imidazole, pH 7.4, and 0.5-mL fractions were collected. Protein content of pooled peak fractions was measured from absorbance A280 and Bradford assay and purity checked by SDS/PAGE analysis. In some experiments, LGI1 was concentrated on a Vivaspin 6, 30,000 MW cutoff, centrifugeable concentrator (Sartorius). Samples were aliquoted and stored at −80 °C.
Deglycosylation of denatured LGI1 with PNGase F (New England Biolabs) was performed according to the indications of the supplier.
Acknowledgments
We thank B. Marquèze-Pouey and M. Lasserre for logistic support in transgenic mice handling. Financial support was provided by the Agence Nationale de la Recherche for the “REPREK” (Regulation of Presynaptic Kv1 Channels) project (ANR-11-BSV4-0016) and the Fondation pour la Recherche Médicale and the Spanish Government (Ministerio de Economía y Competitividad, SAF2015-65315-R to J.-J.G.).
Footnotes
The authors declare no conflict of interest.
This article is a PNAS Direct Submission.
This article contains supporting information online at www.pnas.org/lookup/suppl/doi:10.1073/pnas.1618656114/-/DCSupplemental.
References
- 1.Kalachikov S, et al. Mutations in LGI1 cause autosomal-dominant partial epilepsy with auditory features. Nat Genet. 2002;30:335–341. doi: 10.1038/ng832. [DOI] [PMC free article] [PubMed] [Google Scholar]
- 2.Morante-Redolat JM, et al. Mutations in the LGI1/Epitempin gene on 10q24 cause autosomal dominant lateral temporal epilepsy. Hum Mol Genet. 2002;11:1119–1128. doi: 10.1093/hmg/11.9.1119. [DOI] [PubMed] [Google Scholar]
- 3.Cowell JK. LGI1: From zebrafish to human epilepsy. Prog Brain Res. 2014;213:159–179. doi: 10.1016/B978-0-444-63326-2.00009-0. [DOI] [PubMed] [Google Scholar]
- 4.Kegel L, Aunin E, Meijer D, Bermingham JR. LGI proteins in the nervous system. ASN Neuro. 2013;5:167–181. doi: 10.1042/AN20120095. [DOI] [PMC free article] [PubMed] [Google Scholar]
- 5.Chabrol E, et al. Electroclinical characterization of epileptic seizures in leucine-rich, glioma-inactivated 1-deficient mice. Brain. 2010;133:2749–2762. doi: 10.1093/brain/awq171. [DOI] [PMC free article] [PubMed] [Google Scholar]
- 6.Fukata Y, et al. Disruption of LGI1-linked synaptic complex causes abnormal synaptic transmission and epilepsy. Proc Natl Acad Sci USA. 2010;107:3799–3804. doi: 10.1073/pnas.0914537107. [DOI] [PMC free article] [PubMed] [Google Scholar]
- 7.Yu YE, et al. Lgi1 null mutant mice exhibit myoclonic seizures and CA1 neuronal hyperexcitability. Hum Mol Genet. 2010;19:1702–1711. doi: 10.1093/hmg/ddq047. [DOI] [PMC free article] [PubMed] [Google Scholar]
- 8.Boillot M, et al. Glutamatergic neuron-targeted loss of LGI1 epilepsy gene results in seizures. Brain. 2014;137:2984–2996. doi: 10.1093/brain/awu259. [DOI] [PMC free article] [PubMed] [Google Scholar]
- 9.Baulac S, et al. A rat model for LGI1-related epilepsies. Hum Mol Genet. 2012;21:3546–3557. doi: 10.1093/hmg/dds184. [DOI] [PubMed] [Google Scholar]
- 10.Teng Y, et al. Knockdown of zebrafish Lgi1a results in abnormal development, brain defects and a seizure-like behavioral phenotype. Hum Mol Genet. 2010;19:4409–4420. doi: 10.1093/hmg/ddq364. [DOI] [PMC free article] [PubMed] [Google Scholar]
- 11.Thomas R, et al. LGI1 is a Nogo receptor 1 ligand that antagonizes myelin-based growth inhibition. J Neurosci. 2010;30:6607–6612. doi: 10.1523/JNEUROSCI.5147-09.2010. [DOI] [PMC free article] [PubMed] [Google Scholar]
- 12.Zhou YD, et al. Epilepsy gene LGI1 regulates postnatal developmental remodeling of retinogeniculate synapses. J Neurosci. 2012;32:903–910. doi: 10.1523/JNEUROSCI.5191-11.2012. [DOI] [PMC free article] [PubMed] [Google Scholar]
- 13.Zhou YD, et al. Arrested maturation of excitatory synapses in autosomal dominant lateral temporal lobe epilepsy. Nat Med. 2009;15:1208–1214. doi: 10.1038/nm.2019. [DOI] [PMC free article] [PubMed] [Google Scholar]
- 14.Irani SR, et al. Antibodies to Kv1 potassium channel-complex proteins leucine-rich, glioma inactivated 1 protein and contactin-associated protein-2 in limbic encephalitis, Morvan’s syndrome and acquired neuromyotonia. Brain. 2010;133:2734–2748. doi: 10.1093/brain/awq213. [DOI] [PMC free article] [PubMed] [Google Scholar]
- 15.Lai M, et al. Investigation of LGI1 as the antigen in limbic encephalitis previously attributed to potassium channels: A case series. Lancet Neurol. 2010;9:776–785. doi: 10.1016/S1474-4422(10)70137-X. [DOI] [PMC free article] [PubMed] [Google Scholar]
- 16.Tan KM, Lennon VA, Klein CJ, Boeve BF, Pittock SJ. Clinical spectrum of voltage-gated potassium channel autoimmunity. Neurology. 2008;70:1883–1890. doi: 10.1212/01.wnl.0000312275.04260.a0. [DOI] [PubMed] [Google Scholar]
- 17.Vincent A, et al. Potassium channel antibody-associated encephalopathy: A potentially immunotherapy-responsive form of limbic encephalitis. Brain. 2004;127:701–712. doi: 10.1093/brain/awh077. [DOI] [PubMed] [Google Scholar]
- 18.Dolly JO, Parcej DN. Molecular properties of voltage-gated K+ channels. J Bioenerg Biomembr. 1996;28:231–253. doi: 10.1007/BF02110698. [DOI] [PubMed] [Google Scholar]
- 19.Schulte U, et al. The epilepsy-linked Lgi1 protein assembles into presynaptic Kv1 channels and inhibits inactivation by Kvbeta1. Neuron. 2006;49:697–706. doi: 10.1016/j.neuron.2006.01.033. [DOI] [PubMed] [Google Scholar]
- 20.Ogawa Y, et al. ADAM22, a Kv1 channel-interacting protein, recruits membrane-associated guanylate kinases to juxtaparanodes of myelinated axons. J Neurosci. 2010;30:1038–1048. doi: 10.1523/JNEUROSCI.4661-09.2010. [DOI] [PMC free article] [PubMed] [Google Scholar]
- 21.Boillot M, et al. LGI1 acts presynaptically to regulate excitatory synaptic transmission during early postnatal development. Sci Rep. 2016;6:21769. doi: 10.1038/srep21769. [DOI] [PMC free article] [PubMed] [Google Scholar]
- 22.Fukata Y, et al. Epilepsy-related ligand/receptor complex LGI1 and ADAM22 regulate synaptic transmission. Science. 2006;313:1792–1795. doi: 10.1126/science.1129947. [DOI] [PubMed] [Google Scholar]
- 23.Ohkawa T, et al. Autoantibodies to epilepsy-related LGI1 in limbic encephalitis neutralize LGI1-ADAM22 interaction and reduce synaptic AMPA receptors. J Neurosci. 2013;33:18161–18174. doi: 10.1523/JNEUROSCI.3506-13.2013. [DOI] [PMC free article] [PubMed] [Google Scholar]
- 24.Cudmore RH, Fronzaroli-Molinieres L, Giraud P, Debanne D. Spike-time precision and network synchrony are controlled by the homeostatic regulation of the D-type potassium current. J Neurosci. 2010;30:12885–12895. doi: 10.1523/JNEUROSCI.0740-10.2010. [DOI] [PMC free article] [PubMed] [Google Scholar]
- 25.Monaghan MM, Trimmer JS, Rhodes KJ. Experimental localization of Kv1 family voltage-gated K+ channel alpha and beta subunits in rat hippocampal formation. J Neurosci. 2001;21:5973–5983. doi: 10.1523/JNEUROSCI.21-16-05973.2001. [DOI] [PMC free article] [PubMed] [Google Scholar]
- 26.Bialowas A, et al. Analog modulation of spike-evoked transmission in CA3 circuits is determined by axonal Kv1.1 channels in a time-dependent manner. Eur J Neurosci. 2015;41:293–304. doi: 10.1111/ejn.12787. [DOI] [PubMed] [Google Scholar]
- 27.Kole MJ, et al. Selective loss of presynaptic potassium channel clusters at the cerebellar basket cell terminal Pinceau in Adam11 mutants reveals their role in ephaptic control of Purkinje cell firing. J Neurosci. 2015;35:11433–11444. doi: 10.1523/JNEUROSCI.1346-15.2015. [DOI] [PMC free article] [PubMed] [Google Scholar]
- 28.Sagane K, Ishihama Y, Sugimoto H. LGI1 and LGI4 bind to ADAM22, ADAM23 and ADAM11. Int J Biol Sci. 2008;4:387–396. doi: 10.7150/ijbs.4.387. [DOI] [PMC free article] [PubMed] [Google Scholar]
- 29.Lalic T, Pettingill P, Vincent A, Capogna M. Human limbic encephalitis serum enhances hippocampal mossy fiber-CA3 pyramidal cell synaptic transmission. Epilepsia. 2011;52:121–131. doi: 10.1111/j.1528-1167.2010.02756.x. [DOI] [PubMed] [Google Scholar]
- 30.Bustin SA, et al. The MIQE guidelines: Minimum information for publication of quantitative real-time PCR experiments. Clin Chem. 2009;55:611–622. doi: 10.1373/clinchem.2008.112797. [DOI] [PubMed] [Google Scholar]
- 31.Livak KJ, Schmittgen TD. Analysis of relative gene expression data using real-time quantitative PCR and the 2–ΔΔCT method. Methods. 2001;25:402–408. doi: 10.1006/meth.2001.1262. [DOI] [PubMed] [Google Scholar]
- 32.Chabrol E, et al. Two novel epilepsy-linked mutations leading to a loss of function of LGI1. Arch Neurol. 2007;64:217–222. doi: 10.1001/archneur.64.2.217. [DOI] [PubMed] [Google Scholar]


