Significance
Adaptive immunity to Plasmodium falciparum takes years to develop in endemic regions, leaving young children vulnerable to high parasite burdens and severe malaria. Host innate immune responses clearly occur during infection and may control parasite numbers in nonimmune individuals, for example by accelerating parasite removal from circulation. However, evidence of whether and how this occurs in vivo remains sparse. We set out to measure host removal of parasites during acute blood-stage Plasmodium infection in mice. However, rather than being removed more rapidly, parasites unexpectedly persisted in circulation. Persistence resulted from host-dependent slowing of parasite maturation. Thus Plasmodium maturation within red blood cells does not occur at a constant rate in vivo and can be influenced by the host itself.
Keywords: malaria, clearance, mathematical modelling, Plasmodium berghei ANKA, parasite maturation
Abstract
Severe malaria and associated high parasite burdens occur more frequently in humans lacking robust adaptive immunity to Plasmodium falciparum. Nevertheless, the host may partly control blood-stage parasite numbers while adaptive immunity is gradually established. Parasite control has typically been attributed to enhanced removal of parasites by the host, although in vivo quantification of this phenomenon remains challenging. We used a unique in vivo approach to determine the fate of a single cohort of semisynchronous, Plasmodium berghei ANKA- or Plasmodium yoelii 17XNL-parasitized red blood cells (pRBCs) after transfusion into naive or acutely infected mice. As previously shown, acutely infected mice, with ongoing splenic and systemic inflammatory responses, controlled parasite population growth more effectively than naive controls. Surprisingly, however, this was not associated with accelerated removal of pRBCs from circulation. Instead, transfused pRBCs remained in circulation longer in acutely infected mice. Flow cytometric assessment and mathematical modeling of intraerythrocytic parasite development revealed an unexpected and substantial slowing of parasite maturation in acutely infected mice, extending the life cycle from 24 h to 40 h. Importantly, impaired parasite maturation was the major contributor to control of parasite growth in acutely infected mice. Moreover, by performing the same experiments in rag1−/− mice, which lack T and B cells and mount weak inflammatory responses, we revealed that impaired parasite maturation is largely dependent upon the host response to infection. Thus, impairment of parasite maturation represents a host-mediated, immune system-dependent mechanism for limiting parasite population growth during the early stages of an acute blood-stage Plasmodium infection.
Blood-stage Plasmodium infection involves sequential rounds of red blood cell (RBC) invasion, intracellular parasite maturation, asexual replication, RBC rupture, and release of invasive merozoite forms into the bloodstream. Depending on the species, each cycle of infection takes ∼24–72 h to complete, and between 8 and 32 merozoites are released from each rupturing parasitized RBC (pRBC). In a naive individual infected with Plasmodium falciparum, the total number of pRBCs in the bloodstream increases by around 10-fold each cycle [referred to here as a parasite multiplication factor (PMF) of 10] (1). The PMF can be reduced by a number of mechanisms, including antibody-mediated and adaptive T-cell–mediated immunity to the parasite. Naturally acquired adaptive immunity to malaria can take years to develop in endemic regions, with high parasite burdens and severe disease more common in those individuals yet to develop protective immunity, e.g., young children (2–4). Nevertheless, other aspects of the host response to infection, such as innate immune responses, may influence malaria parasite control (5), for example by inducing fever, enhancing phagocyte function, or contributing to the organ-specific pathology (6–8).
Blood-stage Plasmodium infections in mice have been used extensively to study innate and adaptive immune responses during malaria (7, 9–11). Use of these experimental models has revealed that during acute infection, specifically before an effective parasite-specific antibody response has developed, the host is able to partially control parasite growth (or in other words, to limit the PMF) (12–14). However, the precise mechanisms by which the PMF is reduced in vivo remain unclear. A number of potential innate control mechanisms have been suggested. In particular, the mechanical removal of pRBCs by the spleen (8, 15–18) [or liver (19)] is believed to be a primary mechanism by which the host controls the PMF (12). However, few studies have attempted to directly measure host removal of pRBCs in vivo (13, 19).
Here, we followed the fate of a single cohort of fluorescently labeled, semisynchronous Plasmodium berghei ANKA (PbA) and Plasmodium yoelii 17XNL (Py) pRBCs when transfused into naive or acutely infected mice. Specifically, we compared the rate of removal of pRBCs from the bloodstream between these groups. Surprisingly, rather than observing an increase in pRBC removal due to a splenic and systemic inflammatory response, we observed increased parasite persistence in the circulation of acutely infected mice. Flow cytometric assessments and mathematical modeling showed that pRBCs persisted in circulation because they matured more slowly, taking longer than usual to complete their asexual life cycle. The phenomenon of impaired parasite maturation accounted for most of the improved control of infection in acutely infected mice and, furthermore, was largely driven by the host’s response to infection.
Results
Donor Parasites Are Detected in Circulation for Longer in Acutely Infected Animals.
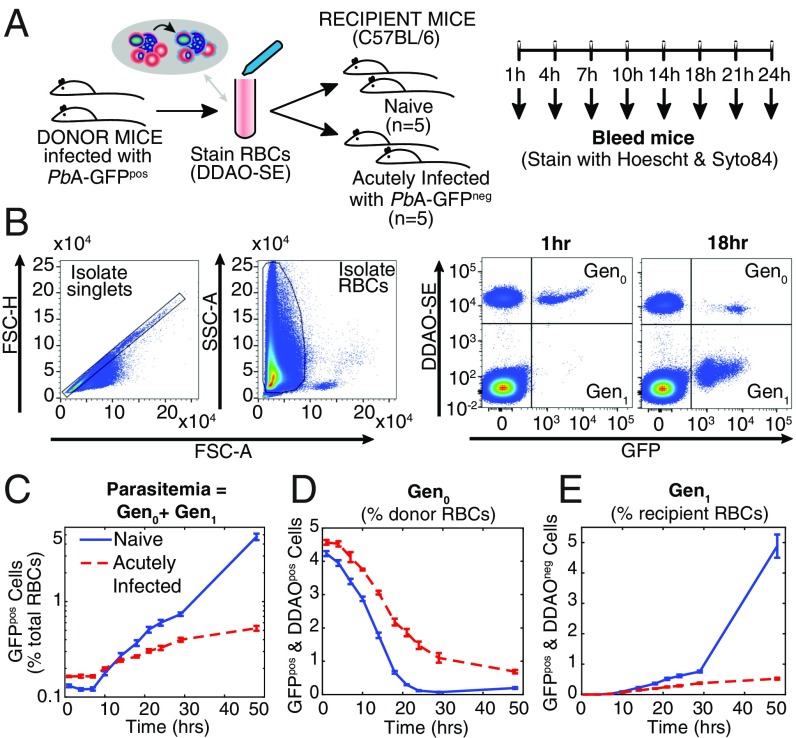
Infection of C57BL/6J mice with PbA elicits a rapid increase in parasitemia until day 4 postinfection (p.i.), followed by a slowing in the growth rate of parasites (14). To reveal factors causing this slowed growth, we sought to examine an individual generation of pRBCs exposed to this in vivo environment. To achieve this we used a modified version of our previous experimental approach (13). RBCs from mice infected with transgenic GFP-expressing PbA parasites (PbA-GFPpos) were labeled with a fluorescent cell-tracking dye, CellTrace Far Red DDAO-SE (DDAO-SE), and transferred into recipient mice (Fig. 1A). Parasitized RBCs determined by flow cytometry as DDAO-SEpos/GFPpos indicated RBCs originating from the donor animals infected with a parasite from the donor mice [which we refer to as “generation zero” (Gen0) of the donor cells] (Fig. 1B). Recipient mice either were naive or had been infected 5 d previously with non–GFP-expressing PbA (PbA-GFPneg). The parasitemia of GFPneg parasites in the acutely infected mice at the start of the experiment was 4.2% ± 0.2%. RBCs from donor mice composed 3.1% ± 0.1% and 3.6% ± 0.1% of the total RBCs in naive and acutely infected mice 1 h after transfusion, respectively. The transfer of GFPpos parasites allows tracking of parasites from the donor animals in mice experiencing an ongoing PbA-GFPneg infection (Fig. 1 A and B). In a change from our previous approach in which a mixture of ring, trophozoite, and schizont stages had been transferred (13), the transfused donor pRBCs were semisynchronized such that most (∼64%) parasites were in the ring stage at the time of transfer. This approach facilitated flow cytometric assessment and mathematical modeling of parasite maturation within RBCs, as well as measurements of PMF and removal of circulating pRBCs.
Fig. 1.
Adoptive transfer protocol. (A) Donor mice infected with PbA-GFPpos had blood taken by cardiac puncture, and the red blood cells (RBCs) were labeled with DDAO-SE, washed, and transfused into groups of recipient mice. The recipient mice either were naive (n = 5) or had an ongoing acute infection with PbA-GFPneg (n = 5). Regular blood samples were taken from the recipient mice after transfusion, and the samples were stained for DNA and RNA before being analyzed by flow cytometry. (B) Representative flow cytometric data collected from one mouse in the naive mouse group, at 1 h and 18 h after transfusion. Forward scatter area and height (FSC-A and FSC-H) were used to isolate singlets, and side scatter area (SSC-A) and FSC-A were used to identify RBCs. The presence of the DDAO-SE stain indicated cells that originated from the donor mice, and GFP expression identified cells that were infected with parasites originating from the donor animals. This allowed identification of the first generation of pRBCs injected into recipient mice (called Gen0) and those cells that had become infected with PbA-GFPpos parasites posttransfusion (called Gen1). We see Gen0 parasites are lost over time, and there is a corresponding increase in the Gen1 parasites. (C) The growth in (PbA-GFPpos, that is, Gen0 + Gen1) parasitemia over 48 h in recipient mice. Growth of parasitemia was lower in acutely infected mice compared with naive mice. (D) However, the difference in the growth in parasitemia did not appear to be accompanied by faster removal of Gen0 parasites themselves. Rather, Gen0 parasites persisted in circulation for longer in acutely infected mice than in naive mice. (E) The rate at which recipient RBCs (DDAO-SEneg) become infected provides a direct measure of the rate of invasion of RBCs.
Consistent with previous findings (12–14), the growth of GFPpos donor parasites in acutely infected mice (PMF = 2.0 ± 0.1) was less than half that observed for naive controls (4.6 ± 0.3) over 24 h (P = 0.01, Mann–Whitney test) (Fig. 1C). This reduction was previously attributed to increased removal of parasites from circulation (12). Therefore, we next sought to directly measure parasite removal from circulation by tracking Gen0 pRBCs originating from the donor mice (i.e., DDAO-SEpos/GFPpos) in the bloodstream of naive and 5-d infected recipient mice.
In naive recipients, most Gen0 donor pRBCs had disappeared from circulation by 24 h, probably due to maturation and RBC rupture according to the 24-h life cycle (Fig. 1D). In contrast, in 5-d infected recipients Gen0 donor pRBC levels remained substantially higher than in naive controls (Fig. 1D; 32% ± 2% of initial concentration by 24 h after transfer compared with 2.7% ± 0.4% for naive controls; P = 0.008, Mann–Whitney test). It was particularly surprising that Gen0 donor pRBCs appeared to be persisting beyond 24 h, because they were expected by this time to have ruptured and produced the next generation of parasites (20). This result was consistent across four repeat experiments in WT mice. This result was also consistent when the donor and recipient parasite lines were switched, confirming that this result was not the product of differences in the fitness of the GFPpos transgenic parasite compared with the GFPneg parasite (Fig. S1). Together, our analysis indicates that reduced growth of the circulating parasite population was associated, not with an increase in pRBC removal, but with an unexpected persistence of individual pRBCs in circulation.
Fig. S1.
Delayed development is not dependent on using GFPpos donor cells. Shown is fitting the rate of maturation of PbA GFPneg donor pRBCs in naive mice and mice infected for 5 d with the transgenic PbA-GFPpos parasite. That is, in this experiment the parasite used to infect donor and recipient has been swapped compared with that in Fig. 2 of the main text. Thus, Gen0 parasites (blue and gray panels) represent DDAO-SEpos and GFPneg parasitized RBCs. These were identified as early ring stages and mature stages (blue panel), using flow cytometry. The dynamics of Gen0 parasites were fitted in the same manner as in Fig. 2 of the main text (with the exception that the age of ring to trophozoite transition, xT, was estimated from the data rather than being fixed). The parasite maturation rate () and the invasion ratio in DDAO-SEpos RBCs () were allowed to vary between groups (fitting estimates: for naive and acutely infected mice, respectively). All other parameters were held constant between naive and acutely infected mice ( d, d, /d, and h).
Parasite Maturation Is Slowed Down During Infection.
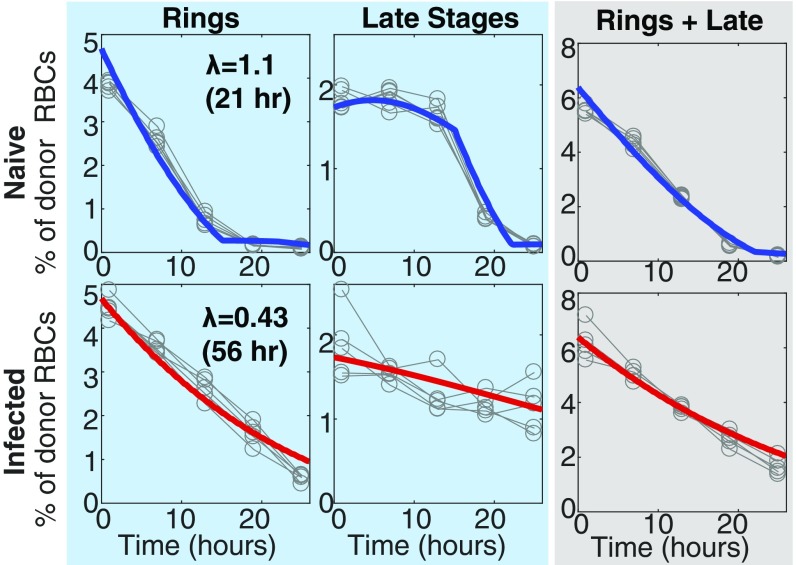
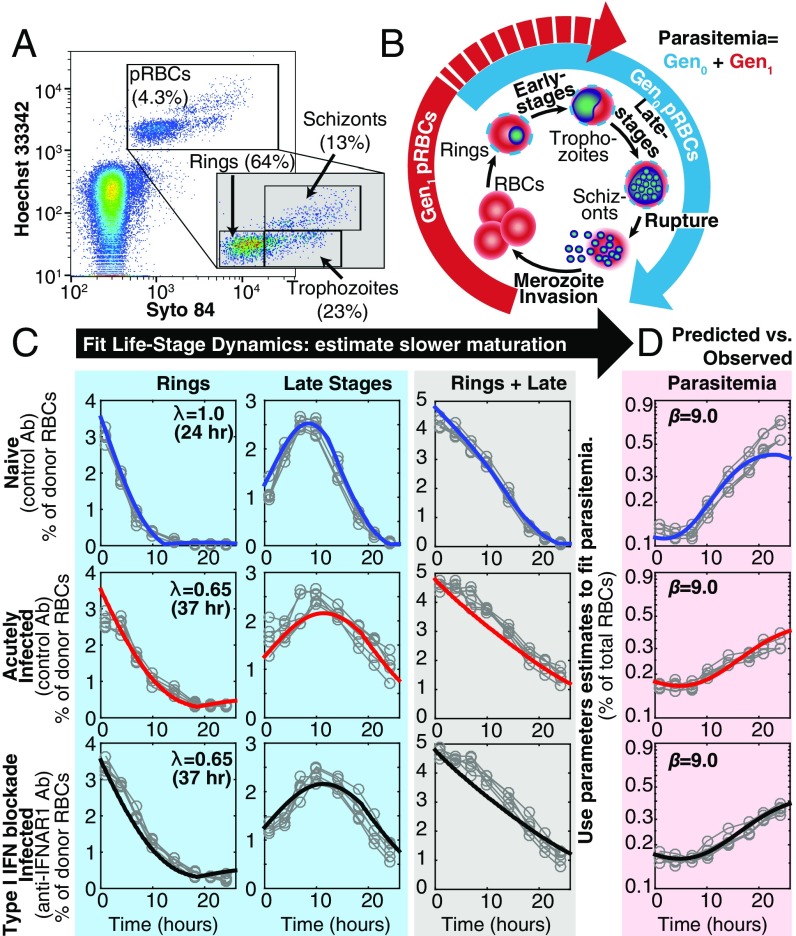
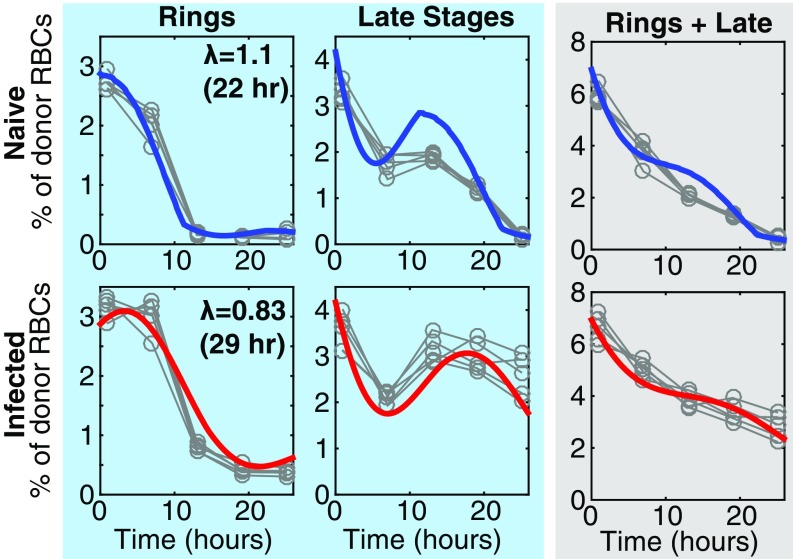
Given that the Gen0 pRBC donor circulated longer than the usual 24-h life cycle of PbA would permit, we next hypothesized that maturation of Gen0 pRBCs was impaired during acute infection and tested this using an established flow cytometric approach (13, 21–23). In naive mice, ring-stage Gen0 pRBCs (Fig. 2A) developed into more mature stages by 10 h, before mature forms disappeared from circulation likely due to a combination of RBC rupture and tissue sequestration (Fig. 2 B and C). However, in 5-d infected recipients, Gen0 pRBCs were substantially impaired in their maturation, with ring-stage pRBCs persisting for longer than 10 h and the peak in mature-stage parasites occurring later (Fig. 2C). We next fitted a mathematical model of slower maturation (described in Mathematical Model of Impaired Parasite Maturation) to the data (Fig. 2C) on life-stage progression in these Gen0 donor parasites. This modeling revealed that the maturation time in naive mice was not significantly different from 24 h (P > 0.5, comparing nested models with F test). Therefore, holding the maturation rate for parasites in naive mice to 24 h, we found that the progression of parasite life stages was ∼40% slower in 5-d infected animals compared with naive animals (P < 0.0001, comparing nested models with F test), which increased the parasite life-cycle time from 24 h to 40 h.
Fig. 2.
Fitting the dynamics of Gen0 and Gen1 parasites. (A) DNA and RNA content was determined by flow cytometry and used to determine the proportion of Gen0 parasites that were rings, trophozoites, and schizonts at each time point. (B) Illustration of how parasites progress through their asexual life cycle from young stages (rings) to late stages (trophozoites and schizonts), which then rupture and infect other RBCs. (C) The dynamics of Gen0 parasites (GFPpos and DDAO-SEpos) in naive (n = 5) and acutely infected mice (n = 5), as well as mice with antibody-inhibited type-I IFN signaling (IFN-Ineg) (n = 5), were fitted using a mathematical model. The model (solid thick lines) provided a good fit of the dynamics of Gen0 parasites (data: gray circles). All parameters were held to be equivalent between the three groups and estimated from fitting ( d, d, d−1), with the parasite maturation rate (), and, in the model reported here, the invasion ratio in donor RBCs was assumed to be nonzero and allowed to vary between groups (fitting estimates for naive, acutely infected, and infected IFN-Ineg mice, respectively), and we estimate a significantly slower parasite maturation rate in acutely infected mice compared with naive mice (P < 0.0001, F test). In the model reported here we fixed the maturation time of parasites in naive mice equal to 24 h. The overall dynamics of Gen0 parasites are shown in the gray column as the sum of rings and late stages. (D) Fitting the data on the parasitemia of GFPpos parasites (Gen0 + Gen1) parameters, using the model and parameter estimates obtained from fitting the Gen0 data in C. The only parameters estimated in fitting these data were the starting concentration of parasites from the donor mice as a percentage of total RBCs for each group of mice () and the invasion ratios in each group of mice, the latter not significantly different between groups (P = 0.16, F test).
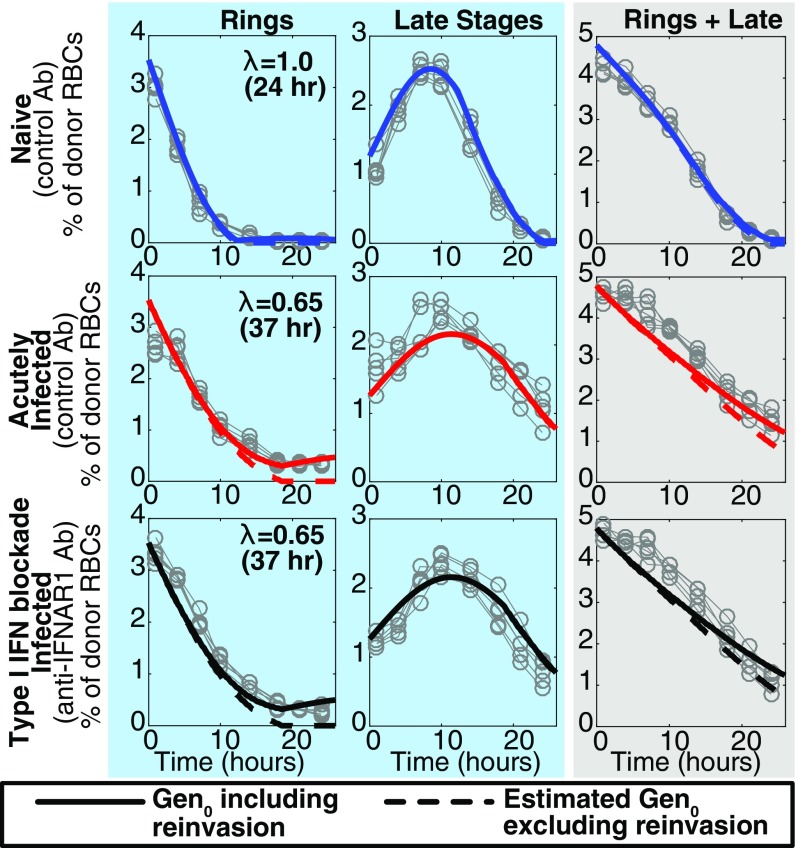
A possible confounder that could lead to the apparent persistence of Gen0 pRBCs would be the undesired reinvasion of the uninfected donor RBCs, which were transfused along with the Gen0 pRBCs, and a preference for donor RBCs in acutely infected mice. Even after including this factor in the model, our estimate of slower maturation was altered only slightly from 40% to 35% slower in acutely infected mice, that is, a 37-h cycle time (Fig. 2C, Fig. S2, and Invasion of Donor Cells). The addition of parameters to allow for the possibility of different clearance rates of parasites between naive and acutely infected mice did not significantly improve the fits to the data (P = 0.10, F test). These observations suggest that PbA maturation within RBCs can be altered by the host environment and therefore does not necessarily occur at a constant rate in vivo.
Fig. S2.
Modeling the contribution of parasite reinvasion. This reproduces Fig. 2 from the main text, but in addition indicates the contribution of parasite reinvasion to the overall Gen0 parasitemia. The estimated Gen0 pRBCs, excluding reinvasion, are indicated by the dashed line.
Slower Maturation of Parasites Accounts for the Majority of Reduced Parasite Growth.
We next considered whether slowed parasite maturation could account for reduced parasite growth and lower PMF observed in 5-d infected mice (Fig. 1C). To do this we applied our mathematical model for Gen0 pRBCs and the parameters obtained from fitting these data and attempted to predict parasite progression to the next generation (i.e., Gen1, Fig. 2B). After fixing all of the parameters in our model to those estimated from fitting the data for Gen0 (Fig. 2C), with the exception of a new parameter, the merozoite invasion ratio ( average number of RBCs infected by a rupturing pRBC), and the initial parasitemia of donor pRBCs ( in each group), we fitted this model simultaneously to the data for naive and acutely infected mice (Fig. 2D). From this fit, we estimated the parameter (implying that each rupturing parasite produced 9.0 new infected cells). The remarkably good fit to the data when using the same invasion ratio for both naive and 5-d infected animals suggests that slow maturation, rather than other factors such as increased clearance of pRBCs or merozoites, explains the reduced growth rate of parasitemia observed in 5-d infected mice (the underlying mechanisms are discussed in Understanding How Slower Maturation Mediates Control of Infection and Fig. S3). When we extended the modeling to allow for different merozoite invasion ratios for naive and 5-d infected animals, looking for evidence of immune control in 5-d infected animals, we found that using different invasion ratios did not provide a significantly better fit (P = 0.16, F test), suggesting that slower maturation alone could completely account for the reduction in PMF in acutely infected mice.
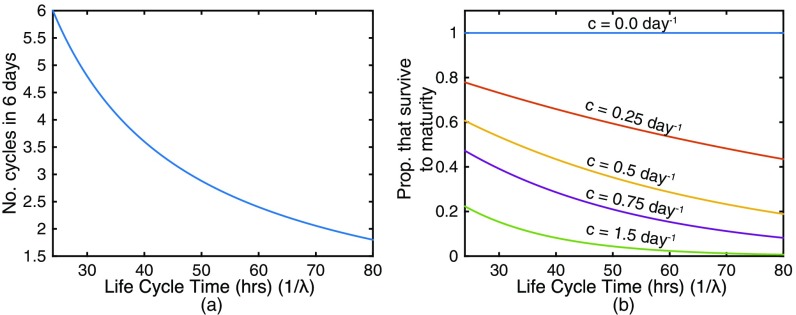
Fig. S3.
Modeling the effect of slower maturation on parasite growth. (A) In a given number of days, a longer parasite maturation cycle means fewer rounds of parasite multiplication can occur. (B) Further, increased time to reach maturity exposes pRBCs to clearance for longer, reducing the number of parasites that survive to maturity. The proportion of parasites surviving to maturity is given by where is the clearance rate and is the duration of the parasite life cycle.
Slow Maturation of Py Parasites.
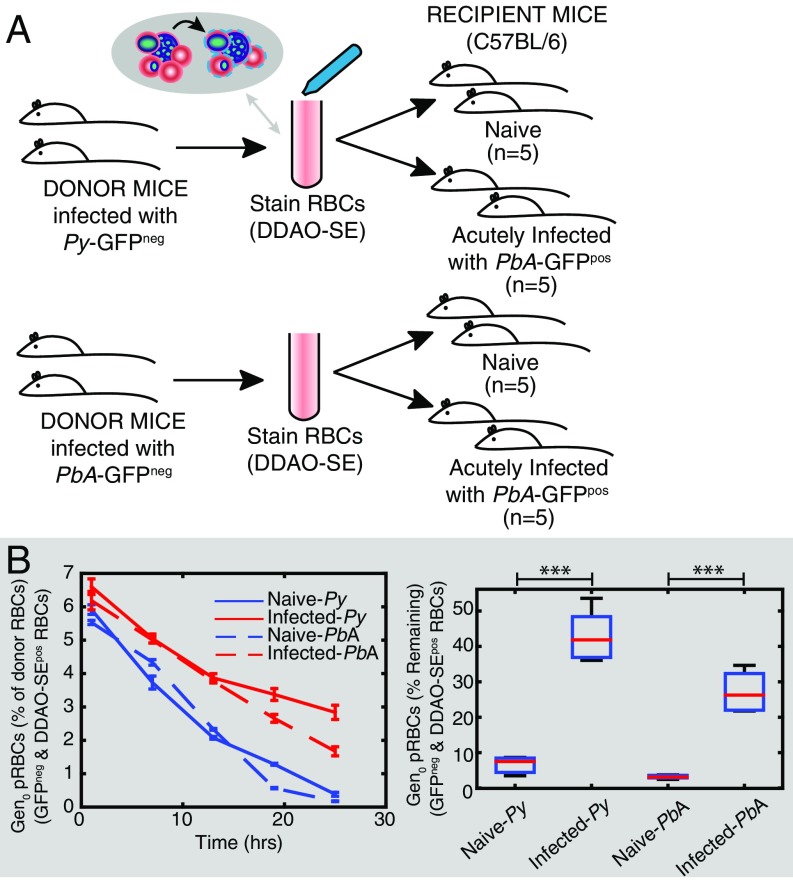
To confirm that our observations were not a PbA-specific phenomenon, we repeated the adoptive transfer studies, using donor cells infected with Py into 5-d PbA-GFPpos–infected mice (Fig. 3A, Fig. S4, and P. yoelii Infection). We observed that like PbA, Py-infected pRBCs persisted in circulation beyond their typical life-cycle times in acutely infected mice (Fig. 3B). Further, fitting our mathematical model revealed that Py parasites had a maturation time significantly shorter than 24 h (22 h, P = 0.03, F test). However, Py parasites matured 22% slower in acutely infected mice (29 h maturation time) compared with in naive mice (P < 0.0001, F test). These observations suggest that the maturation cycle of Py, like PbA, can also be altered by the host environment.
Fig. 3.
Slower maturation of Py in acute infection. (A) Donor mice, infected with either Py-GFPneg or PbA-GFPneg had blood taken by cardiac puncture, and the red blood cells (RBCs) were labeled with DDAO-SE, washed, and transfused into groups of recipient mice. The recipient mice either were naive or had an ongoing acute infection with PbA-GFPpos. Regular blood samples were taken from the recipient mice after transfusion, and the samples were stained for DNA and RNA before being analyzed by flow cytometry. (B) The percentage of donor Py or PbA Gen0 parasites remaining after transfusion compared with the initial concentration (measured as a percentage of total donor RBCs). Significantly more parasites remained in the circulation of acutely infected mice compared with naive mice after 25 h (***P < 0.0005, one-way ANOVA and contrast analysis).
Fig. S4.
Fitting the rate of maturation of Py pRBCs in naive and acutely infected mice. Gen0 parasites (blue and gray panels) represent DDAO-SEpos and GFPneg parasitized RBCs. These were sorted into early ring stages and mature stages (blue panel), using flow cytometry. The dynamics of Gen0 parasites were fitted using a mathematical model allowing the parasite maturation rate () and the invasion ratio in DDAO-SEpos RBCs () to vary between groups (fitting estimates: for naive and acutely infected mice given Py donor parasites, respectively). All other parameters were held constant between naive and acutely infected mice ( d, d, /d, and ).
Host Responses Contribute to Slower Parasite Maturation.
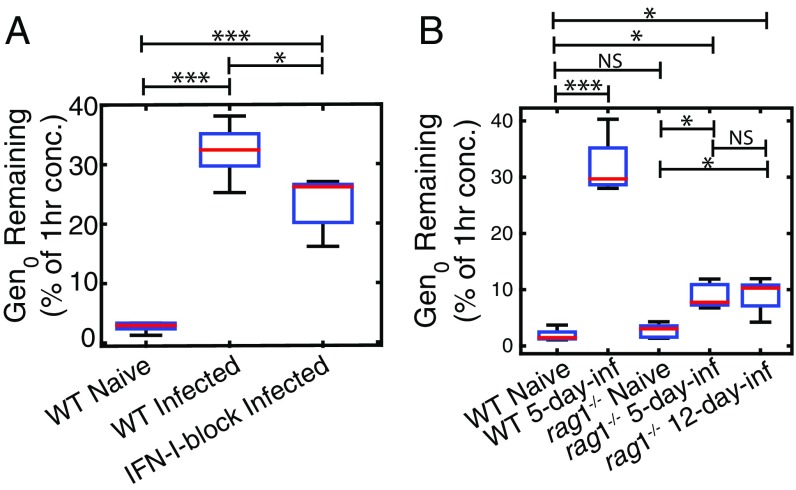
Given that the reduced parasite maturation rate was observed only a few days into the infection, we next investigated a possible role for host inflammatory responses in mediating this phenomenon (14). To begin exploring this, we first blocked type-I IFN cytokine signaling via the receptor IFNAR1, because our previous data had suggested this innate immune signaling pathway could influence circulating pRBC numbers and life stages in vivo (24) (Fig. 2C). However, blockade of type-I IFN signaling did not significantly alter the extent to which parasite maturation was slowed in acute infection, compared with acutely infected, control-treated mice (comparing nested models with F test, P = 0.50; Fig. 2C), nor did it substantially affect the invasion ratio, (P = 0.16, F test). Although it did marginally alter the persistence of circulating Gen0 pRBCs (Fig. 4A). This was consistent across two repeat experiments. Taken together, our analysis suggested that signaling via a single cytokine receptor, IFNAR1, may influence the capacity of the host to modulate parasite maturation rate, but not substantially.
Fig. 4.
Proportion of Gen0 parasites remaining 24 h after transfusion. (A) We see a slight reduction in the proportion of parasites remaining at 24 h in acutely infected mice with blocked IFN-I signaling compared with acutely infected mice that received nonspecific control anitbody. (B) We see some increase in the proportion of Gen0 parasites remaining at 24 h in acutely infected rag1−/− mice, but significantly less than the proportion of parasites remaining in acutely infected WT mice. NS, not significantly different; ***P < 0.0005, **P < 0.005, *P < 0.05.
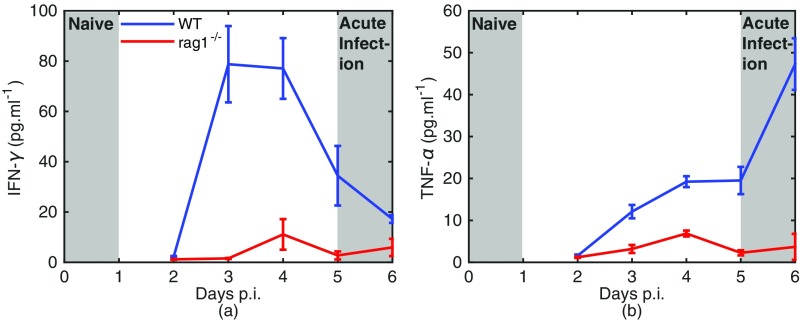
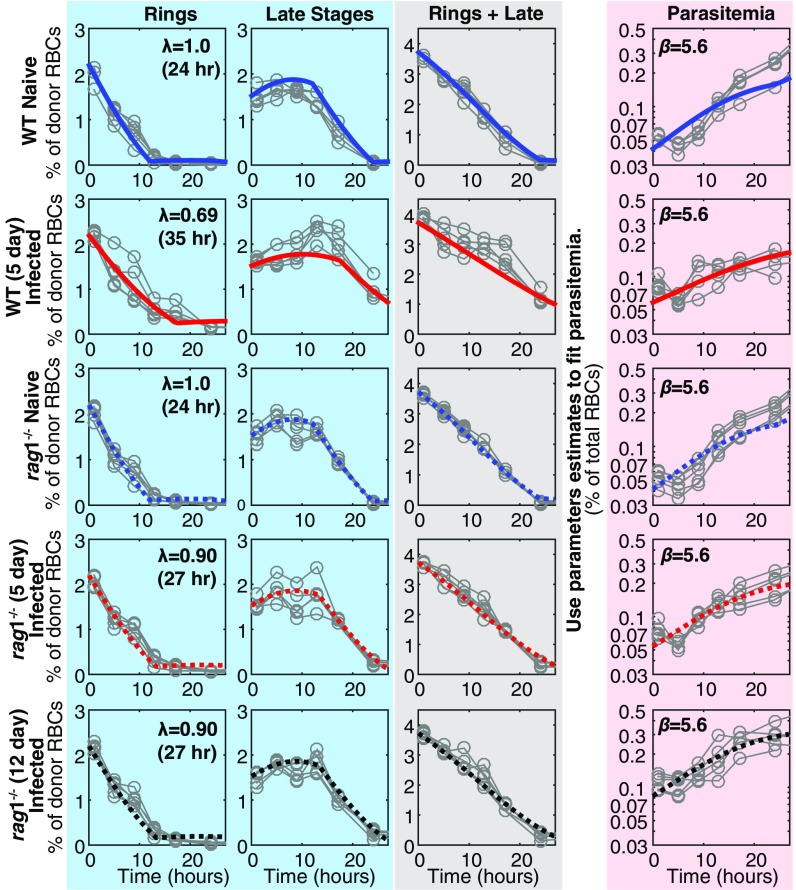
We next considered whether multiple host inflammatory responses might serve to impair parasite maturation. We used rag1−/− mice, which lack T and B cells and, most importantly, mount poor systemic inflammatory responses during infection, including weak production of TNF and IFNγ (Cytokine Responses in rag1−/− and WT Mice and Fig. S5) (14). The maturation rate in naive and rag1−/− mice was not significantly different from 1 (i.e., 24 h cycle time, P = 0.13, F test), nor was it significantly different from that in the naive WT mice (P = 0.10, F test). Further, compared with acutely infected WT mice, in which parasite maturation slowed by 31% (35-h cycle time) during acute infection (Fig. 5), Gen0 pRBCs exhibited little impaired maturation in 5-d infected rag1−/− mice, slowing only by 10% (27-h cycle time) (Fig. 5); this was significantly faster than in the acutely infected mice (P < 0.0001, F test), but significantly slower than in the naive rag1−/− mice (P = 0.01, F test). This was a consistent trend across two repeat experiments. Even when donor parasites were injected into 12-d infected rag1−/− mice [where the recipient (GFPneg) parasitemia was 13% ± 2% at the time of injection, compared with 6.9% ± 0.6% in 5-d infected WT mice and 2.6% ± 0.1% in 5-d infected rag1−/− mice], their maturation was still not dramatically slowed (no significant differences between 5-d and 12-d infected rag1−/− mice; P > 0.5, F test) (Fig. 5). Together, the maturation rate of parasites in rag1−/− mice, even in the presence of very high parasitemias, suggests that the phenomenon of slowed parasite maturation is dependent to a large degree on the host’s response to infection.
Fig. S5.
(A and B) IFN- (A) and tumor necrosis factor (TNF-) (B) levels in WT and rag1−/− mice. The shaded regions indicate the stage of infection of naive and acutely infected mice in our study. There is no detectable elevation in these cytokines over the first 24 h of infection (naive mice), but a dramatic increase in these responses by day 5 of infection (acutely infected mice). Systemic cytokine activity is largely suppressed in rag1−/− mice.
Fig. 5.
Fitting the dynamics of infection in WT and rag1−/− mice. Gen0 were sorted into ring stages and mature stages (blue panel), using flow cytometry. The dynamics of Gen0 parasites were fitted using a mathematical model in which all parameters were the held to be equivalent between the five groups and estimated from fitting ( 3.73%, d, d, d−1), with the exception of the maturation rate, and the invasion ratio in donor cells ( for WT naive, WT infected, rag1−/− naive, rag1−/− 5-d infected, and rag1−/− 12-d infected, respectively). We observed that the maturation rate in 5-d infected WT mice was significantly slower than the maturation rate in 5-d infected rag1−/− mice (F test, P < 0.0005). However, there was no significant difference in the maturation rates of parasites in 5-d and 12-d infected rag1−/− or between naive WT and naive rag1−/− mice (P > 0.5 and P = 0.10, respectively). The gray panel shows the overall dynamics of Gen0 parasites (rings + late stages). Extending the model to consider rupture of mature parasites and invasion of RBCs (including the invasion ratio parameter, ), we used the parameter estimates from fitting the Gen0 parasites (blue panel) to predict dynamics of the overall parasitemia (Gen0 + Gen1, red panel). Fitting this extended model to the parasitemia data (red panel), we estimated (not significantly different between groups, all comparisons P > 0.05) and the starting concentration of parasites from donor mice as a percentage of total RBCs for each group ( for WT naive, WT infected, rag1−/− naive, rag1−/− 5-d infected, and rag1−/− 12-d infected, respectively).
SI Materials and Methods
Mathematical Model of Impaired Parasite Maturation
To capture the slower-aging phenomenon we use an age-structured partial differential equation model similar to the model we presented previously (13); however, we now allow the rate at which parasites mature to vary. The density of parasites of maturity at time is given by The change in the density function with time is given by
| [S1] |
where, determines the rate at which parasites mature with time. is a the function describing the maturity-dependent rate at which parasites are cleared by the host and is taken to be
| [S2] |
where is the age at which parasites start to be cleared, and is the rate that parasites are cleared, as in previous models (13, 14). Although it should be noted that throughout this study, for simplicity. This system has an initial condition given by
| [S3] |
where is the starting concentration of parasites, and is a probability density function describing the initial distribution of parasite maturities and is taken to be a truncated normal distribution with mean and SD The boundary condition on this system is given in Eq. S4 and describes how parasites rupture once they reach maturity, releasing merozoites that go on to infect more RBCs, where describes the average number of RBCs becoming infected from every rupturing parasite. That is,
| [S4] |
where is the maturity at which parasites rupture ( in this study). It should be noted that when modeling the dynamics of Gen0 parasites (that is parasites in labeled RBCs) in the host, these parasitized cells are labeled. Therefore, if any uninfected labeled (donor) RBCs become infected once in the recipient animals, these will look like Gen0 pRBCs. However, we expect that the invasion of donor RBCs will be infrequent because uninfected donor RBCS make up a small fraction (∼3% of total RBCs in the recipient animals). In this paper, we first assume that after the initial transfusion of donor blood, Gen0 parasites will disappear from the host only over time (i.e., Gen0 parasites should not increase significantly due to new infection). Hence, when modeling the dynamics of Gen0 parasites, we take [as in previous work (13)]. Second, we extend this model to account for the expected low level of invasion of uninfected labeled RBCs by taking the boundary condition as in Eq. S4, but with an invasion ratio in donor cells only, i.e., The merozoite invasion ratio in donor RBCs () should be much less than the invasion ratio in all RBCs () because donor RBCs make up a small fraction of total RBCs.
It is important to realize that when this system is identical to the model we previously used to describe parasite dynamics within a host (13), and in that case the maturity of parasites, is equivalent to the actual age of parasites (measured in days). When parasites mature more slowly than usual. When fitting this model to the data in this paper, it is typically assumed that parasites mature with a 24-h life cycle () in WT naive mice.
The exact solution of this partial differential equation can be obtained analytically as
| [S5] |
where is a positive integer determined such that Total parasite numbers at time are given by
| [S6] |
The total number of ring stages at time in this model, is defined to be all parasites below the age 0.5 d (12 h),
| [S7] |
Late-stage parasites, are defined as the difference between the total parasites and the ring stages,
| [S8] |
Invasion of Donor Cells
We observed that Gen0 pRBCs persisted in the circulation of acutely infected mice beyond the usual 24-h life cycle, and that was observed in the naive mice (Fig. 1). One possible explanation for this is that uninfected donor RBCs (i.e., RBCs with the DDAO-SE label but not infected at the time of transfusion) became infected within the recipient mice after donor parasites ruptured and released merozoites. To consider this possibility explicitly our mathematical model included the potential for the infection of donor RBCs, by including a term, the parasite invasion ratio in donor cells (the average number of labeled donor RBCs infected by each rupturing mature pRBC, ) (Mathematical Model of Impaired Parasite Maturation). First we observed that a model that allowed for the invasion of donor RBCs but not slower maturation did not provide a good fit to the data compared with a model that allowed for slower maturation but no invasion of donor cells [very large difference in Akaike information criterion (AIC), ]. Second, we found that a model that accounts for both slower maturation and invasion of donor RBCs provides a significantly better fit of the data than a model that excludes invasion of donor RBCs (P < 0.0001, F test for nested models) (Fig. 2C). From this model we obtain estimates of the degree of invasion of donor RBCs in naive and acutely infected mice of and respectively (Fig. S2). However, this reinvasion does not play a significant role in our estimation of the slow maturation rate of donor cells, as the estimated cycle time of donor cells changed from 40 h in a model with no reinvasion to 37 h where reinvasion was also modeled.
Understanding How Slower Maturation Mediates Control of Infection
To explore how slower maturation might have mediated control of parasite population growth we further interrogated our mathematical model. This revealed that slower maturation of parasites could reduce the PMF in at least two ways: First, a reduced rate of maturation leads to fewer life cycles and less amplification of the parasite population in a given time (Fig. S3A); and second, slower maturation increases the time spent in circulation, thus increasing the probability of removal by the host before pRBC rupture (Fig. S3B).
P. yoelii Infection
The adoptive transfer experiment presented in Fig. S4 was performed by transferring Py into either naive mice or mice with an ongoing 5-d infection with PbA-GFPpos pRBCs. The model used to fit the data in Fig. S4 is described in Mathematical Model of Impaired Parasite Maturation, with the exception that the starting distribution of parasite stages was taken to be a normal distribution wrapped at the boundary, rather than a truncated normal distribution; i.e., where is a normal distribution with mean and SD and is a scaling factor indicating that the rupturing schizont will infect on average RBCs. This extension of the model captures the possibility that parasites being taken from the donor mice may be midway through a period of schizont rupture, where perhaps half the schizonts have ruptured and produced rings, and the remaining schizonts are yet to rupture. This feature was introduced because the donor Py-infected mice had a high proportion of ring stages and schizont stages at the time of transfer, suggesting they were midway through a period of schizont rupture. The extended model has one extra parameter,
In addition, in this experiment the donor and recipient parasites were switched (as in Fig. S1). Therefore, in this experiment we noted that detecting the GFPneg Py pRBCs in unlabeled recipient RBCs (DDAO-SEneg) was less sensitive than detecting GFPpos pRBCs in recipient RBCs; i.e., there was a significantly higher level of background staining (DNA and RNA staining of uninfected RBCs falsely indicating that they were infected). For this reason we excluded analysis of the total parasitemia of GFPneg (i.e., donor) parasites in this experiment.
Cytokine Responses in rag1−/− and WT Mice
Cytokine responses to infection in WT and rag1−/− mice were investigated as previously described (Fig. S5) (14). Briefly, PbA-GFPneg were passaged through a C57BL/6 mouse before infecting a group of WT and rag1−/− mice with 105 pRBCs intravenously. Cytokines in plasma samples were quantified with cytometric bead array flexsets (BD Biosciences) on a FACSarray equipped with BD Flexset analysis software (BD Biosciences) in accordance with manufacturer’s instructions.
Discussion
In this study we provide evidence of a host-mediated mechanism for controlling circulating blood-stage Plasmodium parasites during acute infection, via the slowing of parasite maturation. This result is surprising, as Plasmodium infection is generally thought to be characterized by a regular life cycle with a periodicity expressed in multiples of 24 h that is often thought to synchronize with the host’s diurnal rhythms (6, 25, 26). In P. berghei, for example, the parasite cycle time is thought to be of the order of 24 h in naive mice (20), consistent with our observations in naive mice. However, there are a number of precedents for altered Plasmodium life-cycle kinetics in vitro and in vivo. In vitro, for example, reduced availability of isoleucine has been shown to slow the maturation rate of P. falciparum, which has been estimated to have a 60% decrease in the rate of maturation through the parasite life cycle (27). This suggests that deprivation of nutrients could theoretically slow parasite development in vivo. However, the slower maturation we observe is not simply dependent on parasite density, as slow maturation is not observed in rag1−/− mice even at high parasitemia (Fig. 5). Thus, if the mechanism of impaired development is due to nutrient restriction, this restriction appears dependent on the presence of host responses that are altered in rag1−/− mice.
In vitro and in vivo studies have shown a significant variation in the maturation times for different strains of P. falciparum (1, 28), reinforcing the precedent for a nonfixed parasite life-cycle duration. In vivo the life cycle of the parasite is influenced by the diurnal rhythm of the host (25, 29). Parasite replication is significantly reduced when the parasite life cycle is mismatched with the diurnal rhythm of the host (25, 29). Further, in a number of animal models of infection it has been observed that the parasite adjusts to the rhythm of the host within a few life cycles (30, 31). This suggests that the parasite population on average will shorten or lengthen its life cycle in response to the host environment, to match the rhythm of the host. Interestingly, the presumably minor variations in host environment during the host diurnal rhythm must have major impacts on parasite replication, to synchronize host and parasite cycles over a few days (25, 29). It is perhaps not surprising that the large alterations in host environment during an acute inflammatory response to infection may also perturb the parasite life cycle. Therefore, an interesting line of inquiry would be to explore other parasite species, such as Plasmodium chabaudi, which typically produce quite synchronous infections that align with host diurnal rhythms and melatonin level (32). Because the maturation schedule in P. chabaudi is affected by diurnal factors in the host, the additional impact of host inflammation may lead to more complex patterns of parasite maturation.
Other studies suggest that drug treatment is also able to slow or halt (dormancy) the life cycle of P. falciparum parasites, which is thought to be a parasite stress response allowing parasites to survive treatment (33–37). Hence, it seems likely that slower maturation occurs as a parasite survival mechanism in response to environmental stress, perhaps as a result of the parasite directing resources to mitigate damage caused by some form of stress placed on the parasite, whether by drug or by the host environment. Thus, it is interesting to consider whether slower maturation could be considered a common adaptive strategy for parasite survival in a hostile environment.
The precise mechanism causing slower maturation in acutely infected hosts remains unclear. However, remembering that identical infected donor cells were transfused from the same donor mice into naive and acutely infected mice, host environmental factors must be able to act on already infected cells to influence the parasite development schedule. Further, it is clear from our study that this sensing of the environment by the parasite is rapid, because persistence of Gen0 pRBCs was evident after the first time point (4 h, Fig. 1D). In addition, we have identified a key role for host factors in this process. Parasite maturation was not slowed in rag1−/− mice, which lack both T and B cells and have other abnormalities of lymphoid architecture. This does not imply that antigen-specific immunity is required for slow maturation, as T and B cells are known to also contribute to early innate immune responses through the production of cytokines (38–40). Indeed, when we compared early cytokine production in WT vs. rag1−/− mice, we found that rag1−/− mice show much reduced cytokine production from day 4 (Fig. S5) (14).
Previous studies have used a modeling approach to investigate the contribution of parasite clearance or reduced availability or susceptibility of uninfected red blood cells as mechanisms limiting parasite growth in acute infection (12, 13). However, these studies did not consider the possibility that parasite maturation rates could change in vivo. In this study, we specifically chose to transfer semisynchronous ring-stage Gen0 pRBCs to facilitate an easier examination of parasite life stages. By using this approach we were able to observe the phenomenon of slowed parasite maturation. Our modeling approaches revealed that the observed slow parasite growth in 5-d infected mice can be completely explained once slow parasite maturation is considered. Despite the lack of evidence for faster clearance of pRBCs in this study, we cannot entirely exclude a role for increased splenic clearance during infection; but we have established that slow maturation has a major effect on overall parasite growth in these acute murine infections.
Our study clearly demonstrates that slow parasite maturation plays a major role in inhibiting parasite proliferation during acute blood-stage Plasmodium infection of mice. Moreover, the host response itself is required for slowing parasite maturation. Further work is needed to identify the exact molecular mediators of slower maturation. A major question is whether this process controls parasite growth in humans acutely infected with P. falciparum, where ethical and experimental limitations make this a challenging question to answer. Nevertheless, our in vivo observations provide unique insights into the dynamic nature of host–parasite interactions during acute blood-stage Plasmodium infection.
Materials and Methods
Experimental Mice and Ethics.
Female C57BL/6J WT mice aged 6–12 wk were purchased from the Australian Resource Centre. Female C57BL/6J rag1−/− mice were bred at QIMR Berghofer Medical Research Institute and maintained under conventional conditions. All experimental groups in this study consisted of n = 5 mice. This study was carried out in strict accordance with guidelines from The National Health and Medical Research Council of Australia. All animal procedures and protocols were approved (A02-633M and A1503-601M) and monitored by the QIMR Berghofer Medical Research Institute Animal Ethics Committee.
Parasites, Infections, and in Vivo Treatments.
PbA and Py infections were initiated by defrosting frozen stabilates (200–300 µL) and injecting them into single WT C57BL/6J passage mice. Transgenic PbA-GFPpos strains were maintained as previously reported (41). Once parasitemia was patent on either day 3 or day 4 postinfection, passage mice were euthanized and infected blood was recovered by cardiac puncture. Acutely infected mice were generated by administering WT mice 105 pRBCs (PbA-GFPneg or PbA-GFPpos) i.v. via the lateral tail vein, using 26-gauge needles in a volume of 200 µL. PbA- and Py-infected donor mice were generated by injection of defrosted stabilates as above. IFNAR1-blocking monoclonal antibody (clone MAR1-5A3; Leinco Technologies Inc.) or an isotype control antibody (Leinco Technologies Inc.) was administered in 0.1-mg doses in 200-µL vol, diluted with 0.9% Saline (Baxter), via i.p. injection (26-gauge needles) on days 0, 2, and 4 postinfection.
Adoptive Transfer of Donor RBCs.
Donor mice were euthanized, and cardiac punctures performed to collect blood into lithium heparin tubes (1 mL MiniCollect; Greiner Bio-One). Heparinized blood was washed twice in Ca2+/Mg2+-free PBS (PBS-A) (Life Technologies) and stained in CellTrace Far Red DDAO-SE (Life Technologies) according to manufacturer’s instructions. Briefly, 50 μg CellTrace was dissolved for 10 min in 25 μL dimethyl sulphoxide (DMSO). This was added to 5 mL of resuspended blood in PBS-A. Blood was stained in the dark, at room temperature with constant rolling for 15 min, and then washed twice in 10× vol PBS-A. Successful labeling of RBCs was confirmed by flow cytometry, using an LSRII Fortessa analyzer (BD Biosciences) and FlowJo software (Treestar). CellTrace-labeled blood was resuspended in 2-mL vol per donor mouse and injected in 200-μL vol via i.v. injection using a 26-gauge needle.
Flow Cytometric Analysis of Blood.
Forward scatter (FSC) and side scatter (SSC) were used to distinguish RBCs from other cell types. Plotting FSC area (FSC-A) and FSC height (FSC-H) allowed the exclusion of doublets (events recorded by the flow cytometer that are the result of two cells being detected simultaneously). A flow cytometric method, adapted from various research groups (21–23), was used to simultaneously detect adoptively transferred (CellTrace-labeled) RBCs, to distinguish GFPpos from GFPneg parasites, and to ascertain parasite life-cycle stages. Briefly, a single drop of blood from a tail bleed was diluted and mixed in 200 μL RPMI medium containing 5 units/mL heparin sulfate. Diluted blood was simultaneously stained for 30 min in the dark at room temperature with the cell-permeant RNA/DNA stain, Syto84 (5 μM; Life Technologies) and with DNA stain, Hoechst 33342 (10 μg/mL; Sigma). Staining was quenched with 10 vol RPMI medium, and samples were immediately analyzed by flow cytometry, using an LSRII Fortessa analyzer (BD Biosciences) and FlowJo software (Treestar). Adoptively transferred donor RBCs were readily distinguished from endogenous RBCs by CellTrace labeling. Infected RBCs were detected as being Hoechst 33342+ and Syto84+. Unless otherwise stated the concentration of infected donor RBCs (usually DDAO-SEpos and GFPpos infected RBCs) is measured as a percentage of total donor RBCs (i.e., DDAO-SEpos RBCs).
Statistical Tests and Nonlinear Fitting.
All errors reported in this paper are SEMs (). All comparisons of group means were performed using a one-way ANOVA followed by a post hoc contrast analysis [using the anova1.m and multcompare.m functions in MATLAB R2014b (8.4.0.150421)], unless otherwise stated. Nonlinear fitting of the models described in Mathematical Model of Impaired Parasite Maturation were performed using the constrained optimization function fmincon.m or the unconstrained optimization function fminsearch.m in MATLAB R2014b (8.4.0.150421). These functions minimize a user-specified function, which is the unweighted sum of squared residuals in this study (Figs. 2 and 5). When fitting the life-stage data for Gen0 pRBCs (blue panels in Figs. 2 and 5), ring stages and late stages for all three groups were fitted simultaneously by minimizing the sum of all squared residuals (that is, the sum of squared differences between the model and all time points for all mice). When fitting the data for parasitemia (red panels in Figs. 2 and 5), the sum of squared residuals of the log-transformed data was minimized. Residuals between the model and all mice from each group were included in the sum of squares calculation. When testing whether the inclusion of additional parameters in a model was justified, an F test was used to compare the complete model to the restricted model (the full model but with some parameters fixed or set to zero). A parameter was determined to be significant if the hypothesis test showed that the restricted model was not supported by the data (i.e., P < 0.05).
Acknowledgments
This work was supported by the Australian Research Council (Grant DP120100064) and the National Health and Medical Research Council (NH&MRC) (Grant 1082022 to M.P.D., D.C., and A.H.; Grant 1080001 to M.P.D.; and Grants 1028634 and 1028641 to A.H.). The Australian Federal Government provided Australian Postgraduate awards (to D.S.K. and K.R.J.). The University of Queensland (UQ) provided International Postgraduate Research scholarships (to I.S. and J.A.) and a UQ Advantage grant (to I.S.). M.S.F.S. and S.E.B. were supported by Australian NH&MRC Project Grants 613702 and 1028641.
Footnotes
The authors declare no conflict of interest.
This article is a PNAS Direct Submission. A.F.R. is a guest editor invited by the Editorial Board.
This article contains supporting information online at www.pnas.org/lookup/suppl/doi:10.1073/pnas.1618939114/-/DCSupplemental.
References
- 1.Douglas AD, et al. Comparison of modeling methods to determine liver-to-blood inocula and parasite multiplication rates during controlled human malaria infection. J Infect Dis. 2013;208:340–345. doi: 10.1093/infdis/jit156. [DOI] [PMC free article] [PubMed] [Google Scholar]
- 2.Roca-Feltrer A, et al. The age patterns of severe malaria syndromes in sub-Saharan Africa across a range of transmission intensities and seasonality settings. Malar J. 2010;9:282. doi: 10.1186/1475-2875-9-282. [DOI] [PMC free article] [PubMed] [Google Scholar]
- 3.Doolan DL, Dobaño C, Baird JK. Acquired immunity to malaria. Clin Microbiol Rev. 2009;22:13–36. doi: 10.1128/CMR.00025-08. [DOI] [PMC free article] [PubMed] [Google Scholar]
- 4.Pinkevych M, et al. Decreased growth rate of P. falciparum blood stage parasitemia with age in a holoendemic population. J Infect Dis. 2014;209:1136–1143. doi: 10.1093/infdis/jit613. [DOI] [PMC free article] [PubMed] [Google Scholar]
- 5.Molineaux L, Träuble M, Collins WE, Jeffery GM, Dietz K. Malaria therapy reinoculation data suggest individual variation of an innate immune response and independent acquisition of antiparasitic and antitoxic immunities. Trans R Soc Trop Med Hyg. 2002;96:205–209. doi: 10.1016/s0035-9203(02)90308-1. [DOI] [PubMed] [Google Scholar]
- 6.Kwiatkowski D. Febrile temperatures can synchronize the growth of Plasmodium falciparum in vitro. J Exp Med. 1989;169:357–361. doi: 10.1084/jem.169.1.357. [DOI] [PMC free article] [PubMed] [Google Scholar]
- 7.Stevenson MM, Riley EM. Innate immunity to malaria. Nat Rev Immunol. 2004;4:169–180. doi: 10.1038/nri1311. [DOI] [PubMed] [Google Scholar]
- 8.Buffet PA, Safeukui I, Milon G, Mercereau-Puijalon O, David PH. Retention of erythrocytes in the spleen: A double-edged process in human malaria. Curr Opin Hematol. 2009;16:157–164. doi: 10.1097/MOH.0b013e32832a1d4b. [DOI] [PubMed] [Google Scholar]
- 9.Evans KJ, Hansen DS, van Rooijen N, Buckingham LA, Schofield L. Severe malarial anemia of low parasite burden in rodent models results from accelerated clearance of uninfected erythrocytes. Blood. 2006;107:1192–1199. doi: 10.1182/blood-2005-08-3460. [DOI] [PMC free article] [PubMed] [Google Scholar]
- 10.Jarra W, Brown KN. Protective immunity to malaria: Studies with cloned lines of rodent malaria in CBA/Ca mice. IV. The specificity of mechanisms resulting in crisis and resolution of the primary acute phase parasitaemia of Plasmodium chabaudi chabaudi and P. yoelii yoelii. Parasite Immunol. 1989;11:1–13. doi: 10.1111/j.1365-3024.1989.tb00644.x. [DOI] [PubMed] [Google Scholar]
- 11.Smith LP, Hunter KW, Oldfield EC, Strickland GT. Murine malaria: Blood clearance and organ sequestration of Plasmodium yoelii-infected erythrocytes. Infect Immun. 1982;38:162–167. doi: 10.1128/iai.38.1.162-167.1982. [DOI] [PMC free article] [PubMed] [Google Scholar]
- 12.Metcalf CJE, et al. Partitioning regulatory mechanisms of within-host malaria dynamics using the effective propagation number. Science. 2011;333:984–988. doi: 10.1126/science.1204588. [DOI] [PMC free article] [PubMed] [Google Scholar]
- 13.Khoury DS, et al. Reduced erythrocyte susceptibility and increased host clearance of young parasites slows Plasmodium growth in a murine model of severe malaria. Sci Rep. 2015;5:9412. doi: 10.1038/srep09412. [DOI] [PMC free article] [PubMed] [Google Scholar]
- 14.Khoury DS, et al. Effect of mature blood-stage Plasmodium parasite sequestration on pathogen biomass in mathematical and in vivo models of malaria. Infect Immun. 2014;82:212–220. doi: 10.1128/IAI.00705-13. [DOI] [PMC free article] [PubMed] [Google Scholar]
- 15.Buffet PA, et al. The pathogenesis of Plasmodium falciparum malaria in humans: Insights from splenic physiology. Blood. 2011;117:381–392. doi: 10.1182/blood-2010-04-202911. [DOI] [PMC free article] [PubMed] [Google Scholar]
- 16.Chotivanich K, et al. Central role of the spleen in malaria parasite clearance. J Infect Dis. 2002;185:1538–1541. doi: 10.1086/340213. [DOI] [PubMed] [Google Scholar]
- 17.Del Portillo HA, et al. The role of the spleen in malaria. Cell Microbiol. 2012;14:343–355. doi: 10.1111/j.1462-5822.2011.01741.x. [DOI] [PubMed] [Google Scholar]
- 18.Safeukui I, et al. Retention of Plasmodium falciparum ring-infected erythrocytes in the slow, open microcirculation of the human spleen. Blood. 2008;112:2520–2528. doi: 10.1182/blood-2008-03-146779. [DOI] [PubMed] [Google Scholar]
- 19.Quinn TC, Wyler DJ. Intravascular clearance of parasitized erythrocytes in rodent malaria. J Clin Invest. 1979;63:1187–1194. doi: 10.1172/JCI109413. [DOI] [PMC free article] [PubMed] [Google Scholar]
- 20.Deharo E, Coquelin F, Chabaud AG, Landau I. The erythrocytic schizogony of two synchronized strains of plasmodium berghei, NK65 and ANKA, in normocytes and reticulocytes. Parasitol Res. 1996;82:178–182. doi: 10.1007/s004360050091. [DOI] [PubMed] [Google Scholar]
- 21.Apte SH, Groves PL, Roddick JSP, P da Hora V, Doolan DL. High-throughput multi-parameter flow-cytometric analysis from micro-quantities of plasmodium-infected blood. Int J Parasitol. 2011;41:1285–1294. doi: 10.1016/j.ijpara.2011.07.010. [DOI] [PubMed] [Google Scholar]
- 22.Klonis N, et al. Artemisinin activity against Plasmodium falciparum requires hemoglobin uptake and digestion. Proc Natl Acad Sci USA. 2011;108:11405–11410. doi: 10.1073/pnas.1104063108. [DOI] [PMC free article] [PubMed] [Google Scholar]
- 23.Malleret B, et al. A rapid and robust tri-color flow cytometry assay for monitoring malaria parasite development. Sci Rep. 2011;1:118. doi: 10.1038/srep00118. [DOI] [PMC free article] [PubMed] [Google Scholar]
- 24.Haque A, et al. Type I IFN signaling in CD8- DCs impairs Th1-dependent malaria immunity. J Clin Invest. 2014;124:2483–2496. doi: 10.1172/JCI70698. [DOI] [PMC free article] [PubMed] [Google Scholar]
- 25.O’Donnell AJ, Schneider P, McWatters HG, Reece SE. Fitness costs of disrupting circadian rhythms in malaria parasites. Proc Biol Sci. 2011;278:2429–2436. doi: 10.1098/rspb.2010.2457. [DOI] [PMC free article] [PubMed] [Google Scholar]
- 26.Mideo N, Reece SE, Smith AL, Metcalf CJE. The Cinderella syndrome: Why do malaria-infected cells burst at midnight? Trends Parasitol. 2013;29:10–16. doi: 10.1016/j.pt.2012.10.006. [DOI] [PMC free article] [PubMed] [Google Scholar]
- 27.Babbitt SE, et al. Plasmodium falciparum responds to amino acid starvation by entering into a hibernatory state. Proc Natl Acad Sci USA. 2012;109:E3278–E3287. doi: 10.1073/pnas.1209823109. [DOI] [PMC free article] [PubMed] [Google Scholar]
- 28.Reilly Ayala HB, Wacker MA, Siwo G, Ferdig MT. Quantitative trait loci mapping reveals candidate pathways regulating cell cycle duration in Plasmodium falciparum. BMC Genomics. 2010;11:577. doi: 10.1186/1471-2164-11-577. [DOI] [PMC free article] [PubMed] [Google Scholar]
- 29.O’Donnell AJ, Mideo N, Reece SE. Disrupting rhythms in Plasmodium chabaudi: Costs accrue quickly and independently of how infections are initiated. Malar J. 2013;12:372. doi: 10.1186/1475-2875-12-372. [DOI] [PMC free article] [PubMed] [Google Scholar]
- 30.Gautret P, Deharo E, Tahar R, Chabaud AG, Landau I. The adjustment of the schizogonic cycle of Plasmodium chabaudi chabaudi in the blood to the circadian rhythm of the host. Parasite. 1995;2:69–74. doi: 10.1051/parasite/1995021069. [DOI] [PubMed] [Google Scholar]
- 31.Taliaferro WH, Taliaferro LG. Alteration in the time of sporulation of Plasmodium brasilianum in monkeys by reversal of light and dark. Am J Hyg. 1934;20:50–59. [Google Scholar]
- 32.Bagnaresi P, et al. Unlike the synchronous Plasmodium falciparum and P. chabaudi infection, the P. berghei and P. yoelii asynchronous infections are not affected by melatonin. Int J Gen Med. 2009;2:47–55. doi: 10.2147/ijgm.s3699. [DOI] [PMC free article] [PubMed] [Google Scholar]
- 33.Dogovski C, et al. Targeting the cell stress response of Plasmodium falciparum to overcome artemisinin resistance. PLoS Biol. 2015;13:e1002132. doi: 10.1371/journal.pbio.1002132. [DOI] [PMC free article] [PubMed] [Google Scholar]
- 34.Mok S, et al. Drug resistance. Population transcriptomics of human malaria parasites reveals the mechanism of artemisinin resistance. Science. 2015;347:431–435. doi: 10.1126/science.1260403. [DOI] [PMC free article] [PubMed] [Google Scholar]
- 35.Cheng Q, Kyle DE, Gatton ML. Artemisinin resistance in Plasmodium falciparum: A process linked to dormancy? Int J Parasitol Drugs Drug Resist. 2012;2:249–255. doi: 10.1016/j.ijpddr.2012.01.001. [DOI] [PMC free article] [PubMed] [Google Scholar]
- 36.Codd A, Teuscher F, Kyle DE, Cheng Q, Gatton ML. Artemisinin-induced parasite dormancy: A plausible mechanism for treatment failure. Malar J. 2011;10:56. doi: 10.1186/1475-2875-10-56. [DOI] [PMC free article] [PubMed] [Google Scholar]
- 37.Teuscher F, et al. Artemisinin‐induced dormancy in plasmodium falciparum: Duration, recovery rates, and implications in treatment failure. J Infect Dis. 2010;202:1362–1368. doi: 10.1086/656476. [DOI] [PMC free article] [PubMed] [Google Scholar]
- 38.Bao Y, et al. Identification of IFN-γ-producing innate B cells. Cell Res. 2014;24:161–176. doi: 10.1038/cr.2013.155. [DOI] [PMC free article] [PubMed] [Google Scholar]
- 39.Freeman BE, Hammarlund E, Raué H-P, Slifka MK. Regulation of innate CD8+ T-cell activation mediated by cytokines. Proc Natl Acad Sci USA. 2012;109:9971–9976. doi: 10.1073/pnas.1203543109. [DOI] [PMC free article] [PubMed] [Google Scholar]
- 40.Kelly-Scumpia KM, et al. B cells enhance early innate immune responses during bacterial sepsis. J Exp Med. 2011;208:1673–1682. doi: 10.1084/jem.20101715. [DOI] [PMC free article] [PubMed] [Google Scholar]
- 41.Haque A, et al. Granzyme B expression by CD8+ T cells is required for the development of experimental cerebral malaria. J Immunol. 2011;186:6148–6156. doi: 10.4049/jimmunol.1003955. [DOI] [PubMed] [Google Scholar]


