Significance
Understanding the molecular factors that shape the impact of hyperinsulinemia on cancer progression would improve treatment of obese and diabetic patients. This work contributes to such understanding by showing that gain-of-function p53 mutations can modify the response of cancer cells to insulin, increasing proliferation and motility through enhanced activation of AKT.
Keywords: mutant p53, AIP1, obesity, hyperinsulinemia, AKT
Abstract
Obesity and type 2 diabetes are significant risk factors for malignancies, being associated with chronic inflammation and hyperinsulinemia. In this context, insulin can synergize with inflammation to promote proliferation, survival, and dissemination of cancer cells. Point mutation of p53 is a frequent event and a significant factor in cancer development and progression. Mutant p53 protein(s) (mutp53) can acquire oncogenic properties that increase metastasis, proliferation, and cell survival. We report that breast and prostate cancer cells with mutant p53 respond to insulin stimulation by increasing cell proliferation and invasivity, and that such a response depends on the presence of mutp53. Mechanistically, we find that mutp53 augments insulin-induced AKT1 activation by binding and inhibiting the tumor suppressor DAB2IP (DAB2-interacting protein) in the cytoplasm. This molecular axis reveals a specific gain of function for mutant p53 in the response to insulin stimulation, offering an additional perspective to understand the relationship between hyperinsulinemia and cancer evolution.
Obesity and type 2 diabetes lead to chronic inflammation and metabolic syndrome, and are linked to an increased incidence of malignancies (1). In this context, various evidence indicates that hyperinsulinemia is a major cancer risk factor (2). In vivo and tissue culture studies showed that insulin has mitogenic action in normal mammary tissue and in breast cancer cells (3), and hyperinsulinemia was correlated to increased metastasis in a mouse model of breast cancer (4). High levels of circulating insulin may promote tumor progression by activating the insulin receptor (INSR) and/or insulin-like growth factor 1 (IGF1R) receptor, which is frequently overexpressed in cancer cells (5). In fact, increased INSR/IGF1R activation was linked to accelerated mammary tumor growth in hyperinsulinemic mouse models (6), and IGF1R or INSR overexpression was shown to enhance tumor growth and progression in androgen-independent prostate cancer (7).
Chronic inflammation may also contribute to cancer development in obese/hyperinsulinemic patients. In white fat, immune cells and macrophages are continuously activated to secrete proinflammatory factors, including TNF, that can initiate, promote, and sustain tumorigenesis, in part, by further enhancing insulin resistance (8).
The protein kinase AKT/PKB is a key mediator of proliferative and prosurvival effects of insulin on tumor cells (9). In addition, AKT links hyperinsulinemia to inflammation through direct activation of NF-κB (5). Therefore, aberrant AKT activation is a strong candidate to be a driver of cancer aggressiveness under conditions of obesity/hyperinsulinemia.
Mutation of p53 is another significant factor in cancer. Missense mutant p53 protein(s) (mutp53) are very stable and acquire oncogenic properties (gain of function) that increase metastasis, proliferation, and cell survival (10, 11). Intriguingly, some mutp53 oncogenic properties appear to be linked to enhanced AKT activity; previous studies have reported evidence that mutant p53 can enhance AKT activation in lung, endometrial, and breast cancer cell lines, and a correlation between p53 mutation and AKT phosphorylation was detected in clinical specimens of colon and breast cancer (12–14). However, a clear molecular basis for this relationship was not defined.
Mechanistically, mutp53 can act either at the transcriptional level or by forming complexes with various cellular targets (11). We recently found that gain-of-function mutp53 can bind the tumor suppressor protein DAB2IP in the cytoplasm and interfere with its functions, promoting an oncogenic response of cancer cells to the inflammatory cytokine TNF-α in particular (15). DAB2IP/AIP1 (DOC-2/DAB2-interacting protein, or ASK1-interacting protein) is a cytoplasmic Ras GAP that also functions as an adaptor in signal transduction by multiple pathways. In cells treated with TNF, it mediates activation of the Ask1/JNK kinases and counteracts activation of NF-κB (16). In addition, DAB2IP modulates other crucial oncogenic pathways, and inhibits epithelial-mesenchymal transition (EMT) in cancer cells (recently reviewed in refs. 17, 18). Interestingly, DAB2IP is a negative modulator of PI3K/AKT signaling, because it binds PI3K-p85, limiting AKT activation in response to various stimuli (19). Moreover, DAB2IP binds directly to AKT1, possibly limiting its activation, or function (19). We report that mutant p53, by binding and inhibiting DAB2IP, favors insulin-induced AKT activation in cancer cells, thus dictating an oncogenic response to this hormone.
Results
Mutant p53 Amplifies the Oncogenic Activity of Insulin in Hormone-Independent Breast and Prostate Cancer Cells.
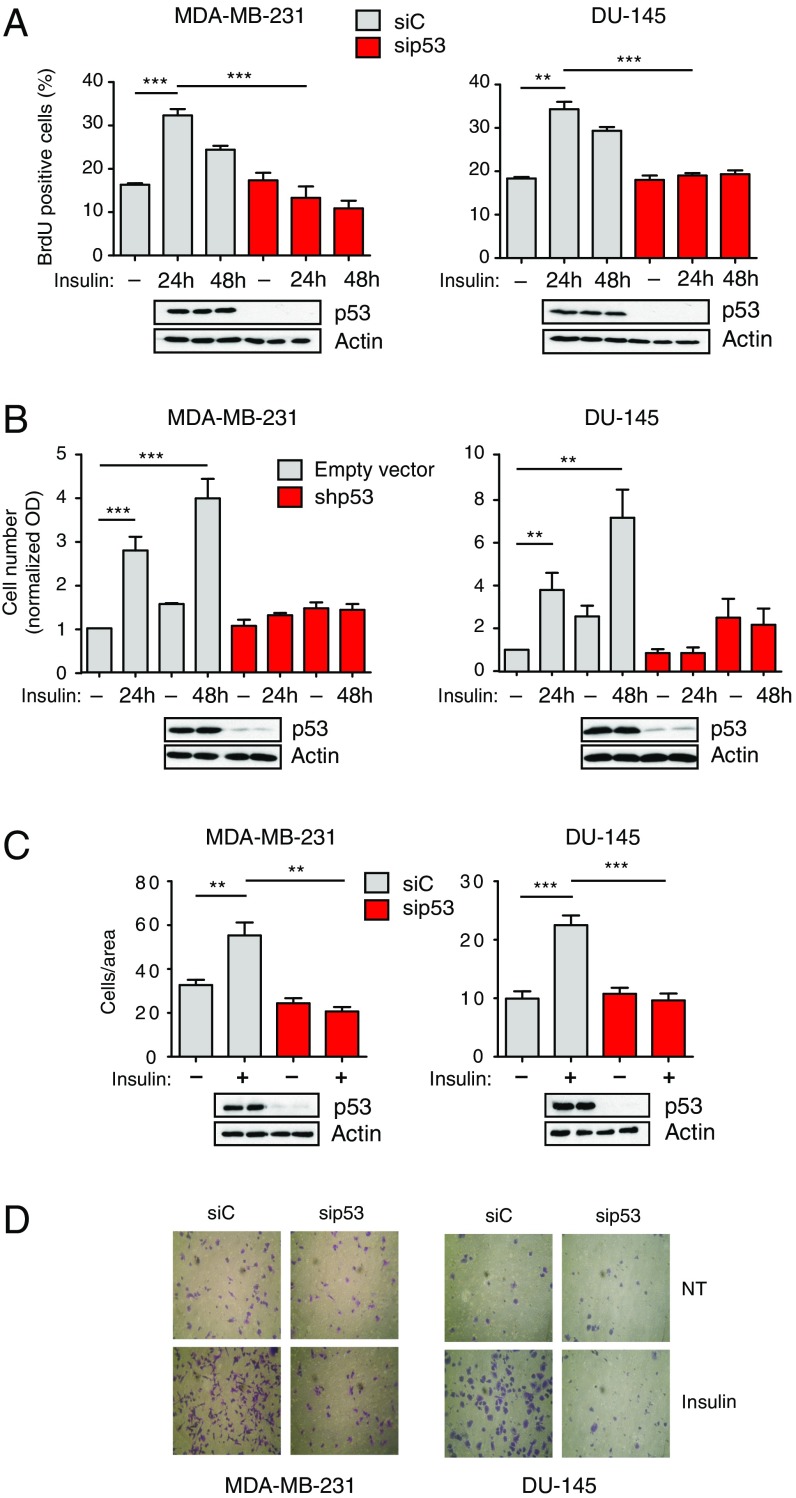
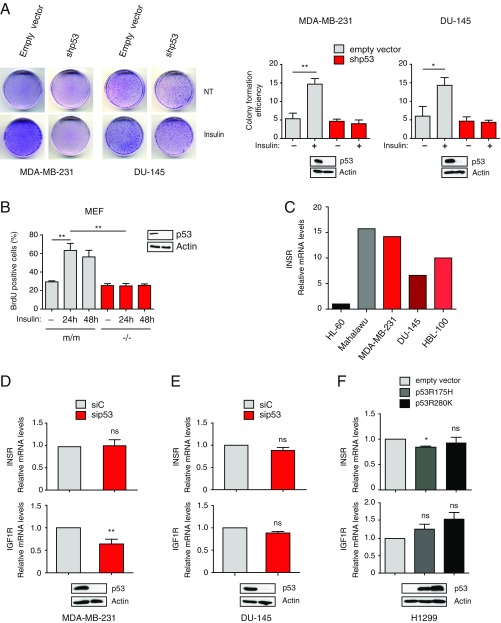
To explore the potential role of mutant p53 in the response of cancer cells to insulin, we performed 5′-bromo-2′-deoxyuridine (BrdU) incorporation, cell proliferation, and Matrigel invasion assays with two human cancer cell lines bearing different missense TP53 mutations: MDA-MB231 (triple-negative breast cancer, p53R280K) and DU145 (androgen-independent prostate cancer, p53V274F/P223L). We observed that insulin increases proliferation and enhances the invasive capabilities of these cells. Strikingly, depletion of endogenous mutant p53 prevented this effect, suggesting that such an increase is strictly dependent on mutp53 expression (Fig. 1). Colony formation assays confirmed that mutant p53 enhances proliferation of cancer cells chronically exposed to insulin (Fig. S1A). Using Ras-transformed mouse embryonic fibroblasts (MEFs) derived from p53 knockout or p53 (R172H) knock-in mice, we verified that insulin triggers an increase in cell proliferation only in MEFs expressing mutant p53 (Fig. S1B). Together, these data indicate that mutant p53 can be a determinant of the pro-oncogenic response to insulin, potentially defining a novel mutp53 gain of function.
Fig. 1.
Mutant p53 dictates an oncogenic response to insulin in hormone-independent cancer cells. (A and B) Mutant p53 is required for insulin-induced proliferation in cancer cells. (A) MDA-MB231 and DU145 cells were transfected with the indicated siRNAs for 48 h, serum-starved, treated with 0.5 μg/mL insulin for 24 or 48 h, and labeled with BrdU for 2 h. Graphs summarize the percentage of BrdU-positive nuclei (mean ± SEM; n = 3; **P < 0.01, ***P < 0.001). Depletion of endogenous p53 was checked by Western blot. (B) MDA-MB231 and DU145 cells stably silenced for endogenous mutant p53 [short hairpin p53 (shp53)] were serum-starved, treated with 0.5 μg/mL insulin for 24 or 48 h, and then colored with crystal violet dye. Graphs summarize normalized OD570 (mean ± SEM; n = 3; **P < 0.01, ***P < 0.001). Depletion of endogenous p53 was checked by Western blot. (C and D) Mutant p53 is required for insulin-induced invasion. Cells were transfected with the indicated siRNAs for 48 h, serum-starved for 24 h, and treated with insulin (0.5 μg/mL) for an additional 24 h. Invasion assays were performed in low serum plus 0.5 μg/mL insulin. (C) Graphs summarize migrated cells per area (mean ± SEM; n = 3; **P < 0.01, ***P < 0.001). Depletion of endogenous p53 was checked by Western blot. (D) Representative images of migrated cells from C, fixed and stained with crystal violet dye. (Magnification: 400×.) NT, not treated.
Fig. S1.
Mutant p53 depletion reduces insulin-induced cell proliferation without affecting expression of INSRs (related to Fig. 1). (A) Mutp53 sustains insulin-induced cell proliferation. MDA-MB231 and DU145 cells stably silenced for endogenous mutant p53 (shp53) were plated at low density and treated with 0.5 μg/mL insulin every 48 h for 10 d. Petri dishes were photographed after Giemsa staining (representative photographs are shown), and colony formation efficiency was quantified using ImageJ (mean ± SEM; n = 3; *P < 0.1, **P < 0.01). NT, not treated. (B) Mutp53 drives insulin-induced proliferation in Ras-transformed MEFs. MEFs derived from p53-null (−/−) or p53R172H knock-in (m/m) mice were treated and analyzed as in Fig. 1A (mean ± SEM; n = 3; **P < 0.01). Expression of p53 was checked by Western blot. (C) Expression of INSR in various human cancer cell lines. Expression of INSR A/B was measured by RT-quantitative PCR (RT-qPCR; n = 1) in the indicated cell lines. HL-60 and Malahawu cell lines were analyzed as negative (low INSR expression) and positive (high INSR expression) controls, respectively. Effects of mutant p53 depletion on expression of INSRs. MDA-MB-231 (D) and DU-145 (E) cells were transfected with the indicated siRNAs. Expression of INSR A/B and IGF1R was measured by RT-qPCR (mean ± SEM; n = 3; **P < 0.01). ns, statistically not significant at P > 0.05. Immunoblotting confirmed depletion of endogenous mutant p53. (F) Effects of mutant p53 overexpression on INSR and IGF1R mRNA levels. H1299 p53-null cells were infected with retroviruses expressing the indicated mutp53. Expression levels of INSR A/B and IGF1R were measured by RT-qPCR (mean ± SEM; n = 3; *P < 0.1). Immunoblotting confirmed expression of exogenous mutp53.
Mutant p53 Mediates Insulin-Induced Proliferation and Invasion by Enhancing Activation of AKT.
To define a mechanism of action for mutant p53 in the response to insulin, we first verified expression of the INSR in our cell lines. By RT-PCR, we observed that mutp53 depletion does not affect INSR levels (Fig. S1 C–E). Under certain conditions, insulin can stimulate IGF1R (6), so we also checked IGF1R expression in our cell models; interestingly, mutp53 depletion reduced IGF1R levels in MB231 cells but not in DU145 cells (Fig. S1 D and E). The results in MB231 cells are consistent with previous studies reporting that mutp53 promotes IGF1R transcription (20). However, the results in DU145 cells imply that IGF1R down-regulation is not relevant for the observed phenotypes, a concept further supported by other evidence (Figs. S1F and S2).
Fig. S2.
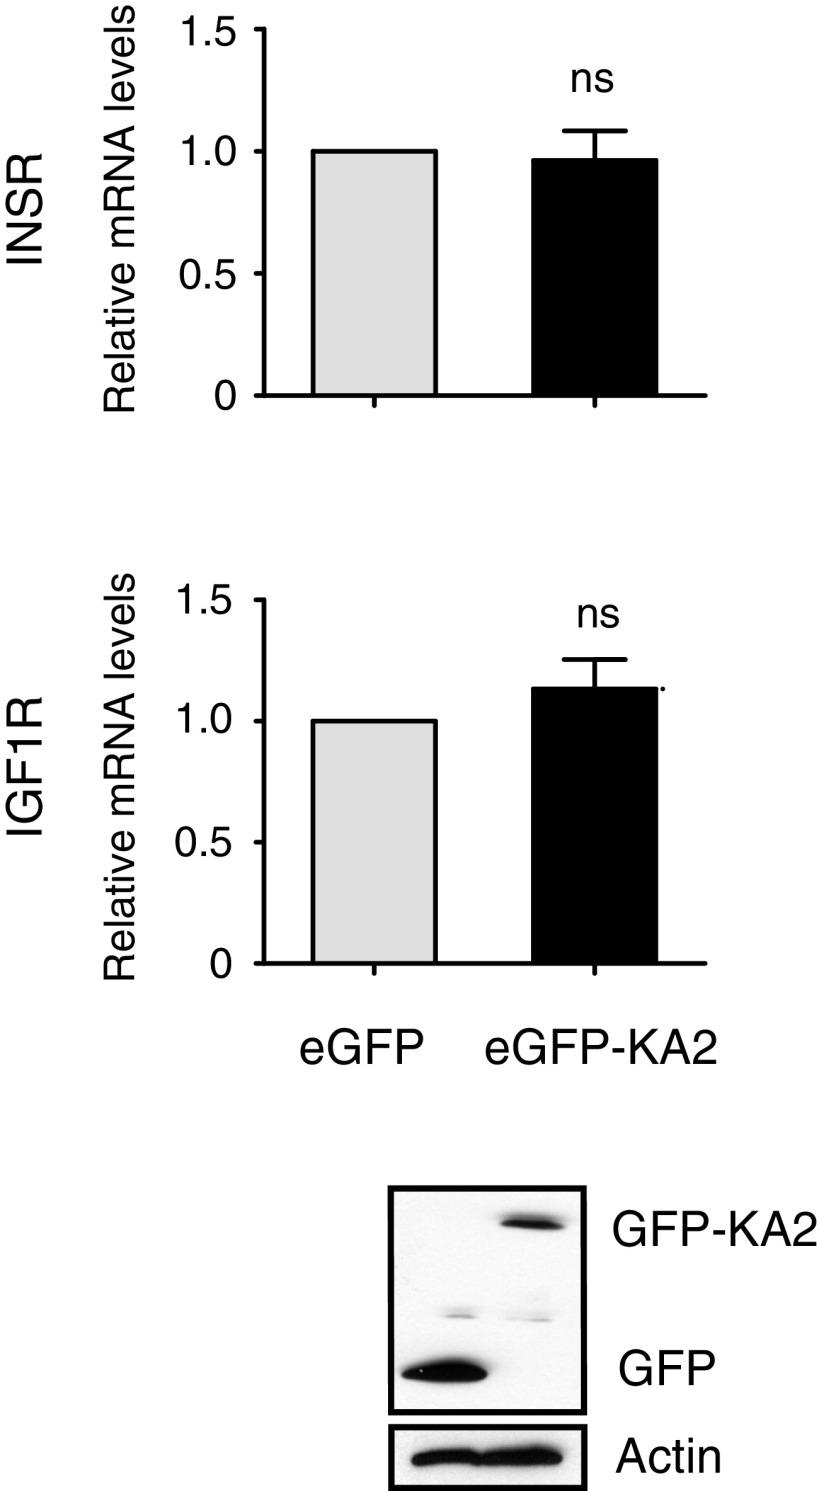
Blocking mutant p53/DAB2IP interaction inhibits the oncogenic response to insulin without affecting the expression of INSRs (related to Fig. 4). MDA-MB231 cells were stably transduced with retroviruses expressing the EGFP-DAB2IP(1–186)KA2 fusion protein (EGFP-KA2) or EGFP alone. Expression of INSR A/B and IGF1R was measured by RT-qPCR (mean ± SEM; n = 3). Expression of EGFPs was analyzed by Western blot. ns, statistically not significant at P > 0.05.
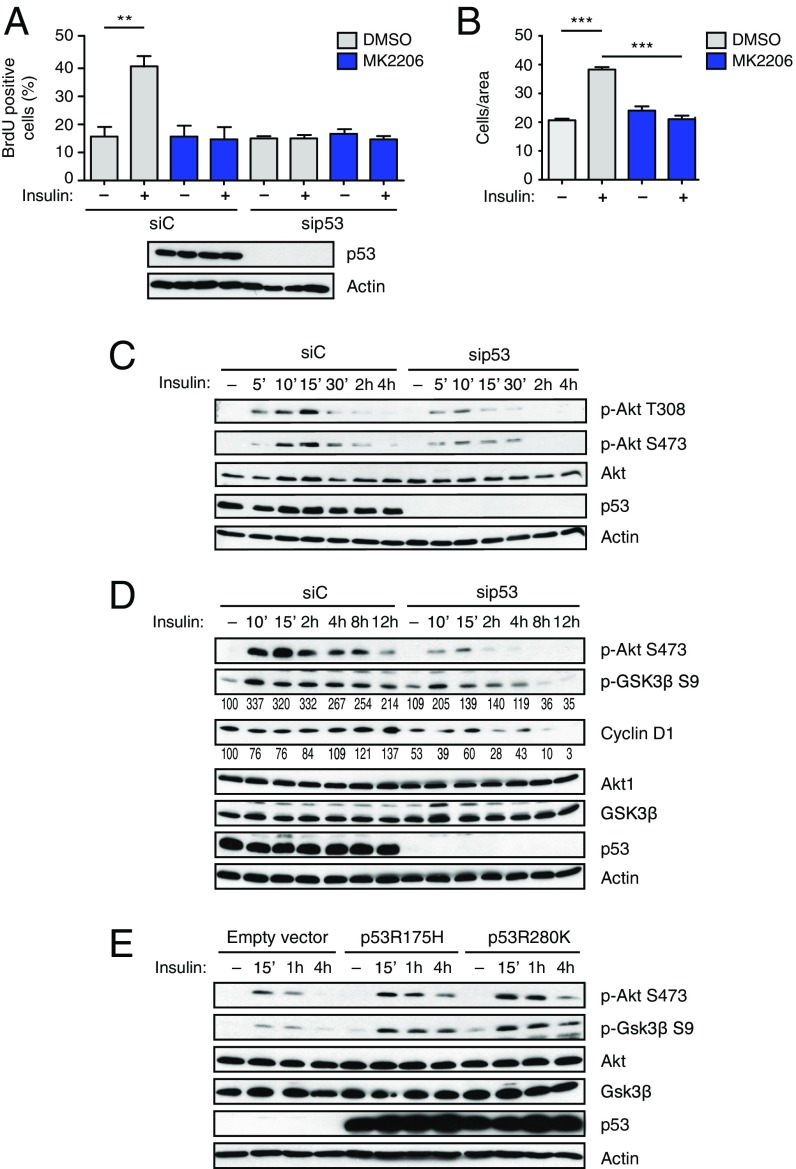
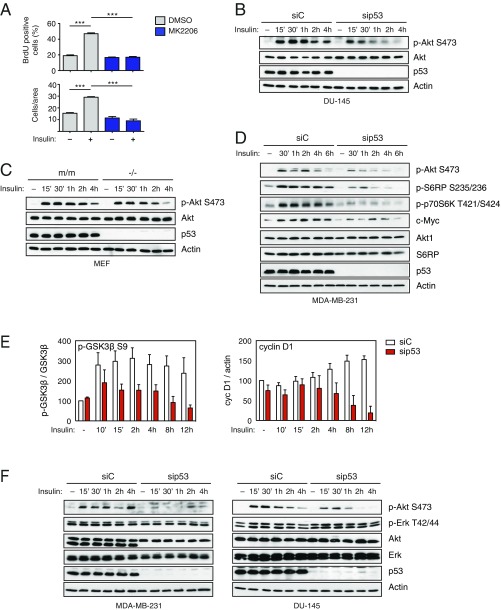
We next focused on insulin-induced activation of the PI3K/AKT pathway. Using the specific AKT inhibitor MK2206, we found that the increase in proliferation and invasion triggered by insulin is strictly dependent on AKT activity (Fig. 2 A and B and Fig. S3A). This result proves that AKT is a key effector in this context, and implies that other pathways potentially activated by INSR (e.g., Ras/MAPK) are not sufficient for the observed phenotype.
Fig. 2.
Mutant p53 increases insulin-induced proliferation and migration through AKT activation. (A and B) Insulin-induced cell proliferation and invasion require AKT activity. (A) MDA-MB231 cells were transfected with the indicated siRNAs for 48 h, serum-starved, and treated with insulin (0.5 μg/mL) for 24 h, with or without the specific AKT inhibitor MK2206 (5 μM). (B) Cells were serum-starved and treated with insulin (0.5 μg/mL) for 24 h, with or without the specific AKT inhibitor MK2206 (5 μM). Proliferation and invasion assays were performed as in Fig. 1 (A and B: mean ± SEM; n = 3; **P < 0.01, ***P < 0.001). (C) Depletion of mutp53 reduces insulin-induced AKT activation in cancer cells. MDA-MB231 cells were transfected with the indicated siRNAs for 48 h, serum-starved for 24 h, and treated with insulin (0.5 μg/mL) for the indicated times. Phosphorylated (p-T308 and p-S473) and total AKT1 were detected by immunoblotting. With actin as a loading control, p53 was blotted to control knockdown efficiency. p-AKT S473 is taken from a different gel, loaded in parallel with the same amount of lysate. (D) Depletion of mutp53 affects prolonged AKT-dependent responses to insulin. MDA-MB231 cells were treated as in C. Phosphorylated and total Akt1, GSK3β, and cyclin D1 were detected by immunoblotting as above. With actin as a loading control, p53 was blotted to control knockdown efficiency. Numbers indicate relative p-GSK3β/GSK3β and cyclin D1/actin ratios, quantified by densitometry on autoradiography film (also Fig. S3E). Total AKT is taken from a different gel, loaded in parallel with the same amount of lysate. (E) Mutant p53 enhances insulin-induced AKT activation. H1299 cells (p53-null) were infected with retroviruses encoding the indicated p53 mutants. Cells were treated with insulin (0.5 μg/mL) for the indicated times. Phosphorylated and total AKT1 and GSK3β were detected by immunoblotting as above. With actin as a loading control, p53 was blotted to verify expression levels.
Fig. S3.
Mutant p53 specifically enhances insulin-induced AKT activation (related to Fig. 2). (A) Insulin-induced cell proliferation and invasion require AKT activity. DU145 cells were serum-starved and treated with insulin (0.5 μg/mL) for 24 h, with or without the specific AKT inhibitor MK2206 (5 μM). Proliferation and invasion assays were performed as in Fig. 1 (mean ± SEM; n = 3; ***P < 0.001). (B) Depletion of mutp53 reduces insulin-induced AKT activation in DU145 cells. Cells were transfected with control or p53 siRNA for 48 h, serum-starved for 24 h, and treated with insulin (0.5 μg/mL) for the indicated times. Phosphorylated AKT1 and total AKT1 were detected by immunoblotting. With actin as a loading control, p53 was blotted to verify knockdown efficiency. (C) Insulin-induced AKT activation is enhanced in mutant p53 knock-in MEFs. Ras-transformed MEFs derived from p53-null (−/−) or p53R172H knock-in (m/m) mice were used to analyze insulin-induced Akt (p-S473) activation. Phosphorylated AKT1 and total AKT1 were detected by immunoblotting. With actin as a loading control, p53 was blotted to verify knockdown efficiency. (D) Depletion of mutp53 affects insulin-induced AKT-dependent molecular responses. MDA-MB-231 cells were treated as in B. Phosphorylated AKT1 and total AKT1, S6RP, p70S6K, and c-Myc were detected by immunoblotting. With actin as a loading marker, p53 was blotted to control knockdown efficiency. (E) Depletion of mutp53 reduces insulin-induced phosphorylation of GSK3β and accumulation of cyclin D1. Graphs summarize relative p-GSK3β S9/GSK3β and CycD1/actin ratios in MDA-MB231 cells treated with insulin for the indicated times (representative blots are shown in Fig. 2D), as measured by densitometry on autoradiography film (average ± SEM, n = 3). (F) Depletion of mutp53 has no detectable effects on MAPK activation in insulin-treated cancer cells. MBA-MD231 and DU145 cells were treated as in B. Phosphorylated AKT1 and total AKT1 and ERK were detected by immunoblotting. With actin as a loading control, p53 was blotted to verify knockdown efficiency.
Previous studies reported evidence of a correlation between mutant p53 and enhanced AKT phosphorylation in breast, endometrial, and colon cancer (12–14). We therefore asked whether mutant p53 might affect AKT activation in the specific context of insulin stimulation. As shown in Fig. 2C, knockdown of mutant p53 clearly reduced insulin-induced AKT phosphorylation in MB231 cells. Identical results were obtained with DU145 (Fig. S3B). Similarly, insulin induced a stronger and prolonged AKT phosphorylation in mutant p53 knock-in vs. p53-null MEFs (Fig. S3C).
In line with the mitogenic and migratory response, insulin-induced AKT activation correlated with phosphorylation of GSK3β and increased cyclin D1 levels. Upon mutp53 depletion, insulin still triggered a moderate and transient AKT phosphorylation, but p-GSK3β and cyclin D1 were significantly lower at longer times (Fig. 2D and Fig. S3E), consistent with reduced cell proliferation and invasion. Insulin-induced phosphorylation or accumulation of additional AKT targets was likewise impaired by mutp53 depletion (Fig. S3D).
Because insulin can also trigger activation of the Ras/MAPK cascade (5, 9), we monitored ERK phosphorylation as a readout of this pathway. We found no significant change in ERK activation upon insulin treatment and/or mutp53 knockdown, thus confirming that mutp53 affects specifically insulin-induced AKT activation in these cells (Fig. S3F).
To verify that mutp53 is sufficient to promote insulin-induced AKT activation, we stably expressed the p53R280K and p53R175H mutants in p53-null H1299 cells. As shown in Fig. 2E, mutp53 knock-in cells displayed stronger and prolonged insulin-induced AKT activation. No relevant changes were detected in INSR or IGF1R mRNA (Fig. S1F), thus excluding an effect on receptor levels. We conclude that mutant p53 establishes a pro-oncogenic response to insulin by specifically favoring or enhancing the activation of AKT.
Mutant p53 Enhances Insulin-Induced AKT Activation by Inhibiting DAB2IP.
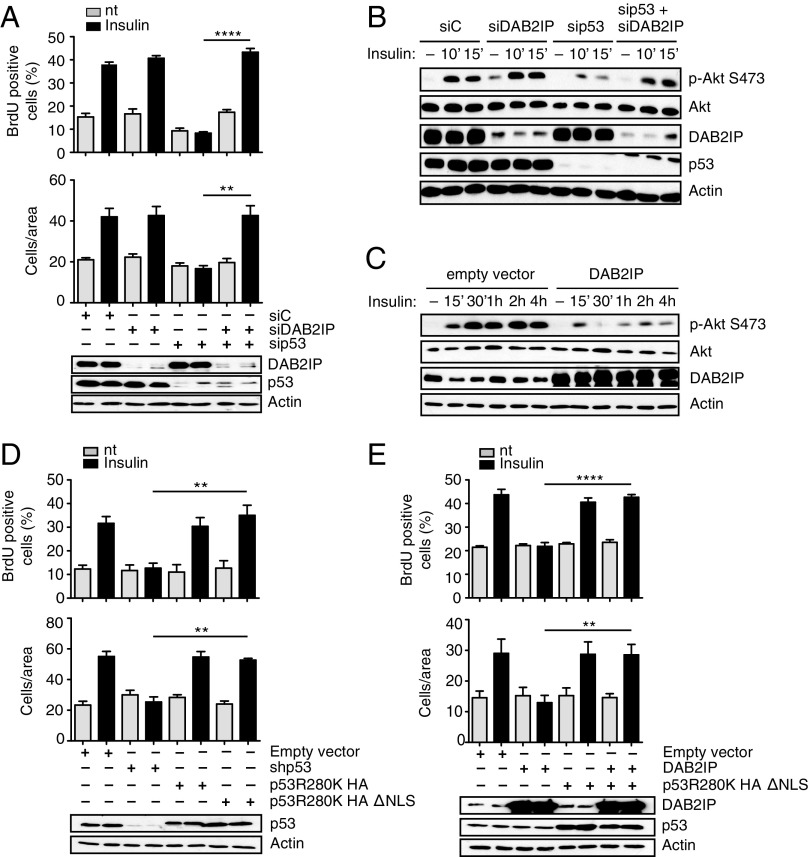
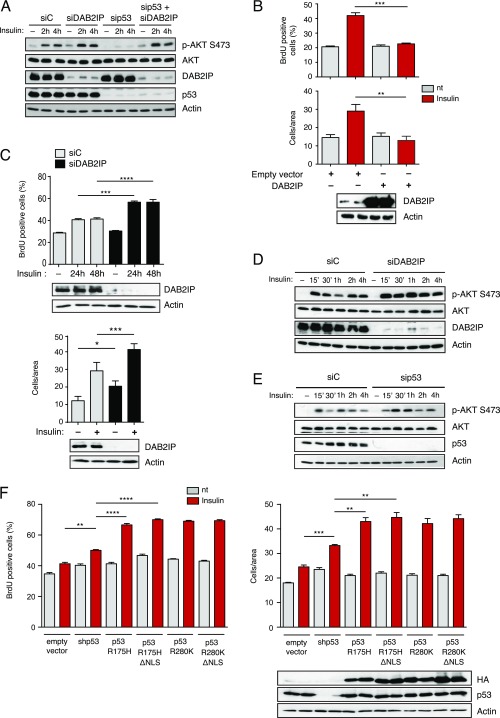
We previously discovered that mutp53 can bind the tumor suppressor DAB2IP in the cytoplasm, interfering with its functions (15). Because DAB2IP can modulate both PI3K and AKT (19), we hypothesized that the mutp53/DAB2IP interaction may also affect the response to insulin. We therefore tested if depletion of DAB2IP could rescue the effects of mutp53 knockdown in our cell models. Indeed, silencing of DAB2IP fully restored insulin-induced proliferation and invasion in mutp53-depleted MB231 cells (Fig. 3A). Similarly, depletion of DAB2IP restored the kinetics of insulin-induced AKT phosphorylation after mutp53 knockdown (Fig. 3B and Fig. S4A). Notably, knockdown of DAB2IP had a negligible impact on insulin-induced phenotypes in the presence of mutp53, thus confirming the epistatic relationship between the two proteins. In the same experimental settings, DAB2IP overexpression reduced insulin-dependent AKT phosphorylation (Fig. 3C) and fully abolished the increase in proliferation and invasion triggered by insulin (Fig. S4B).
Fig. 3.
Functional interaction between mutant p53 and DAB2IP in the response of cancer cells to insulin. (A) Epistasis between mutp53 and DAB2IP in insulin-induced proliferation and invasion. MDA-MB231 cells were silenced for mutp53 and/or DAB2IP for 48 h and treated with 0.5 μg/mL insulin for 24 h. Proliferation (Top) and invasion (Bottom) assays were performed as in Fig. 1 (mean ± SEM; n = 3; **P < 0.01, ****P < 0.0001). nt, not treated. (B and C) Epistasis between mutant p53 and DAB2IP in insulin-induced AKT activation. (B) MDA-MB231 cells were silenced for mutp53 and/or DAB2IP for 48 h, serum-starved for 24 h, and treated with insulin (0.5 μg/mL) for the indicated times. Phosphorylated AKT1 and total AKT1 were detected by immunoblotting. (C) MDA-MB231 cells stably transduced with a retrovirus expressing DAB2IP were serum-starved and treated with insulin (0.5 μg/mL) for the indicated times. Phosphorylated AKT1 and total AKT1 were detected by immunoblotting. Total AKT is taken from a different gel, loaded in parallel with the same amount of lysate. (D and E) Insulin-induced proliferation and invasion are mediated by cytoplasmic mutant p53. (D) MDA-MB231 cells stably silenced for endogenous mutant p53 [short hairpin p53 (shp53)] were infected with retroviruses encoding shRNA-resistant versions of p53 (R280K) or its cytoplasmic variant p53 (R280K)ΔNLS. Proliferation (Top) and invasion (Bottom) assays were performed as in Fig. 1 (mean ± SEM; n = 3; **P < 0.01). (E) MDA-MB231 cells stably overexpressing DAB2IP were infected with a retrovirus expressing HA-p53 (R280K)ΔNLS or an empty retrovirus as a control. Proliferation (Top) and invasion (Bottom) assays were performed as in Fig. 1 (mean ± SEM; n = 3; **P < 0.01, ****P < 0.0001).
Fig. S4.
Functional interactions between mutp53 and DAB2IP in the response to insulin of breast cancer cells with mutant or wt p53 (related to Fig. 3). (A) Epistasis between mutant p53 and DAB2IP in insulin-induced AKT activation. MDA-MB-231 cells were silenced for mutp53 and/or DAB2IP for 48 h, serum-starved for 24 h, and treated with insulin (0.5 μg/mL) for the indicated times. Phosphorylated AKT1 and total AKT1 were detected by immunoblotting. (B) DAB2IP overexpression reduces insulin-dependent proliferation and invasion in mutant p53 cancer cells. MDA-MB-231 cells stably transduced with a DAB2IP retrovirus were serum-starved and treated with insulin (0.5 μg/mL) for 24 h. Proliferation (Top) and invasion (Bottom) assays were performed as in Fig. 1 (mean ± SEM; n = 3; **P < 0.01, ***P < 0.001). Expression of endogenous and exogenous DAB2IP was checked by Western blot. nt, not treated. (C) DAB2IP knockdown enhances insulin-induced proliferation and migration in wt p53 cancer cells. HBL-100 cells were transfected with the indicated siRNAs for 48 h. Proliferation (Top) and invasion (Bottom) assays were performed as in Fig. 1 (mean ± SEM; n = 3; *P < 0.1, ***P < 0.001, ****P < 0.0001). Efficiency of endogenous DAB2IP depletion was checked by Western blot. (D) DAB2IP knockdown enhances insulin-induced AKT activation in wt p53 cancer cells. HBL-100 cells were transfected with control or DAB2IP siRNA for 48 h, serum-starved for 24 h, and treated with insulin (0.5 μg/mL) for the indicated times. Phosphorylated (p-S473) AKT1 and total AKT1 were detected by immunoblotting. DAB2IP was blotted to verify knockdown efficiency, with actin as a loading control. (E) Depletion of wt p53 enhances insulin-induced AKT activation in HBL-100 cells. Cells were transfected with control or p53 siRNA for 48 h, serum-starved for 24 h, and treated with insulin (0.5 μg/mL) for the indicated times. Phosphorylated (p-S473) AKT1 and total AKT1 were detected by immunoblotting. With actin as a loading control, p53 was blotted to verify knockdown efficiency. (F) Mutant p53 dominantly enhances insulin-induced proliferation and migration in wt p53 cancer cells via a nuclear-independent activity. HBL-100 cells were infected with retroviruses encoding p53 (R175H) and p53 (R280K), and their respective cytoplasmic variants (ΔNLS). Cells were also infected with a retrovirus expressing a p53-specific shRNA. Proliferation (Top) and invasion (Bottom) assays were performed as in Fig. 1 (mean± SEM; n = 3; **P < 0.01, ***P < 0.001, ****P < 0.0001). Expression of endogenous and exogenous p53 proteins was verified by immunoblotting, with actin as a loading control.
If the effects of mutp53 are exerted by binding and inhibiting DAB2IP, they should be independent of its nuclear functions. Accordingly, overexpression of a cytoplasmic variant of mutant p53 (p53R280K ΔNLS) (15) fully restored insulin-induced proliferation and invasion in MB231 cells previously depleted of endogenous nuclear mutp53 (Fig. 3D) or stably overexpressing DAB2IP (Fig. 3E).
The functional impact of the mutp53/DAB2IP axis was also confirmed in HBL-100, a triple-negative breast cancer cell line with wild-type (wt) p53. In these cells, DAB2IP knockdown significantly increased insulin-induced proliferation and invasion, correlating with enhanced AKT activation (Fig. S4 C and D), confirming its modulatory role on this pathway.
Intriguingly, depletion of wt p53 augmented insulin-induced AKT phosphorylation, as well as proliferation and invasion in HBL-100 cells (Fig. S4 E and F), suggesting that p53 loss can promote this signaling axis. Nonetheless, expression of mutp53 (p53R175H or p53R280K) had a much stronger effect than wt p53 depletion (Fig. S4F), formally confirming a mutp53 gain of function. Most importantly, the same was observed with nuclear-excluded p53 mutants. We thus conclude that mutant p53 can amplify oncogenic responses to insulin by inhibiting DAB2IP.
Disruption of the Mutp53/DAB2IP Interaction Reduces the Aggressive Behavior of Cancer Cells Exposed to Insulin.
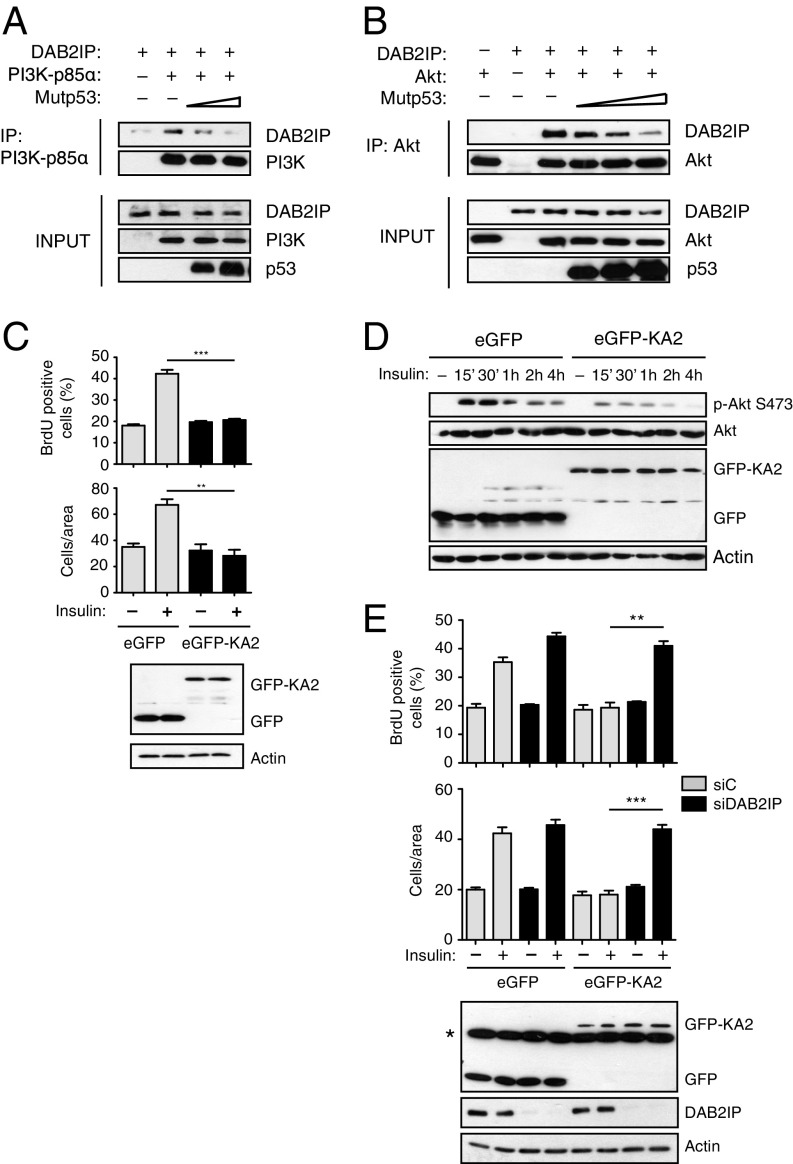
DAB2IP can bind both PI3K-p85α and AKT1 to regulate AKT activation in a negative manner (19); we therefore hypothesized that mutant p53 might interfere with such interactions. In transient overexpression experiments, increasing amounts of mutant p53 caused a progressive reduction in the fraction of DAB2IP that could be coimmunoprecipitated with PI3K or AKT1 (Fig. 4 A and B), thus suggesting a possible mechanism by which high levels of mutant p53 could promote insulin-induced AKT activation.
Fig. 4.
Blocking mutant p53/DAB2IP interaction inhibits the oncogenic response to insulin. (A and B) Mutant p53 hinders the interaction of DAB2IP with PI3K-p85α and AKT. (A) H1299 cells were cotransfected with plasmids expressing DAB2IP, FLAG-PI3K-p85α, and increasing amounts of p53 (R280K). The fraction of DAB2IP bound to PI3K was analyzed by Western blot of PI3K immunoprecipitates. IP, immunoprecipitation. (B) H1299 cells were cotransfected with plasmids expressing DAB2IP, HA-AKT1, and increasing amounts of p53 (R280K). The fraction of DAB2IP bound to AKT1 was analyzed by Western blot of AKT immunoprecipitates. (C–E) Expression of a decoy protein that displaces the mutp53/DAB2IP interaction abolishes insulin-induced proliferation and invasion. (C) MDA-MB231 cells were stably transduced with retroviruses expressing the EGFP-DAB2IP(1–186)KA2 fusion protein (EGFP-KA2) or EGFP alone. Proliferation assays (Top) and invasion assays (Bottom) were performed as in Fig. 1 (mean ± SEM; n = 3; **P < 0.01, ***P < 0.001). Expression of EGFPs was analyzed by Western blot. (D) MDA-MB231 cells stably transduced as in C were treated with insulin (0.5 μg/mL) for the indicated times. Phosphorylated and total AKT1 and GSK3β were detected by immunoblotting. Expression of EGFPs and endogenous DAB2IP was verified by Western blot. (E) MDA-MB231 cells stably transduced as in C were transfected with the indicated siRNAs. Proliferation assays (Top) and invasion assays (Bottom) were performed as in Fig. 1 (mean ± SEM; n = 3; **P < 0.01, ***P < 0.001). Expression of EGFPs and endogenous DAB2IP was verified by Western blot. The asterisk in E, Bottom indicates a nonspecific reactive band.
Mutp53 binds to the N terminus of DAB2IP, and we previously demonstrated that a chimeric decoy protein in which the first 186 amino acids of DAB2IP are fused to GFP (EGFP-KA2) can disrupt the mutp53/DAB2IP interaction, restoring endogenous DAB2IP functions in cancer cells (15). We therefore repeated the experiments using MB231 cells stably expressing the EGFP-KA2 protein. The EGFP-KA2 decoy had no obvious effects on basal cell proliferation and motility but clearly abolished the increase in proliferation and invasion triggered by insulin, also significantly reducing AKT activation (Fig. 4 C and D). Expression of EGFP-KA2 did not influence INSR or IGF1R transcription (Fig. S2), so its effect is not linked to reduced receptor levels. Importantly, depletion of DAB2IP rendered the EGFP-KA2 construct ineffective, demonstrating that the inhibitory action of the KA2 peptide is strictly dependent on DAB2IP action (Fig. 4E).
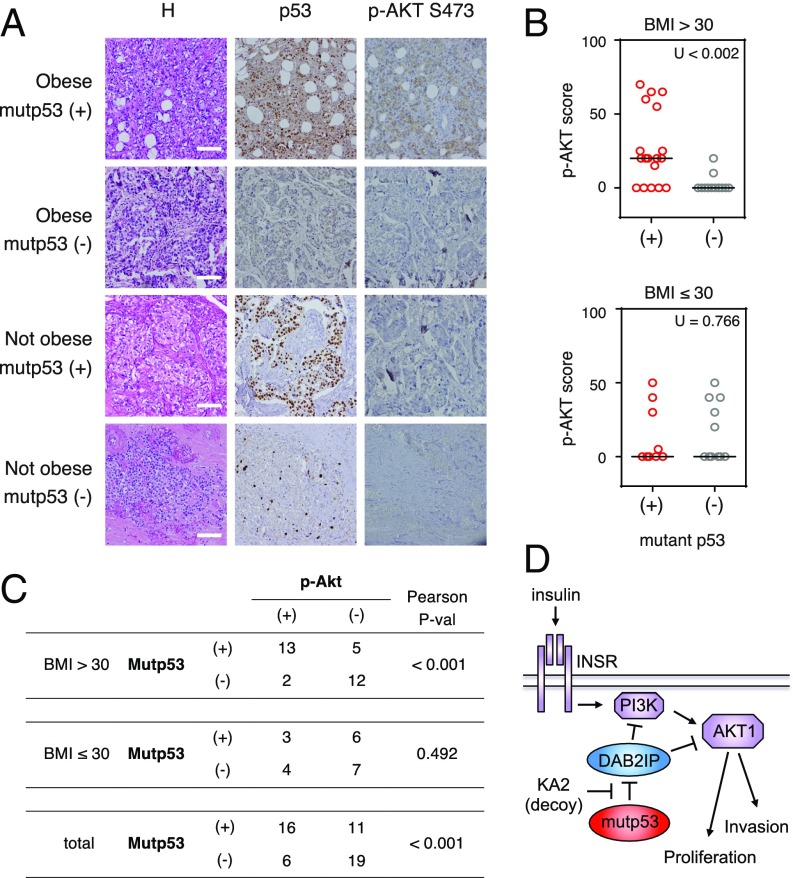
Together, these data provide a mechanism by which mutp53, blocking DAB2IP, can enhance insulin-induced AKT activation in cancer cells, potentially determining a more aggressive behavior under hyperinsulinemic conditions (Fig. 5D).
Fig. 5.
AKT activation correlates with p53 mutation in triple-negative breast cancers of obese patients. (A) Immunostaining with antibodies against p53 and p-AKT S473 of representative triple-negative breast cancer sections derived from obese and nonobese patients. H, hematoxylin staining. (Scale bars: 100 μm.) (B) Graphs summarize p-AKT S473 staining in tumor samples from 32 obese patients [body mass index (BMI) > 30] and 20 nonobese patients, sorted according to p53 status. The horizontal bar indicates the median. Correlations were analyzed by a nonparametric Mann–Whitney U test. (C) Table summarizes the same tumor samples as in B, grouped according to p53 status and p-AKT S473 staining. Tumors with p53 staining >80% have been classified as mutant p53. Tumors with p-AKT staining >15% have been classified as “positive.” Correlations were analyzed by a parametric Pearson’s chi-square test (P-val). (D) Proposed model for the gain of function of mutant p53 in the response to insulin as mediated by its cytoplasmic interaction with DAB2IP.
Increased AKT Activation Correlates with p53 Mutation in Breast Cancers from Obese Patients.
The above results predict that hormone-independent tumors with mutant p53 should have stronger or prolonged AKT activation under conditions of hyperinsulinemia. To investigate such a potential association, we analyzed triple-negative breast cancers from obese and nonobese patients, assuming an obesity-linked hyperinsulinemia in clinically overweight (body mass index > 30) subjects (21). The presence of potential p53 gain-of-function mutations was inferred by strong p53 staining in immunohistochemistry, whereas AKT activation was determined by immunoreactivity to a phospho-AKT (S473) antibody. In line with previous reports (13, 14), we confirmed a general correlation between phospho-AKT and mutant p53. In addition, we found a strong correlation between elevated p53 staining (i.e., p53 mutation) and high levels of phospho-AKT specifically in obese patients (Fig. 5 A–C). These observations are consistent with our model, and support the notion that p53 mutation may amplify AKT activation in cancers that develop under obesity-linked conditions.
Discussion
Host circulating hormones can have a dramatic impact on cancer growth and dissemination, acting directly on transformed cells, as well as indirectly affecting the tumor microenvironment and the immune system. We found that p53 mutation can significantly increase proliferation and invasion of cancer cells exposed to insulin. This finding was observed with different missense mutations, and could be recapitulated using a nuclear-excluded mutant p53. Therefore, this phenotype defines a cytoplasmic gain of function for mutant p53, reinforcing the notion that part of the oncogenic potential of mutp53 is exerted by distorting the cell’s response to extracellular inputs.
We found that cancer cells with high levels of mutant p53 have a stronger PI3K/AKT response to insulin because DAB2IP functions are limited by aberrant interaction with mutp53. This discovery provides a molecular mechanism for previously reported correlations between p53 mutation and AKT hyperactivation in cancer (13, 14). Intriguingly, it also suggests a mechanism by which TP53 mutation could act as a surrogate for PI3K mutation, at least under some conditions. This speculation would be in line with evidence that PI3K and TP53 alterations tend to be mutually exclusive in various carcinomas, including breast cancer (22–24).
Because DAB2IP acts directly on PI3K and AKT, it is plausible that the mutp53/DAB2IP interaction would also stimulate AKT activation by other extracellular signals. Similarly, our results imply that any condition of DAB2IP loss of function could potentially favor a pro-oncogenic response to insulin, regardless of p53 mutation. Both of these hypotheses deserve further scrutiny.
We previously reported that DAB2IP can also bind wt p53, at least in vitro or in overexpression (25). We could not detect interaction of the endogenous proteins in multiple cell lines (15), but we cannot exclude wt p53 binding to DAB2IP under specific conditions that strongly increase cytoplasmic p53 levels. Additional studies will be required to test this possibility and its potential implications for the PI3K/AKT axis.
From a molecular point of view, our data raise interesting questions regarding the biochemical nature of the inhibitory action of DAB2IP on the PI3K/AKT axis, which is likely based on physical interaction but still needs to be defined. Another interesting question concerns the possible modulation of DAB2IP by AKT. In fact, AKT1 can phosphorylate DAB2IP in the C-terminal proline-rich (PR) domain, and this phosphorylation reduces DAB2IP interaction with Ras and TRAF2, thus limiting its functions (26). Notably, the PR domain is also the site of interaction with p85, so phosphorylation by AKT may also reduce the inhibitory action of DAB2IP on PI3K, further increasing AKT activation. Although not formally proved, it is plausible that a reciprocal regulatory circuit between DAB2IP and AKT indeed exists.
Finally, we must consider that humans have three related AKT genes, with similar mechanisms of activation and partially overlapping but distinct biological effects (27); we focused on AKT1, but it will be interesting to test whether the mutp53/DAB2IP interaction can also affect other AKT proteins.
From a clinical point of view, our results suggest that mutation of p53 could potentially affect the outcome of tumors that arise, or progress, under conditions of hyperinsulinemia. In agreement with tissue culture observations, we found a strong correlation between p53 mutation and AKT phosphorylation specifically and selectively in breast tumors from obese patients. Assuming a hyperinsulinemic context related to obesity, p53 mutation would increase proliferation and dissemination of such tumors by promoting insulin-induced AKT activation.
Interestingly, it has been observed that estrogen-receptor–positive breast cancer cells that develop resistance to tamoxifen become more sensitive to INSR depletion or pharmacological inhibition (28), revealing the importance of insulin signaling as a surrogate of the mitogenic activity of estrogen. Indeed, tumors deprived of hormones or other growth factors can potentially benefit from the oncogenic action of insulin. Considering that mutp53 also impacts the response of cancer cells to inflammatory cytokines (15, 29), it is plausible that p53 mutation might significantly increase growth and dissemination of endocrine-resistant metastatic cancer cells in patients with clinical, metabolic, or dietary conditions leading to hyperinsulinemia.
In conclusion, our data suggest a unique perspective for clinical management of patients with hyperinsulinemia, and provide yet another indication that, for those tumors where p53 is mutated, pharmacological efforts aimed to tackle the gain of function of p53 bear strong therapeutic potential.
Materials and Methods
Cell Lines, Plasmids, and Drug Treatments.
The following cell lines were used: breast cancer MDA-MB-231 (p53R280K) and HBL-100 (wt p53), prostate cancer DU-145 (p53V274F/P223L), and Ras-immortalized MEFs derived from p53 knockout and p53R172H knock-in mice. Expression plasmids and retroviral constructs encoding DAB2IP, mutant p53 variants, and the EGFP-KA2 decoy construct have all been described previously (15). The pcDNA3-flag-HA-Akt1 (plasmid no. 9021) and pCMV6-p85α-Flag (plasmid no. 1399) were purchased from Addgene. For insulin treatment, cells were serum-starved for 24 h before addition of 0.5 μg/mL human recombinant insulin (I2643; Sigma). The AKT inhibitor MK2206 (Santa Cruz Biotechnology) was used at 5 μM.
BrdU Incorporation Assay.
Cells were serum-starved for 24 h and treated with insulin for an additional 24 h. Proliferating cells were labeled by adding 20 BrdU for 2 h. BrdU was detected by immunofluorescence using a specific monoclonal antibody (GE Healthcare). Nuclei were stained with Hoechst stain. Proliferating cells were scored by counting BrdU-positive over total cell nuclei in 25 random microscope fields (at least 100 cells were counted in each sample).
Cell Proliferation Assay.
Cells were seeded in a 96-well plate, grown in serum-free medium for 24 h, and treated with insulin for an additional 24 h and 48 h. Subsequently, cells were fixed in 4% paraformaldehyde (PFA) and stained with 0.05% crystal violet dye. The optical density of each well was measured at 570 nm (OD570) with an Enspire multimode plate reader (PerkinElmer).
Matrigel Invasion Assays.
Cells were grown in serum-free medium for 24 h and treated with insulin for an additional 24 h. Subsequently, cells were trypsinized, counted, and plated in 24-well PET inserts (8-μm pore size; Falcon) coated with BD Matrigel (BD Bioscience). The lower chamber was filled with high serum medium (10% FBS) without insulin. After 16 h, cells passed through the filter were fixed in 4% PFA, stained with 0.05% crystal violet dye, and counted. Invasion was scored by counting cells in 22 random, nonoverlapping microscopic fields at a magnification of 400×.
Immunohistochemistry.
Immunohistochemical staining was performed on 4-μm formalin-fixed paraffin-embedded slides using antibodies against p53 (DO-7; Dako) and p-AKTS473 (sc-4060; Cell Signaling). Sections were counterstained with H&E. Stained tissue sections were evaluated by two certified pathologists. Samples were scored as “mutant p53” when positive nuclear and cytoplasmic p53 staining was detectable in >80% of tumor cells. Samples were scored as “phospho-AKT–positive” when distinct cytoplasmic staining was detected in >15% of tumor cells. For nonparametric analysis, the actual percentage of cells with distinct cytoplasmic phospho-AKT staining was used. The study was approved by the ethics committee of the National Cancer Institute Fondazione G. Pascale. Written informed consent was obtained from the patients for use of biological material and publication of images.
Statistical Analysis.
In all graphs, data are expressed as the mean ± SEM of at least three independent experiments, except when otherwise indicated. Differences were analyzed by the Student’s t test using Prism 5 (GraphPad). P < 0.05 was considered significant. Immunohistochemical data were analyzed using SPSS 17.0 software (IBM); both the Mann–Whitney nonparametric test and Pearson’s chi-square parametric test were used to evaluate correlations between p53 mutation and phospho-AKT (S473) expression.
SI Materials and Methods
Cell Culture, Transfections, Retroviral Transductions, and Treatments.
MDA-MB231 (p53R280K) cells, HBL-100 (wt p53) cells, and MEFs were cultured in DMEM (Sigma) supplemented with 10% FBS (ECS0180L; Euroclone) and antibiotics (DE17-602E; Lonza). DU145 (p53V274F/P223L) and H1299 (p53-null) cells were cultured in RPMI medium (Sigma) supplemented with 10% FBS and antibiotics. All cell lines were subjected to short tandem repeat genotyping with a PowerPlex 18D System and confirmed in their identity, comparing the results with reference cell databases (Deutsche Sammlung von Mikroorganismen und Zellkulturen, American Type Culture Collection, and Japanese Collection of Research Bioresources databases) where possible. MEFs were collected from embryos 13.5 d postcoitum of p53 knockout and p53R172H knock-in mice, and immortalized by retroviral transduction of H-RasV12 (30). HEK293T or 293GP cells were transfected using calcium phosphate. Transfections of H1299 cells were performed with Lipofectamine 2000 (Invitrogen), following the manufacturer’s instructions. For siRNA experiments, cells were transfected with 50 nM siRNA oligonucleotides using Lipofectamine RNAiMax (Invitrogen), following the manufacturer’s instructions. Cells were processed after 48 h of silencing unless specified differently.
For retrovirus production, low-confluency HEK293GP packaging cells were transfected by calcium phosphate precipitation. After 48–72 h, the virus-containing medium was filtered and added to target cells. Cells were selected with blasticidin (2 μg/mL) and/or puromycin (0.5 μg/mL) and kept under selection for the entire experiment.
The sequences of siRNAs used were as follows:
| siRNA | Sequence | Purchased from |
| Control siRNA | Unknown | All star negative control (1027281; Qiagen) |
| sip53 ORF | GACUCCAGUGGUAAUCUAC | Eurofins Genomics |
| siDAB2IP A | GGAGCGCAACAGUUACCUG | Eurofins Genomics |
| siDAB2IP B | GGUGAAGGACUUCCUGACA | Eurofins Genomics |
| siDAB2IP 3′UTR | GUAAUGUAACUAUCUCACC | Eurofins Genomics |
BrdU Incorporation Assay.
For the BrdU incorporation assay, cells were serum-starved for 24 h and then treated with insulin (0.5 μg/mL) for 24 h. Proliferating cells were labeled with 20 μM BrdU in vitro for 2 h. Cells were fixed in 4% PFA at room temperature, permeabilized in PBS plus 0.1% Triton X-100, and washed with NaOH (50 mM). Permeabilized cells were incubated with specific monoclonal antibody, followed by Alexa Fluor 568-conjugated secondary antibodies (Life Technologies). The total number of BrdU-labeled cells was counted directly under a Leica DM4000B epifluorescence microscope.
Matrigel Invasion Assays.
For matrigel invasion assays, cells (0.5–1 × 10⁵) were plated on 24-well PET inserts (8.0-μm pore size; Falcon) coated with BD Matrigel (BD Bioscience). After 16 h, cells that passed through the filter were fixed in 4% PFA, stained with 0.05% crystal violet dye, and counted.
Crystal Violet Dye Cell Proliferation Assay.
Cells were seeded in 96-well plates at a density of 5,000 cells per well. Cells were grown in serum-free medium for 24 h and treated with insulin (0.5 μg/mL) for an additional 24 h and 48 h. Subsequently, cells were fixed in 4% PFA and stained with 0.05% crystal violet dye. Wells filled with only medium provided the background absorbance of the dye. The OD570 of each well was measured with an Enspire (PerkinElmer) multimode plate reader.
Colony Formation Assay.
Cells were seeded at a density of 5,000 (MDA-MB-231) or 3,000 (DU-145) cells per 6-cm-diameter plate, and incubated for 24 h in 10% FBS-supplemented DMEM culture medium. Cells were then treated with insulin (0.5 μg/mL) every 48 h. After 10 d, cells were fixed in 4% PFA and stained with Giemsa stain (Sigma) for 2 h. Plates were photographed, and colonies of ≥50 pixels were counted using ImageJ software (NIH) after background subtraction (31).
RNA Expression Analysis.
Total RNA was extracted with QIAzol (Qiagen). For RT-quantitative PCR, 1 μg of total RNA was reverse-transcribed with a QuantiTect Reverse Transcription Kit (Qiagen). Real-time PCR was performed using SsoAdvanced SYBR Green Supermix (Bio-Rad) on a CFX96 Real-Time PCR System (Bio-Rad). Primer sequences were as follows:
| Primer name | Sequence |
| INSR A/B | |
| Forward | 5′-CAG CGA GAA ACT GCA TGG T-3′ |
| Reverse | 5′-CAT TGG ACA TGG TAG AGT CG-3′ |
| IGF1R | |
| Forward | 5′-TCT GGC CGA CGA GTG GAG-3′ |
| Reverse | 5′-CTC GGT AAT GAC CGT GAG CTT-3′ |
| Histone H3 | |
| Forward | 5′-GAA GAA ACC TCA TCG TTA CAG GCC TGG T-3′ |
| Reverse | 5′-CTG CAA AGC ACC AAT AGC TGC ACT CTG GAA-3′ |
Protein Expression Analysis.
Total cell extracts were prepared in radioimmunoprecipitation assay buffer without SDS [150 mM NaCl, 50 mM Tris⋅HCl (pH 8), 1 mM EDTA, 1% Nonidet P-40, 0.5% Na-deoxycholate] supplemented with 1 mM PMSF, 5 mM NaF, 1 mM Na3VO4, and protease inhibitors (Sigma). Protein concentration was determined with Bio-Rad Protein Assay Reagent (no. 500-0006; Bio-Rad). Lysates were resolved by SDS/PAGE and transferred to nitrocellulose (Millipore).
Western blot analysis was performed according to standard procedures. When blots were probed with multiple antibodies, proteins either had markedly different electrophoretic migration or were detected with primary antibodies raised in different species. In the latter case, signals from previous secondary antibodies were extinguished by sodium-azide treatment. When proteins could not be detected on the same blot, a second gel was run in parallel with exactly the same amount of lysate.
Primary antibodies used were as follows:
| Target | Antibody |
| P53 (DO1) | sc-126 (Santa Cruz Biotechnology) |
| P53 (DO-7) | DO-7 (DAKO) |
| Actin | No. A9718 (Sigma) |
| AKT1 | No. 2967 (Cell Signaling) |
| p-AKTS473 | No. 9271 (Cell Signaling) |
| p-AKT S473 | No. 4060 (Cell Signaling) |
| p-AKT T308 | No. 9275 (Cell Signaling) |
| p-GSK3β S9 | No. 9323 (Cell Signaling) |
| GSK3β | No. 9832 (Cell Signaling) |
| Cyclin D1 | No. 2926 (Cell Signaling) |
| c-Myc (9E10) | Sc-40 (Santa Cruz Biotechnology) |
| p-p70 S6 kinase T421/S424 | No. 9204 (Cell Signaling) |
| p-S6RP S235/236 | No. 2211 (Cell Signaling) |
| S6RP | No. 2217 (Cell Signaling) |
| HA (Y11) | Sc-805 (Santa Cruz Biotechnology) |
| FLAG M2 | F3165 (Sigma) |
| GFP | Self-produced rabbit polyclonal |
| DAB2IP | A302-440A (Bethyl) |
| p-P44/42 MAPK (ERK1/2) T202/Y204 | No. 9101 (Cell Signaling) |
| P44/2 MAPK (Erk1/2) | No. 9107 (Cell Signaling) |
Protein Interaction Studies.
For coimmunoprecipitation, expression plasmids were transfected in human H1299 cells. Twenty-four hours after transfection, cells were lysed in coimmunoprecipitation buffer [120 mM NaCl, 20 mM Tris⋅HCl (pH 7.5), 1 mM EDTA, 0.5% Nonidet P-40] with protease inhibitors. Samples were cleared by centrifugation for 30 min at 13,000 × g at 4 °C and incubated overnight at 4 °C with specific antibody. After 1 h of incubation with protein G-Sepharose (GE Healthcare), immunoprecipitates were washed three times in coimmunoprecipitation buffer, resuspended in sample buffer, and analyzed by immunoblotting. Mouse IgG was used as a negative control.
Immunohistochemical Analysis.
A cohort of 52 cases of triple-negative breast cancer, including 32 from obese patients [body mass index (BMI) > 30] and 20 from nonobese patients (BMI < 30), was collected from the Department of Pathology of the National Cancer Institute “Fondazione G. Pascale,” Naples. All cases were reviewed according to WHO classification criteria, using standard tissue sections and immunohistochemical analysis. Informed consent for the scientific use of biological material was obtained from all patients. ER status, progesterone receptor status, and HER2 status had been routinely recorded at the hospital. Immunohistochemical staining on formalin-fixed, paraffin-embedded tumor tissue was performed on slides (4 μm) to evaluate expression of p53 (DO-7; DAKO) and p-AKTS473 (sc-4060; Cell Signaling). The endogenous peroxidase activity was blocked by incubating the sections with about 150 μL of Novocastra Peroxidase Block (RE7101; 3% H2O2) for 10 min at room temperature, followed by two washes (5 min each) in Tris-buffered saline (TBS)/Tween buffer. The formation of nonspecific binding between the antibodies and endogenous proteins was reduced by incubating the sections with about 150 μL of Novocastra Protein Block (10% FBS) for 20 min at room temperature, followed by two washes (5 min each) in TBS/Tween buffer. After protein block, slides were incubated with about 150 μL of primary antibodies for overnight at 4 °C, followed by two washes in TBS/Tween buffer (5 min each), secondary antibody (Novocastra Streptavidin- HRP; Leica Microsystems) for 40 min at room temperature, and two more two washes in TBS/Tween (5 min each); they were then visualized using 3,3′-diaminobenzidine. The following negative controls were performed: (i) omission of the primary antibody and (ii) substitution of the primary antiserum with nonimmune serum diluted 1:150 in blocking buffer; no immunostaining was observed in either case. Sections were counterstained with hematoxylin and mounted. Stained tissue sections were evaluated independently by two clinical pathologists using uniform criteria. Discrepancies were resolved through simultaneous inspection and discussion of the results.
Samples were scored as “mutant p53” when positive nuclear and cytoplasmic p53 staining was detectable in >80% of tumor cells (32). Samples were scored as “p-AKT–positive” when distinct cytoplasmic staining was detected in >15% of tumor cells (33).
Acknowledgments
We thank G. Pastore for assistance with tissue culture. We thank Y. Ciani for help with bioinformatics and G. Sorrentino for critical reading of the manuscript. This work was supported by Italian Association for Cancer Research (AIRC) Grant IG 14173 (to L.C.) and Università di Trieste Grant FRA 2015 (to L.C.), and by AIRC Molecular Clinical Oncology Special Program “5 per mille” Grant 10016 (to G.D.S.). A.B. was supported by a postdoctoral fellowship from the Fondazione Italiana Ricerca sul Cancro.
Footnotes
The authors declare no conflict of interest.
This article is a PNAS Direct Submission.
This article contains supporting information online at www.pnas.org/lookup/suppl/doi:10.1073/pnas.1700996114/-/DCSupplemental.
References
- 1.Wolin KY, Carson K, Colditz GA. Obesity and cancer. Oncologist. 2010;15:556–565. doi: 10.1634/theoncologist.2009-0285. [DOI] [PMC free article] [PubMed] [Google Scholar]
- 2.Pisani P. Hyper-insulinaemia and cancer, meta-analyses of epidemiological studies. Arch Physiol Biochem. 2008;114:63–70. doi: 10.1080/13813450801954451. [DOI] [PubMed] [Google Scholar]
- 3.Gupta C, Tikoo K. High glucose and insulin differentially modulates proliferation in MCF-7 and MDA-MB-231 cells. J Mol Endocrinol. 2013;51:119–129. doi: 10.1530/JME-13-0062. [DOI] [PubMed] [Google Scholar]
- 4.Rostoker R, Bitton-Worms K, Caspi A, Shen-Orr Z, LeRoith D. Investigating new therapeutic strategies targeting hyperinsulinemia’s mitogenic effects in a female mouse breast cancer model. Endocrinology. 2013;154:1701–1710. doi: 10.1210/en.2012-2263. [DOI] [PubMed] [Google Scholar]
- 5.Belfiore A, Malaguarnera R. Insulin receptor and cancer. Endocr Relat Cancer. 2011;18:R125–R147. doi: 10.1530/ERC-11-0074. [DOI] [PubMed] [Google Scholar]
- 6.Novosyadlyy R, et al. Insulin-mediated acceleration of breast cancer development and progression in a nonobese model of type 2 diabetes. Cancer Res. 2010;70:741–751. doi: 10.1158/0008-5472.CAN-09-2141. [DOI] [PMC free article] [PubMed] [Google Scholar]
- 7.Heidegger I, Kern J, Ofer P, Klocker H, Massoner P. Oncogenic functions of IGF1R and INSR in prostate cancer include enhanced tumor growth, cell migration and angiogenesis. Oncotarget. 2014;5:2723–2735. doi: 10.18632/oncotarget.1884. [DOI] [PMC free article] [PubMed] [Google Scholar]
- 8.Arcidiacono B, et al. Insulin resistance and cancer risk: An overview of the pathogenetic mechanisms. Exp Diabetes Res. 2012;2012:789174. doi: 10.1155/2012/789174. [DOI] [PMC free article] [PubMed] [Google Scholar]
- 9.Taniguchi CM, Emanuelli B, Kahn CR. Critical nodes in signalling pathways: Insights into insulin action. Nat Rev Mol Cell Biol. 2006;7:85–96. doi: 10.1038/nrm1837. [DOI] [PubMed] [Google Scholar]
- 10.Freed-Pastor WA, Prives C. Mutant p53: One name, many proteins. Genes Dev. 2012;26:1268–1286. doi: 10.1101/gad.190678.112. [DOI] [PMC free article] [PubMed] [Google Scholar]
- 11.Muller PAJ, Vousden KH. p53 mutations in cancer. Nat Cell Biol. 2013;15:2–8. doi: 10.1038/ncb2641. [DOI] [PubMed] [Google Scholar]
- 12.Dong P, Xu Z, Jia N, Li D, Feng Y. Elevated expression of p53 gain-of-function mutation R175H in endometrial cancer cells can increase the invasive phenotypes by activation of the EGFR/PI3K/AKT pathway. Mol Cancer. 2009;8:103. doi: 10.1186/1476-4598-8-103. [DOI] [PMC free article] [PubMed] [Google Scholar]
- 13.Muller PAJ, et al. Mutant p53 drives invasion by promoting integrin recycling. Cell. 2009;139:1327–1341. doi: 10.1016/j.cell.2009.11.026. [DOI] [PubMed] [Google Scholar]
- 14.Tan BS, et al. Mutant p53-R273H mediates cancer cell survival and anoikis resistance through AKT-dependent suppression of BCL2-modifying factor (BMF) Cell Death Dis. 2015;6:e1826. doi: 10.1038/cddis.2015.191. [DOI] [PMC free article] [PubMed] [Google Scholar]
- 15.Di Minin G, et al. Mutant p53 reprograms TNF signaling in cancer cells through interaction with the tumor suppressor DAB2IP. Mol Cell. 2014;56:617–629. doi: 10.1016/j.molcel.2014.10.013. [DOI] [PubMed] [Google Scholar]
- 16.Min J, et al. An oncogene-tumor suppressor cascade drives metastatic prostate cancer by coordinately activating Ras and nuclear factor-kappaB. Nat Med. 2010;16:286–294. doi: 10.1038/nm.2100. [DOI] [PMC free article] [PubMed] [Google Scholar]
- 17.Bellazzo A, Di Minin G, Collavin L. Block one, unleash a hundred. Mechanisms of DAB2IP inactivation in cancer. Cell Death Differ. 2017;24:15–25. doi: 10.1038/cdd.2016.134. [DOI] [PMC free article] [PubMed] [Google Scholar]
- 18.Liu L, Xu C, Hsieh JT, Gong J, Xie D. DAB2IP in cancer. Oncotarget. 2016;7:3766–3776. doi: 10.18632/oncotarget.6501. [DOI] [PMC free article] [PubMed] [Google Scholar]
- 19.Xie D, et al. DAB2IP coordinates both PI3K-Akt and ASK1 pathways for cell survival and apoptosis. Proc Natl Acad Sci USA. 2009;106:19878–19883. doi: 10.1073/pnas.0908458106. [DOI] [PMC free article] [PubMed] [Google Scholar]
- 20.Werner H, Karnieli E, Rauscher FJ, LeRoith D. Wild-type and mutant p53 differentially regulate transcription of the insulin-like growth factor I receptor gene. Proc Natl Acad Sci USA. 1996;93:8318–8323. doi: 10.1073/pnas.93.16.8318. [DOI] [PMC free article] [PubMed] [Google Scholar]
- 21.Kissebah AH, et al. Relation of body fat distribution to metabolic complications of obesity. J Clin Endocrinol Metab. 1982;54:254–260. doi: 10.1210/jcem-54-2-254. [DOI] [PubMed] [Google Scholar]
- 22.Boyault S, et al. Mutational characterization of individual breast tumors: TP53 and PI3K pathway genes are frequently and distinctively mutated in different subtypes. Breast Cancer Res Treat. 2012;132:29–39. doi: 10.1007/s10549-011-1518-y. [DOI] [PubMed] [Google Scholar]
- 23.Ciriello G, et al. TCGA Research Network Comprehensive molecular portraits of invasive lobular breast cancer. Cell. 2015;163:506–519. doi: 10.1016/j.cell.2015.09.033. [DOI] [PMC free article] [PubMed] [Google Scholar]
- 24.Cancer Genome Atlas Network Comprehensive molecular portraits of human breast tumours. Nature. 2012;490:61–70. doi: 10.1038/nature11412. [DOI] [PMC free article] [PubMed] [Google Scholar]
- 25.Lunardi A, et al. A genome-scale protein interaction profile of Drosophila p53 uncovers additional nodes of the human p53 network. Proc Natl Acad Sci USA. 2010;107:6322–6327. doi: 10.1073/pnas.1002447107. [DOI] [PMC free article] [PubMed] [Google Scholar]
- 26.Dai X, North BJ, Inuzuka H. Negative regulation of DAB2IP by Akt and SCFFbw7 pathways. Oncotarget. 2014;5:3307–3315. doi: 10.18632/oncotarget.1939. [DOI] [PMC free article] [PubMed] [Google Scholar]
- 27.Dillon RL, Muller WJ. Distinct biological roles for the Akt family in mammary tumor progression. Cancer Res. 2010;70:4260–4264. doi: 10.1158/0008-5472.CAN-10-0266. [DOI] [PMC free article] [PubMed] [Google Scholar]
- 28.Chan JY, LaPara K, Yee D. Disruption of insulin receptor function inhibits proliferation in endocrine-resistant breast cancer cells. Oncogene. 2016;35:4235–4243. doi: 10.1038/onc.2015.488. [DOI] [PMC free article] [PubMed] [Google Scholar]
- 29.Cooks T, et al. Mutant p53 prolongs NF-κB activation and promotes chronic inflammation and inflammation-associated colorectal cancer. Cancer Cell. 2013;23:634–646. doi: 10.1016/j.ccr.2013.03.022. [DOI] [PMC free article] [PubMed] [Google Scholar]
- 30.Girardini JE, et al. A Pin1/mutant p53 axis promotes aggressiveness in breast cancer. Cancer Cell. 2011;20:79–91. doi: 10.1016/j.ccr.2011.06.004. [DOI] [PubMed] [Google Scholar]
- 31.Schneider CA, Rasband WS, Eliceiri KW. NIH image to ImageJ: 25 years of image analysis. Nat Methods. 2012;9:671–675. doi: 10.1038/nmeth.2089. [DOI] [PMC free article] [PubMed] [Google Scholar]
- 32.Jacquemier J, et al. p53 immunohistochemical analysis in breast cancer with four monoclonal antibodies: Comparison of staining and PCR-SSCP results. Br J Cancer. 1994;69:846–852. doi: 10.1038/bjc.1994.164. [DOI] [PMC free article] [PubMed] [Google Scholar]
- 33.Vasou O, et al. Detection of pAkt protein in imprint cytology of invasive breast cancer: Correlation with HER2/neu, hormone receptors, and other clinicopathological variables. Cytojournal. 2015;12:6. doi: 10.4103/1742-6413.153965. [DOI] [PMC free article] [PubMed] [Google Scholar]


