Significance
Infantile neuronal ceroid lipofuscinosis (INCL, or infantile Batten disease) is a fatal childhood disease that devastates the brain. Trying to treat the brain alone has so far proved ineffective, so we looked for effects of the disease in other parts of the body. Unexpectedly, we found that the spinal cord is severely affected before the brain and contributes to disease outcome. Directing gene therapy to just the spinal cord of INCL mice can improve their disease. However, treating both the spinal cord and brain provides the most effective therapeutic strategy ever seen in this disease. This combined therapy returned INCL mice to a near-normal life span and dramatically improved their quality of life.
Keywords: infantile Batten disease, adeno-associated virus, spinal cord, brain, combination therapy
Abstract
Infantile neuronal ceroid lipofuscinosis (INCL, or CLN1 disease) is an inherited neurodegenerative storage disorder caused by a deficiency of the lysosomal enzyme palmitoyl protein thioesterase 1 (PPT1). It was widely believed that the pathology associated with INCL was limited to the brain, but we have now found unexpectedly profound pathology in the human INCL spinal cord. Similar pathological changes also occur at every level of the spinal cord of PPT1-deficient (Ppt1−/−) mice before the onset of neuropathology in the brain. Various forebrain-directed gene therapy approaches have only had limited success in Ppt1−/− mice. Targeting the spinal cord via intrathecal administration of an adeno-associated virus (AAV) gene transfer vector significantly prevented pathology and produced significant improvements in life span and motor function in Ppt1−/− mice. Surprisingly, forebrain-directed gene therapy resulted in essentially no PPT1 activity in the spinal cord, and vice versa. This leads to a reciprocal pattern of histological correction in the respective tissues when comparing intracranial with intrathecal injections. However, the characteristic pathological features of INCL were almost completely absent in both the brain and spinal cord when intracranial and intrathecal injections of the same AAV vector were combined. Targeting both the brain and spinal cord also produced dramatic and synergistic improvements in motor function with an unprecedented increase in life span. These data show that spinal cord pathology significantly contributes to the clinical progression of INCL and can be effectively targeted therapeutically. This has important implications for the delivery of therapies in INCL, and potentially in other similar disorders.
The neuronal ceroid lipofuscinoses (NCLs) are monogenic, predominantly autosomal-recessive, and progressive neurodegenerative lysosomal storage disorders (LSDs), which mainly present in childhood. Collectively, the NCLs are the most common inherited neurological disease of children (1). Because no effective treatments are currently available, all forms of NCL are fatal (2, 3). Classic CLN1 disease or infantile NCL (INCL) is caused by autosomal-recessive mutations in the PPT1 gene (4, 5). This encodes palmitoyl protein thioesterase 1 (PPT1), a lysosomal enzyme that catalyzes the cleavage of thioester bonds linking long-chain fatty acids to proteins (6, 7). CLN1 disease is a very severe and rapidly progressing form of NCL, presenting as early as 6 to 24 mo of age. Affected children display a rapid loss of motor function, visual acuity, and cognitive abilities and a greatly reduced life expectancy of between 9 and 13 y (8, 9).
PPT1-deficient mice (Ppt1−/−) exhibit a CLN1 disease-like phenotype including retinal dysfunction, progressive sensorimotor defects, seizures, and a shortened life span (10–12). These mice have been a powerful tool to study functional deficits, as well as pathology, in the forebrain and cerebellum. The brains of Ppt1−/− mice showed reduced brain volume (13), progressive cerebral atrophy, and regional neuron loss, all preceded by glial activation (11, 14). Neurons also showed the characteristic accumulation of autofluorescent storage material (AFSM) within their cell bodies (11). Similar reactive and degenerative changes occur in the cerebellum (15), and there is evidence for both axonal and synaptic pathology (16). However, these findings cannot fully explain the sensorimotor deficits observed both in patients and Ppt1−/− mice (17, 18).
Various experimental therapies have been tested to treat forebrain pathology in Ppt1−/− mice, including antioxidants (19, 20), enzyme replacement therapy (ERT) (21, 22), human neuronal stem cells (23), and forebrain-directed gene therapy (12, 24–27). Of these, adeno-associated virus (AAV) vector-mediated gene transfer has been the most promising (3, 28). However, these therapies have met with only limited success, especially compared with efforts in CLN2 disease, another form of NCL caused by a lysosomal enzyme deficiency (29, 30).
To investigate an anatomical basis for the sensorimotor deficits seen in Ppt1−/− mice and to explain the relatively poor efficacy of forebrain-targeted therapies, we postulated the existence of neuropathology outside the brain. We focused our analysis on the spinal cord as a key component of the sensory and motor pathways. Although the spinal cord has not previously been characterized in detail in any form of NCL, our recent analysis of intrathecally delivered enzyme replacement therapy had revealed significant end-stage pathology in the spinal cords of Ppt1−/− mice (31). This prompted us to investigate the onset and progression of this spinal pathology and how it relates to the well-defined sequence of events in the forebrain of these mice. This novel temporal analysis revealed unexpectedly early and profound neuropathological changes that occur at all levels of the cord of Ppt1−/− mice. These changes started at an age when there were few neurodegenerative changes seen in the brains of these mice. Crucially, similar pathology was also present in human CLN1 spinal cord autopsy material.
This novel finding of early and profound pathology throughout the spinal cord led us to investigate whether it was possible to target this region therapeutically by means of AAV-mediated gene therapy using a third-generation AAV2/9 vector (32, 33). Therefore, we tested whether intrathecal (IT) injections of an AAV2/9-hPPT1 vector, either alone or in combination with intracranial (IC) injections (12, 24–27), would have any beneficial effect on disease progression and brain and spinal cord pathology.
Results
Human CLN1 Spinal Cord Displays Profound Neuropathological Changes.
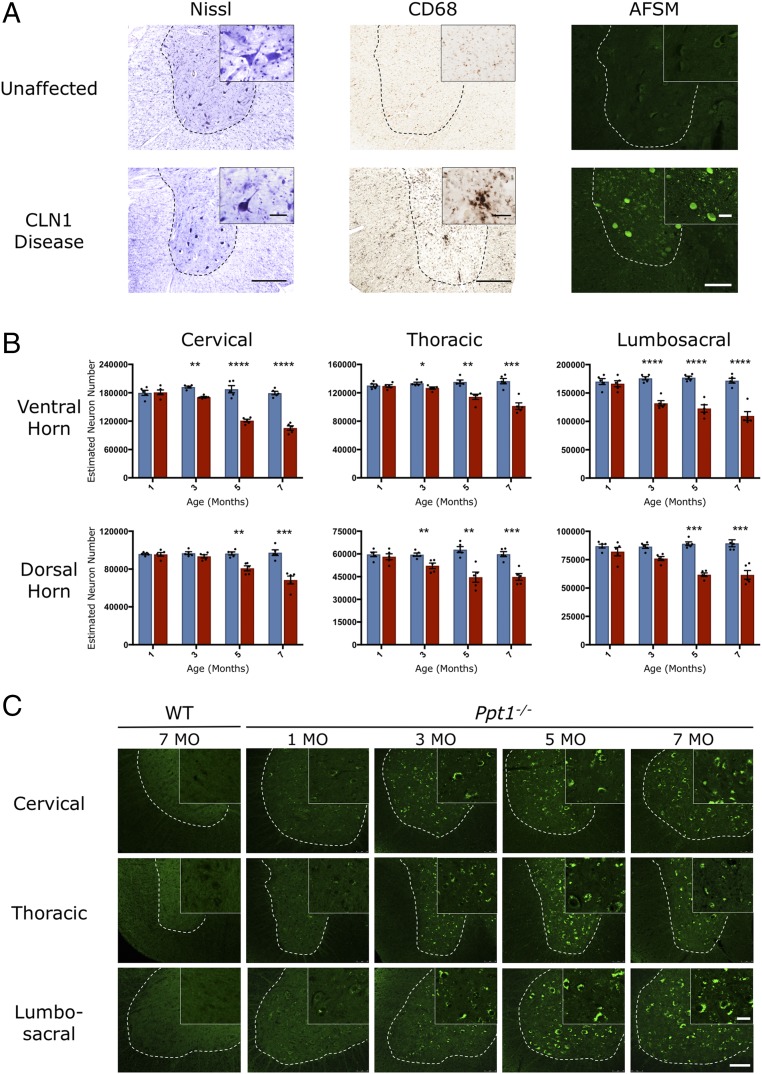
To investigate whether similar pathological changes occur in the spinal cord of human CLN1 disease as those found in the brain (34), we obtained spinal cord sections from a single 6-y-old diseased case and a 10-y-old neurologically normal spinal cord. Nissl staining revealed fewer neurons present in human CLN1 tissue, and those that persisted displayed a range of abnormal morphologies, being either distended by accumulated storage material or darkened and shrunken (Fig. 1A). CD68 staining for microglia revealed the presence of many darkly stained and hypertrophied microglia in the CLN1 disease case (Fig. 1A). These activated microglia were predominantly within the gray matter, but were also present in white matter tracts. As expected, the few remaining neurons displayed massive amounts of autofluorescent storage material (Fig. 1A). In addition, many smaller cells, morphologically identified as microglia, also displayed pronounced levels of storage material. These changes reveal that pronounced neuropathological changes occur in the spinal cord in this disorder. This unexpected finding led us to systematically investigate the temporal and spatial progression of spinal pathology in Ppt1−/− mice.
Fig. 1.
Spinal cord pathology in human and murine CLN1 disease. (A) Representative bright-field images of ventral horns (demarcated by the dotted lines) of human thoracic spinal cord showing fewer, more darkly stained neurons (Nissl), an increase in the number of hypertrophied microglia (CD68), and representative confocal microscopy images showing pronounced accumulation of autofluorescent storage material in human post mortem CLN1 disease tissue compared with an unaffected control. [Scale bars, 200 μm (bright field, Left and Center), 100 μm (confocal, Right), and 25 μm (Insets).] (Insets) Selected from corresponding lower-power views. (B) Unbiased optical fractionator counts reveal significant loss of Nissl (cresyl fast violet)-stained neurons in the dorsal and ventral horns of the spinal cords of PPT1-deficient (red bars) mice as early as 3 mo of age, compared with age-matched wild-type controls (blue bars). Dots represent scatterplots of individual animals. *P < 0.05, **P < 0.01, ***P < 0.001, ****P < 0.0001, two-tailed, unpaired parametric t test. Values are shown as mean ± SEM (n = 5 mice per group). (C) Representative confocal microscopy images of unstained sections showing the progressive accumulation of autofluorescent storage material (green) within morphologically identified neuronal cell bodies in the ventral horns (represented by the dotted lines) of the lumbosacral cord of Ppt1−/− mice as early as 3 mo, compared with age-matched wild-type controls. [Scale bars, 100 μm and 25 μm (Insets).] (Insets) Selected from corresponding lower-power views.
Early and Widespread Neuron Loss in Ppt1−/− Mouse Spinal Cords.
Pronounced neuron loss is an important feature of CLN1 disease, and becomes significant within the cerebellum and thalamus of Ppt1−/− mice by 5 mo (14, 15). We obtained unbiased optical fractionator counts of Nissl-stained neurons in the dorsal and ventral horns, at all levels of the spinal cord of control and Ppt1−/− mice at different ages. These data revealed a significant loss of neurons at all three levels (cervical, lumbosacral dorsal horn, and thoracic ventral horn) of the cord, sometimes as early as 3 mo (Fig. 1B). Regardless of rostrocaudal level, there was invariably a significant loss of neurons both in the dorsal and ventral horns in Ppt1−/− mice from 5 mo of age onward. There was also significant neuron loss at 3 mo of age in both the dorsal and ventral horns, indicating an earlier onset of neurodegenerative changes in the spinal cord compared with the brain (14).
Progressive Accumulation of Autofluorescent Storage Material in Ppt1−/− Mouse Spinal Cords.
Progressive accumulation of AFSM within cell bodies is pathognomic of the NCLs (1, 9). This provides a useful diagnostic readout of the extent of pathology. In Ppt1−/− mice, the characteristic punctate appearance of this autofluorescent storage material was already evident at 3 mo in the cell bodies within spinal gray matter of the dorsal and ventral horns, and occurred to a similar extent at all levels (Fig. 1C).
Ppt1−/− Mouse Spinal Cords Show Progressive Glial Activation at All Levels.
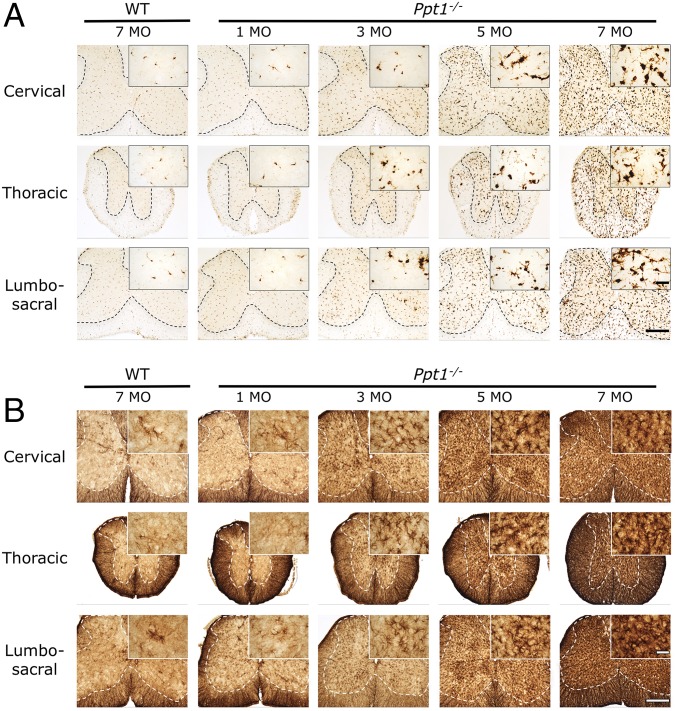
Astrocytosis and microglial activation are closely associated with neuron loss in the forebrains of Ppt1−/− mice, typically preceding neurodegeneration (14). Immunostaining sections of cervical, thoracic, and lumbar cord for CD68 (typically used as a marker of microglial activation by revealing the associated changes in microglial morphology and increased staining intensity) and glial fibrillary associated protein (GFAP; typically used as a marker of astrocytosis by revealing the associated changes in astrocyte morphology and increased staining intensity) (Fig. 2) revealed a profound and early-onset glial activation at all levels of the Ppt1−/− spinal cord. From 3 mo onward, Ppt1−/− mice displayed a dramatic increase in the intensity of CD68 staining (Fig. 2A), with many more of these cells displaying the typical hypertrophied morphology of brain macrophages. Although most pronounced throughout the gray matter, increasingly more intensely stained and hypertrophied microglia were also present in the Ppt1−/− spinal white matter from 5 mo onward. This white matter microgliosis appeared more pronounced in the dorsal compared with the ventral funiculi, but was present at all rostrocaudal levels of the Ppt1−/− spinal cord (Fig. 2A). Both wild-type and Ppt1−/− mice exhibited intense GFAP staining of fibrous astrocytes within all white matter tracts at all ages examined. From 3 mo of age onward in the Ppt1−/− mouse spinal cord, numerous intensely GFAP-stained astrocytes with hypertrophied cell bodies and relatively few thickened processes were present throughout the spinal gray matter, with no obvious laminar specificity. From 5 mo onward, the entire spinal gray matter of Ppt1−/− mice was completely filled with highly activated astrocytes (Fig. 2B).
Fig. 2.
Ppt1−/− mouse spinal cord shows progressive glial activation at all levels. Representative bright-field microscopy images of the spinal cords of Ppt1−/− and wild-type control mice reveal the increased abundance, hypertrophy, and increased staining intensity of CD68-positive microglia (A) and GFAP-positive astrocytes (B) in mutant mice as early as 3 mo of age at all levels of the spinal cord. This glial activation progressively increases with age. The dotted lines demarcate the boundary between the gray and white matter. [Scale bars, 200 μm and 25 μm (Insets).] (Insets) Selected from corresponding lower-power views.
Intracranial and Intrathecal Injections of AAV2/9-hPPT1 Deliver PPT1 Activity to the Brain and Spinal Cord, Respectively.
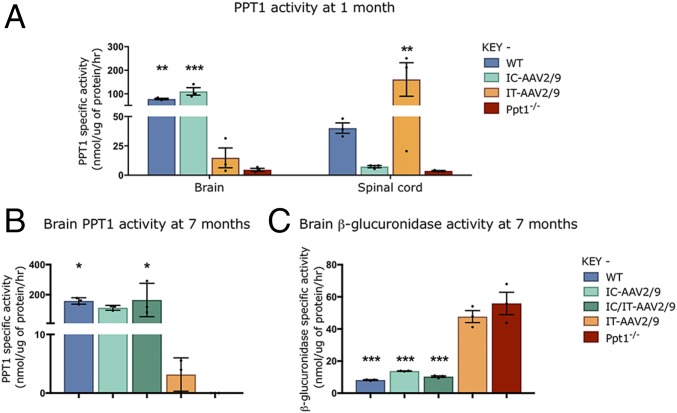
To determine whether this spinal cord disease could be effectively targeted therapeutically, Ppt1−/− mice were injected intrathecally with an AAV vector (IT-AAV2/9-hPPT1) to target the cord, intracranially (IC-AAV2/9-hPPT1) to target the brain, or a combination of the two delivery routes (IC/IT-AAV2/9-hPPT1). At 1 mo of age, supraphysiological levels of PPT1 activity were detected in the spinal cords of mice receiving IT-AAV2/9-hPPT1 alone (Fig. 3A), whereas the brains of these intrathecally treated mice had only ∼10% of normal levels. A reciprocal pattern of enzyme activity was seen in PPT1-deficient mice injected solely with IC-AAV2/9-hPPT1, where these mice had supraphysiological or WT levels of PPT1 activity in their brains but nearly undetectable levels of PPT1 activity in their spinal cords (Fig. 3A).
Fig. 3.
Changes in PPT1 and secondary enzyme activity in regions targeted with AAV2/9-mediated gene therapy. There were reciprocal increases in PPT1 activity between intrathecally (IT-AAV2/9) and intracranially (IC-AAV2/9) injected mice in the spinal cord and brain, respectively, at 1 mo (A). PPT1 levels in the brains of wild-type and IC-AAV2/9–injected mice were significantly increased compared with Ppt1−/−, whereas IT-AAV2/9–injected mice showed significantly elevated levels of PPT1 in the spinal cord. At 7 mo, the brains of IC-AAV2/9 and combination-treated mice (IC/IT-AAV2/9) show significant increases in PPT1 activity (B) and significant decreases in β-glucuronidase activity (C), similar to WT mice, compared with Ppt1−/− mice. Dots represent scatterplots of individual animals. *P < 0.05, **P < 0.01, ***P < 0.001, one-way ANOVA with post hoc Bonferroni correction. Values shown are mean ± SEM (n = 3 mice per group).
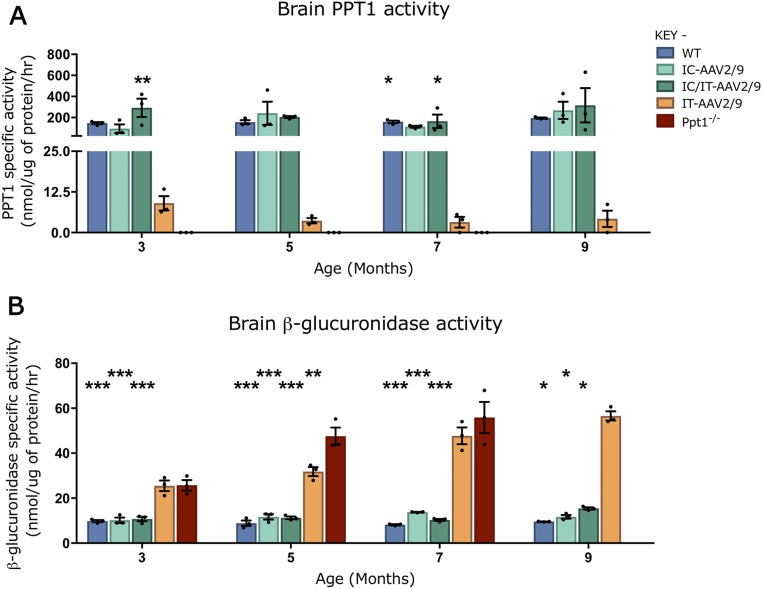
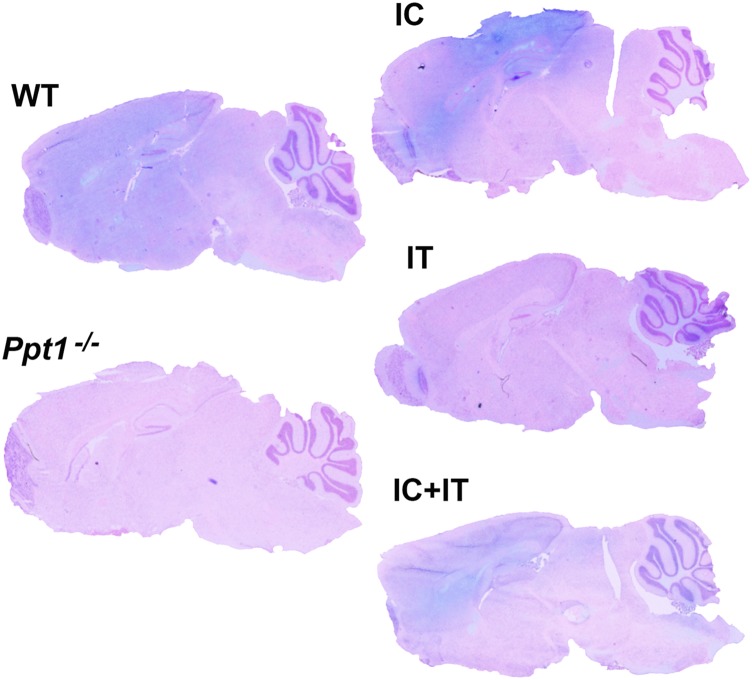
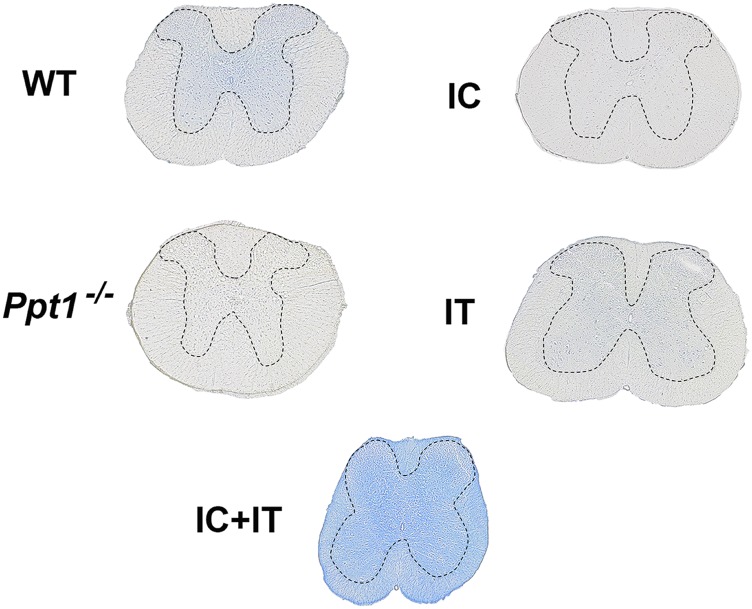
To determine whether this viral-mediated expression was persistent, PPT1 activity was measured in 7-mo-old mouse brains (Fig. 3B). PPT1 activity was virtually undetectable in the brains of untreated Ppt1−/− mice compared with wild-type mice. There was ∼2 to 5% of wild-type PPT1 activity in the brains of mice receiving IT-AAV2/9-hPPT1 (Fig. 3B). There was no significant difference between IC-AAV2/9-hPPT1–only and IC/IT-AAV2/9-hPPT1 combination-treated PPT1 brain activities compared with WT at all of the time points examined (3, 5, 7, and 9 mo; Fig. 3B and Fig. S1A). Similar results were observed when mice from these treatment groups were stained using a recently developed histochemical stain for PPT1 (35) [Figs. S2 (forebrain) and S3 (spinal cord)].
Fig. S1.
Enzymatic activity of PPT1 and β-glucuronidase over time in brains of treated animals. (A) PPT1 activity was increased in the brain for intracranial (IC-AAV2/9) and combination intracranial/intrathecal (IC/IT-AAV2/9)–treated mice to near–wild-type or supraphysiological levels at all time points measured. There was a small increase in PPT1 activity in the intrathecal (IT-AAV2/9) brain (∼2 to 5% of WT levels) at all time points. (B) β-Glucuronidase activity in the brain is increased in the untreated Ppt1−/− mice until 7 mo, after which these mice are terminal. IT-AAV2/9–treated mouse brains had increased β-glucuronidase levels compared with WT until 9 mo. IC-AAV2/9 and IC/IT-AAV2/9 brains have near-WT levels of β-glucuronidase at all time points, and all are significantly decreased compared with Ppt1−/− mouse levels at 3, 5, and 7 mo. IC-AAV2/9, IC/IT-AAV2/9, and WT mice show decreased β-glucuronidase levels compared with IT-AAV2/9 at 9 mo. Dots represent scatterplots of individual animals. *P < 0.05, **P < 0.01, ***P < 0.001, one-way ANOVA with post hoc Bonferroni correction. Values shown are mean ± SEM (n = 3 mice per group).
Fig. S2.
Histochemical stain for PPT1 activity in the brain. PPT1 activity is depicted in blue. Sagittal sections through the forebrain and cerebellum were counterstained with Nuclear Fast Red (pink). There is broad diffuse blue staining in the wild-type control brain, which is not seen in the Ppt1−/− brain. Following intracranial injection, blue staining is visible throughout the cortex and hippocampus with some light staining in the cerebellum. Intrathecal injection results in light staining in the cerebellum and brainstem. Combination intracranial and intrathecal (IC+IT) injection results in intense staining in the cortex and hippocampus as well as broad diffuse staining throughout the cerebellum and brainstem.
Fig. S3.
Histochemical stain for PPT1 activity in the spinal cord. PPT1 activity is depicted in blue, in transverse sections of the spinal cord that are not counterstained. There is diffuse staining in the gray matter of the wild-type spinal cord, which is not seen in the Ppt1−/− tissue. Following intrathecal injection into Ppt1−/− mice, diffuse blue staining is visible primarily in the gray matter. Intracranial injection into Ppt1−/− mice results in no obvious blue staining in any part of the spinal cord. In contrast, combination intracranial and intrathecal (IC+IT) injection into Ppt1−/− mice results in widespread intense staining across white matter and gray matter of the spinal cord. Dotted lines demarcate the borders between spinal gray and white matter.
A reduction in the secondary elevation of other lysosomal enzymes serves as a biochemical surrogate of therapeutic efficacy in PPT1-deficient mice (24). At 7 mo of age, there was a significant increase in brain β-glucuronidase (GUSB) activity in untreated Ppt1−/− mice (Fig. 3C). This secondary elevation of GUSB activity persisted in the brains of PPT1-deficient mice receiving IT-AAV2/9 alone. However, there was a significant decrease in brain GUSB activity in mice receiving either IC-AAV2/9-hPPT1 alone or IC/IT-AAV2/9-hPPT1 combined treatment (Fig. 3C). Brain GUSB activity was not significantly different between WT, IC-AAV2/9-hPPT1–only, and IC/IT-AAV2/9-hPPT1 combination-treated mice at 7 mo. As with PPT1 activity, these patterns of GUSB activity were consistent across every time point examined (3, 5, 7, and 9 mo; Fig. S1B).
Combination IC/IT-AAV2/9-hPPT1 Gene Therapy Synergistically Improves Life Span and Prolongs Motor Function in Ppt1−/− Mice.
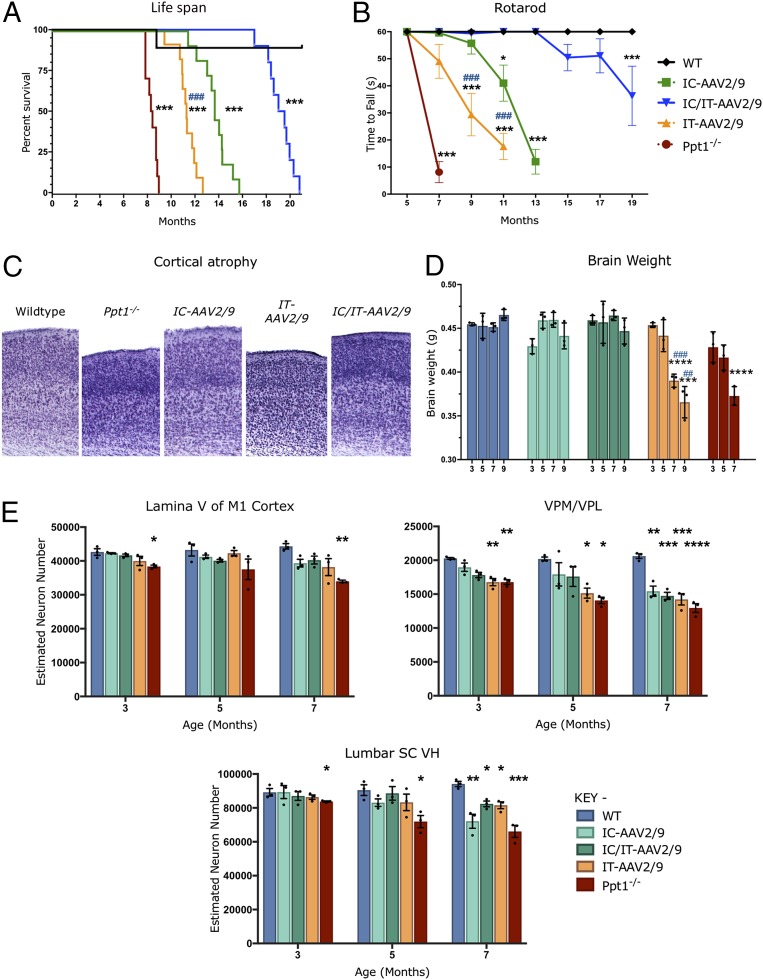
All treatment groups showed a significant increase in median life span compared with untreated Ppt1−/− mice (∼8.4 mo). Combination IC/IT-AAV2/9-hPPT1–treated mice had the longest median life span of 19.3 mo, with the longest-lived mouse at 22 mo, compared with IC-AAV2/9-hPPT1–injected mice (median 13.6 mo) or IT-AAV2/9-hPPT1–injected mice (median 11.8 mo) (Fig. 4A). Rotarod testing revealed that IC/IT-AAV2/9-hPPT1 mice performed better for much longer than either IC-AAV2/9-hPPT1 or IT-AAV2/9-hPPT1 mice (Fig. 4B). However, all treated animals performed better than their untreated counterparts from 7 mo on (Fig. 4B). At 5 mo of age, when there is significant pathology in both the brain and spinal cord, there was no evidence of a learning deficit during the training/acclimation phase of the rotarod test in any group.
Fig. 4.
Targeted AAV2/9-mediated gene therapy delays disease progression and prevents neuron loss. (A) Kaplan–Meier survival curve showing that the median life span for combination IC/IT-treated mice (IC/IT-AAV2/9) (blue) is significantly greater than either intrathecally (IT-AAV2/9) (yellow) or intracranially (IC-AAV2/9) treated mice (green) (n = 10 mice per group). Analysis by log-rank test for trend was significant for overall survival (P < 0.0001). Individual comparisons between curves, using Bonferroni correction for multiple comparisons, were each significant (***P < 0.001) for each group compared with the wild type, as well as between intrathecally (IT-AAV2/9) and intracranially (IC-AAV2/9) treated mice (###P < 0.001). (B) Constant-speed rotarod test revealed that untreated Ppt1−/− mice (red) were unable to stay on the rotarod past 7 mo, intrathecally (IT-AAV2/9) treated mice (yellow) could not stay on the rotarod past 11 mo, intracranially (IC-AAV2/9) treated mice (green) could not stay on the rotarod past 13 mo, and combination IC/IT-treated mice (IC/IT-AAV2/9) (blue) showed deficits at 15 mo and could not stay on the rotarod past 19 mo. Statistical significance for each group compared with wild-type mice (*P < 0.05, ***P < 0.001), and compared between intrathecally (IT-AAV2/9) and intracranially (IC-AAV2/9) treated mice (###P < 0.001), two-way repeated-measure ANOVA (n = 10 mice per group). (C) Representative images of cortices from treated animals in Nissl (cresyl fast violet)-stained sections showing near–wild-type thickness of IC-AAV-2/9– and IC/IT-AAV2/9–treated mouse cortices but not in IT-AAV2/9–treated mice. (D) Brain weights for IC-AAV2/9– and IC/IT-AAV2/9–treated mice were essentially the same as WT mice at all time points examined. However, IT-AAV2/9–treated and untreated Ppt1−/− mice showed a significant reduction in brain weight compared with WT brain weight at 7 and 9 mo. Dots represent scatterplots of individual animals. Significance is compared with wild-type mice (***P < 0.001, ****P < 0.0001), and compared between intrathecally (IT-AAV2/9) and intracranially (IC-AAV2/9) treated mice (##P < 0.01, ###P < 0.001), two-way repeated-measure ANOVA (n = 3 mice per group). (E) Unbiased optical fractionator counts of Nissl (cresyl fast violet)-stained neurons at 3, 5, and 7 mo post injection in the M1 motor cortex, VPM/VPL of the thalamus, and ventral horn (VH) of the lumbar spinal cord show that targeted AAV-2/9–mediated gene therapy has a neuroprotective effect. Significance is compared with untreated WT mice at all time points. Dots represent scatterplots of individual animals. *P < 0.05, **P < 0.01, ***P < 0.001, ****P < 0.0001, one-way ANOVA with post hoc Bonferroni correction. Values shown are mean ± SEM (n = 3 mice per group).
AAV2/9-Mediated Gene Therapy Rescues Cortical Atrophy and Delays Neuron Loss in Ppt1−/− Mice.
Profound brain atrophy is a hallmark of CLN1 disease (11, 13, 14), and cortical thickness (Fig. 4C) and brain weight (Fig. 4D) were measured as indicators of this process. There was a significant thinning of the cerebral cortex in untreated Ppt1−/− and IT-AAV2/9-hPPT1–treated mice compared with wild-type controls. However, cortical thinning was effectively halted in IC-AAV2/9-hPPT1– and IC/IT-AAV2/9-hPPT1–treated mutant mice (Fig. 4C). The weight of the Ppt1−/− mouse brain gradually decreases with disease progression (11, 14). The decrease in brain weight of mice treated with IT-AAV2/9-hPPT1 was similar to that seen in untreated Ppt1−/− mice in both magnitude and rate (Fig. 4D). Brain weight was maintained at nearly normal levels in both the IC-AAV2/9-hPPT1 alone and IC/IT-AAV2/9-hPPT1 combination treatment groups for up to 9 mo (Fig. 4D).
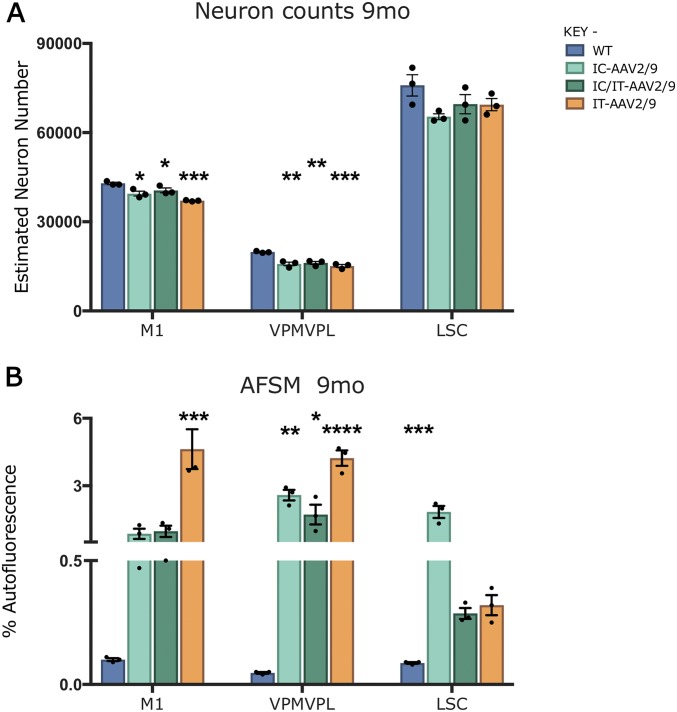
Severe and progressive neuron loss is another hallmark of CLN1 disease (14, 15). Consistent with these previous observations, there was a significant and progressive loss of neurons in the primary motor cortex (M1), ventral posterior thalamic nuclei (VPM/VPL), and ventral horn of the lumbosacral spinal cord (LSC) of untreated Ppt1−/− mice (Fig. 4E). All treatment groups showed significant improvements in M1 cortical neuron counts at 3 and 7 mo (Fig. 4E). The VPM/VPL are more severely affected in Ppt1−/− mice (11, 14), and neuron loss in this region was broadly comparable in all treatment groups to that observed in untreated Ppt1−/− mice regardless of age (Fig. 4E). However, the neuron loss in the LSC at 7 mo of age was significantly less in the IT-AAV2/9-hPPT1–only and IC/IT-AAV2/9-hPPT1 combination treatment groups compared with untreated Ppt1−/− mice. At 9 mo of age, when all untreated Ppt1−/− mice had already died, there was no significant difference in LSC neuron counts between WT controls and the IC/IT-AAV2/9-hPPT1–treated Ppt1−/− mice (Fig. S4A). These data show that AAV-mediated gene therapy had a significant neuroprotective effect in the regions where it was targeted in Ppt1−/− mice.
Fig. S4.
Neuron loss and storage material accumulation in treated mice at 9 mo. (A) Unbiased optical fractionator counts of neurons at 9 mo in Nissl-stained sections showing that intracranially (IC-AAV2/9), intrathecally (IT-AAV2/9), and combination- (IC/IT-AAV2/9) treated mice have significantly decreased neuron counts in the M1 motor cortex compared with wild-type mice. All treated groups also show significantly decreased counts in the thalamus (VPM/VPL) compared with WT mice. However, there is no change between treatment groups and WT in the ventral horn of the lumbosacral spinal cord (LSC). (B) Thresholding image analysis of autofluorescent storage material is significantly increased in the thalamus in all treated groups compared with WT. In the M1 motor cortex, the IT-AAV2/9 AFSM levels are significantly increased compared with WT. In the spinal cord, AFSM levels in the IC-AAV2/9 spinal cord are significantly increased compared with WT. Dots represent scatterplots of individual animals. *P < 0.05, **P < 0.01, ***P < 0.001, ****P < 0.0001, one-way ANOVA with post hoc Bonferroni correction. Values shown are mean ± SEM (n = 3 mice per group).
IC and IT Delivery of Gene Therapy Differentially Reduce AFSM in the Brains and Spinal Cords of Ppt1−/− Mice.
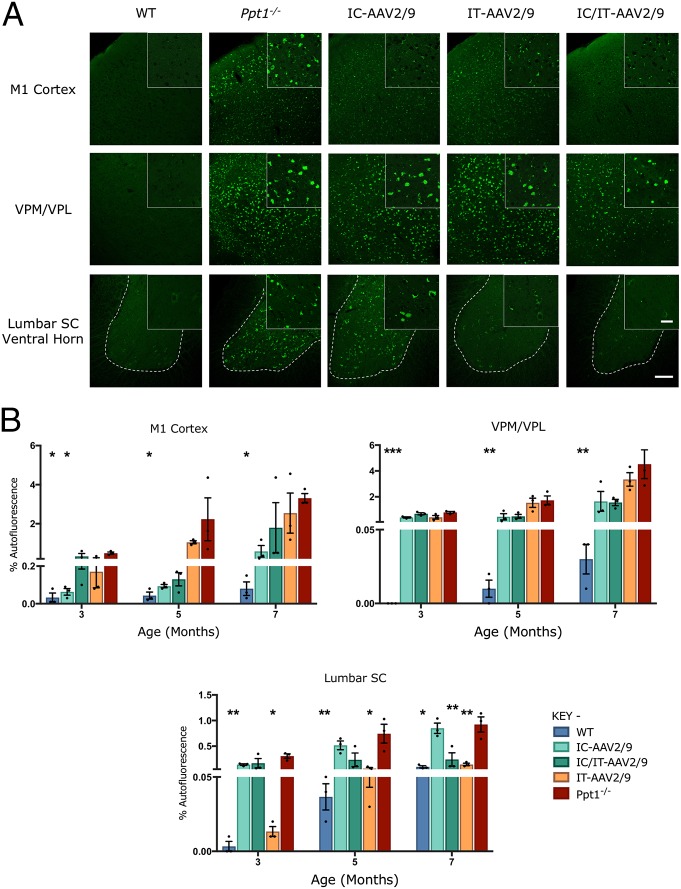
As expected, there was an increase in AFSM at every age examined in all regions of untreated Ppt1−/− brains compared with WT controls (Fig. 5A). In the M1 cortex, both IC-AAV2/9-hPPT1– and IC/IT-AAV2/9-hPPT1–treated mice showed reduced AFSM levels, but these did not reach statistical significance, compared with IT-AAV2/9-hPPT1 mice (Fig. 5B). Although all treatment groups showed levels of AFSM accumulation that were higher than wild-type controls, this was much lower than in untreated Ppt1−/− mice. In the VPM/VPL, all of the treatment groups had an apparent decrease in AFSM at 3 and 5 mo compared with untreated Ppt1−/− mice (Fig. 5A). At 5 and 7 mo, IC-AAV2/9-hPPT1– and IC/IT-AAV2/9-hPPT1–treated mice appeared to have the greatest decrease in AFSM in the VPM/VPL (Fig. 5A), but this was not statistically significant (Fig. 5B). In the lumbar spinal cord, both IC/IT-AAV2/9-hPPT1 and IT-AAV2/9-hPPT1 mice showed AFSM levels comparable to wild-type controls, whereas IC-AAV2/9-hPPT1 mice showed similar amounts of AFSM accumulation to untreated Ppt1−/− mice (Fig. 5). At 9 mo, only IT-AAV2/9-hPPT1 and IC-AAV2/9-hPPT1 mice showed a significantly higher level of AFSM compared with the wild type in the M1 cortex and lumbar spinal cord, respectively (Fig. S4B).
Fig. 5.
Targeted gene therapy reduces storage material accumulation in Ppt1−/− mice. (A) Representative confocal microscopy images of treated animals and controls at 7 mo showing the primary motor cortex, VPM/VPL of the thalamus, and ventral horn of the lumbar spinal cord with differential patterns of reduction of autofluorescent storage material accumulation in intracranially (IC-AAV2/9), intrathecally (IT-AAV2/9), and combination intracranially and intrathecally (IC/IT-AAV2/9) treated mice, compared with untreated Ppt1−/− and wild-type control mice. IC/IT-AAV2/9 mice show an overall greater reduction in AFSM than either IC-AAV2/9 or IT-AAV2/9 therapy alone. The dotted lines demarcate the boundary between the gray and white matter in spinal cord sections. [Scale bars, 100 μm and 25 μm (Insets).] (Insets) Selected from corresponding lower-power views. (B) Thresholding image analysis at 3-, 5-, and 7-mo time points showing a significant but differential pattern of the reduction of AFSM accumulation based on the site of vector administration, with IC/IT-treated mice showing the greatest overall reduction of AFSM. Significance is compared with untreated Ppt1−/− mice. Dots represent scatterplots of individual animals. *P < 0.05, **P < 0.01, ***P < 0.001, one-way ANOVA with post hoc Bonferroni correction. Values shown are mean ± SEM (n = 3 mice per group).
Combination IC/IT-AAV2/9 Gene Therapy Reduces Neuroinflammation in Ppt1−/− Mice.
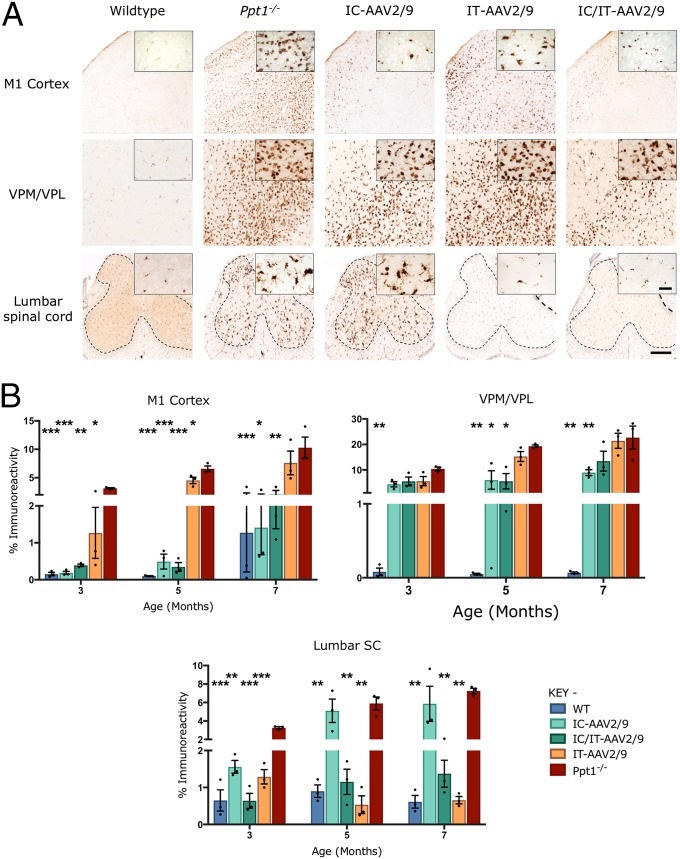
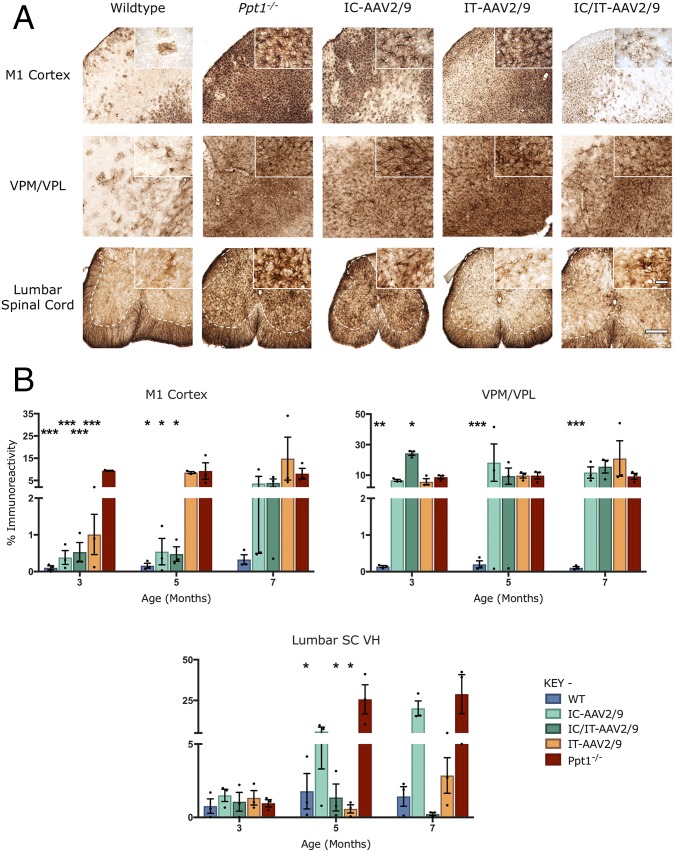
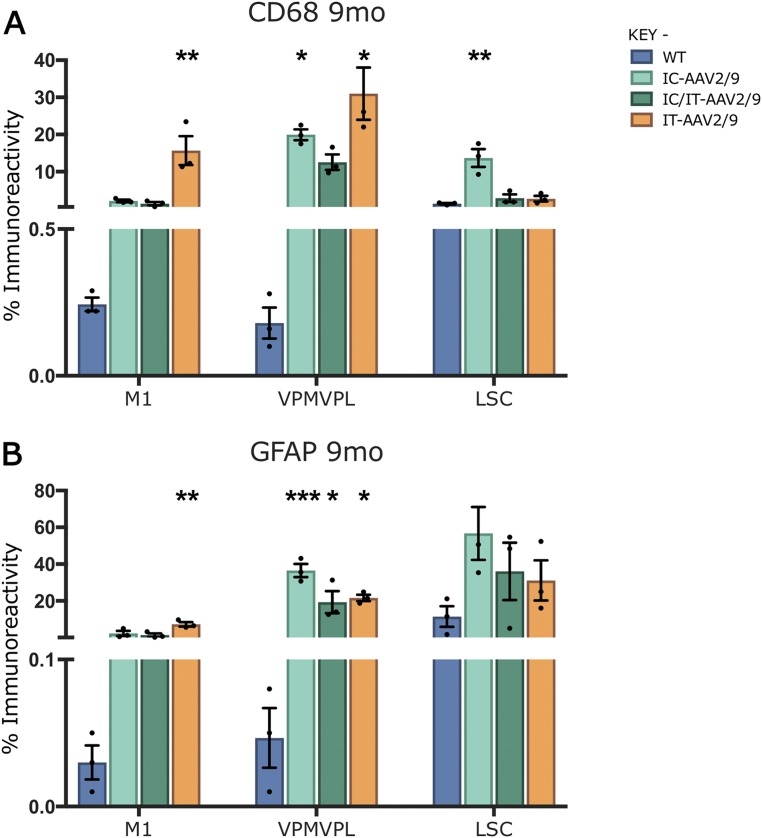
Progressive microglial activation and astrocytosis are prominent features of CLN1 disease, and can be quantified by thresholding image analysis (11, 14). As before (Fig. 2), untreated Ppt1−/− mice showed a significant increase in CD68 and GFAP staining in the brain and lumbosacral spinal cord compared with wild-type mice at every time point (Figs. 6A and 7A). This was confirmed by thresholding image analysis (Figs. 6B and 7B). In the brains of mice treated with IC-AAV2/9-hPPT1 alone or the IC/IT-AAV2/9-hPPT1 combination, there was an apparent decrease in CD68 and GFAP staining in the M1 cortex at every time point (Figs. 6 and 7 and Fig. S5). There was also a moderate decrease in CD68 staining in the M1 cortex of mice receiving IT-AAV2/9-hPPT1 alone at 3 and 5 mo of age, but this decrease was not sustained at 7 mo (Fig. 6B). There was a significant impact upon CD68 staining in the thalamus of IC-AAV2/9-hPPT1–treated mice at 5 and 7 mo and for IC/IT-AAV2/9-hPPT1 mice at 5 mo (Fig. 6). In contrast, there was no significantly lower GFAP staining across any of the treatment groups in the thalamus regardless of age (Fig. 7). In the lumbosacral cord of mutant mice treated with IT-AAV2/9-hPPT1 or IC/IT-AAV2/9-hPPT1 at 3, 5, and 7 mo, there appeared to be a dramatic decrease in both CD68 and GFAP staining (Figs. 6 and 7), with accompanying effects on the morphological appearance of these microglia (Fig. 6A). Mutant mice treated with IC-AAV2/9-hPPT1 alone also had decreased CD68 staining in the lumbosacral spinal cord at 3 mo of age but not at 5 or 7 mo (Fig. 6B). There was no decrease in GFAP staining in the lumbosacral spinal cord at any age following IC-AAV2/9-hPPT1 only (Fig. 7). At 9 mo, IC-AAV2/9-hPPT1–treated mice showed a significant increase in CD68 staining in the thalamus and LSC, as well as a significant increase of GFAP staining in the thalamus (Fig. S5). Reciprocally, IT-AAV2/9-hPPT1–treated mice showed significantly higher levels of CD68 and GFAP staining in the M1 cortex and VPM/VPL. However, IC/IT-AAV2/9-hPPT1–treated mice did not show any significant change from WT mouse levels of CD68 or GFAP staining, with the exception of GFAP staining in the VPM/VPL (Fig. S5).
Fig. 6.
Targeted gene therapy reduces microglial activation in Ppt1−/− mice. (A) Representative images of CD68 staining in treated animals and controls at 7 mo. CD68 staining was examined in the primary motor cortex, VPM/VPL of the thalamus, and ventral horn of the lumbar spinal cord showing differential patterns of reduction of microglial activation in intracranially (IC-AAV2/9), intrathecally (IT-AAV2/9), and combination intracranially and intrathecally (IC/IT-AAV2/9) treated mice, compared with untreated Ppt1−/− and wild-type control mice. IC/IT-AAV2/9 mice showed an overall greater reduction in microglial activation than either IC-AAV2/9 or IT-AAV2/9 therapy alone. The dotted lines demarcate the boundary between the gray and white matter in spinal cord sections. [Scale bars, 200 μm and 25 μm (Insets).] (Insets) Selected from corresponding lower-power views. (B) Thresholding image analysis at 3-, 5-, and 7-mo time points revealed a significant but region-specific pattern in the impact upon microglial activation based on the site of vector administration, with IC/IT-AAV2/9–treated mice showing the greatest overall reduction of microglial activation. Significance is compared with untreated Ppt1−/− mice. Dots represent scatterplots of individual animals. *P < 0.05, **P < 0.01, ***P < 0.001, one-way ANOVA with post hoc Bonferroni correction. Values shown are mean ± SEM (n = 3 mice per group).
Fig. 7.
Combination gene therapy reduces astrocytosis in Ppt1−/− mice. (A) Representative images of GFAP staining in treated animals and controls at 7 mo, examined in the primary motor cortex, VPM/VPL of the thalamus, and ventral horn of the lumbar spinal cord, showing differential patterns of reduction of astrocytosis in intracranially (IC-AAV2/9), intrathecally (IT-AAV2/9), and combination intracranially and intrathecally (IC/IT-AAV2/9) treated Ppt1−/− mice, compared with untreated Ppt1−/− and wild-type control mice. IC/IT-AAV2/9 mice showed an overall greater reduction in astrocytosis than either IC-AAV2/9 or IT-AAV2/9 therapy alone. The dotted lines demarcate the boundary between the gray and white matter in spinal cord sections. [Scale bars, 200 μm and 25 μm (Insets).] (Insets) Selected from corresponding lower-power views. (B) Thresholding image analysis at 3-, 5-, and 7-mo time points showing a significant but treatment-specific pattern of the reduced astrocytosis based on the site of vector administration, with IC/IT-AAV2/9–treated mice showing the greatest overall reduction of astrocytosis. Significance is compared with untreated Ppt1−/− mice. Dots represent scatterplots of individual animals. *P < 0.05, **P < 0.01, ***P < 0.001, one-way ANOVA with post hoc Bonferroni correction. Values shown are mean ± SEM (n = 3 mice per group).
Fig. S5.
Glial activation in treated mice at 9 mo. Thresholding image analysis of CD68-positive microglia (A) reveals significantly increased microglial activation in the thalamus of intracranially (IC-AAV2/9) and intrathecally (IT-AAV2/9) treated mice compared with combination IC/IT-AAV2/9–treated and wild-type mice. In the M1 motor cortex, IT-AAV2/9–treated mice show significantly increased microglial activation compared with WT, whereas IC-AAV2/9 spinal cords showed significantly higher microglial activation compared with WT. Similar analysis of GFAP-stained tissue (B) for astrocytosis revealed that GFAP staining was significantly increased in the thalamus of all treated groups compared with wild type. In the M1 motor cortex, IT-AAV2/9 GFAP staining was significantly increased compared with WT. Dots represent scatterplots of individual animals. *P < 0.05, **P < 0.01, ***P < 0.001, one-way ANOVA with post hoc Bonferroni correction. Values shown are mean ± SEM (n = 3 mice per group).
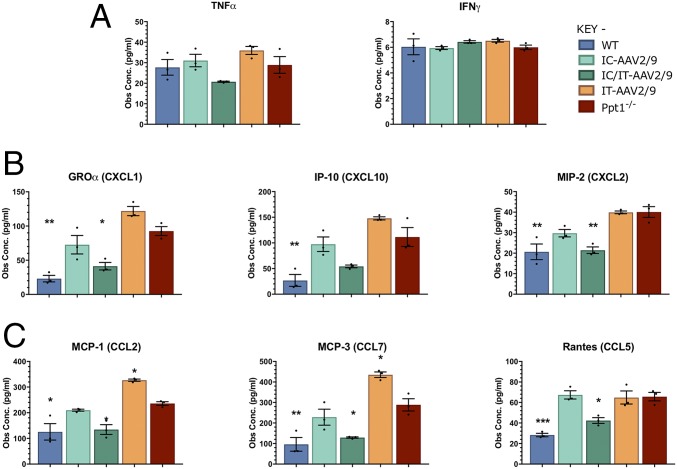
Cytokine and chemokine levels in whole-brain homogenates of treated mice and controls were measured as a complementary indicator of neuroinflammation (36, 37). At 7 mo of age, there were no significant differences in the levels of tumor necrosis factor α (TNF-α) or IFN-γ between any of the control or treatment groups (Fig. 8A). For both the CXC-motif and CCL-motif chemokines, there was a significant increase in untreated Ppt1−/− brains compared with wild-type brains. Neither IC-AAV2/9-hPPT1– nor IT-AAV2/9-hPPT1–treated mice showed reduced chemokine levels below that of untreated Ppt1−/− brains. There was an apparent increase above Ppt1−/− chemokine levels for IT-AAV2/9-hPPT1 mice in CXCL1, CXCL10, CCL2, and CCL7. However, in the brains of IC/IT-AAV2/9-hPPT1 combination-treated Ppt1−/− mice, there was a dramatic and significant decrease in nearly all of the chemokines measured to near–wild-type levels (Fig. 8 B and C).
Fig. 8.
Brain cytokine levels in treated animals at 7 mo. (A) The levels of various cytokines were measured in brain homogenates from treated and untreated WT and Ppt1−/− animals. There were no significant differences in the general proinflammatory cytokines TNF-α [with the exception of intrathecal (IT-AAV2/9) vs. combination intracranial/intrathecal (IC/IT-AAV2/9)] or IFN-γ between any of the groups. (B) Analysis of CXC-motif chemokines showed a significant increase in CXC-motif chemokines in Ppt1−/− and IT-AAV2/9 animals. IC/IT-AAV2/9 animals had a significant decrease in CXCL1 and CXCL2 at 7 mo. (C) CC-motif chemokines showed a significant increase in Ppt1−/− and IT-AAV2/9 mice. IC/IT-AAV2/9 animals had significantly decreased levels of CCL2, CCL7, and CCL5 at 7 mo. Overall, IC/IT-AAV2/9–treated mice showed chemokine levels similar to wild-type mice. Both CXC- and CC-motif chemokines are monocyte and leukocyte chemoattractive and activation molecules. Statistical comparisons were made with untreated Ppt1−/− mice. Values shown are mean ± SEM (n = 3 mice per group). Dots represent scatterplots of individual animals. *P < 0.05, **P < 0.01, ***P < 0.001, one-way ANOVA with post hoc Bonferroni correction.
These data show that AAV2/9-hPPT1 therapy significantly reduces neuroinflammation in the region to which it is targeted, especially in the case of GFAP and CD68 up-regulation. Indeed, combining IC and IT administration of AAV2/9-hPPT1 therapy has a powerful synergistic effect upon multiple measures of disease outcome.
Discussion
The brain has always been considered the main locus of pathology in CLN1 disease (4, 34, 38). However, compared with promising data obtained for another form of NCL, CLN2 disease (32, 33, 39), previous attempts to treat Ppt1−/− mice by targeting the known sites of pathology in the forebrain and cerebellum have had relatively limited success (3, 28). Therefore, we hypothesized the presence of pathology in other regions of the central nervous system that were not affected by these treatments. To better understand the early sensorimotor changes that occur in Ppt1−/− mice (18), we focused our analysis on the spinal cord, a structure that has not been seriously considered as a site of pathology in any major form of NCL (38) but in which we had previously seen pathology in end-stage PPT1-deficient mice (31). We have expanded upon the original brief description of the cellular pathology in the human CLN1 spinal cord (4, 34), and revealed that pathology in this region is not only more profound than initially anticipated but also occurs surprisingly early in disease progression in Ppt1−/− mice. Indeed, the regional atrophy, loss of different neuron populations, profound glial response, and accumulation of autofluorescent storage material that occur in the brains of these mice (11, 13, 14) all occur to a similar extent in the spinal cord, but at an earlier stage of disease progression. Finding such surprisingly severe and early-onset pathology in a structure that has been relatively neglected analytically suggested to us that the spinal cord may significantly contribute to disease progression and would therefore need to be targeted therapeutically to increase the chances of a positive outcome.
To further improve the efficacy of gene therapy in Ppt1−/− mice, we used a third-generation AAV vector (AAV2/9), which is capable of broader distribution within the parenchyma of the brain and increased transduction of neuronal lineages compared with previous generations of AAV vectors (32, 33, 40). Based on a previous study that showed that intrathecal delivery of recombinant PPT1 enzyme could minimally improve the disease phenotype of Ppt1−/− mice (31), we delivered AAV2/9-hPPT1 intrathecally to target the spinal cord. We also combined this approach with brain-directed gene therapy (12, 24–27).
Consistent with previous studies, intracranial injection of an AAV2/9-hPPT1 vector resulted in a significantly increased life span, a preservation of motor function that we have shown previously to correlate with improved cerebellar pathology, and decreased pathology in the forebrain (12, 24–27). However, there was almost no improvement in spinal cord pathology following brain-directed gene therapy in Ppt1−/− mice. Conversely, intrathecal injection of AAV2/9-hPPT1 alone, despite having minimal impact upon pathology in the brain of these mice, significantly decreased pathology in the spinal cord, significantly increased life span, and improved motor function. The differential effects of these treatments are consistent with the reciprocal pattern of enzyme activity in these brain regions following IT vs. IC injections. Intrathecal injection resulted in ∼10% normal levels of PPT1 activity in the brain, and intracranial injections led to ∼5% normal levels of PPT1 activity in the spinal cord (Fig. 3A). Such enzyme levels might normally be sufficient to correct the disease phenotype in lysosomal storage diseases (41, 42). However, it may be that a higher level of PPT1 activity is required to achieve therapeutic benefit in CLN1 disease, and this may vary between brain regions.
No significant differences in cytokine or chemokine levels were observed in the brain between the IC-AAV2/9-hPPT1–treated mice and their untreated Ppt1−/− littermates, even though there was a decrease in histological markers of inflammation (CD68 and GFAP). Not surprisingly, there were no decreases in cytokine/chemokine levels in the brains of IT-AAV2/9-hPPT1–treated mice. In fact, the levels of MCP-1 and MCP-3 were significantly elevated in IT-AAV2/9–treated animals compared with untreated Ppt1−/−mice. Although the reason for this elevation is not clear, it could be an inflammatory response to the IT injection of virus that exacerbates the PPT1-associated neuroinflammation that is not corrected by IT-AAV2/9 alone. Taken together with the histological data, it appears that the effects of AAV gene therapy on cytokine/chemokine levels are localized to the areas of injection (Fig. 8). Indeed, in intracranially or intrathecally treated mice, there are clearly untreated regions of the CNS where the disease is still progressing. It seems likely that IC-treated animals have decreased cytokine/chemokine levels in certain areas of the brain. However, the untreated regions may still have high levels of cytokines/chemokines that overwhelm any regional reductions in a bulk sample of tissue. It is only when both the brain and spinal cord are treated that the elevated cytokines/chemokines return to nearly normal levels.
The differential clinical response of mice treated with either IC-AAV2/9 only or IT-AAV2/9 alone provides important insights into the progression of INCL. Targeting the spinal cord via IT-AAV2/9-hPPT1 corrected much of the pathology in the spinal cord but had little effect on the brain. Despite this, motor function was improved and the life span in these Ppt1−/− mice was significantly increased, even when histological correction was limited to the spinal cord. Such data suggest that this spinal pathology is clinically significant. However, it is unclear whether targeting the spinal cord also corrected other, yet unknown aspects of CLN1 disease such as any possible dorsal root ganglion (DRG) or peripheral nervous system pathology.
Our data suggest that although CLN1 disease significantly impacts the spinal cord, the brain remains the most severely and acutely affected region of the CNS in Ppt1−/− mice. Indeed, limiting therapy to the brain alone is clearly more effective than targeting the spinal cord alone. This study also clearly demonstrates that targeting the cerebral cortex, hippocampus, cerebellum, and spinal cord is not sufficient to correct the entire brain. As shown in this study, the thalamus is only partially corrected even when the brain and spinal cord are simultaneously targeted. It is likely that targeting the thalamus directly could further increase efficacy because it is a site of significant disease and it is the first region of the brain to be affected in CLN1 disease (14). Indeed, the thalamus consistently appears to be an important and early disease focus in many different LSDs, as is revealed by T2 imaging of these patients (43), and pronounced thalamic pathology has been shown in mouse models of all forms of NCL (reviewed in ref. 44) and all other LSDs we have examined (e.g., 45, 46). As such, it will be important to direct therapies to this brain region, and this may be key for improving therapeutic outcome further.
Combining intracranial and intrathecal injections of AAV2/9-hPPT1 led to dramatic and significant extension in life span and improvement in motor function compared with either therapy alone in Ppt1−/− mice. Indeed, IC/IT-AAV2/9-hPPT1–treated mice display the greatest biochemical, histological, and clinical improvements ever reported in CLN1 mice by a considerable margin. This is most likely due to the broader distribution of the AAV2/9-hPPT1 vector (and PPT1 enzyme levels) in the CNS. Taken together, these data suggest that it will be necessary to treat both the spinal cord and brain to achieve maximum efficacy. Interestingly, these data also show that targeting both the brain and spinal cord results in synergistic improvements. For example, if the modalities were simply additive, the predicted median life span would be ∼16.7 mo rather than the ∼19.3 mo observed. The similar improvement in motor function also suggests a synergistic effect, where the age at which the combination therapy mice begin to fall off the rotarod is greater than the sum of the increases observed with either intracranial or intrathecal treatment alone.
Although the combination therapy can dramatically and significantly increase life span and improve motor function, the IC/IT-AAV2/9-hPPT1–treated mice still have a reduced life span compared with their wild-type littermates, suggesting that these mice may be succumbing either to the residual pathology in regions of the CNS such as the thalamus or to disease outside of the central nervous system. There is a growing body of evidence for cardiac dysfunction (47–49) as well as systemic metabolic defects (50, 51) in CLN1 disease and other models of NCL. Targeting such additional sites of pathology and secondary disease mechanisms using other therapeutic modalities such as small-molecule drugs or recombinant PPT1 may further extend the life span and improve the quality of life for CLN1 disease patients.
This study clearly demonstrates the clinical significance of treating spinal cord pathology in CLN1 disease and has shown that AAV-mediated gene therapy can successfully prevent this when appropriately targeted. It remains to be seen how effective later administration of gene therapy would be, and it will be important to investigate this in future studies. However, our data reveal that a combination approach of IC/IT-AAV2/9-hPPT1 therapy has resulted in the greatest extension of life span and preservation of motor function in Ppt1−/− mice of any preclinical treatment so far (3, 28). Consistent with the current study, another group recently presented data in abstract form demonstrating that IT injection of a self-complementary AAV vector resulted in significant biochemical and clinical improvements in the Ppt1−/− mouse (52). Our data strongly suggest that the response could have been much greater if they had targeted both the brain and spinal cord. Recent clinical trials in children with other inherited neurological disorders such as CLN2, CLN6, giant axonal neuropathy, and spinal muscular atrophy using direct intracranial or intrathecal injections of AAV vectors (clinicaltrials.gov) have shown that these approaches are safe. As such, our findings will directly inform strategies for delivering therapies to children with this invariably fatal disease and other similar disorders in which spinal pathology may also occur.
Materials and Methods
Human Tissue.
Paraffin wax-embedded tissue samples of human thoracic spinal cord were obtained from the archives of the Department of Pathology, Helsinki University and the Department of Pathology, Washington University School of Medicine. These specimens were collected at routine autopsies of CLN1 patients (n = 1, age of disease onset 1 y, age at death 6 y 10 mo) or neurologically normal controls (n = 1, age at death 10 y) with informed written consent and the approval of the Ethical Research Committee of the Institute of Psychiatry, Psychology & Neuroscience, King’s College London (approval nos. 223/00 and 181/02).
Animals.
Both congenic Ppt1−/− and wild-type mice were maintained on a C57BL/6J background at Washington University School of Medicine. The colonies were maintained separately through homozygous mating. All procedures were performed in accordance with NIH guidelines as well as a protocol approved by the Institutional Animal Care and Use Committee (IACUC) at Washington University School of Medicine. See SI Materials and Methods for further details.
Treatment Groups.
For the analysis of spinal cord pathology, a sample size of n = 5 mice per group for wild-type C57BL/6 mice and Ppt1−/− were used at each time point of 1, 3, 5, and 7 mo as previously described (14). For the combination AAV2/9-hPPT1 therapy study, five treatment groups were generated: (i) untreated Ppt1−/− mice (n = 22), (ii) AAV2/9-hPPT1 intracranially injected Ppt1−/− mice (IC-AAV2/9-hPPT1, n = 25), (iii) AAV2/9-hPPT1 intrathecally injected Ppt1−/− mice (IT-AAV2/9-hPPT1, n = 25), (iv) combination AAV2/9-hPPT1 intracranially and intrathecally injected Ppt1−/− mice (IC/IT-AAV2/9-hPPT1, n = 25), and (v) wild-type C57BL/6 (n = 25) mice. We did not include a group of mice treated with a control AAV vector because we had already included this group in a prior study, and showed that intracranial injections of an AAV vector expressing GFP had no effect on life span or any other parameter measured in Ppt1−/− mice (12). Longevity and rotarod performance were assessed in the treatment and control groups (n = 10 mice per group), and randomly selected mice were analyzed at predetermined time points (1, 3, 5, 7, and 9 mo) for biochemical and histological analyses (n = 3 mice per group). For all studies, experimental and control animals were randomly assigned identification numbers such that the person performing the analyses was blind to genotype and treatment, and all data collected are presented here.
Recombinant AAV Production.
The rAAV2/9-hPPT1 vector genome used in this study is identical to that described and schematically represented previously (24), and was packaged at the University of North Carolina Vector Core. Viral titers were adjusted to 1 × 10¹² vector genomes (vg)/mL for all injections. See SI Materials and Methods for further details.
Intracranial and Intrathecal Injections.
On postnatal day 1 (PND1) or PND2, Ppt1−/− pups received intracranial or intrathecal injections with AAV2/9-hPPT1 (1 × 10¹² vg/mL) into the anterior cortex, hippocampus, and cerebellum as previously described (12). For intrathecal injections, PND1 or PND2 Ppt1−/− pups were injected in the lumbar region as previously described (54, 55). For the combination treatment, both intracranial and intrathecal injections were performed on the same day in the same pup. See SI Materials and Methods for further details.
Life Span.
Longevity was determined in the treatment and control groups (n = 10 mice per group) by death or euthanasia for humane reasons. A Kaplan–Meier life span curve was used to measure survival, and significant differences were determined using a log-rank analysis (P < 0.05).
Rotarod Testing.
Motor function and coordination were assessed in the same treated Ppt1−/− and control mice (n = 10) used for longevity using a constant-speed (3 rpm) rotarod beginning at 5 mo of age and every 2 mo thereafter as previously described (12, 18). There was also a 3-d training/acclimation phase before the first test that allowed for a crude assessment of learning.
PPT1 Activity and Secondary Enzyme Elevations.
Tissue was collected at predetermined time points (1, 3, 5, and 7 mo). Three mice per treatment group were euthanized via lethal injection (Fatal-Plus; Vortech Pharmaceuticals). PPT1 assays were performed on brain homogenates as previously described (56). Secondary elevations of another lysosomal enzyme, β-glucuronidase, were determined as previously described using a 4-methylumbelliferyl (MU)-β-d-glucuronide fluorometric assay and normalized to total protein (57). See SI Materials and Methods for further details.
Tissue Processing and Histological Staining.
Brain processing and analysis were performed as previously described (11, 14, 25). Spinal cords were split into cervical, thoracic, and lumbosacral blocks. Forty-micrometer coronal sections were cut throughout each brain and spinal cord block and 5-µm-thick sections were cut from paraffin wax-embedded samples of human thoracic spinal cord. Sections were then stained for cresyl fast violet (Nissl) as before (11, 13) as a 1 in 6 series of brain sections or a 1 in 24 series of spinal cord sections to reveal cytoarchitecture. For immunohistochemistry, a 1 in 48 series of free-floating spinal cord sections from each mouse was stained using a standard immunoperoxidase protocol (11, 25) for markers of astrocytes (rabbit anti-GFAP; 1:8,000; Dako) and microglia (rat anti-mouse CD68; 1:2,000; AbD Serotec). Paraffin wax-embedded human spinal cord tissue sections were similarly immunostained as previously described (58) for monoclonal mouse anti-CD68 (clone PG-M1; 1:800; Dako).
Histochemical Stain.
A histochemical stain for PPT1 activity was performed on sagittal forebrain sections and transverse sections of spinal cord, as previously described (35). See SI Materials and Methods for further details.
Visualization of Autofluorescent Storage Material.
The accumulation of AFSM was visualized in unstained sections of tissue and quantified in different regions of the brain and spinal cord using a previously published method (24). See SI Materials and Methods for further details.
Stereological Analysis.
Counts of neurons in the dorsal and ventral horns of each hemisection of the spinal cord were performed by a design-based optical fractionator method in a 1 in 48 series of Nissl-stained sections (59) using Stereo Investigator software (MBF Bioscience) (11). See SI Materials and Methods for further details.
Thresholding Image Analysis.
To analyze the degree of glial activation in the gray matter of sections stained for GFAP and CD68, a semiautomated thresholding image analysis method was used with Image-Pro Premier software (Media Cybernetics) (11). See SI Materials and Methods for further details.
Cytokine Profile Analysis.
Cytokine profiling was performed using an Affymetrix multiplex assay through the Center for Human Immunology and Immunotherapy Programs (CHiiPS) Immunomonitoring Lab (IML) at Washington University School of Medicine. Nine analytes (GRO-α, IFN-γ, IL-10, IP-10, MCP-1, MCP-3, MIP-2, RANTES, and TNF-α) were measured in brain homogenates of treated animals. See SI Materials and Methods for further details.
Statistical Analysis.
All statistical analyses were performed using Prism software (GraphPad Software). A two-tailed, unpaired, parametric t test was used where two groups were compared, and a one-way ANOVA with a Bonferroni post hoc analysis was used when comparing three or more groups at each time point. Results were considered statistically significant when P < 0.05. Unless otherwise stated, statistical comparisons are between the treatment groups and untreated Ppt1−/− mice. The mean coefficient of error for all stereological measures was below 0.10 (60), and all measurements were performed blind to genotype.
SI Materials and Methods
Study Design.
The overall objectives of this work were to first confirm the presence of spinal cord pathology in human tissue and then determine the temporal and spatial progression of that pathology in the Ppt1−/− mouse, and second, to test whether therapeutically targeting this pathology in the Ppt1−/− mouse would have a beneficial effect on disease progression by means of intrathecal (IT) injection of AAV2/9-hPPT1–mediated gene therapy either alone or in combination with similar therapy that was administered by intracranial (IC) injection. For the characterization of human CLN1 diseased spinal cord pathology, paraffin wax-embedded tissue samples of human thoracic spinal cord were obtained from the archives of the Department of Pathology, Helsinki University, and the Department of Pathology, Washington University School of Medicine. These specimens were collected at routine autopsies of CLN1 patients (n = 1, age of disease onset 1 y, age at death 6 y 10 mo) or neurologically normal controls (n = 1, age at death 10 y) with informed written consent and the approval of the Ethical Research Committee of the Institute of Psychiatry, Psychology & Neuroscience, King’s College London (approval nos. 223/00 and 181/02). The PPT1-deficient (Ppt1−/−) mouse model used for this study was first generated by Gupta et al. (10), and is a well-established model of CLN1 disease, recapitulating most of the human behavioral and pathological phenotypes (53). We backcrossed the mutation onto the C57BL/6 background (The Jackson Laboratory) for 10 generations, and then separated wild-type and Ppt1−/− colonies because homozygous Ppt1−/− mice breed. Because the colonies were separated, every tenth generation both colonies were backcrossed to Jackson Laboratory C57BL/6 mice for 10 generations in order to maintain the genetic continuity between the colonies. For the analysis of spinal cord pathology, a sample size of n = 5 mice per group for wild-type C57BL/6 and Ppt1−/− mice were used at each time point of 1, 3, 5, and 7 mo as previously described (14). For the combination AAV2/9-hPPT1 therapy study, five treatment groups were generated: (i) Ppt1−/− mice (n = 22), (ii) AAV2/9-hPPT1 intracranially injected Ppt1−/− mice (IC-AAV2/9-hPPT1, n = 25), (iii) AAV2/9-hPPT1 intrathecally injected Ppt1−/− mice (IT-AAV2/9-hPPT1, n = 25), (iv) combination AAV2/9-hPPT1 intracranially and intrathecally injected Ppt1−/− mice (IC/IT-AAV2/9-hPPT1, n = 25), and (v) wild-type C57BL/6 (WT, n = 25) mice. We did not include a group of mice treated with a control AAV vector because we had already included this group in a prior study and showed that intracranial injections of an AAV vector expressing GFP had no effect on life span or any other parameter measured in Ppt1−/− mice (12). Longevity and rotarod performance were assessed in the treatment and control groups (n = 10 mice per group), and randomly selected mice were analyzed at predetermined time points (1, 3, 5, 7, and 9 mo) for biochemical and histological analyses (n = 3 mice per group). For all studies, experimental and control animals were randomly assigned identification numbers such that the person performing the analyses was blind to genotype and treatment, and all data collected are presented here.
Ppt1−/− and WT Mice.
Both congenic Ppt1−/− and wild-type mice were maintained on a C57BL/6J background at Washington University School of Medicine. The colonies were maintained separately through homozygous mating. All procedures were performed in accordance with NIH guidelines as well as a protocol approved by the IACUC at Washington University School of Medicine.
Recombinant AAV Production.
The rAAV2/9-hPPT1 vector genome used in this study is identical to that described previously and shown schematically (24), and was packaged at the University of North Carolina Vector Core. Briefly, the vector contained the cytomegalovirus enhancer, chicken β-actin promoter, entire first intron of the chicken β-actin gene, first exon of the chicken β-actin gene, human PPT1 cDNA (NCBI GenBank accession no. CR542053.1), and rabbit β-globin polyadenylation signal, all flanked by the AAV2 inverted terminal repeats (24). We packaged the AAV-hPPT1 genome in an AAV9 capsid because it has been shown by multiple groups that AAV9 results in a broader distribution and higher transduction rate in the brains of experimental animals (33, 40). Viral titers were adjusted to 1 × 10¹² vg/mL for all injections.
Intracranial and Intrathecal Injections.
On postnatal day 1 (PND1) or PND2, Ppt1−/− pups received intracranial or intrathecal injections with AAV2/9-hPPT1 (1 × 10¹² vg/mL) using a Hamilton syringe fitted with a 30-gauge needle. For intracranial injections, 2 μL virus was injected bilaterally into the anterior cortex, hippocampus, and cerebellum as previously described (12). For intrathecal injections, PND1 or PND2 Ppt1−/− pups were injected in the lumbar region as previously described (54, 55). Briefly, 15 μL virus was mixed with 3 μL sterile Trypan blue, and 15 μL of this mixture was then injected. A successful injection was confirmed by the appearance of Trypan blue in the tail and cerebellum. For the combination treatment, both intracranial and intrathecal injections were performed on the same day in the same pup.
Life Span.
Longevity was determined in the treatment and control groups (n = 10 mice per group) by death or euthanasia for humane reasons. A Kaplan–Meier life span curve was used to measure survival, and significant differences were determined using a log-rank analysis (P < 0.05).
Rotarod Testing.
Motor function and coordination were assessed in the same treated Ppt1−/− and control mice (n = 10) used for longevity using a constant-speed (3 rpm) rotarod beginning at 5 mo of age and every 2 mo thereafter as previously described (12, 18). There is also a 3-d training/acclimation phase before the first test that allows for a crude assessment of learning.
PPT1 Activity and Secondary Enzyme Elevations.
Tissue was collected at predetermined time points (1, 3, 5, and 7 mo). Three mice per treatment group were euthanized via lethal injection (Fatal-Plus; Vortech Pharmaceuticals). Blood was collected from the right ventricle using a 1-mL tuberculin syringe fitted with a 26-gauge needle and allowed to clot for 15 min before centrifugation at 1,000 × g for 10 min. Serum was collected and flash-frozen. Mice were then transcardially perfused with PBS until the liver was cleared of blood. Additional tissue samples were immersion-fixed in 4% paraformaldehyde in PBS for 24 h and then cryoprotected in a 30% sucrose solution in Tris-buffered saline (TBS). Cutting the spinal cord at the C1 vertebral junction and resecting the spine where it enters the tail removed the spine. The spine was fixed and cryoprotected as described above. The brain was removed, weighed, and bisected sagittally; the left hemisphere was flash-frozen, whereas the right hemisphere was fixed and cryoprotected as described above. PPT1 assays were performed on brain homogenates as previously described using the 4-MU-palmitate fluorometric assay and normalized to total protein (56). Secondary elevations of another lysosomal enzyme, β-glucuronidase, were determined as previously described using the 4-MU-β-d-glucuronide fluorometric assay and normalized to total protein (57).
Tissue Processing and Histological Staining.
Brain processing and analysis were performed as previously described (11, 14, 25). Briefly, mice for both studies at 1, 3, 5, 7, and 9 mo of age were anesthetized with sodium pentobarbitone (100 mg/kg) and perfused transcardially with heparinized PBS followed by 4% formaldehyde in PBS (pH 7.4). After postfixation in this solution for a further 48 h, the brain and intact spinal cord were dissected out and cryoprotected in 30% sucrose in 50 mM TBS (pH 7.6).
Spinal cords were split into cervical, thoracic, and lumbosacral blocks. Forty-micrometer coronal sections were cut throughout each brain and spinal cord block on an HM 430 freezing microtome (Microm International). Paraffin wax-embedded samples of human thoracic spinal cord were routinely processed and 5-µm-thick sections were cut using an SM2400 base sledge microtome (Leica Microsystems).
Sections were then Nissl stained with cresyl fast violet as before (11, 13) as a 1 in 6 series of brain sections or a 1 in 24 series of spinal cord sections to reveal cytoarchitecture. For immunohistochemistry, a 1 in 48 series of free-floating spinal cord sections from each mouse was stained using a standard immunoperoxidase protocol (11, 25) for markers of astrocytes (rabbit anti-GFAP; 1:8,000; Dako) and microglia (rat anti-mouse CD68; 1:2,000; AbD Serotec). Paraffin wax-embedded human spinal cord tissue sections were similarly immunostained as previously described (58) for monoclonal mouse anti-CD68 (clone PG-M1; 1:800; Dako).
Histochemical Stain.
Histochemical staining for PPT1 activity was performed on sagittal forebrain sections and transverse sections of the spinal cord as previously described (35). Briefly, unfixed tissue was isolated from treated mice and immediately embedded in Optimal Cutting Temperature Compound (OCT; Sakura Finetek) on dry ice. Tissues were cryosectioned at 16 µm and mounted on Superfrost Plus slides (Thermo Fisher Scientific). Tissues were fixed in 4% paraformaldehyde in PBS on the slides for 20 min at 4 °C. Slides were then rinsed and equilibrated with 0.2 M sodium acetate buffer (pH 4.5). Each slide was covered with the histochemical solution overnight at 37 °C in a humidified chamber. Slides were rinsed with water, counterstained with Nuclear Fast Red (Sigma-Aldrich) (forebrain) or left uncounterstained (spinal cord), and coverslipped.
Visualization of Autofluorescent Storage Material.
The accumulation of AFSM was visualized in unstained sections of tissue mounted onto glass slides and coverslipped with Fluoromount-G mounting medium (SouthernBiotech) using an SP5 confocal microscope (Leica Microsystems). The AFSM was then quantified in different regions of the brain and spinal cord using a previously published method (24). Briefly, this involved the collection of 30 nonoverlapping 40× confocal images across three sections through each region of interest, while maintaining a constant relationship between all settings maintaining a consistent relative relationship between amplitude offset and detector gain between animals, before applying thresholding image analysis using Image-Pro Premier image analysis software (Media Cybernetics) to discriminate between AFSM above background histofluorescence and calculate the percentage of each field containing AFSM (24).
Stereological Analysis.
Counts of neurons in the dorsal and ventral horns of each hemisection of the spinal cord were performed by a design-based optical fractionator method in a 1 in 48 series of Nissl-stained sections (59) using Stereo Investigator software (MBF Bioscience) (11). Cells were sampled with counting frames (70 × 40 μm) distributed over a sampling grid (M1 cortex, 225 × 225 μm; VPM/VPL, 175 × 175 μm; spinal cord, 150 × 150 μm) that was superimposed over the region of interest at 100× magnification.
Thresholding Image Analysis.
To analyze the degree of glial activation in the gray matter of sections stained for GFAP and CD68, a semiautomated thresholding image analysis method was used with Image-Pro Premier software (Media Cybernetics) (11). Briefly, this involved the collection of 30 nonoverlapping 40× bright-field images across three sections through each region of interest, while maintaining the lamp intensity, video camera setup, and calibration constant throughout image capturing. Images were subsequently analyzed using Image-Pro Premier (Media Cybernetics) using an appropriate threshold that selected the foreground immunoreactivity above background. This threshold was then applied as a constant to all subsequent images analyzed per batch of animals and reagent used to determine the specific area of immunoreactivity for each antigen (24).
Cytokine Profile Analysis.
Cytokine profiling was performed using an Affymetrix multiplex assay through the CHiiPS IML at Washington University School of Medicine. Nine analytes (GRO-α, IFN-γ, IL-10, IP-10, MCP-1, MCP-3, MIP-2, RANTES, and TNF-α) were measured in brain homogenates of treated animals. Treated mice were perfused with PBS before removal of the brain. Half of the brain was flash-frozen and homogenized in 10 mM Tris (pH 7.5), 150 mM NaCl, 0.2% Triton X-100, and 1 mM DTT, as previously described (27). The homogenate was spun at 14,000 × g for 1 min, and the supernatant was isolated. Proteinase inhibitor mixture (P2714; Sigma) and PMSF (17 µg/mL) were added to the supernatant. Samples were flash-frozen. For the assay, samples were thawed on ice and centrifuged at 14,000 × g for 1 min to remove particulates. Samples were then diluted to 10 mg of protein per mL. Diluted samples were further diluted 1:2 in PBS with premixed beads. The plate was incubated overnight on a shaker at 4 °C. The Affymetrix multiplex plate was run and the data are reported as pg/mL.
Statistical Analysis.
All statistical analyses were performed using Prism software (GraphPad Software). A two-tailed, unpaired, parametric t test was used where two groups were compared and a one-way ANOVA with a Bonferroni post hoc analysis was used when comparing three or more groups at each time point. Results were considered statistically significant when P < 0.05. Unless otherwise stated, statistical comparisons are between the treatment groups and untreated Ppt1−/− mice. The mean coefficient of error for all stereological measures was below 0.10 (60), and all measurements were performed blind to genotype.
Acknowledgments
The authors acknowledge Sarmi Sri, Jasmyn Dmytrus, and Sioned Williams for generating preliminary data for spinal cord pathology. We also thank Drs. John Østergaard, Patricia Dickson, Elizabeth Bradbury, and Alison Barnwell for their advice and comments on the manuscript. This work was supported by NIH NINDS 043205 (to M.S.S. and J.D.C.) and a King’s College London Graduate School International Studentship Award (to H.R.N.).
Footnotes
The authors declare no conflict of interest.
This article is a PNAS Direct Submission.
This article contains supporting information online at www.pnas.org/lookup/suppl/doi:10.1073/pnas.1701832114/-/DCSupplemental.
References
- 1.Jalanko A, Braulke T. Neuronal ceroid lipofuscinoses. Biochim Biophys Acta. 2009;1793:697–709. doi: 10.1016/j.bbamcr.2008.11.004. [DOI] [PubMed] [Google Scholar]
- 2.Warrier V, Vieira M, Mole SE. Genetic basis and phenotypic correlations of the neuronal ceroid lipofusinoses. Biochim Biophys Acta. 2013;1832:1827–1830. doi: 10.1016/j.bbadis.2013.03.017. [DOI] [PubMed] [Google Scholar]
- 3.Geraets RD, et al. Moving towards effective therapeutic strategies for neuronal ceroid lipofuscinosis. Orphanet J Rare Dis. 2016;11:40. doi: 10.1186/s13023-016-0414-2. [DOI] [PMC free article] [PubMed] [Google Scholar]
- 4.Santavuori P, Haltia M, Rapola J. Infantile type of so-called neuronal ceroid-lipofuscinosis. Dev Med Child Neurol. 1974;16:644–653. doi: 10.1111/j.1469-8749.1974.tb04183.x. [DOI] [PubMed] [Google Scholar]
- 5.Vesa J, et al. Mutations in the palmitoyl protein thioesterase gene causing infantile neuronal ceroid lipofuscinosis. Nature. 1995;376:584–587. doi: 10.1038/376584a0. [DOI] [PubMed] [Google Scholar]
- 6.Camp LA, Hofmann SL. Purification and properties of a palmitoyl-protein thioesterase that cleaves palmitate from H-Ras. J Biol Chem. 1993;268:22566–22574. [PubMed] [Google Scholar]
- 7.Lu JY, Verkruyse LA, Hofmann SL. Lipid thioesters derived from acylated proteins accumulate in infantile neuronal ceroid lipofuscinosis: Correction of the defect in lymphoblasts by recombinant palmitoyl-protein thioesterase. Proc Natl Acad Sci USA. 1996;93:10046–10050. doi: 10.1073/pnas.93.19.10046. [DOI] [PMC free article] [PubMed] [Google Scholar]
- 8.Santavuori P, Haltia M, Rapola J, Raitta C. Infantile type of so-called neuronal ceroid-lipofuscinosis. 1. A clinical study of 15 patients. J Neurol Sci. 1973;18:257–267. doi: 10.1016/0022-510x(73)90075-0. [DOI] [PubMed] [Google Scholar]
- 9.Mole SE, Williams RE, Goebel HH. Correlations between genotype, ultrastructural morphology and clinical phenotype in the neuronal ceroid lipofuscinoses. Neurogenetics. 2005;6:107–126. doi: 10.1007/s10048-005-0218-3. [DOI] [PubMed] [Google Scholar]
- 10.Gupta P, et al. Disruption of PPT1 or PPT2 causes neuronal ceroid lipofuscinosis in knockout mice. Proc Natl Acad Sci USA. 2001;98:13566–13571. doi: 10.1073/pnas.251485198. [DOI] [PMC free article] [PubMed] [Google Scholar]
- 11.Bible E, Gupta P, Hofmann SL, Cooper JD. Regional and cellular neuropathology in the palmitoyl protein thioesterase-1 null mutant mouse model of infantile neuronal ceroid lipofuscinosis. Neurobiol Dis. 2004;16:346–359. doi: 10.1016/j.nbd.2004.02.010. [DOI] [PubMed] [Google Scholar]
- 12.Griffey MA, et al. CNS-directed AAV2-mediated gene therapy ameliorates functional deficits in a murine model of infantile neuronal ceroid lipofuscinosis. Mol Ther. 2006;13:538–547. doi: 10.1016/j.ymthe.2005.11.008. [DOI] [PubMed] [Google Scholar]
- 13.Kühl TG, Dihanich S, Wong AM, Cooper JD. Regional brain atrophy in mouse models of neuronal ceroid lipofuscinosis: A new rostrocaudal perspective. J Child Neurol. 2013;28:1117–1122. doi: 10.1177/0883073813494479. [DOI] [PubMed] [Google Scholar]
- 14.Kielar C, et al. Successive neuron loss in the thalamus and cortex in a mouse model of infantile neuronal ceroid lipofuscinosis. Neurobiol Dis. 2007;25:150–162. doi: 10.1016/j.nbd.2006.09.001. [DOI] [PMC free article] [PubMed] [Google Scholar]
- 15.Macauley SL, et al. Cerebellar pathology and motor deficits in the palmitoyl protein thioesterase 1-deficient mouse. Exp Neurol. 2009;217:124–135. doi: 10.1016/j.expneurol.2009.01.022. [DOI] [PMC free article] [PubMed] [Google Scholar]
- 16.Kielar C, et al. Molecular correlates of axonal and synaptic pathology in mouse models of Batten disease. Hum Mol Genet. 2009;18:4066–4080. doi: 10.1093/hmg/ddp355. [DOI] [PMC free article] [PubMed] [Google Scholar]
- 17.Santavuori P, et al. Infantile neuronal ceroid-lipofuscinosis (INCL): Diagnostic criteria. J Inherit Metab Dis. 1993;16:227–229. doi: 10.1007/BF00710250. [DOI] [PubMed] [Google Scholar]
- 18.Dearborn JT, et al. Comprehensive functional characterization of murine infantile Batten disease including Parkinson-like behavior and dopaminergic markers. Sci Rep. 2015;5:12752. doi: 10.1038/srep12752. [DOI] [PMC free article] [PubMed] [Google Scholar]
- 19.Wei H, et al. Disruption of adaptive energy metabolism and elevated ribosomal p-S6K1 levels contribute to INCL pathogenesis: Partial rescue by resveratrol. Hum Mol Genet. 2011;20:1111–1121. doi: 10.1093/hmg/ddq555. [DOI] [PMC free article] [PubMed] [Google Scholar]
- 20.Sarkar C, et al. Neuroprotection and lifespan extension in Ppt1(−/−) mice by NtBuHA: Therapeutic implications for INCL. Nat Neurosci. 2013;16:1608–1617. doi: 10.1038/nn.3526. [DOI] [PMC free article] [PubMed] [Google Scholar]
- 21.Lu JY, Hu J, Hofmann SL. Human recombinant palmitoyl-protein thioesterase-1 (PPT1) for preclinical evaluation of enzyme replacement therapy for infantile neuronal ceroid lipofuscinosis. Mol Genet Metab. 2010;99:374–378. doi: 10.1016/j.ymgme.2009.12.002. [DOI] [PMC free article] [PubMed] [Google Scholar]
- 22.Hu J, et al. Intravenous high-dose enzyme replacement therapy with recombinant palmitoyl-protein thioesterase reduces visceral lysosomal storage and modestly prolongs survival in a preclinical mouse model of infantile neuronal ceroid lipofuscinosis. Mol Genet Metab. 2012;107:213–221. doi: 10.1016/j.ymgme.2012.05.009. [DOI] [PMC free article] [PubMed] [Google Scholar]
- 23.Tamaki SJ, et al. Neuroprotection of host cells by human central nervous system stem cells in a mouse model of infantile neuronal ceroid lipofuscinosis. Cell Stem Cell. 2009;5:310–319. doi: 10.1016/j.stem.2009.05.022. [DOI] [PubMed] [Google Scholar]
- 24.Griffey M, et al. Adeno-associated virus 2-mediated gene therapy decreases autofluorescent storage material and increases brain mass in a murine model of infantile neuronal ceroid lipofuscinosis. Neurobiol Dis. 2004;16:360–369. doi: 10.1016/j.nbd.2004.03.005. [DOI] [PubMed] [Google Scholar]
- 25.Macauley SL, et al. Synergistic effects of central nervous system-directed gene therapy and bone marrow transplantation in the murine model of infantile neuronal ceroid lipofuscinosis. Ann Neurol. 2012;71:797–804. doi: 10.1002/ana.23545. [DOI] [PMC free article] [PubMed] [Google Scholar]
- 26.Roberts MS, et al. Combination small molecule PPT1 mimetic and CNS-directed gene therapy as a treatment for infantile neuronal ceroid lipofuscinosis. J Inherit Metab Dis. 2012;35:847–857. doi: 10.1007/s10545-011-9446-x. [DOI] [PMC free article] [PubMed] [Google Scholar]
- 27.Macauley SL, et al. An anti-neuroinflammatory that targets dysregulated glia enhances the efficacy of CNS-directed gene therapy in murine infantile neuronal ceroid lipofuscinosis. J Neurosci. 2014;34:13077–13082. doi: 10.1523/JNEUROSCI.2518-14.2014. [DOI] [PMC free article] [PubMed] [Google Scholar]
- 28.Hawkins-Salsbury JA, Cooper JD, Sands MS. Pathogenesis and therapies for infantile neuronal ceroid lipofuscinosis (infantile CLN1 disease) Biochim Biophys Acta. 2013;1832:1906–1909. doi: 10.1016/j.bbadis.2013.05.026. [DOI] [PMC free article] [PubMed] [Google Scholar]
- 29.Passini MA, et al. Intracranial delivery of CLN2 reduces brain pathology in a mouse model of classical late infantile neuronal ceroid lipofuscinosis. J Neurosci. 2006;26:1334–1342. doi: 10.1523/JNEUROSCI.2676-05.2006. [DOI] [PMC free article] [PubMed] [Google Scholar]
- 30.Katz ML, et al. AAV gene transfer delays disease onset in a TPP1-deficient canine model of the late infantile form of Batten disease. Sci Transl Med. 2015;7:313ra180. doi: 10.1126/scitranslmed.aac6191. [DOI] [PMC free article] [PubMed] [Google Scholar]
- 31.Lu JY, et al. Intrathecal enzyme replacement therapy improves motor function and survival in a preclinical mouse model of infantile neuronal ceroid lipofuscinosis. Mol Genet Metab. 2015;116:98–105. doi: 10.1016/j.ymgme.2015.05.005. [DOI] [PubMed] [Google Scholar]
- 32.Dayton RD, Wang DB, Klein RL. The advent of AAV9 expands applications for brain and spinal cord gene delivery. Expert Opin Biol Ther. 2012;12:757–766. doi: 10.1517/14712598.2012.681463. [DOI] [PMC free article] [PubMed] [Google Scholar]
- 33.Swain GP, et al. Adeno-associated virus serotypes 9 and rh10 mediate strong neuronal transduction of the dog brain. Gene Ther. 2014;21:28–36. doi: 10.1038/gt.2013.54. [DOI] [PMC free article] [PubMed] [Google Scholar]
- 34.Haltia M, Rapola J, Santavuori P. Infantile type of so-called neuronal ceroid-lipofuscinosis. Histological and electron microscopic studies. Acta Neuropathol. 1973;26:157–170. doi: 10.1007/BF00697751. [DOI] [PubMed] [Google Scholar]
- 35.Dearborn JT, et al. Histochemical localization of palmitoyl protein thioesterase-1 activity. Mol Genet Metab. 2016;117:210–216. doi: 10.1016/j.ymgme.2015.11.004. [DOI] [PMC free article] [PubMed] [Google Scholar]
- 36.Macauley SL, Pekny M, Sands MS. The role of attenuated astrocyte activation in infantile neuronal ceroid lipofuscinosis. J Neurosci. 2011;31:15575–15585. doi: 10.1523/JNEUROSCI.3579-11.2011. [DOI] [PMC free article] [PubMed] [Google Scholar]
- 37.Qiao X, Lu JY, Hofmann SL. Gene expression profiling in a mouse model of infantile neuronal ceroid lipofuscinosis reveals upregulation of immediate early genes and mediators of the inflammatory response. BMC Neurosci. 2007;8:95. doi: 10.1186/1471-2202-8-95. [DOI] [PMC free article] [PubMed] [Google Scholar]
- 38.Anderson GW, Goebel HH, Simonati A. Human pathology in NCL. Biochim Biophys Acta. 2013;1832:1807–1826. doi: 10.1016/j.bbadis.2012.11.014. [DOI] [PubMed] [Google Scholar]
- 39.Katz ML, et al. Enzyme replacement therapy attenuates disease progression in a canine model of late-infantile neuronal ceroid lipofuscinosis (CLN2 disease) J Neurosci Res. 2014;92:1591–1598. doi: 10.1002/jnr.23423. [DOI] [PMC free article] [PubMed] [Google Scholar]
- 40.Foust KD, et al. Intravascular AAV9 preferentially targets neonatal neurons and adult astrocytes. Nat Biotechnol. 2009;27:59–65. doi: 10.1038/nbt.1515. [DOI] [PMC free article] [PubMed] [Google Scholar]
- 41.Neufeld EF, Fratantoni JC. Inborn errors of mucopolysaccharide metabolism. Science. 1970;169:141–146. doi: 10.1126/science.169.3941.141. [DOI] [PubMed] [Google Scholar]
- 42.Donsante A, Levy B, Vogler C, Sands MS. Clinical response to persistent, low-level beta-glucuronidase expression in the murine model of mucopolysaccharidosis type VII. J Inherit Metab Dis. 2007;30:227–238. doi: 10.1007/s10545-007-0483-4. [DOI] [PubMed] [Google Scholar]
- 43.Autti T, Joensuu R, Aberg L. Decreased T2 signal in the thalami may be a sign of lysosomal storage disease. Neuroradiology. 2007;49:571–578. doi: 10.1007/s00234-007-0220-6. [DOI] [PubMed] [Google Scholar]
- 44.Cooper JD, Tarczyluk MA, Nelvagal HR. Towards a new understanding of NCL pathogenesis. Biochim Biophys Acta. 2015;1852:2256–2261. doi: 10.1016/j.bbadis.2015.05.014. [DOI] [PubMed] [Google Scholar]
- 45.Pressey SN, Smith DA, Wong AM, Platt FM, Cooper JD. Early glial activation, synaptic changes and axonal pathology in the thalamocortical system of Niemann-Pick type C1 mice. Neurobiol Dis. 2012;45:1086–1100. doi: 10.1016/j.nbd.2011.12.027. [DOI] [PMC free article] [PubMed] [Google Scholar]
- 46.Farfel-Becker T, et al. Spatial and temporal correlation between neuron loss and neuroinflammation in a mouse model of neuronopathic Gaucher disease. Hum Mol Genet. 2011;20:1375–1386. doi: 10.1093/hmg/ddr019. [DOI] [PubMed] [Google Scholar]
- 47.Galvin N, et al. A murine model of infantile neuronal ceroid lipofuscinosis-ultrastructural evaluation of storage in the central nervous system and viscera. Pediatr Dev Pathol. 2008;11:185–192. doi: 10.2350/07-03-0242.1. [DOI] [PMC free article] [PubMed] [Google Scholar]
- 48.Ostergaard JR, Rasmussen TB, Mølgaard H. Cardiac involvement in juvenile neuronal ceroid lipofuscinosis (Batten disease) Neurology. 2011;76:1245–1251. doi: 10.1212/WNL.0b013e31821435bd. [DOI] [PubMed] [Google Scholar]
- 49.Fukumura S, et al. Progressive conduction defects and cardiac death in late infantile neuronal ceroid lipofuscinosis. Dev Med Child Neurol. 2012;54:663–666. doi: 10.1111/j.1469-8749.2011.04170.x. [DOI] [PubMed] [Google Scholar]
- 50.Woloszynek JC, Coleman T, Semenkovich CF, Sands MS. Lysosomal dysfunction results in altered energy balance. J Biol Chem. 2007;282:35765–35771. doi: 10.1074/jbc.M705124200. [DOI] [PubMed] [Google Scholar]
- 51.Khaibullina A, et al. In a model of Batten disease, palmitoyl protein thioesterase-1 deficiency is associated with brown adipose tissue and thermoregulation abnormalities. PLoS One. 2012;7:e48733. doi: 10.1371/journal.pone.0048733. [DOI] [PMC free article] [PubMed] [Google Scholar]
- 52.Rozenberg AJ, Gray SJ. Early intrathecal gene therapy extends lifespan and improves quality of life in a mouse model for infantile neuronal ceroid lipofuscinosis. Mol Genet Metab. 2017;120:S117. [Google Scholar]
- 53.Cooper JD, Russell C, Mitchison HM. Progress towards understanding disease mechanisms in small vertebrate models of neuronal ceroid lipofuscinosis. Biochim Biophys Acta. 2006;1762:873–889. doi: 10.1016/j.bbadis.2006.08.002. [DOI] [PubMed] [Google Scholar]
- 54.Elliger SS, Elliger CA, Aguilar CP, Raju NR, Watson GL. Elimination of lysosomal storage in brains of MPS VII mice treated by intrathecal administration of an adeno-associated virus vector. Gene Ther. 1999;6:1175–1178. doi: 10.1038/sj.gt.3300931. [DOI] [PubMed] [Google Scholar]
- 55.Hawkins-Salsbury JA, et al. Mechanism-based combination treatment dramatically increases therapeutic efficacy in murine globoid cell leukodystrophy. J Neurosci. 2015;35:6495–6505. doi: 10.1523/JNEUROSCI.4199-14.2015. [DOI] [PMC free article] [PubMed] [Google Scholar]
- 56.van Diggelen OP, et al. A rapid fluorogenic palmitoyl-protein thioesterase assay: Pre- and postnatal diagnosis of INCL. Mol Genet Metab. 1999;66:240–244. doi: 10.1006/mgme.1999.2809. [DOI] [PubMed] [Google Scholar]
- 57.Sands MS, et al. Enzyme replacement therapy for murine mucopolysaccharidosis type VII. J Clin Invest. 1994;93:2324–2331. doi: 10.1172/JCI117237. [DOI] [PMC free article] [PubMed] [Google Scholar]
- 58.Tyynelä J, Cooper JD, Khan MN, Shemilts SJ, Haltia M. Hippocampal pathology in the human neuronal ceroid-lipofuscinoses: Distinct patterns of storage deposition, neurodegeneration and glial activation. Brain Pathol. 2004;14:349–357. doi: 10.1111/j.1750-3639.2004.tb00077.x. [DOI] [PMC free article] [PubMed] [Google Scholar]
- 59.West MJ, Slomianka L, Gundersen HJ. Unbiased stereological estimation of the total number of neurons in the subdivisions of the rat hippocampus using the optical fractionator. Anat Rec. 1991;231:482–497. doi: 10.1002/ar.1092310411. [DOI] [PubMed] [Google Scholar]
- 60.Gundersen HJ, Jensen EB. The efficiency of systematic sampling in stereology and its prediction. J Microsc. 1987;147:229–263. doi: 10.1111/j.1365-2818.1987.tb02837.x. [DOI] [PubMed] [Google Scholar]


