Significance
Antigen-induced phosphorylation of T-cell receptor (TCR) is the first signaling event in T cells that determines the functional outcome of antigen stimulation. Here, we report a key regulatory mechanism of the initiation of TCR phosphorylation. Using biochemical and biophysical tools, we find that a basic residue-rich sequence in CD3ε subunit of TCR can efficiently recruit Lck via ionic interaction to initiate TCR phosphorylation. The mechanism reported here can aid in the design of better T-cell therapies such as the Chimeric Antigen Receptor T-cell therapies.
Keywords: T-cell receptor, Lck, initial phosphorylation, substrate selectivity, ionic interaction
Abstract
Antigen-triggered T-cell receptor (TCR) phosphorylation is the first signaling event in T cells to elicit adaptive immunity against invading pathogens and tumor cells. Despite its physiological importance, the underlying mechanism of TCR phosphorylation remains elusive. Here, we report a key mechanism regulating the initiation of TCR phosphorylation. The major TCR kinase Lck shows high selectivity on the four CD3 signaling proteins of TCR. CD3ε is the only CD3 chain that can efficiently interact with Lck, mainly through the ionic interactions between CD3ε basic residue-rich sequence (BRS) and acidic residues in the Unique domain of Lck. We applied a TCR reconstitution system to explicitly study the initiation of TCR phosphorylation. The ionic CD3ε−Lck interaction controls the phosphorylation level of the whole TCR upon antigen stimulation. CD3ε BRS is sequestered in the membrane, and antigen stimulation can unlock this motif. Dynamic opening of CD3ε BRS and its subsequent recruitment of Lck thus can serve as an important switch of the initiation of TCR phosphorylation.
T cells play key roles in adaptive immunity. Appropriate T-cell response is required for efficient cleaning of invading pathogens and transformed cells based on the recognition of non-self-antigens (1). Abnormal activity of T cells to self-antigens leads to undesirable inflammation and tissue damage that causes autoimmune diseases (2). Harnessing T-cell activity and T-cell-based cell therapies have been successfully applied in clinic to treat cancers and other diseases (3–6). However, current T-cell therapies have limited efficacy. Understanding the molecular basis of T-cell activation therefore is desired to pave the way for new concepts of immunotherapies.
A key feature of T-cell immune response is the specificity. Different antigens can elicit diverse T-cell responses via different T-cell signaling programs (7). The first step of T-cell signaling is the antigen-induced T-cell receptor phosphorylation (8). A T-cell regulator (TCR) protein complex is composed of an antigen recognition subunit TCRαβ and three signaling subunits CD3εδ, CD3εγ, and CD3ζζ (9). The cytoplasmic domains of CD3ε, CD3δ, CD3γ, and CD3ζ all contain the conserved Immunoreceptor Tyrosine-based Activation Motif (ITAM). CD3ζ has three ITAMs whereas other CD3 chains each contain one ITAM. Different antigens are able to induce distinct phosphorylation programs of the 10 ITAMs of a TCR to trigger different T-cell signaling pathways that lead to antigen-specific T-cell immune response (1).
Lck and Fyn, both belonging to the Src kinase family, are the major kinases to phosphorylate TCR in T cells. Genetic experiments show that Lck plays a more important role than Fyn in TCR signaling (10). Lck can either be loaded on coreceptor CD4/CD8 or remain free (11–13). It is suggested that Lck molecules are all loaded on coreceptors in thymocytes (12). However, superresolution imaging shows that CD4 and Lck localize in different nanodomains in mature T cells (13). Functionally, the coreceptor contributes to antigen sensitivity of T cells but is not essential for T-cell activation in mature T cells (14). A recent study shows that free Lck molecules in mature T cells are responsible for initial TCR phosphorylation (15).
In addition to a C-terminal tyrosine kinase domain, Lck contains four regulatory domains, i.e., an SH4 domain, a Unique domain (UD), an SH3 domain, and an SH2 domain. The N-terminal SH4 domain contains a myristoylation site and a palmitoylation site. The lipid modifications are responsible for targeting Lck to cellular membranes, particularly the inner leaflet of the plasma membrane (16–18). Following the SH4 domain is the UD, which is less conserved among Src family members. The N-terminal part of the Lck UD domain forms s zinc clasp with coreceptor CD4 or CD8 using its highly conserved CxxC motif (11). However, whether the UD domain has other functions is unknown. The SH3 and SH2 domains of all Src kinases are highly conserved. The SH3 domain binds the PxxP motif as well as the proline-independent tyrosine-based RKxxYxxY motif (19, 20), thus regulating the substrate specificity. The SH2 domain binds to phosphotyrosine, and its interaction with an inhibitory pTyr site at the Lck C terminus leads to an autoinhibitory folding (21, 22). Earlier experiments show that ∼40% of Lck molecules in resting T cells are constitutively active (23) and antigen stimulation leads to local activation of Lck molecules (24, 25). However, how Lck recognizes CD3 substrates and initiates ITAM phosphorylation remains elusive. This earliest event of TCR signaling is crucial because it determines the downstream signaling programs. More recently, residues surrounding ITAM tyrosines have been found to be important for interaction with the Lck kinase domain and affect substrate selectivity of Lck (26). Whether other Lck domains contribute to CD3 selectivity is still unclear.
Here we first used biochemical and biophysical experiments to show that Lck has strong selectivity on four CD3 chains and that CD3ε is the most favorable substrate because of the ionic interactions between CD3ε basic residue-rich sequence (BRS) and acidic residues in Lck UD. Functional experiments showed that the recruitment of Lck by CD3ε directly controls the initiation of TCR phosphorylation.
Results
CD3 Signaling Proteins Have Different Membrane Binding Properties.
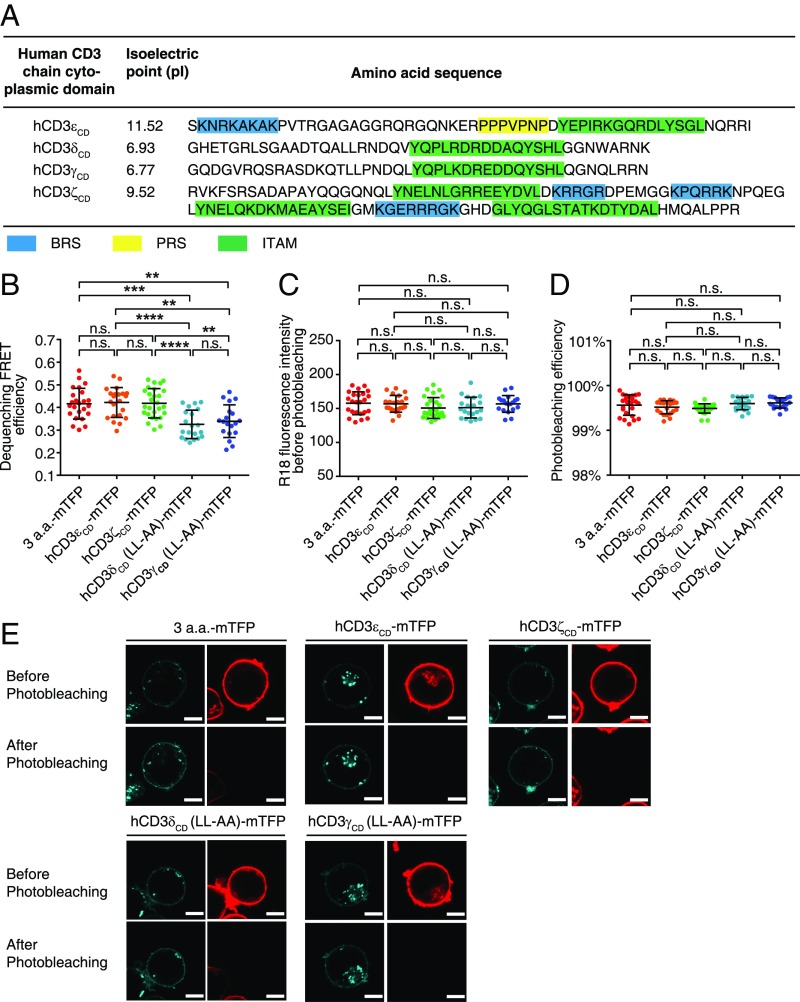
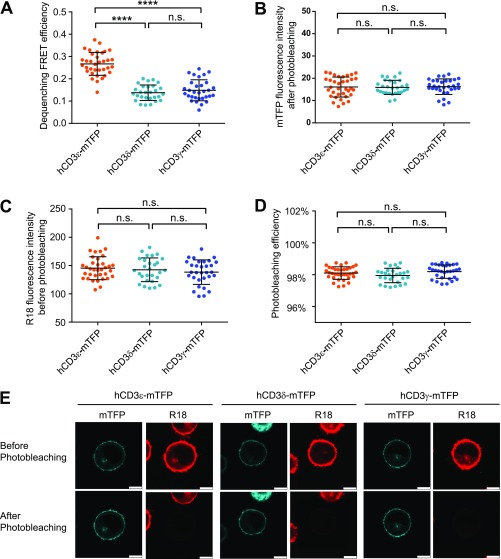
The cytoplasmic domains of four CD3 chains have low sequence similarity except the conserved ITAM. Previous studies strongly suggest that they should have different functional roles in TCR signaling (27–29). The CD3ε cytoplasmic domain (CD3εCD) has a BRS at the juxtamembrane region, followed by a nonredundant proline residue-rich sequence (PRS) and an ITAM (30). CD3ζCD contains three ITAMs and BRS in between ITAMs. CD3δCD and CD3γCD each have one ITAM but no enrichment of basic residues (Fig. 1A). Under physiological pH, human CD3εCD and CD3ζCD carry +11 and +5 charges, respectively, whereas CD3δCD and CD3γCD carry 0 charges. In resting T cells, both CD3εCD and CD3ζCD can bind to acidic phospholipids in the plasma membrane via ionic interactions, which can sequester key tyrosines within the membrane bilayer to prevent spontaneous phosphorylation by the constitutively active Lck (31–37). Such a safety control can be removed by Ca2+ and other factors in activated T cells to make CD3εCD and CD3ζCD available for tyrosine phosphorylation (36, 38, 39). The reversible lipid binding of CD3εCD and CD3ζCD thus enables a precise regulation of ITAM phosphorylation. However, whether this mechanism also applies to CD3δ and CD3γ is unknown. We used a live-cell FRET experiment to compare the membrane binding properties of the cytoplasmic domains of four CD3 signaling proteins in the context of HA-KIR2DL3-CD3CD-mTFP chimeric construct. The data clearly showed that CD3εCD and CD3ζCD bound to the membrane and thus generated high FRET values, whereas CD3δCD and CD3γCD were exposed in the cytosol and generated low FRET values (Fig. 1 B−E). Consistently, CD3δCD and CD3γCD within the native TCR−CD3 complex also showed cytosol-exposed conformation (Fig. S1). Given that constitutively active Lck molecules are largely present (23), it is difficult to understand why the well-exposed ITAMs in CD3δ and CD3γ are not highly phosphorylated by Lck before antigen stimulation.
Fig. 1.
Different membrane binding properties of CD3 signaling proteins. (A) The protein sequences of human CD3ε, CD3ζ, CD3δ, and CD3γ cytoplasmic domains. BRS, PRS, and ITAM were highlighted by cyan, yellow, and green, respectively. (B−E) The membrane binding of cytoplasmic domain of each CD3 chain was measured by dequenching FRET in the context of KIR2DL3-CD3CD-mTFP constructs. The FRET donor was the mTFP fused to the C terminus of the CD3 cytoplasmic domain, and the FRET acceptor was R18 dye inserted into the plasma membrane. The dileucine motif in CD3δ or CD3γ was mutated to alanine to avoid protein down-regulation. The short linker construct, 3 amino acid (a.a.)-mTFP, served as the positive control. (B) The FRET efficiency. Jurkat cells with different constructs were sorted to have matched mTFP level. The (C) surface R18 staining level and (D) photobleaching efficiency for Jurkat cells with different CD3 constructs were comparable. Each dot represents the value from one cell; n = 24, 22, 27, 20, and 19 for 3a.a.-mTFP, hCD3εCD-mTFP, hCD3ζCD-mTFP, hCD3δCD (LL-AA)-mTFP, and hCD3γCD (LL-AA)-mTFP, respectively. The result was a representative of two independent experiments. Error bars represent mean ± SD. P values were determined by the one-way ANOVA with Tukey's multiple comparisons test; n.s., not significant; ****P < 0.0001; **P < 0.01. (E) Representative pictures of each construct. (Scale bar, 5 μm.)
Fig. S1.
Membrane binding properties of CD3 signaling proteins in native TCR−CD3 complex. Membrane binding properties of cytoplasmic domains of CD3ε, CD3δ, and CD3γ chains in native TCR−CD3 complex were measured by dequenching FRET. The FRET donor was the mTFP fused to the C terminus of CD3 cytoplasmic domain, and the FRET acceptor was R18 dye inserted into the plasma membrane. (A) The FRET efficiency. The (B) surface mTFP level and (C) surface R18 staining level and (D) photobleaching efficiency of 293FT cells with different CD3 constructs were comparable. Each dot represents the value from one cell; n = 35, 28, and 31 for hCD3εCD-mTFP, hCD3δCD-mTFP, and hCD3γCD-mTFP, respectively. The result was a representative of five independent experiments. (Scale bar, 7.5 μm.) Error bars represent mean ± SD. P values were determined by the one-way ANOVA with Tukey's multiple comparisons test; n.s., not significant; ****P < 0.0001. (E) Representative pictures of each CD3 construct.
Lck Is Highly Selective on Different CD3 Signaling Proteins.
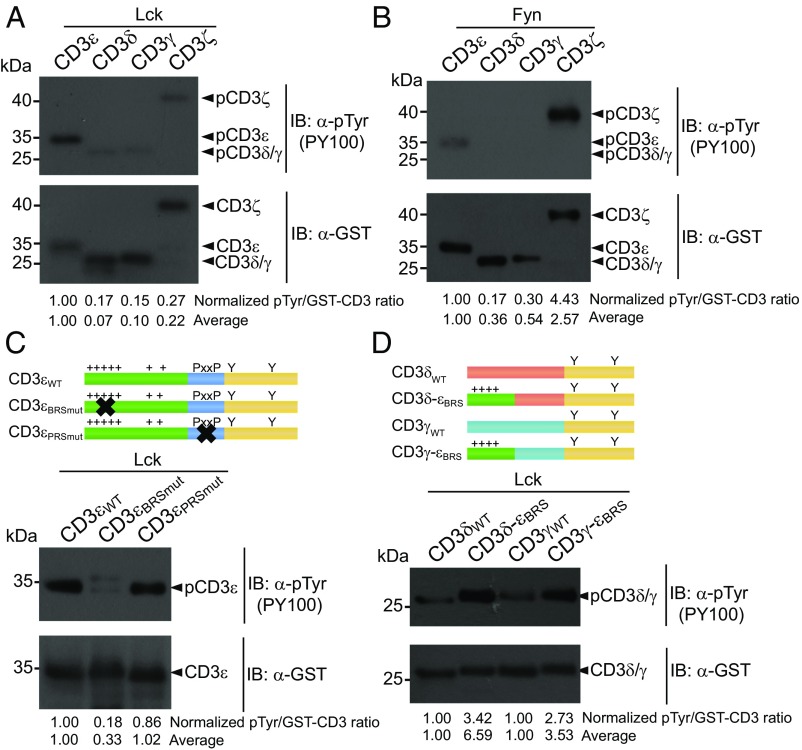
We next set up an in vitro phosphorylation (IVP) assay to test the phosphorylation efficiency of Lck on individual GST-CD3CD-His fusion protein. Under the same condition, CD3ε was strongly phosphorylated and CD3ζ was modestly phosphorylated. However, CD3δ and CD3γ were barely phosphorylated by Lck (Fig. 2A). The phosphorylation efficiency of different CD3 chains is thus highly correlated with CD3 charge property. Intriguingly, Fyn didn’t show the same selectivity as Lck. CD3ζ appeared to be a better substrate for Fyn than CD3ε (Fig. 2B). CD3δ and CD3γ again were barely phosphorylated by Fyn.
Fig. 2.
Lck was highly selective on different CD3 chains. (A and B). Purified GST-CD3CD-His protein was phosphorylated by (A) Lck or (B) Fyn in an IVP assay. (C) BRS-mutated CD3εBRSmut mutant and PRS-mutated CD3εPRSmut mutant were generated and subjected for Lck phosphorylation. (D) The nine N-terminal residues in CD3δ or CD3γ were replaced by CD3ε BRS, and the mutants were compared with WT proteins in the IVP assay. The bands were quantitated by ImageJ. The pTyr signal of CD3 peptide was divided by the corresponding GST-CD3 signal. The pTyr/GST-CD3 value of different CD3 peptides was further normalized to (A−C) that of CD3ε or to (D) that of CD3δ/CD3γ WT. Average represents the average value of three independent experiments.
To study why CD3ε was the best substrate of Lck, we generated two CD3ε mutants, CD3εBRSmut and CD3εPRSmut. In CD3εBRSmut, the first six basic residues in BRS were mutated to serines. In CD3εPRSmut, proline residues in PRS were mutated to alanines. The IVP result showed that BRS mutation significantly impaired CD3ε phosphorylation, whereas PRS mutant only had a minor effect (Fig. 2C). To further test the importance of BRS, we used the CD3ε BRS (SKNRKAKAK) to replace the nine N-terminal residues in CD3δCD and CD3γCD to generate CD3δ-εBRS and CD3γ-εBRS mutants. The phosphorylation efficiency of both mutants was largely increased (Fig. 2D). These data together highlighted the importance of BRS in the Lck-mediated CD3 phosphorylation.
Ionic Interactions Determine the Substrate Selectivity of Lck.
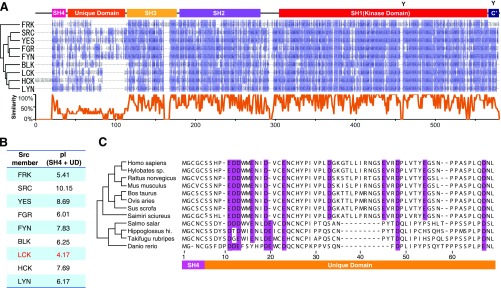
We analyzed the protein sequence of Lck and found that its UD domain is enriched of acidic residues, carrying −8 charges at neutral pH (Fig. S2). These acidic residues are highly conserved across different species. Because Lck favored the substrate with positive charge, we proposed that the ionic interaction between acidic Lck UD and basic CD3ε BRS might play an important role in the substrate selectivity of Lck.
Fig. S2.
Protein sequences of Src kinase family members. (A) The homological structural domains and amino acid sequence alignment among human Src family members. Src family members contain four regulatory domains and one kinase domain. Their sequences are highly conserved, except the UD. The bottom curves showed the degree of amino acid conservation. (B) The pI values of the N-terminal regions (SH4 + UD) of the Src family members. Lck has the lowest pI, i.e., the highest enrichment of acidic residues. (C) Sequence alignment of Lck SH4 + UD from different species. Acidic residues are highlighted by purple.
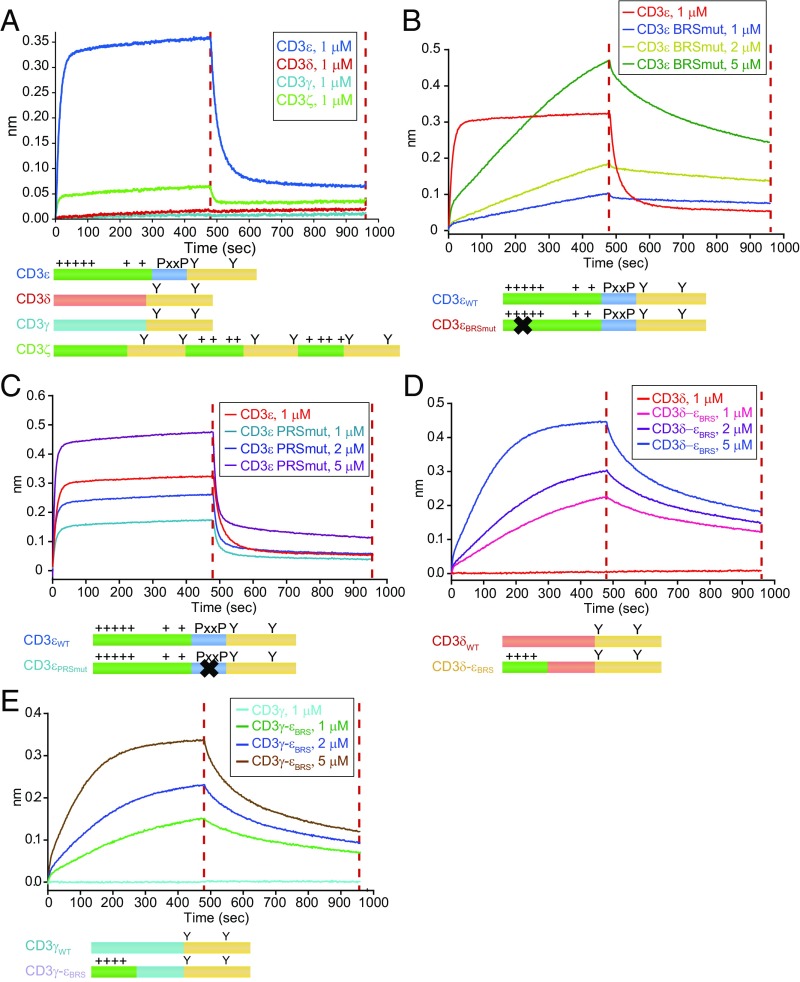
To test this proposal, we set up a biolayer interferometry (BLI) experiment using the Octet Red 96 system. Human Lck protein containing the UD and SH3 domains (LckUD+SH3) was purified, biotinylated, and immobilized onto streptavidin biosensors. Then, the LckUD+SH3-coated biosensor was immersed into solutions that contained only one kind of CD3 peptide, and then back to blank solution to study the reaction kinetics and thermodynamics. The association and dissociation curves indicated that LckUD+SH3 showed a stronger binding with CD3ε than with CD3ζ. Nearly no Lck binding was observed for CD3δ or CD3γ (Fig. 3A). This result agreed well with the IVP data in Fig. 2A. Mutating CD3ε BRS not only impaired the binding strength but also slowed down the binding kinetics (Fig. 3B), whereas PRS mutation only affected the binding strength (Fig. 3C). Moreover, introducing CD3ε BRS to CD3δ or CD3γ chain led to evident binding to LckUD+SH3 (Fig. 3 D and E), which further demonstrated the importance of BRS in the interaction between Lck kinase and CD3 substrate. We noticed that CD3δ-εBRS and CD3γ-εBRS mutants did not show binding kinetics that were as fast as those of CD3ε and CD3εPRSmut, suggesting that there might be another motif in CD3ε that contributes to fast Lck binding. An earlier study shows that the Lck SH3 domain can bind to an RKxxYxxY motif in a proline-independent manner (20). The RKxxxxxY motif in CD3ε ITAM region thus might be another motif contributing to the fast binding with Lck.
Fig. 3.
CD3 interaction with the Lck UD−SH3 domain. The molecular interaction between different CD3 chains and Lck was measured by BLI. (A) Binding of LckUD+SH3 to CD3εCD, CD3δCD, CD3γCD, or CD3ζCD. (B) Binding of LckUD+SH3 to CD3εWT or varying concentrations of CD3εBRSmut. (C) Binding of LckUD+SH3 to CD3εWT or varying concentrations of CD3εPRSmut. (D) Binding of LckUD+SH3 to CD3δWT or varying concentrations of CD3δ-εBRS. (E) Binding of LckUD+SH3 to CD3γWT or varying concentrations of CD3γ-εBRS. These results are representative of three independent experiments.
The above molecular interaction data (Fig. 3) and the phosphorylation data (Fig. 2) together showed that CD3ε BRS played a more important role than PRS in interacting with Lck to result in efficient phosphorylation.
Determination of the Binding Sites for CD3ε–Lck Interaction.
To define the CD3ε−Lck interface at atomic resolution, we performed a series of NMR experiments. We first made backbone chemical shift assignments for CD3εCD residues and LckUD+SH3 residues by standard triple-resonance experiments, and then performed titration experiments to map the key residues involved in CD3ε−Lck interaction.
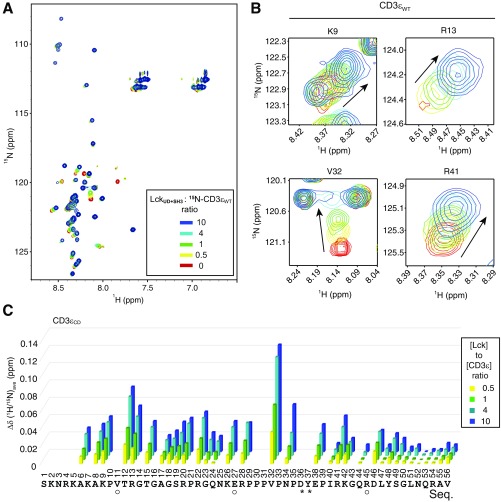
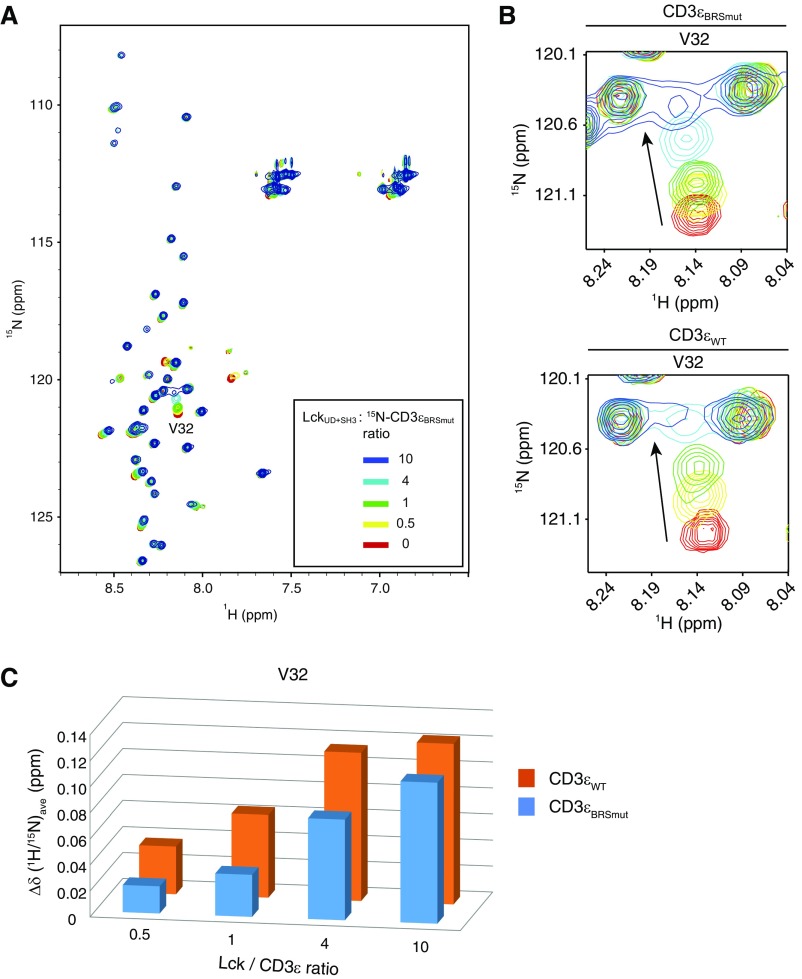
The 15N-labeled CD3εCD WT was titrated by unlabeled LckUD+SH3 with molar ratios ranging from 0 to 10, and the resonances of CD3εCD residues were traced in 15N-1H heteronuclear single-quantum coherence (HSQC) spectra (Fig. S3A). Substantial changes in chemical shifts were observed for most of the regions in CD3εCD except the C-terminal region (Fig. S3 B and C). Furthermore, some residues showed a large decrease of intensity after titration. These changing residues were likely to be involved in CD3ε−Lck interaction. It has been reported that the Lck SH3 domain directly interacts with PRS and the RKxxYxxY motif (20); therefore, the chemical shift and intensity changes in the PRS and the first half of the ITAM of CD3ε might be caused by their direct interaction with the Lck SH3 domain. Interestingly, we found that the interaction between CD3ε PRS and Lck SH3 was also dependent on CD3ε BRS. Mutating BRS residues made PRS residues less vulnerable to LckUD+SH3 titration (Fig. S4).
Fig. S3.
The 15N-labeled CD3εCD NMR signals in response to LckUD+SH3 titration. (A) HSQC spectra of 15N-labeled CD3εCD were recorded under the titration of unlabeled LckUD+SH3. The molar ratio of Lck/CD3ε was 0 to 10. (B) Representative residues from BRS, PRS, and ITAM. (C) A bar graph showing the resonance changes of CD3εCD residues caused by Lck titration. Some residues were left blank either because we were unable to detect them (such as prolines), or they were unassigned, or due to peak overlapping. The residues with peak overlapping are indicated by “O” symbols. Asterisks indicate peak broadening caused by the Lck titration.
Fig. S4.
The 15N-labeled CD3εBRSmut NMR signals in response to LckUD+SH3 titration. (A) HSQC spectra of 15N-labeled CD3εBRSmut were recorded under the titration of unlabeled LckUD+SH3. The molar ratio of Lck/CD3ε was 0 to 10. (B) One representative PRS residue V32 of CD3εBRSmut or CD3εWT. (C) A bar graph showing the resonance changes of V32 in CD3εBRSmut (cyan) or CD3εWT (orange) caused by Lck titration.
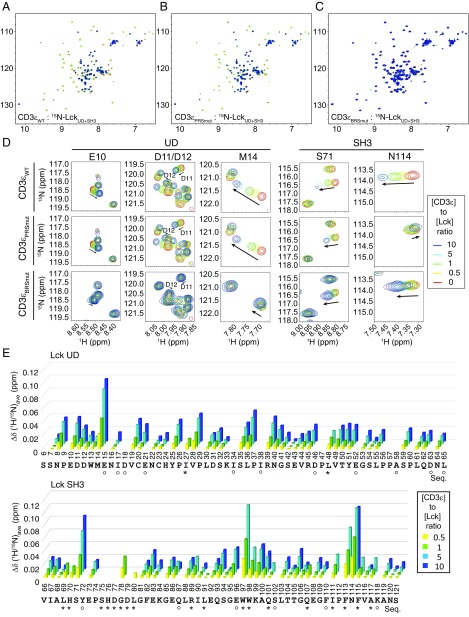
To further map the CD3ε−Lck interface, we titrated 15N-labeled Lck UD+SH3 by unlabeled CD3εCD WT or mutants. As expected, both the Lck UD and SH3 domains showed systematic changes in chemical shift signals and peak intensities under CD3εCD WT titration (Fig. 4 A, D, and E). We identified E10 to E15 in the UD domain (distal to the coreceptor binding site), and S71 to L80, Q93 to Q101, and I111 to A117 in the SH3 domain as the most affected regions under CD3εCD WT titration (Fig. 4E). We further used unlabeled CD3εBRSmut or CD3εPRSmut peptide to titrate 15N-labeled LckUD−SH3 (Fig. 4 B and C). Clearly, PRS mutation strongly abolished the chemical shift changes of residues in the SH3 domain but did not affect the changes of residues in UD, which confirmed the interaction between the CD3ε PRS and Lck SH3 domains (Fig. 4 B and D). Differently, BRS mutation not only strongly abrogated the chemical shift changes of residues in UD but also largely influenced the changes of residues in the SH3 domain (Fig. 4 C and D). This result strongly suggests that CD3ε BRS directly interacts with Lck UD and promotes the interaction between CD3ε PRS and Lck SH3.
Fig. 4.
The 15N-labeled LckUD+SH3 NMR signals in response to CD3εCD titration. (A−C) HSQC spectra of 15N-labeled LckUD+SH3 titrated by (A) CD3εWT, (B) CD3εBRSmut, or (C) CD3εPRSmut. The molar ratio of CD3ε/Lck was 0 to 10. (D) Representative residues from Lck UD and SH3. (E) A bar graph showing the resonance changes of Lck residues caused by CD3ε titration. Some residues were left blank because we were unable to detect them (such as prolines), or they were unassigned (such as S6, H24, K33, and K84), or due to peak overlapping. The residues with peak overlapping are indicated by “O” symbols. Asterisks indicate peak broadening caused by the CD3ε titration.
The above NMR experiments further confirmed the importance of CD3ε BRS in interacting with Lck.
CD3ε Helps the Phosphorylation of Other CD3 Chains.
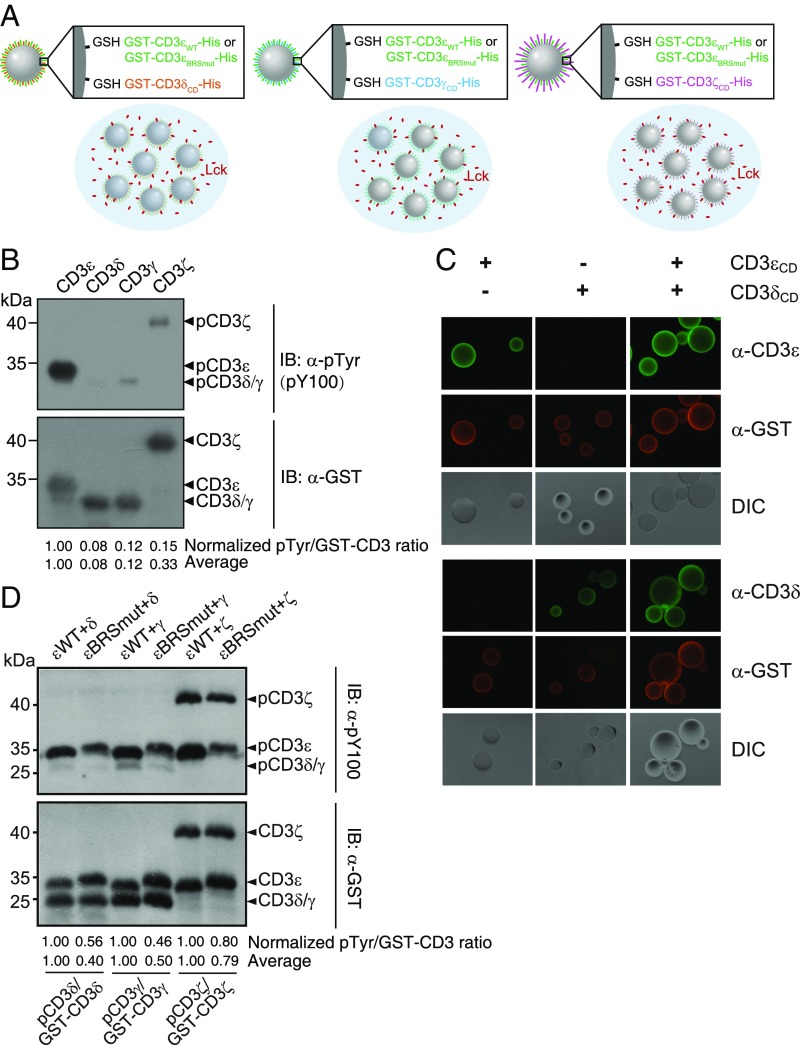
In the TCR complex, the four subunits are assembled together by strong ionic interactions in the transmembrane domains and other interactions in the extracellular domains (40–42). The cytoplasmic domains of CD3 chains are therefore proximal to each other within the complex. The specific interaction between CD3ε and Lck should recruit the kinase to the TCR complex to facilitate the phosphorylation of other CD3 chains. To test this proposal, we set up an on-bead phosphorylation assay to test the help effect of CD3ε.
In this assay, we coated GST-tagged CD3 chain on glutathione bead and incubated the bead with Lck solution to mimic the phosphorylation process of membrane-anchored CD3 chain by free Lck (Fig. 5A). The selectivity of Lck on anchored CD3 chains was the same as the result observed in the IVP assay in which both CD3 and Lck were in solution (Fig. 5B). We further performed the cocoating experiment. CD3ε WT or CD3εBRSmut was coated together with another CD3 chain, i.e., CD3δ, CD3γ, or CD3ζ, and then subjected to Lck phosphorylation. Immunostaining showed that CD3ε was evenly mixed with the other CD3 chain on the bead (Fig. 5C). The phosphorylation level of CD3δ, CD3γ, or CD3ζ was much higher under the condition of CD3ε WT cocoating (Fig. 5D). It is thus evident that the ionic interaction between CD3ε BRS and the Lck UD domain could significantly increase the phosphorylation level of other CD3 chains.
Fig. 5.
Recruitment of Lck by CD3ε helped the phosphorylation of other CD3 subunits. (A) Schematic illustration of the on-bead kinase assay. GST-CD3εCD WT-His or GST-CD3εCD BRSmut-His was coated together with another GST-tagged CD3 chain onto GST beads at the molar ratio of 1:1. (B) Comparison of phosphorylation level of CD3ε, CD3δ, CD3γ, and CD3ζ on beads. (C) The α-CD3 and α-GST staining to show the well mixture of different CD3 proteins on the bead. (D) Comparison of phosphorylation level of CD3δ, CD3γ, and CD3ζ in the presence of CD3εWT or CD3εBRSmut. The bands were quantitated by ImageJ. The pTyr signal of CD3 peptide was divided by the corresponding GST-CD3 signal. In B, the pTyr/GST-CD3 value of different CD3 peptides was further normalized to that of CD3ε. In D, the pTyr/GST-CD3 value under the CD3εBRS mutant condition was normalized to that under the CD3εWT condition. Average represents the average value of three independent experiments.
Ionic CD3ε−Lck Interaction Controls TCR Phosphorylation.
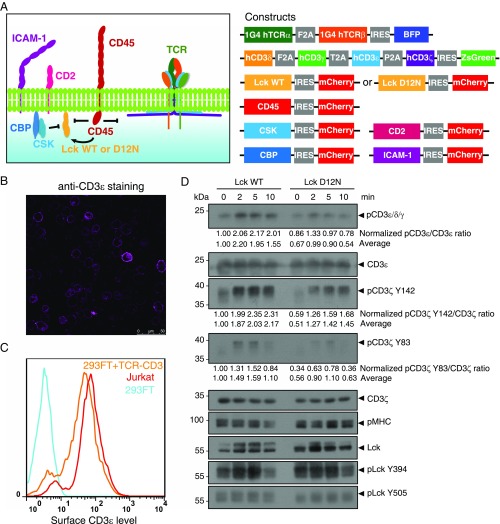
We further studied the role of ionic CD3ε−Lck interaction in the intact TCR complex. In T cells, TCR phosphorylation is not only regulated by Lck but also affected by feedback regulations from downstream signaling molecules, thus making it difficult to explicitly address the contribution of CD3ε−Lck interaction in the initiation of TCR phosphorylation. To preserve the essential elements of initial TCR phosphorylation but leave out other downstream molecules, we take the advantage of previously reported TCR reconstitution system (43) (Fig. 6A).
Fig. 6.
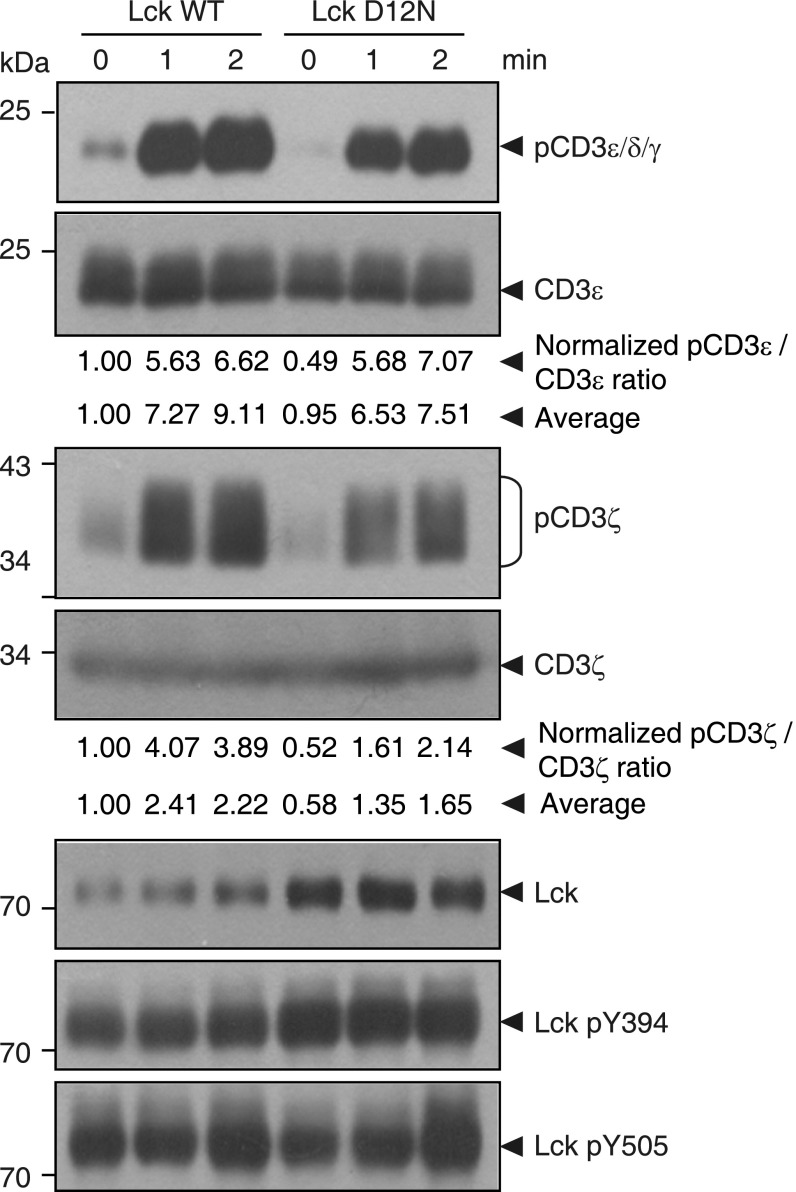
Mutating CD3ε−Lck interface residue significantly attenuated TCR phosphorylation upon antigen stimulation. (A) The 1G4 TCR−CD3 complex and Lck WT or Mutant (D12N), as well as other essential proteins for initial TCR phosphorylation (CD45, CSK, CBP, CD2, and ICAM-1) into HEK293FT cells as previously described (43). Raji cells expressing MHC I loaded with the cognate ESO9V antigen served as antigen-presenting cells (APCs) (43). (B) The α-CD3 (UCHT1) staining and confocal imaging showed the successful surface expression of TCR in HEK293FT cells. (Scale bar, 50 μm.) (C) Flow cytometry (FACS) analysis showed that the TCR surface level of the reconstituted HEK293FT cells was similar to that of Jurkat T cells. (D) HEK293FT-1G4TCR cells and Raji-pMHC cells were mixed at 1:1 ratio. TCR stimulation was stopped at indicated time points, and cells were lysed for Western blot analysis. The bands were quantitated by ImageJ. The pCD3ε/CD3ε, pCD3ζ Y142/CD3ζ, and pCD3ζ Y83/CD3ζ ratios were obtained and further normalized to the value of 0 min of Lck WT condition. Average represents the average value of four independent experiments.
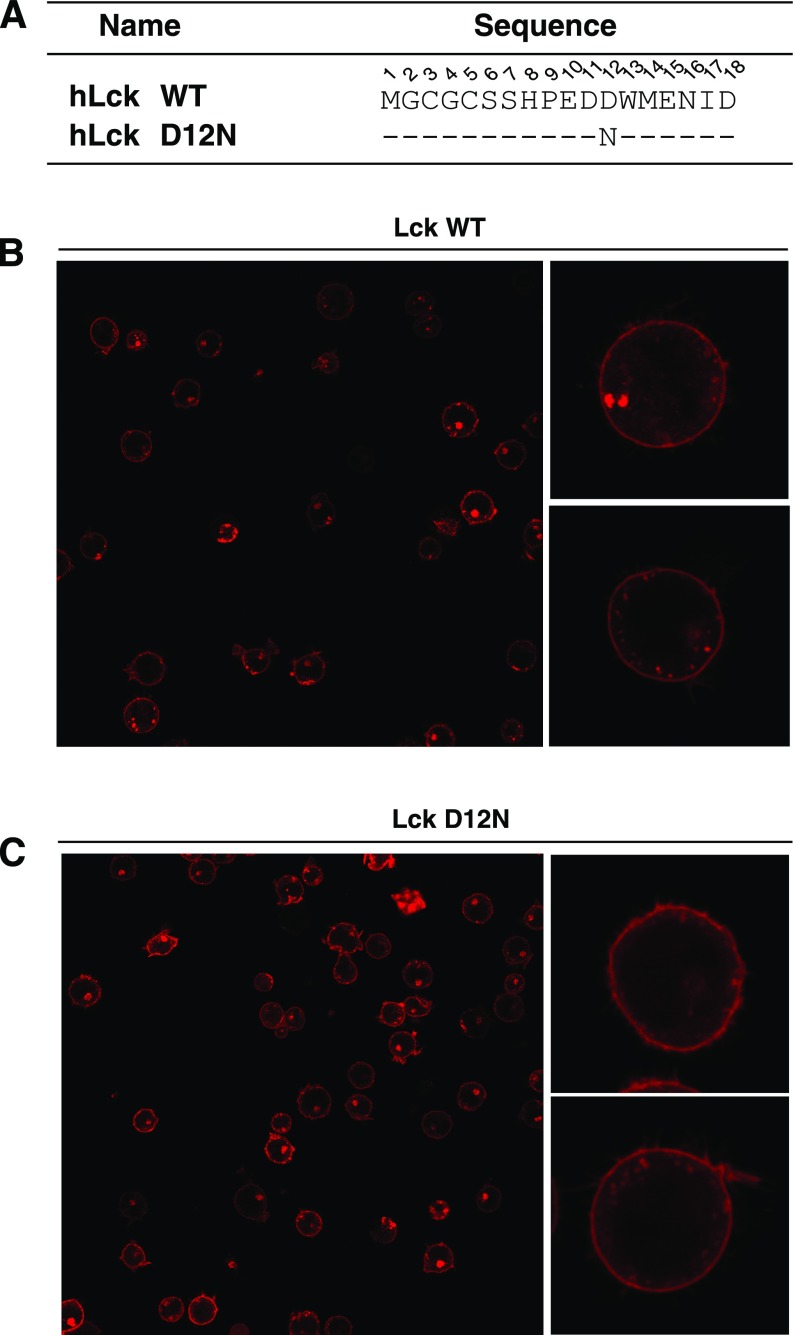
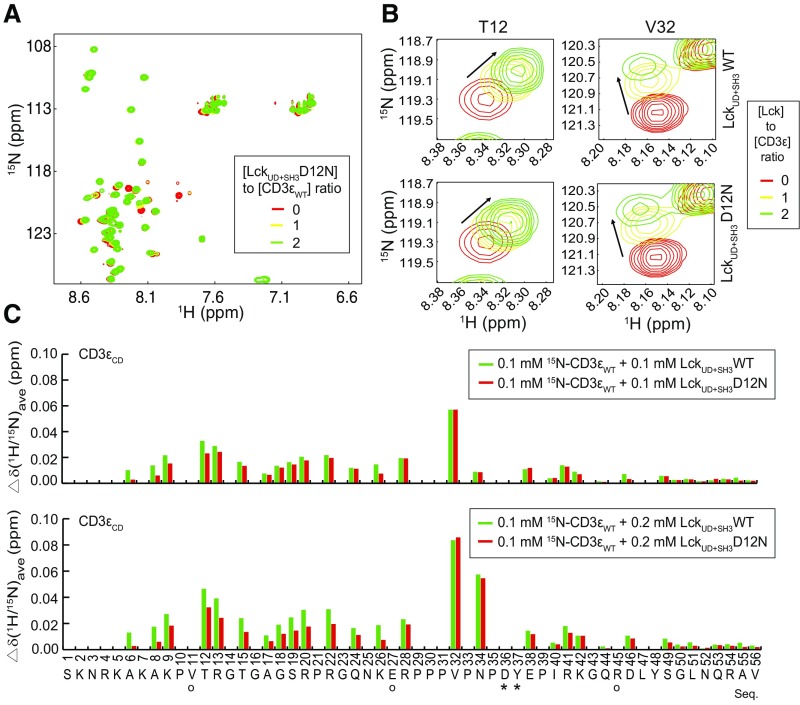
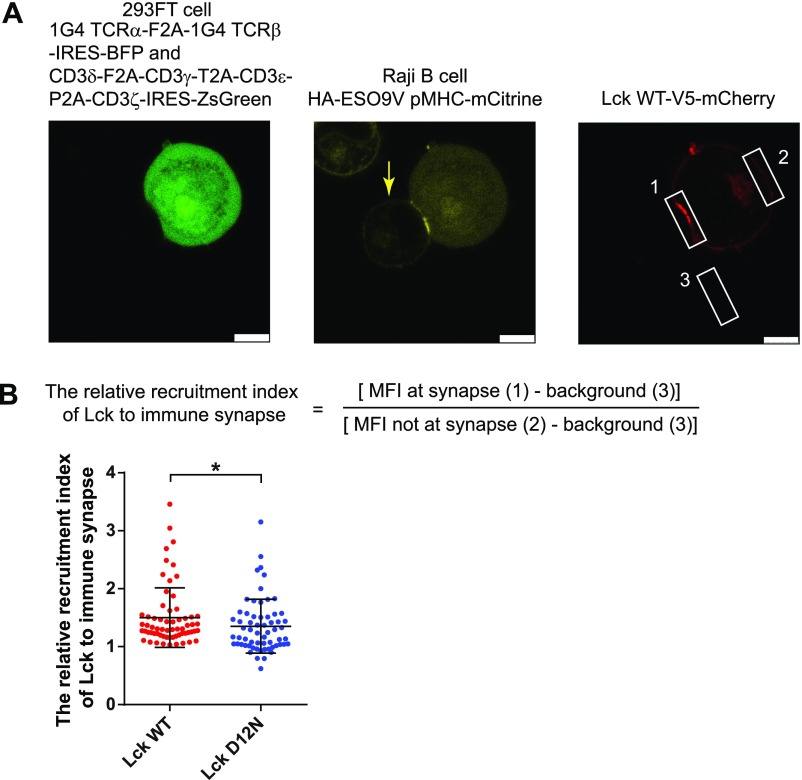
The 1G4 TCR complex was stably reconstituted into HEK293FT cells and stably expressed on the surface at the physiological level (Fig. 6 B and C). Lck and its direct regulators were then transiently transfected. This system enabled the investigation of Lck-mediated TCR phosphorylation without the influences of downstream feedback regulations. Mutation of CD3ε BRS significantly impaired the TCR surface level, which is consistent with previous reports (32, 34). Therefore, we generated an Lck mutant with the acidic residue D12 mutated to asparagine that can be normally expressed and had normal membrane localization similar to that of the WT Lck (Fig. S5). Moreover, NMR titration experiments show that Lck D12N had impaired binding with CD3ε, especially with the BRS region of CD3ε (Fig. S6). We then used either peptide−major histocompatibility complex (pMHC) presented by B cells or stimulating antibody OKT3 to trigger the reconstituted TCR in HEK293FT cells. The phosphorylation levels of tyrosine 394 and 505 in Lck WT or Lck D12N mutant were comparable at 0 min, indicating that the kinase activity of Lck is not affected by the mutation (Fig. 6D). However, compared with Lck WT, Lck D12N mutant showed impaired ability to phosphorylate TCR (Fig. 6D and Fig. S7), which further supports the notion that the ionic CD3ε−Lck interaction plays a crucial role in initiating TCR phosphorylation. Consistently, the recruitment of Lck D12N to the TCR−pMHC contact area was also impaired (Fig. S8).
Fig. S5.
D12N mutation did not affect the cellular location of hLck. (A) The amino acid sequences of the N terminus of hLck WT and D12N mutant. (B and C) The cellular location of (B) hLck WT and (C) D12N mutant fused with a C-terminal mCherry in transfected Lck-deficient Jurkat T cells (JCaM 1.6).
Fig. S6.
The 15N-labeled CD3εCD NMR signals in response to LckUD+SH3 titration. (A) HSQC spectra of 15N-labeled CD3εCD were recorded under the titration of unlabeled LckUD+SH3 D12N mutant. The molar ratio of LckUD+SH3 D12N /CD3εCD was 0, 1, and 2. (B) Representative residues from CD3ε BRS (T12) and PRS (V32) regions in response to LckUD+SH3 WT or D12N mutant titration. (C) A bar graph showing the resonance changes of CD3εCD residues caused by LckUD+SH3 WT (green) and D12N mutant (red) titration. Some residues were left blank either because we were unable to detect them (such as prolines), or they were unassigned, or due to peak overlapping. The residues with peak overlapping are indicated by “O” symbols. Asterisks indicate peak broadening caused by the Lck titration.
Fig. S7.
CD3ε−Lck interaction was crucial for total TCR phosphorylation. HEK293FT cells with 1G4 TCR and Lck WT or Lck D12N mutant expression were stimulated by α-CD3 antibody (OKT3, eBioscience) for the indicated time, and then cells were lysed for Western blot analysis. Lck had a C-terminal mCherry tag, so it migrated at 70 kDa. The bands were quantitated by ImageJ. The pCD3ε/CD3ε and pCD3ζ/CD3ζ ratios were obtained and further normalized to the value of 0 min of Lck WT condition. Average represents the average value of three independent experiments.
Fig. S8.
Recruitment of Lck D12N to the TCR−pMHC interaction site was impaired. (A) Representative images showing the 293FT-Raji conjugations and Lck recruitment to the TCR−pMHC contact site. Please note that mCitrine imaging had bleed-through signal from ZsGreen so that 293FT cells were also visible (Middle). Open white squares represent the regions that were selected for mCherry fluorescence intensity analysis. (Scale bar: 7.5 μm.) (B) (Upper) The calculation equation for the relative recruitment index of Lck to immune synapse. (Lower) The recruitment data for Lck WT and D12N mutant.
Discussion
Antigen-induced TCR phosphorylation is the first signaling event in T cells to trigger T-cell immune responses. The 10 ITAMs, i.e., 20 tyrosine residues, in a single TCR−CD3 complex enables a wide variety of TCR phosphorylation programs to induce distinct downstream signaling pathways in response to different antigen stimulations. How the 10 ITAMs of TCR are phosphorylated by Lck kinase is largely unknown. Moreover, why TCR can have distinct phosphorylation programs also remains elusive. In this study, we find a key mechanism that regulates the initiation of TCR phosphorylation. The basic BRS in CD3ε can ionically interact with the acidic UD in Lck to recruit the kinase and initiate the phosphorylation of all CD3 chains. The exposure level of CD3ε BRS upon antigen engagement might determine the final phosphorylation program of TCR to induce specific downstream signaling.
The BRS motif is present in both CD3ε and CD3ζ. CD3ε BRS is directly after the transmembrane domain, whereas CD3ζ BRS motifs are in between ITAMs and distal to the transmembrane domain. In addition to BRS, CD3ε also has PRS that is not present in other CD3 chains. Lck has four regulatory domains: SH4, UD, SH3, and SH2. Compared with CD3ζ, it is more spatially favorable for CD3ε to interact with Lck on multiple sites. The N-terminal CD3ε BRS can ionically interact with the N-terminal Lck UD, and, simultaneously, CD3ε PRS and the first half of ITAM can interact with the Lck SH3 domain (Fig. S9). Our BLI and NMR experiments showed that BRS−UD interaction was more dominant than PRS−SH3 interaction (Figs. 3 and 4 and Figs. S3 and S4). Fig. 2 also supported the notion that CD3ε BRS is functionally more important than PRS in mediating CD3 phosphorylation. Note that the interaction between ITAM and Lck kinase is also important for determining CD3 phosphorylation (26).
Fig. S9.
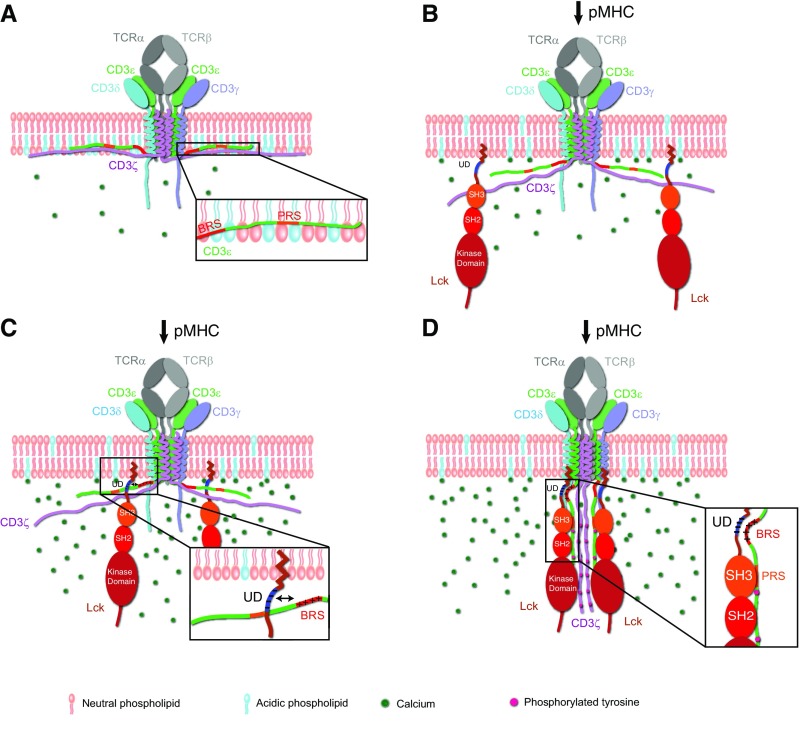
CD3ε BRS serves as an important regulator of the initiation of TCR signaling. (A) At the quiescent stage, the cytoplasmic domains of CD3ε and CD3ζ bind to the inner leaflet of the plasma membrane, whereas the cytoplasmic domains of CD3δ and CD3γ float in the cytosol. However, CD3δ and CD3γ are not able to independently recruit Lck to initiate TCR phosphorylation. (B) After antigen engagement, the cytoplasmic domains of CD3ε and CD3ζ dissociate from the plasma membrane, and CD3ε BRS becomes exposed. (C) The ionic CD3ε−Lck interaction recruits Lck to the proximal of the TCR−CD3 complex to exert its function. (D) Lck phosphorylates all CD3 chains.
The physiological importance of CD3ε BRS has been fully demonstrated by transgenic and retrogenic mouse models (32, 34, 44). Truncation of CD3εCD led to the block of early thymocyte maturation at double-negative-3 stage, whereas truncation of both CD3δCD and CD3γCD did not cause such a defect. CD3ε mutant that has intact BRS but truncated PRS and ITAM is sufficient to support successful double-negative to double-positive thymocyte differentiation and single-positive thymocyte production (44). Furthermore, mutating CD3ε BRS significantly impaired the thymocyte differentiation, TCR signaling, and TCR surface expression level (32, 34). Our finding of the key role of CD3ε BRS in initiating TCR phosphorylation can explain these strong phenotypes observed in previous animal studies.
Another role of CD3ε BRS is to bind acidic phospholipids (35, 45). Previous studies show that the addition of acidic phospholipids can fully abolish CD3ε phosphorylation mediated by Lck (35). In resting T cells, despite the presence of active Lck molecules, CD3ε BRS mainly binds to the plasma membrane, which leads to the sequestration of the whole CD3ε cytoplasmic domain within the membrane (35). These findings strongly suggest that acidic phospholipids should have stronger binding with CD3ε BRS than does Lck. BRS−lipid interaction not only sequesters the ITAM of CD3ε chain within the membrane but more importantly also prevents CD3ε−Lck interaction, which therefore prevents the spontaneous phosphorylation of all CD3 chains, especially the ITAMs of CD3δ and CD3γ that are fully exposed in the cytosol. Such a safety control mechanism can keep TCR molecules at low basal activity before antigen engagement. In activated T cells, several factors can trigger the dissociation of the CD3ε cytoplasmic domain from the membrane at different signaling stages (36, 38, 39). At the initial antigen stimulation stage, it is likely that antigen-induced allosteric regulation and/or mechanical force could dislodge the CD3ε cytoplasmic domain from the membrane, and antigens with different TCR affinities could cause different exposure levels of the CD3ε cytoplasmic domain. Indeed, it has been shown that strong antigen but not weak antigen can induce the exposure of CD3ε PRS to recruit Nck (46, 47). At the later signal amplification and sustainment stages, Ca2+ can directly bind to the phosphate groups of acidic phospholipids to neutralize their negative charges, which therefore disrupts CD3ε−lipid interaction. Strong antigen can elicit a higher level of Ca2+ influx than weak antigen (48, 49) and therefore should cause a higher exposure level of the CD3ε cytoplasmic domain. Therefore, either at the initial or later TCR signaling stage, the exposure level of the CD3ε cytoplasmic domain, including the key BRS, should be different in response to different antigen stimulations. Given the central role of CD3ε BRS in interacting with Lck, different exposure levels of CD3ε BRS can directly control the recruitment level of Lck. The final TCR phosphorylation program of 20 tyrosines is then determined by Lck, CD45, Zap70, and other regulatory factors (43, 50–56).
In summary, here we report a key mechanism of the initiation of TCR phosphorylation. The BRS motif of CD3ε can recruit Lck via ionic interactions to initiate TCR phosphorylation. Given the central role of CD3ε BRS in TCR signaling, its exposure level in response to different antigen stimulations may serve as a key regulator of antigen-specific immune responses. Membrane-proximal BRS has been also found in many other immunoreceptors, such as CD28, CD19, and IL-10R. Indeed, CD28-BRS is required for efficient Lck interaction (57). We anticipate that the mechanism identified here might have a general application in immunoreceptor signaling.
Materials and Methods
Cells and Reagents.
The cells and reagents are described in SI Materials and Methods.
Live-Cell FRET Measurement.
Live-cell FRET was performed as previously described (35). Details of the experimental procedure are described in SI Materials and Methods.
IVP Assay.
Soluble or bead-coated CD3 peptides were incubated with Lck or Fyn in a 50-μL reaction volume at 30 °C for 30 min; the tyrosine-phosphorylated and total protein levels were detected by Western Blot. Details of the experimental procedure are described in SI Materials and Methods.
NMR Experiments.
All NMR spectra were acquired at 25 °C on Bruker Ascend 600 MHz with cryoprobe. Details of the experimental procedure are described in SI Materials and Methods.
TCR Stimulation in Reconstituted TCR−CD3−Lck Cells.
HEK-1G4 cells and APCs (Raji cells) were generated as previously described (43). For APC triggering, HEK-1G4 cells and APCs were mixed together and incubated in a 37 °C water bath to trigger TCR phosphorylation. For OKT3 triggering, HEK-1G4 cells were stimulated by 5 μg/mL of OKT3 in a 37 °C water bath to trigger TCR phosphorylation. Details of the experimental procedure are described in SI Materials and Methods.
SI Materials and Methods
Cells and Reagents.
The 293FT and Jurkat cells were obtained from Cell Bank of Chinese Academy of Sciences, and they have no mycoplasma contamination. RPMI 1640 and Octadecyl Rhodamine B Chloride (R18) were from Life Technologies. The GST-affinity column was from Sigma, and the Nickel-affinity column was from QIAGEN. Lck kinase was from Millipore. Fyn kinase was from Thermo Fisher. Anti–p-Tyr-100, anti-Rabbit IgG-HRP, anti-Mouse IgG-HRP and anti–p-Lck (Tyr505) antibodies were from Cell Signaling Company. Anti-GST (Z5), anti-Lck (3A5), anti–p-Lck (Tyr394), anti–p-CD3ζ (C415.9A) and anti-CD3ζ (6B10.2) were from Santa Cruz Biotechnology. Anti-CD3ε [EPR5361(2)], anti–p-CD3ζ (Tyr83) [EP776(2)Y], and anti–p-CD3ζ (Tyr142) [EP265(2)Y] were from Epitomics Inc. (now an Abcam company). UCHT1 and OKT3 antibodies were from eBioscience. Isotopes for NMR experiments were from Cambridge Isotope Laboratories.
Live-Cell FRET Measurement.
FRET measurement of KIR2DL3-CD3CD-mTFP construct in Jurkat T cells.
To study the membrane binding of CD3 cytoplasmic domains in live T cells, we used the membrane protein FRET system reported previously (35). We first made chimera constructs for FRET measurement. The cytoplasmic domain of each human CD3 chain with a C-terminal mTFP was fused after the transmembrane domain of a single span membrane receptor KIR2DL3. The dileucine motif of hCD3δ or hCD3γ was mutated to alanines to avoid endocytosis. Constructs were transduced into human Jurkat cells by lentiviral infection, and stable cell clones expressing matched mTFP fluorescence were sorted by FACS. For FRET experiments, 1 million transduced Jurkat cells were resuspended in 1 mL of Ringer’s buffer (155 mM NaCl, 4.5 mM KCl, 10 mM d-glucose, 10 mM Hepes, 2 mM CaCl2, 1 mM MgCl2, pH 7.4). A 300-μL aliquot was pipetted onto the center of a 35-mm glass-bottom dish (Shengyou Biotechnology), and cells were allowed to adhere for 5 min at room temperature. To label the plasma membrane, 3 μL of 250 μg/mL of octadecyl rhodamine B (R18) (Invitrogen) was added into the dish, mixed equally with the cell suspension. The staining time was 10 min at room temperature. The dish was then mounted onto a Leica TCS SP5 confocal microscope for imaging. The FRET efficiency between mTFP (donor) and R18 (acceptor) was measured by the dequenching method, directed by the FRET Acceptor Photobleaching (FRET AB) wizard in the Leica AF controlling software. The mTFP was excited with the Argon 458-nm laser line (laser power: 44%) and visualized by PMT1 (Gain: 700 V; Offset: −1.6%) using a detection window at 470 nm to 550 nm. R18 was excited with the Helium/Neon 561-nm laser line (laser power: 16%) and visualized by PMT2 (Gain: 700 V; Offset: −1.03%) using a detection window at 570 nm to 650 nm. When performing the photobleaching, we illuminated the chosen cell with 100% power of a 561-nm laser for 10 frames, which could cause more than 96% photobleaching efficiency. Usually, we did FRET measurements for five cells per dish, and at least 15 cells were measured for each group.
Based on R18 and TFP signals, we chose the plasma membrane regions that had clear separation with the intracellular TFP puncta, using Leica AF controlling software. Typically, we selected most of the plasma membrane region for one cell. The FRET efficiency was calculated following this equation: FRET Efficiency = [DonorAfter -DonorBefore]/[DonorAfter], in which DonorBefore and DonorAfter represented the fluorescence intensity of mTFP before and after the photobleaching, respectively. We chose the cells with matched R18 level and photobleaching efficiency to compare their FRET efficiencies.
FRET measurement of CD3CD in native TCR−CD3 complex reconstituted in 293FT cells.
To measure CD3CD membrane binding in TCR−CD3 complex, we first transiently transfected 293FT cells with pHAGE-hCD3δ-mTFP-F2A-hCD3γ-T2A-hCD3ε-P2A-hCD3ζ and pHAGE-(1G4) hTCRα-F2A-(1G4) hTCRβ-IRES-BFP, or pHAGE-hCD3δ-F2A-hCD3γ-mTFP-T2A-hCD3-P2A-hCD3ζ and pHAGE-(1G4) hTCRα-F2A-(1G4) hTCRβ-IRES-BFP, or pHAGE-hCD3δ-F2A-hCD3γ-T2A-hCD3ε-mTFP-P2A-hCD3ζ and pHAGE-(1G4) hTCRα-F2A-(1G4) hTCRβ-IRES-BFP. Using the same method as described in Live-Cell FRET Measurement, we performed FRET between the native CD3 cytoplasmic domain and the plasma membrane. Because these cells were not gated for a comparable mTFP level as Jurkat T cells, we selected cells with a matched surface mTFP level as well as matched R18 and photobleaching efficiency for data analysis.
Protein Expression and Purification.
The proteins we investigated and purified are as follows: human CD3ε cytoplasmic domain (hCD3εCD) containing human CD3ε 152 to 207 residues, human CD3δ cytoplasmic domain (hCD3δCD) containing human CD3δ 127 to 171 residues, human CD3δ cytoplasmic domain (hCD3γCD) containing human CD3γ 138 to 182 residues, human CD3ζ cytoplasmic domain (hCD3ζCD) containing human CD3ζ 52 to 164 residues, human Lck UD and SH3 domain (hLck UD+SH3) containing human Lck 6 to 121 residues, mouse CD3ε cytoplasmic domain (mCD3εCD, for NMR experiment) containing mouse CD3ε 134 to 189 residues, and mouse Lck UD and SH3 domain (mLck UD+SH3, for NMR experiment) containing mouse Lck 6 to 121 residues.
For the IVP experiment, WT CD3 cytoplasmic domains and mutants were expressed as GST fusion proteins in Escherichia coli, and a His6 tag was present at the C terminus of these GST fusion proteins. The proteins were purified by GST-affinity (Sigma) column first and then nickel-affinity column (Qiagen). For the BLI assay and NMR experiments, CD3 cytoplasmic domain WT/mutant and LckUD+SH3 WT/mutant were also expressed as GST fusion proteins in E. coli, and the GST tag was removed by tobacco etch virus protease cleavage followed by reverse-phase HPLC.
IVP Assay.
GST-hCD3-His was used in the IVP assay; GST tag was used for unbiased measurement of input protein level and avoided the interference of tyrosine phosphorylation. The IVP experiment was set up on ice; 0.5 μM (final concentration) CD3 peptide was added into, finally, 50-μL reaction buffer [final concentration: 0.2 μg⋅mL−1 Lck (Millipore) or Fyn (Thermo Fisher), 65 mM Hepes, pH 7.0, 5 mM MgCl2, 3 μM Na3VO4, 1.25 mM DTT, 150 mM KCl, 0.2 mM ATP]. The reaction was kept at 30 °C for 30 min. For on-bead IVP, CD3 peptides were incubated with 2.5 μL of GST beads (Sigma) in a 25-μL reaction for 10 min on ice. Then the bead solution was mixed with 12.5 μL of 4× kinase reaction buffer and 12.5 μL of dH2O to reach a 50-μL reaction. The final concentration of reaction was: 0.5 μM total CD3 peptide (either one or two CD3 peptides), 0.2 μg⋅mL−1 of Lck (Millipore), 65 mM Hepes, pH 7.0, 5 mM MgCl2, 3 μM Na3VO4, 1.25 mM DTT, 150 mM KCl, 0.2 mM ATP. The reaction system was mildly rotated on a multipurpose shaker and incubated at 30 °C for 30 min. After that, the reaction system was mixed with 12 μL of 5× reducing SDS loading buffer and then boiled for 10 min. Then, the samples were subjected to SDS/PAGE gel for electrophoresis. After that, the proteins on gel were transferred onto PVDF membrane for subsequent immunoblot analysis. The tyrosine-phosphorylated and total protein levels were detected by anti-pY100 and anti-GST primary antibodies, respectively, followed by the corresponding HRP-conjugated secondary antibodies. The signals of specific protein bands were recorded by films, which were then scanned and converted to TIFF figures. The band quantifications were performed with these figures by ImageJ software (National Institutes of Health).
Kinase Used for IVP.
The following kinases were used: Lck, from Millipore, catalog number 14-842; N-terminal His6-Tag, expressed in Sf21 insect cells, size 58 kDa; Fyn from Thermo Fisher, catalog number P3042-10µg; and C-terminal His6-Tag, expressed in insect cells, size 62.7 kDa.
BLI Binding Assay.
Real-time binding assays between hLckUD+SH3 and hCD3CD-His were performed using BLI with an Octet Red 96 instrument (Fortebio). In the BLI experiments, LckUD+SH3 protein was biotinylated by the EZ-Link Sulfo-NHS-LC-Biotinylation kit (catalog no. 21435) from Thermo Scientific. Sulfo-NHS-LC-biotin was conjugated onto target proteins via the reaction between the NHS ester and the primary amino groups (including the N terminus of the protein and primary amines on the sidechain of lysine) on proteins. Briefly, we incubated Lck protein and Sulfo-NHS-LC-biotin at 1:1 molar ratio in ddH2O (600 μL volume), at 25 °C for 40 min. After that, the excess free Sulfo-NHS-LC-biotin was removed by applying the protein sample to a desalting column (Zeba Spin Desalting Columns, 5 mL, for 500- to 2,000-µL samples, 7,000 molecular weight cutoff (MWCO)). After centrifugation of the column at 1,000 × g for 2 min, the collected flow-through solution is the biotin-labeled LckUD+SH3 protein for subsequent BLI experiments.
Biotinylated hLckUD+SH3 (in 20 mM Hepes, pH 7.4, 150 mM NaCl, and 1 mM DTT) were first immobilized onto streptavidin biosensors (ForteBio) at a speed of 1,000 rpm for 4 min. The immobilized sensors were equilibrated in reaction buffer (20 mM Hepes, pH 7.4, 150 mM NaCl, 1 mM DTT, and 0.02% Tween20) at a speed of 200 rpm for 3 min. Association curves were obtained by incubating hLckUD+SH3-coated biosensor with hCD3CD-His solution (1 μM protein in reaction buffer), the biosensor was rotated at a speed of 200 rpm for 8 min, and dissociations were detected by incubating in reaction buffer without CD3 protein in the same condition. Data were acquired using an Octet Data Acquisition 7.0.1.17 according to the manufacturers' instructions. The assays were analyzed with the Octet Data Analysis Software 7.0.1.3.
NMR Experiments.
For NMR titration experiments, the 15N-labeled mLckUD+SH3 was titrated by the unlabeled mCD3εCD solution. The concentration of mLckUD+SH3 was maintained at 0.1 mM, and the concentration of mCD3εCD was varied to generate a series of different mLckUD+SH3:mCD3εCD molar ratios (1:0, 1:0.5, 1:1, 1:5 and 1:10); vice versa, the 15N-labeled CD3εCD was titrated by unlabeled Lck UD+SH3 with molar ratios range from 0 to 10. The buffer used for the titration experiments was 20 mM phosphate buffer, pH6.7, 1 mM DTT. The chemical shifts of amide groups were traced in 15N-1H HSQC spectrum. The acquired data were further processed using the software package NMRPipe (58) and analyzed with Sparky (T. D. Goddard and D. G. Kneller, University of California, San Francisco, CA) and KUJIRA (59). Resonance assignments of mLckUD+SH3 and mCD3εCD were made using standard triple-resonance NMR techniques (60). The chemical shift was calculated by the following equation: Δδ = , in which and represent the specific H and N values of residues after titration, and and represent the specific H and N values of residues before titration.
TCR Stimulation in Reconstituted TCR−CD3−Lck Cells.
HEK-1G4 cells and APCs (Raji cells) were generated as previously described (43); pHAGE was used as the lentiviral vector, together with two envelop plasmids psPAX.2 and pMD2.D. The 1G4 TCRα-F2A-1G4 TCRβ-IRES-BFP and CD3δ-F2A-CD3γ-T2A-CD3ε-P2A-CD3ζ-IRES-zsGreen plasmids were stably transfected into HEK-293FT cells by lentiviral transduction. The hLck WT/mut-IRES-mCherry (for pMHC triggering) or hLck WT/mut-V5-mCherry (for OKT3 triggering) (10 ng per plasmid for one 10-cm dish), CBP, Csk, and CD45 (4 ng per plasmid for one 10-cm dish) were transiently transfected into HEK-1G4 cells by Lipo2000 (30 μL per 10-cm dish) (Thermo Scientific) 36 h before stimulation. CD45 was a chimera containing the large extracellular and transmembrane domains of CD43 and the phosphatase domains of CD45, because full-length CD45 is poorly expressed in HEK-293FT cells. For APC triggering, HEK-1G4 cells were additionally transiently transfected with CD2 and ICAM-1 (10 ng per plasmid for one 10-cm dish). Raji cells that stably transfected with HA-pMHC-ESO9V-mCitrine were used as APCs.
For APC triggering, HEK-1G4 cells and APCs were washed by PBS twice and diluted in RPMI-1640 (without serum) at a concentration of 1 × 10⁷/mL. HEK-1G4 cells and APCs were mixed together at a ratio of 1:1 in a 15-mL tube and incubated in 37 °C water bath to trigger TCR phosphorylation. For OKT3 triggering, HEK-1G4 cells were washed by DMEM (without serum) twice and suspended in DMEM (without serum) at a concentration of 1 × 10⁷/mL. The OKT3 (final concentration: 5 μg/mL) was then added in, and the reaction was immediately moved to a 37 °C water bath to trigger TCR phosphorylation. To stop the reaction at every time point, cells were lysed by adding ice-cold 2× Lysis buffer [2% Nonidet P-40, 50 mM Tris⋅HCl, pH 7.4, 155 mM NaCl, 5 mM EDTA, 5 mM Na3VO4, 40 mM NaF, and 2% complete protease inhibitor mixture (Sigma)]. Then, the samples were subjected to SDS/PAGE gel for electrophoresis and subsequent Western blot.
In Fig. 6, gel with IP samples was first blotted with p-Tyr-100 to detect CD3ε/δ/γ phosphorylation (Cell Signaling Technology), and then stripped and reprobed for CD3ε [EPR5361(2); Epitomics Inc.]. To blot CD3ζ, pCD3ζ, Lck, pLck, and pMHC, two gels with lysate samples were prepared. After electrophoresis, the two gels were transferred to PVDF membranes. Each PVDF membrane was cut to three pieces. The lower piece was blotted for pCD3ζ (Tyr142) [EP265(2)Y; Epitomics Inc.] or pCD3ζ (Tyr83) [EP776(2)Y; Epitomics Inc.]. Then it was stripped and reblotted for CD3ζ (6B10.2; Santa Cruz Biotechnology). The middle piece was blotted for pLck (Tyr394; Santa Cruz Biotechnology) or pLck (Tyr505; Santa Cruz Biotechnology). Then it was stripped and reblotted for Lck (3A5; Santa Cruz Biotechnology). The upper piece was blotted for pMHC.
In Fig. S7, gel with IP samples was first blotted with p-Tyr-100 to detect CD3ε/δ/γ phosphorylation (Cell Signaling Technology), and then stripped and reprobed for CD3ε [EPR5361(2); Epitomics Inc.]. To blot CD3ζ, pCD3ζ, Lck, and pLck, two different gels with lysate samples were prepared. After electrophoresis, the two gels were transferred to PVDF membranes. Each PVDF membrane was cut to two pieces. The upper piece was blotted for pLck (Tyr394; Santa Cruz Biotechnology) or pLck (Tyr505; Santa Cruz Biotechnology). Then it was stripped and reblotted for Lck (3A5; Santa Cruz Biotechnology). The lower piece was blotted for pCD3ζ (C415.9A; Santa Cruz Biotechnology). Then it was stripped and reblotted for CD3ζ (6B10.2; Santa Cruz Biotechnology).
Following the primary antibody blotting, the corresponding HRP-conjugated secondary antibodies were used. The signals of specific protein bands were recorded by films, which were then scanned and converted to TIFF figures.
Recruitment of Lck to the TCR−pMHC Contact Site.
We first transfected Lck WT-V5-mCherry or Lck D12N-V5-mCherry construct into TCR−CD3 reconstituted 293FT cells (which was a stable cell line made by lentivirus and has been sorted by FACS), and then cells were trypsinized and mixed with equal number of Raji cells expressing MHC I-mCitrine loaded with the cognate ESO9V antigen (which was also a stable cell line made by lentivirus and has been sorted by FACS). The cell mixture was then put in a 37 °C water bath to trigger TCR signaling. After 10 min, cells were loaded onto a poly-l-lysine-coated glass-bottom dish and attached onto the glass for 5 min at 37 °C for incubation, and then the cells were fixed with 4% paraformaldehyde (PFA) and subjected to confocal scanning. Cells with matched surface Lck level were selected for comparing recruitment of Lck WT or D12N mutant to the TCR−pMHC site. Lck recruitment was measured by a method developed by Tavano et al. (61).
Acknowledgments
C.X. is funded by Chinese Academy of Sciences (CAS) grants (Strategic Priority Research Program XDB08020100) and National Natural Science Foundation of China (NFSC) Grants 31370860, 31530022, 31425009, and 31621003. H.L. is funded by Ministry of Science and Technology of China (MOST) Grant 2014CB541903 and NSFC Grant 31470734. Our NMR experiments were performed at the National Center for Protein Science Shanghai. Imaging and FACS experiments were performed at the core facility for cell biology of Shanghai Institute of Biochemistry and Cell Biology, CAS. The BLI experiment was performed at the core facility for molecular biology of Shanghai Institute of Biochemistry and Cell Biology, CAS.
Footnotes
The authors declare no conflict of interest.
This article is a PNAS Direct Submission.
This article contains supporting information online at www.pnas.org/lookup/suppl/doi:10.1073/pnas.1701990114/-/DCSupplemental.
References
- 1.Morris GP, Allen PM. How the TCR balances sensitivity and specificity for the recognition of self and pathogens. Nat Immunol. 2012;13:121–128. doi: 10.1038/ni.2190. [DOI] [PubMed] [Google Scholar]
- 2.Moulton VR, Tsokos GC. T cell signaling abnormalities contribute to aberrant immune cell function and autoimmunity. J Clin Invest. 2015;125:2220–2227. doi: 10.1172/JCI78087. [DOI] [PMC free article] [PubMed] [Google Scholar]
- 3.Sharma P, Allison JP. The future of immune checkpoint therapy. Science. 2015;348:56–61. doi: 10.1126/science.aaa8172. [DOI] [PubMed] [Google Scholar]
- 4.Fesnak AD, June CH, Levine BL. Engineered T cells: The promise and challenges of cancer immunotherapy. Nat Rev Cancer. 2016;16:566–581. doi: 10.1038/nrc.2016.97. [DOI] [PMC free article] [PubMed] [Google Scholar]
- 5.Rosenberg SA, Restifo NP. Adoptive cell transfer as personalized immunotherapy for human cancer. Science. 2015;348:62–68. doi: 10.1126/science.aaa4967. [DOI] [PMC free article] [PubMed] [Google Scholar]
- 6.Schumacher TN, Schreiber RD. Neoantigens in cancer immunotherapy. Science. 2015;348:69–74. doi: 10.1126/science.aaa4971. [DOI] [PubMed] [Google Scholar]
- 7.Tubo NJ, et al. Single naive CD4+ T cells from a diverse repertoire produce different effector cell types during infection. Cell. 2013;153:785–796. doi: 10.1016/j.cell.2013.04.007. [DOI] [PMC free article] [PubMed] [Google Scholar]
- 8.Chakraborty AK, Weiss A. Insights into the initiation of TCR signaling. Nat Immunol. 2014;15:798–807. doi: 10.1038/ni.2940. [DOI] [PMC free article] [PubMed] [Google Scholar]
- 9.Wucherpfennig KW, Gagnon E, Call MJ, Huseby ES, Call ME. Structural biology of the T-cell receptor: Insights into receptor assembly, ligand recognition, and initiation of signaling. Cold Spring Harb Perspect Biol. 2010;2:a005140. doi: 10.1101/cshperspect.a005140. [DOI] [PMC free article] [PubMed] [Google Scholar]
- 10.Palacios EH, Weiss A. Function of the Src-family kinases, Lck and Fyn, in T-cell development and activation. Oncogene. 2004;23:7990–8000. doi: 10.1038/sj.onc.1208074. [DOI] [PubMed] [Google Scholar]
- 11.Kim PW, Sun ZY, Blacklow SC, Wagner G, Eck MJ. A zinc clasp structure tethers Lck to T cell coreceptors CD4 and CD8. Science. 2003;301:1725–1728. doi: 10.1126/science.1085643. [DOI] [PubMed] [Google Scholar]
- 12.Van Laethem F, et al. Deletion of CD4 and CD8 coreceptors permits generation of αβT cells that recognize antigens independently of the MHC. Immunity. 2007;27:735–750. doi: 10.1016/j.immuni.2007.10.007. [DOI] [PubMed] [Google Scholar]
- 13.Roh KH, Lillemeier BF, Wang F, Davis MM. The coreceptor CD4 is expressed in distinct nanoclusters and does not colocalize with T-cell receptor and active protein tyrosine kinase p56lck. Proc Natl Acad Sci USA. 2015;112:E1604–E1613. doi: 10.1073/pnas.1503532112. [DOI] [PMC free article] [PubMed] [Google Scholar]
- 14.Irvine DJ, Purbhoo MA, Krogsgaard M, Davis MM. Direct observation of ligand recognition by T cells. Nature. 2002;419:845–849. doi: 10.1038/nature01076. [DOI] [PubMed] [Google Scholar]
- 15.Casas J, et al. Ligand-engaged TCR is triggered by Lck not associated with CD8 coreceptor. Nat Commun. 2014;5:5624. doi: 10.1038/ncomms6624. [DOI] [PMC free article] [PubMed] [Google Scholar]
- 16.Paige LA, Nadler MJ, Harrison ML, Cassady JM, Geahlen RL. Reversible palmitoylation of the protein-tyrosine kinase p56lck. J Biol Chem. 1993;268:8669–8674. [PubMed] [Google Scholar]
- 17.Kwong J, Lublin DM. Amino-terminal palmitate or polybasic domain can provide required second signal to myristate for membrane binding of p56lck. Biochem Biophys Res Commun. 1995;207:868–876. doi: 10.1006/bbrc.1995.1266. [DOI] [PubMed] [Google Scholar]
- 18.Yasuda K, et al. Serine 6 of Lck tyrosine kinase: A critical site for Lck myristoylation, membrane localization, and function in T lymphocytes. J Immunol. 2000;165:3226–3231. doi: 10.4049/jimmunol.165.6.3226. [DOI] [PubMed] [Google Scholar]
- 19.Tran T, et al. Insights into human Lck SH3 domain binding specificity: Different binding modes of artificial and native ligands. Biochemistry. 2005;44:15042–15052. doi: 10.1021/bi051403k. [DOI] [PubMed] [Google Scholar]
- 20.Kang H, et al. SH3 domain recognition of a proline-independent tyrosine-based RKxxYxxY motif in immune cell adaptor SKAP55. EMBO J. 2000;19:2889–2899. doi: 10.1093/emboj/19.12.2889. [DOI] [PMC free article] [PubMed] [Google Scholar]
- 21.Davis SJ, van der Merwe PA. Lck and the nature of the T cell receptor trigger. Trends Immunol. 2011;32:1–5. doi: 10.1016/j.it.2010.11.003. [DOI] [PubMed] [Google Scholar]
- 22.Hui E, Vale RD. In vitro membrane reconstitution of the T-cell receptor proximal signaling network. Nat Struct Mol Biol. 2014;21:133–142. doi: 10.1038/nsmb.2762. [DOI] [PMC free article] [PubMed] [Google Scholar]
- 23.Nika K, et al. Constitutively active Lck kinase in T cells drives antigen receptor signal transduction. Immunity. 2010;32:766–777. doi: 10.1016/j.immuni.2010.05.011. [DOI] [PMC free article] [PubMed] [Google Scholar]
- 24.Stirnweiss A, et al. T cell activation results in conformational changes in the Src family kinase Lck to induce its activation. Sci Signal. 2013;6:ra13. doi: 10.1126/scisignal.2003607. [DOI] [PubMed] [Google Scholar]
- 25.Nyakeriga AM, Garg H, Joshi A. TCR-induced T cell activation leads to simultaneous phosphorylation at Y505 and Y394 of p56(lck) residues. Cytometry A. 2012;81:797–805. doi: 10.1002/cyto.a.22070. [DOI] [PubMed] [Google Scholar]
- 26.Shah NH, et al. An electrostatic selection mechanism controls sequential kinase signaling downstream of the T cell receptor. eLife. 2016;5:5. doi: 10.7554/eLife.20105. [DOI] [PMC free article] [PubMed] [Google Scholar]
- 27.Guy CS, Vignali DA. Organization of proximal signal initiation at the TCR:CD3 complex. Immunol Rev. 2009;232:7–21. doi: 10.1111/j.1600-065X.2009.00843.x. [DOI] [PMC free article] [PubMed] [Google Scholar]
- 28.Love PE, Shores EW. ITAM multiplicity and thymocyte selection: How low can you go? Immunity. 2000;12:591–597. doi: 10.1016/s1074-7613(00)80210-1. [DOI] [PubMed] [Google Scholar]
- 29.Pitcher LA, van Oers NSC. T-cell receptor signal transmission: Who gives an ITAM? Trends Immunol. 2003;24:554–560. doi: 10.1016/j.it.2003.08.003. [DOI] [PubMed] [Google Scholar]
- 30.Wu W, et al. Lipid in T-cell receptor transmembrane signaling. Prog Biophys Mol Biol. 2015;118:130–138. doi: 10.1016/j.pbiomolbio.2015.04.004. [DOI] [PubMed] [Google Scholar]
- 31.Aivazian D, Stern LJ. Phosphorylation of T cell receptor zeta is regulated by a lipid dependent folding transition. Nat Struct Biol. 2000;7:1023–1026. doi: 10.1038/80930. [DOI] [PubMed] [Google Scholar]
- 32.Bettini ML, et al. Membrane association of the CD3ε signaling domain is required for optimal T cell development and function. J Immunol. 2014;193:258–267. doi: 10.4049/jimmunol.1400322. [DOI] [PMC free article] [PubMed] [Google Scholar]
- 33.DeFord-Watts LM, et al. The CD3 ζ subunit contains a phosphoinositide-binding motif that is required for the stable accumulation of TCR−CD3 complex at the immunological synapse. J Immunol. 2011;186:6839–6847. doi: 10.4049/jimmunol.1002721. [DOI] [PMC free article] [PubMed] [Google Scholar]
- 34.Deford-Watts LM, et al. The cytoplasmic tail of the T cell receptor CD3 epsilon subunit contains a phospholipid-binding motif that regulates T cell functions. J Immunol. 2009;183:1055–1064. doi: 10.4049/jimmunol.0900404. [DOI] [PMC free article] [PubMed] [Google Scholar]
- 35.Xu C, et al. Regulation of T cell receptor activation by dynamic membrane binding of the CD3ε cytoplasmic tyrosine-based motif. Cell. 2008;135:702–713. doi: 10.1016/j.cell.2008.09.044. [DOI] [PMC free article] [PubMed] [Google Scholar]
- 36.Zhang H, Cordoba SP, Dushek O, van der Merwe PA. Basic residues in the T-cell receptor ζ cytoplasmic domain mediate membrane association and modulate signaling. Proc Natl Acad Sci USA. 2011;108:19323–19328. doi: 10.1073/pnas.1108052108. [DOI] [PMC free article] [PubMed] [Google Scholar]
- 37.Sigalov AB, Aivazian DA, Uversky VN, Stern LJ. Lipid-binding activity of intrinsically unstructured cytoplasmic domains of multichain immune recognition receptor signaling subunits. Biochemistry. 2006;45:15731–15739. doi: 10.1021/bi061108f. [DOI] [PMC free article] [PubMed] [Google Scholar]
- 38.Shi X, et al. Ca2+ regulates T-cell receptor activation by modulating the charge property of lipids. Nature. 2013;493:111–115. doi: 10.1038/nature11699. [DOI] [PubMed] [Google Scholar]
- 39.Gagnon E, Schubert DA, Gordo S, Chu HH, Wucherpfennig KW. Local changes in lipid environment of TCR microclusters regulate membrane binding by the CD3ε cytoplasmic domain. J Exp Med. 2012;209:2423–2439. doi: 10.1084/jem.20120790. [DOI] [PMC free article] [PubMed] [Google Scholar]
- 40.Call ME, Wucherpfennig KW, Chou JJ. The structural basis for intramembrane assembly of an activating immunoreceptor complex. Nat Immunol. 2010;11:1023–1029. doi: 10.1038/ni.1943. [DOI] [PMC free article] [PubMed] [Google Scholar]
- 41.Xu C, Call ME, Wucherpfennig KW. A membrane-proximal tetracysteine motif contributes to assembly of CD3δε and CD3γε dimers with the T cell receptor. J Biol Chem. 2006;281:36977–36984. doi: 10.1074/jbc.M607164200. [DOI] [PMC free article] [PubMed] [Google Scholar]
- 42.Call ME, Pyrdol J, Wiedmann M, Wucherpfennig KW. The organizing principle in the formation of the T cell receptor-CD3 complex. Cell. 2002;111:967–979. doi: 10.1016/s0092-8674(02)01194-7. [DOI] [PMC free article] [PubMed] [Google Scholar]
- 43.James JR, Vale RD. Biophysical mechanism of T-cell receptor triggering in a reconstituted system. Nature. 2012;487:64–69. doi: 10.1038/nature11220. [DOI] [PMC free article] [PubMed] [Google Scholar]
- 44.Brodeur JF, Li S, da Silva Martins M, Larose L, Dave VP. Critical and multiple roles for the CD3ε intracytoplasmic tail in double negative to double positive thymocyte differentiation. J Immunol. 2009;182:4844–4853. doi: 10.4049/jimmunol.0803679. [DOI] [PubMed] [Google Scholar]
- 45.Wu W, Shi X, Xu C. Regulation of T cell signalling by membrane lipids. Nat Rev Immunol. 2016;16:690–701. doi: 10.1038/nri.2016.103. [DOI] [PubMed] [Google Scholar]
- 46.Risueño RM, Gil D, Fernández E, Sánchez-Madrid F, Alarcón B. Ligand-induced conformational change in the T-cell receptor associated with productive immune synapses. Blood. 2005;106:601–608. doi: 10.1182/blood-2004-12-4763. [DOI] [PubMed] [Google Scholar]
- 47.Gil D, Schamel WW, Montoya M, Sánchez-Madrid F, Alarcón B. Recruitment of Nck by CD3 epsilon reveals a ligand-induced conformational change essential for T cell receptor signaling and synapse formation. Cell. 2002;109:901–912. doi: 10.1016/s0092-8674(02)00799-7. [DOI] [PubMed] [Google Scholar]
- 48.Daniels MA, et al. Thymic selection threshold defined by compartmentalization of Ras/MAPK signalling. Nature. 2006;444:724–729. doi: 10.1038/nature05269. [DOI] [PubMed] [Google Scholar]
- 49.Hogan PG, Lewis RS, Rao A. Molecular basis of calcium signaling in lymphocytes: STIM and ORAI. Annu Rev Immunol. 2010;28:491–533. doi: 10.1146/annurev.immunol.021908.132550. [DOI] [PMC free article] [PubMed] [Google Scholar]
- 50.Schoenborn JR, Tan YX, Zhang C, Shokat KM, Weiss A. Feedback circuits monitor and adjust basal Lck-dependent events in T cell receptor signaling. Sci Signal. 2011;4:ra59. doi: 10.1126/scisignal.2001893. [DOI] [PMC free article] [PubMed] [Google Scholar]
- 51.Dutta D, et al. Recruitment of calcineurin to the TCR positively regulates T cell activation. Nat Immunol. 2017;18:196–204. doi: 10.1038/ni.3640. [DOI] [PMC free article] [PubMed] [Google Scholar]
- 52.Thill PA, Weiss A, Chakraborty AK. Phosphorylation of a tyrosine residue on Zap70 by Lck and its subsequent binding via an SH2 domain may be a key gatekeeper of T cell receptor signaling in vivo. Mol Cell Biol. 2016;36:2396–2402. doi: 10.1128/MCB.00165-16. [DOI] [PMC free article] [PubMed] [Google Scholar]
- 53.Sjölin-Goodfellow H, et al. The catalytic activity of the kinase ZAP-70 mediates basal signaling and negative feedback of the T cell receptor pathway. Sci Signal. 2015;8:ra49. doi: 10.1126/scisignal.2005596. [DOI] [PMC free article] [PubMed] [Google Scholar]
- 54.Tan YX, et al. Inhibition of the kinase Csk in thymocytes reveals a requirement for actin remodeling in the initiation of full TCR signaling. Nat Immunol. 2014;15:186–194. doi: 10.1038/ni.2772. [DOI] [PMC free article] [PubMed] [Google Scholar]
- 55.Zikherman J, et al. CD45-Csk phosphatase-kinase titration uncouples basal and inducible T cell receptor signaling during thymic development. Immunity. 2010;32:342–354. doi: 10.1016/j.immuni.2010.03.006. [DOI] [PMC free article] [PubMed] [Google Scholar]
- 56.Choudhuri K, Wiseman D, Brown MH, Gould K, van der Merwe PA. T-cell receptor triggering is critically dependent on the dimensions of its peptide-MHC ligand. Nature. 2005;436:578–582. doi: 10.1038/nature03843. [DOI] [PubMed] [Google Scholar]
- 57.Dobbins J, et al. Binding of the cytoplasmic domain of CD28 to the plasma membrane inhibits Lck recruitment and signaling. Sci Signal. 2016;9:ra75. doi: 10.1126/scisignal.aaf0626. [DOI] [PMC free article] [PubMed] [Google Scholar]
- 58.Delaglio F, et al. NMRPipe: A multidimensional spectral processing system based on UNIX pipes. J Biomol NMR. 1995;6:277–293. doi: 10.1007/BF00197809. [DOI] [PubMed] [Google Scholar]
- 59.Kobayashi N, et al. KUJIRA, a package of integrated modules for systematic and interactive analysis of NMR data directed to high-throughput NMR structure studies. J Biomol NMR. 2007;39:31–52. doi: 10.1007/s10858-007-9175-5. [DOI] [PubMed] [Google Scholar]
- 60.Ikura M, Kay LE, Bax A. A novel approach for sequential assignment of 1H, 13C, and 15N spectra of proteins: Heteronuclear triple-resonance three-dimensional NMR spectroscopy. Application to calmodulin. Biochemistry. 1990;29:4659–4667. doi: 10.1021/bi00471a022. [DOI] [PubMed] [Google Scholar]
- 61.Tavano R, et al. CD28 and lipid rafts coordinate recruitment of Lck to the immunological synapse of human T lymphocytes. J Immunol. 2004;173:5392–5397. doi: 10.4049/jimmunol.173.9.5392. [DOI] [PubMed] [Google Scholar]


