Significance
The development of BRAF inhibitors is a notable clinical success, leading to rapid initial melanoma regression. However, response rates are tempered by a short duration of response in a majority of patients. This study has determined the effects of BRAF inhibition on mutant melanoma cells, as well as on the RNA contents in their vesicular secretome. Our data show the presence of miR-211–5p in all extracellular vesicular (EV) subsets upon treatment with BRAF inhibitors, which provides a fundamental starting point to understand the regulatory effects of molecules present in EVs, which may have implications for disease progression in patients receiving BRAF-targeted treatment.
Keywords: small RNAs, extracellular vesicles, cancer, noncoding RNAs
Abstract
The BRAF inhibitors vemurafenib and dabrafenib can be used to treat patients with metastatic melanomas harboring BRAFV600 mutations. Initial antitumoral responses are often seen, but drug-resistant clones with reactivation of the MEK–ERK pathway soon appear. Recently, the secretome of tumor-derived extracellular vesicles (EVs) has been ascribed important functions in cancers. To elucidate the possible functions of EVs in BRAF-mutant melanoma, we determined the RNA content of the EVs, including apoptotic bodies, microvesicles, and exosomes, released from such cancer cells after vemurafenib treatment. We found that vemurafenib significantly increased the total RNA and protein content of the released EVs and caused significant changes in the RNA profiles. RNA sequencing and quantitative PCR show that cells and EVs from vemurafenib-treated cell cultures and tumor tissues harvested from cell-derived and patient-derived xenografts harbor unique miRNAs, especially increased expression of miR-211–5p. Mechanistically, the expression of miR-211–5p as a result of BRAF inhibition was induced by increased expression of MITF that regulates the TRPM1 gene resulting in activation of the survival pathway. In addition, transfection of miR-211 in melanoma cells reduced the sensitivity to vemurafenib treatment, whereas miR-211–5p inhibition in a vemurafenib resistant cell line affected the proliferation negatively. Taken together, our results show that vemurafenib treatment induces miR-211–5p up-regulation in melanoma cells both in vitro and in vivo, as well as in subsets of EVs, suggesting that EVs may provide a tool to understand malignant melanoma progression.
Approximately half of all malignant melanoma tumors harbor BRAF somatic missense mutations, and these most often occur at amino acid residue V600 (1). Inhibition of BRAFV600 with the FDA-approved drugs vemurafenib or dabrafenib results in rapid regression of metastatic melanoma tumors harboring this mutation (2). Unfortunately, resistance often follows the immediate antitumor effect of these drugs, and this resistance is associated with reactivation of MAPK pathways or by alternative BRAF splicing (3).
The eukaryotic genome encodes two categories of noncoding RNAs (ncRNAs), referred to as “small ncRNAs” and “long mRNA-like ncRNAs” (4). Small ncRNAs are 20–200 nucleotides (nt) in length and include species such as miRNAs, piRNAs, siRNAs, tRNAs, snRNAs, snoRNAs, vaultRNAs, and other less well-characterized RNA species (5). The functional role of these small RNAs, especially miRNA, siRNA, and piRNA, is gene silencing by interaction with chromatin or by base pairing with complementary mRNAs or DNAs (6–9). It has recently been established that RNA molecules not only are retained in the cytoplasm of the cells, but they can also be released into the extracellular milieu, often in extracellular vesicles (EVs) (10, 11). It has also been shown that extracellular vesicles can transfer functional RNA between cells (12). In addition, different subsets of vesicles such as apoptotic bodies, microvesicles, and exosomes contain distinct RNA molecules, especially miRNA, that are unique to different exosomal subsets (5, 13). These observations have opened a field of research aiming to understand the vesicular contents and function under different conditions and how they influence the function of the vesicles.
The role of ncRNAs in different diseases, including melanoma, has been investigated, but relatively little is known about the RNA species present in extracellular vesicles that are derived from melanoma cells. We hypothesized that the populations of small RNA molecules present in subsets of extracellular vesicles change after vemurafenib treatment, which could alter the extracellular vesicles’ biological function. To test this hypothesis, we used next generation sequencing and quantitative PCR (qPCR) approaches to compare the changes in the RNA contents in extracellular vesicles upon inhibition of BRAFV600 with vemurafenib in cultured malignant melanoma cells, in cell line-derived xenografts (CDXs), and in patient-derived xenografts (PDXs). In addition, we also determined the mechanism behind the induced expression of miRNA upon vemurafenib treatment in malignant melanoma cells.
Results and Discussion
BRAF Inhibition Increases the RNA and Protein Content in Extracellular Vesicle Isolates.
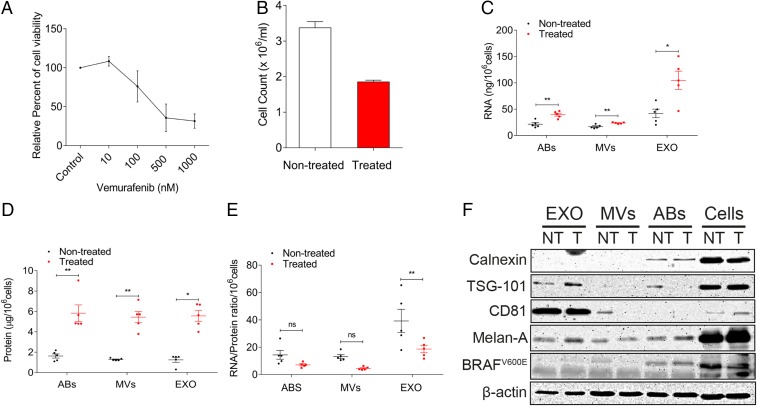
Treatment of MML-1 cells with the BRAF inhibitor vemurafenib for 72 h resulted in a dose-related attenuation of cell viability (Fig. 1A). A concentration of 200 nM vemurafenib was considered optimal for further experiments, as this concentration resulted in 50% viability after 72 h of treatment (Fig. 1B). The conditioned media were harvested 72 h after the treatment, and extracellular vesicles were isolated using differential centrifugation. Measuring the RNA and protein concentration among the extracellular vesicle subsets from treated and nontreated cells showed that the RNA and protein concentration was significantly increased in apoptotic bodies, microvesicles, and exosomes after treatment (Fig. 1 C and D). This increase in total RNA and protein content shows that the release of extracellular vesicles is caused by vemurafenib treatment in melanoma cells. The RNA/protein ratio was not significantly altered in the microvesicles and apoptotic bodies; however, vemurafenib treatment decreased the RNA/protein ratio in the exosome fraction (Fig. 1E), arguing against increased loading of RNA into extracellular vesicles.
Fig. 1.
Vemurafenib treatment increases the RNA and protein cargo in extracellular vesicle subsets. (A) Dose–response curve of vemurafenib treatment in MML-1 cells. The relative percent cell viability was assessed with an MTT assay. (B) Cell count of MML-1 cells after 200 nM vemurafenib treatment for 72 h. The cells were counted with a trypan blue exclusion assay. (C) RNA content in the subsets of EVs released by nontreated and treated cells, normalized per million cells (n = 5). (D) Protein content in the subsets of extracellular vesicles released from nontreated and treated cells, normalized per million cells (n = 5). (E) RNA/protein ratio in subsets of extracellular vesicles upon vemurafenib treatment (n = 5). (F) Western blot showing characteristics of extracellular vesicles using exosomal markers and melanoma markers. β-Actin was used as the loading control for cells. Data are presented as ± SEM. ABs, apoptotic bodies; EXO, exosomes; and MVs, microvesicles. *P < 0.05, **P < 0.01.
Vesicles were then characterized using Western blot to determine the presence of established extracellular vesicle protein markers such as TSG-101 and CD81. These molecules were enriched in the exosomes from both treated and nontreated cells compared with the other extracellular vesicle subpopulations (Fig. 1F). Calnexin, an endoplasmic reticulum marker, was present in apoptotic bodies but was absent in exosomes and microvesicles, confirming that the differential centrifugation separation of apoptotic bodies from the other two extracellular vesicle subtypes was efficient. Melan-A (also called MART-1), an antigen on melanoma cells, was present in all vesicle subpopulations, whereas BRAFV600E was detected only in the cells and apoptotic bodies (upper band, Fig. 1F). β-Actin was used as the loading control for cells, and it was also shown to be present in all extracellular vesicle subsets. This protein characterization shows that there is no change in the presence of protein markers in the vesicles upon vemurafenib treatment, but the treatment alters the RNA and protein content in the extracellular vesicles derived from melanoma cells.
Vesicles from Treated Cells Carry a Diverse Repertoire of ncRNAs.
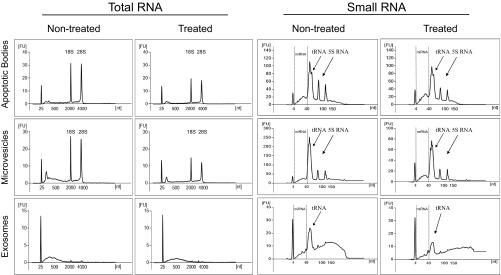
Given that the cells release greater quantities of all extracellular vesicle subsets after vemurafenib treatment, the RNA cargos of all extracellular vesicle subsets were analyzed in biological duplicates with a bioanalyzer instrument and by small RNA deep sequencing. The bioanalyzer showed clear peaks for the 5S rRNA and the 18S and 28S rRNA subunits as well as tRNA in the apoptotic bodies and microvesicles (Fig. S1). However, the peaks for the rRNA subunits were not as prominent in the exosomes, supporting our previous findings arguing that smaller exosomes carry relatively little rRNA (5, 13). The total RNA and small RNA profiles did not show a significant difference in the extracellular vesicle subset after treatment (Fig. S1).
Fig. S1.
Vemurafenib alters the RNA profiles in the subsets of extracellular vesicles. RNA profiles showing the total RNA and small RNA in extracellular vesicles from nontreated and treated cells (n = 5). The arrows show the presence of tRNA and 5S RNA in the small RNA profiles analyzed by Bioanalyzer. FU, fluorescence unit; nt, nucleotide.
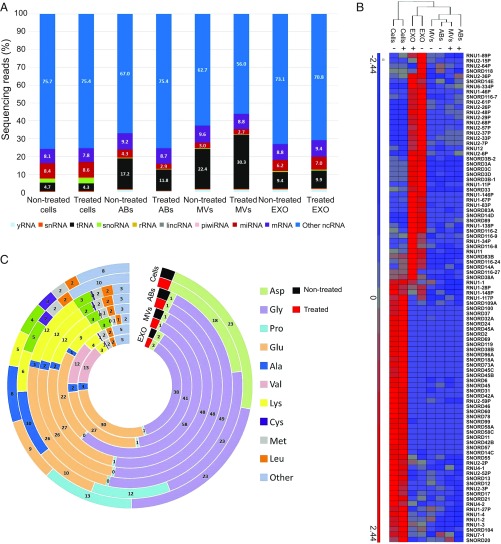
The small RNA deep sequencing for the nontreated samples has previously been analyzed and published (5), and the same raw data were now reanalyzed together with the treated samples to determine the differences in the cells and extracellular vesicle subsets upon vemurafenib treatment. Analysis of the small RNA deep sequencing was focused on ncRNAs, and first an average of the duplicates of all of the samples was calculated and then the percentage of sequencing reads for the different RNA species was determined. The distribution of mapped ncRNAs is shown in Fig. 2A. We identified the presence of yRNA, snRNA, tRNA, snoRNA, rRNA, lincRNA, piwiRNA, miRNA, and mRNA. Exosomes contained a higher proportion of miRNA compared with apoptotic bodies and microvesicles (indicated in red, Fig. 2A). Although all vesicle subsets contained a lower proportion of snoRNA than the cells (indicated in green, Fig. 2A), the exosomes carried a unique set of snoRNAs, clustering separately from cells, microvesicles, and apoptotic bodies (Fig. 2B). A few studies have shown the presence of tRNA in exosomes from neuronal cells (14), plasma exosomes (15), and immune cells (16), but little is known about the presence of tRNA in apoptotic bodies and microvesicles. In this study, a larger proportion of the reads were mapped as tRNA in the extracellular vesicles compared with cells (indicated in black, Fig. 2A). The largest percentage of tRNA was found in microvesicles, which supports the small RNA profiles from the bioanalyzer where microvesicles had the most prominent tRNA peak (Fig. S1B). Glutamate and glycine tRNAs were enriched in vesicles compared with cells (Fig. 2C). In addition, valine tRNA was enriched in exosomes compared with other EV subpopulations and cells. This shows that extracellular vesicles encapsulate most tRNAs that are processed in the cytoplasm of the cells that are producing extracellular vesicles. On the other hand, aspartic acid, proline, and alanine tRNAs were enriched in cells but were barely present in the different subsets of extracellular vesicles. Our data suggest that other extracellular vesicle subsets besides exosomes also have the capacity to carry tRNA. Together, these results show that all subsets of vesicles released by melanoma cells carry several different ncRNA species and that the relative proportions of these ncRNAs are not altered upon BRAF inhibition.
Fig. 2.
Sequencing analysis of small ncRNAs in subsets of extracellular vesicles from nontreated and treated cells. (A) The data show the percentage and distribution of sequencing reads mapping to ncRNAs in cells and extracellular vesicles. (B) Hierarchical clustering of significant snoRNAs in cells and extracellular vesicles. (C) tRNA distribution of mapping to respective tRNA isoacceptors. The numbers indicate the percentage of tRNA in cells and extracellular vesicles. (Fig. 1 legend for repeated abbreviations.) +, treated; −, nontreated.
BRAF Inhibition Affects miRNA Loading in the Extracellular Vesicle Subsets.
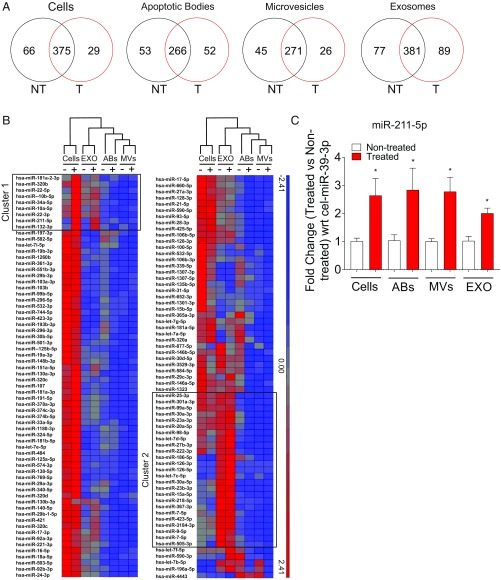
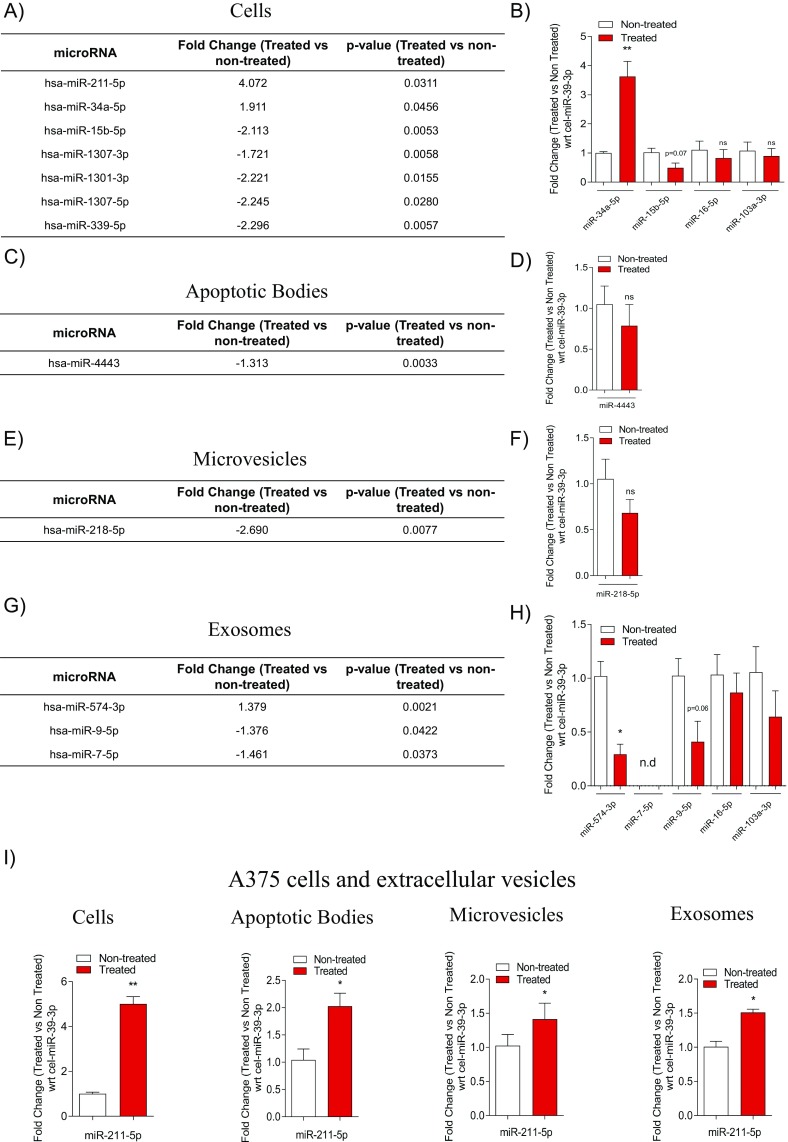
Although the relative portion of each ncRNA species did not change upon vemurafenib treatment, the expression of individual RNA molecules could be altered. Therefore, we determined the effect of BRAF inhibition on the miRNA contents in the different subsets of extracellular vesicles. A Venn diagram showed that most of the miRNAs were common in treated and nontreated cells and in all extracellular vesicle subsets (Fig. 3A). However, this analysis also showed several unique miRNAs, suggesting that vemurafenib treatment alters the miRNA content in cells and in the different extracellular vesicle subgroups (Fig. 3A). Hierarchical clustering of the 130 miRNAs that were abundantly present in all samples further demonstrated that exosomes in both treated and nontreated samples contain unique sets of miRNA compared with cells and the other subsets of vesicles (Fig. 3B, cluster 2), confirming our previous observation (5). Interestingly, some miRNAs, such as miR-211–5p, miR-132–3p, and miR-10b–5p, were expressed at higher levels in cells and exosomes from treated cells compared with cells and exosomes from nontreated cells (Fig. 3B, cluster 1). Of the 130 miRNA abundantly present in all samples, 7 were significantly differentially expressed in cells upon treatment (Fig. S2A). For the extracellular vesicle subsets, one miRNA had significantly altered expression in apoptotic bodies, one had significantly altered expression in microvesicles, and three had significantly altered expression in exosomes (Fig. S2 C, E, and G). Using qPCR, we validated several of these significantly altered miRNAs. Notably, we could confirm that miR-211–5p was significantly up-regulated in treated cells as well as in their extracellular vesicles (Fig. 3C). Deep sequencing also suggested that miR-34a–5p was significantly up-regulated in cells upon treatment, which was validated with qPCR (Fig. S2 A and B). The down-regulation of miR-15b–5p in cells, miR-4443 in apoptotic bodies, miR-218–5p in microvesicles, and miR-9–5p in exosomes upon treatment was not supported by qPCR, but these all showed a trend of being down-regulated (Fig. S2 A–H). The deep sequencing showed no significant difference in miR-16–5p and miR-103a–3p in cells and exosomes, which was confirmed with the qPCR (Fig. 3B and Fig. S2 B and G). Overall, these results validate the findings from the deep sequencing.
Fig. 3.
Vemurafenib alters the miRNA expression in subsets of extracellular vesicles. (A) Venn diagrams showing the average of reads of unique miRNAs in nontreated (NT) and treated (T) cells and extracellular vesicles using small RNA sequencing. (B) Hierarchical clustering of miRNA in cells and exosomes upon vemurafenib treatment. The clustering shows the differential regulation of miRNA: red, up-regulated and blue, down-regulated. (C) Validation of miR-211–5p by qPCR in cells and extracellular vesicles supported the results of the small RNA sequencing. The fold change in expression between treated and nontreated cells was normalized with respect to the C. elegans external spike-in miR-39–3p (n = 3). Data are presented as ± SEM. *P < 0.05. (Figs. 1 and 2 legends for repeated abbreviations.)
Fig. S2.
BRAF inhibition alters miRNA expression in extracellular vesicle subsets. (A, C, E, and G) Tables showing the significant fold change in miRNA expression from sequencing analysis in cells and extracellular vesicles. The fold change is used as a measure of the up-regulation and down-regulation of miRNA in cells and extracellular vesicles. (B, D, F, and H) Validation of miRNA confirmed by sequencing in cells, apoptotic bodies, microvesicles, and exosomes showing the differentially expressed miRNAs normalized with respect to the C. elegans external spike-in miR-39–3p (n = 3). (I) Fold change in the expression of miR-211–5p in A375 cells and extracellular vesicles normalized to the C. elegans external spike-in miR-39–3p (n = 3). Ns, nonsignificant; wrt, with respect to. Data are presented as the ± SEM. *P < 0.05, **P < 0.01.
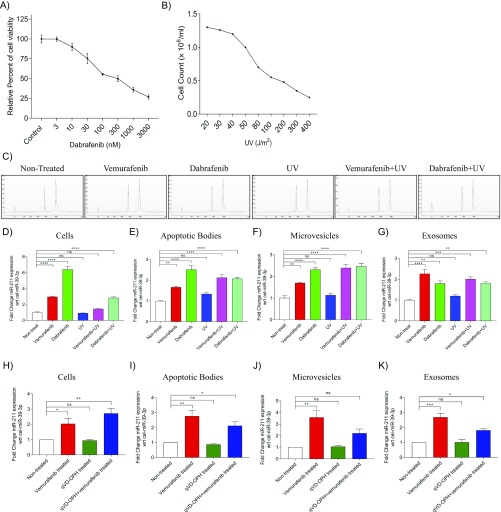
It was interesting to note that the sequencing data could only detect the up-regulation of miR-211–5p in MML-1 cells (Fig. S2A), whereas the qPCR could also detect this increase in expression in all extracellular vesicle subsets (Fig. 3C). The increase of miR-211–5p in cells as well as in all extracellular vesicle subsets was also observed upon treatment in A375 cells, another cell line harboring the BRAFV600E mutation (Fig. S2I). To confirm that the increased miR-211–5p expression was specific for and limited to BRAF inhibition and not induced by cellular toxicity and apoptosis, another BRAFV600E inhibitor, dabrafenib, was used. The concentration of dabrafenib was determined by first treating MML-1 cells with several doses (0–3,000 nM), and a concentration of 100 nM was then selected for further experiments, as this concentration resulted in 50% viability (Fig. S3A). For cytotoxicity experiments, MML-1 cells were exposed to different exposure of UV light and 80 J/m2 was used as optimal exposure for further experiments, as this concentration resulted in 50% viability (Fig. S3B). Treatment of MML-1 cells with the BRAF inhibitors dabrafenib (100 nM) or vemurafenib (200 nM) or with UV light or combinations thereof did not alter the cellular RNA profiles [RNA integrity number (RIN) value for each profile = 10; Fig. S3C]. Treatment of MML-1 cells with the BRAF inhibitor dabrafenib (100 nM) supported our findings from vemurafenib treatment, as it also induced an increased miR-211–5p expression in cells and extracellular vesicles released by the treated cells (Fig. S3 D–G). On the other hand, there was no significant difference in the miR-211–5p expression in cells and extracellular vesicles when MML-1 cells were UV treated (80 J/m2) compared with the nontreated cells and vesicles, indicating that the expression of miR-211–5p is specific and limited to BRAFV600E inhibition and not induced by cellular toxicity and cell death (Fig. S3 D–G). Furthermore, the cells surviving the UV treatment could still increase the miR-211–5p expression as well as their secreted EVs miR-211–5p expression upon vemurafenib and dabrafenib treatment (Fig. S3 D–G). In addition, we also tested the effect of the pan-caspase inhibitor, qVD-OPH, which is known to inhibit apoptosis and prevents cell death that has been induced by metformin in melanoma cells (17). Interestingly, vemurafenib treatment showed a significant increase in miR-211–5p expression compared with nontreated cells also when combined with qVD-OPH treatment (Fig. S3H). Again this increase indicates that the expression of miR-211–5p is induced by the BRAF inhibition and is not induced by apoptosis as the miR-211–5p expression is stable also when apoptosis is inhibited in vemurafenib-treated cells. qVD-OPH treatment alone did not affect the miR-211–5p expression. Similarly, miR-211–5p was also significantly enriched in the extracellular vesicles derived from vemurafenib and qVD-OPH cotreated cells (Fig. S3 I–K), suggesting that the loading of miR-211–5p cargo in the extracellular vesicle subset is dependent on BRAF inhibition and independent of apoptosis.
Fig. S3.
miR-211–5p expression is solely dependent on BRAF inhibition and not on cellular cytotoxicity. (A) Dose–response curve for dabrafenib treatment in MML-1 cells. The relative percent of cell viability was assessed with an MTT assay. (B) Cell count analysis of MML-1 cells treated with different units of UV exposure (J/m2). (C) Total RNA profiles of cells after different treatment conditions using Nano Chip and Bioanalyzer. All cellular profiles showed RIN values of 10 with no degradation of rRNA. (D–G) Fold change of miR-211–5p in cells and extracellular vesicles after vemurafenib (200 nM), dabrafenib (100 nM), UV (80 J/m2), and cotreatments normalized to the external spike-in, C. elegans miR-39–3p (n = 3). (H–K) Fold change of miR-211–5p in cells and extracellular vesicles after vemurafenib (200 nM), qVD-OPH (pan-caspase inhibitor), and cotreatments normalized to the external spike-in C. elegans miR-39–3p (n = 3). Ns, nonsignificant; wrt, with respect to. Data are presented as ± SEM. *P < 0.05, **P < 0.01, ***P < 0.001, ****P < 0.0001.
Together, these results strongly suggest that miR-211–5p is up-regulated upon BRAFV600E inhibition in BRAFV600E melanoma cells and that miR-211–5p is loaded into all subsets of extracellular vesicles released by the treated cells.
miR-211–5p Is Up-Regulated in Extracellular Vesicles from CDXs and PDXs.
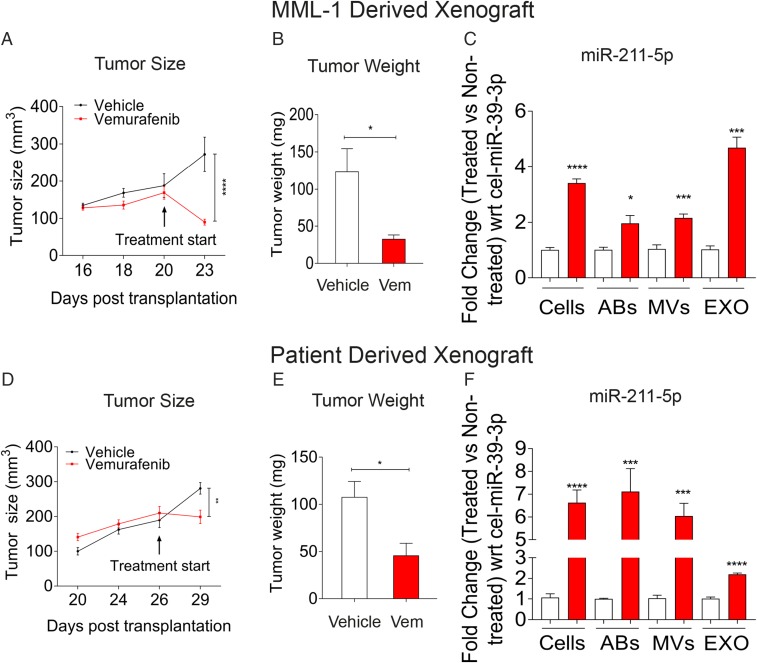
To confirm the in vitro validation of the miRNA expression, we transplanted MML-1 cells into the flanks of 10 NOG (nonobese severe combined immune deficient interleukin-2 receptor chain γ knockout) mice. When the s.c. tumors had reached a volume of around 200 mm3, the mice were randomized into two groups, one receiving food containing vemurafenib and the other receiving standard chow. Three days after the start of vemurafenib treatment, a significant reduction in tumor size had occurred compared with the vehicle control (Fig. 4A). Upon killing the mice, the tumors were harvested and showed a significant reduction in tumor weight (Fig. 4B). All tumors were processed into single-cell suspensions and expanded in vitro as a monolayer. The extracellular vesicles released from these cultures over the course of 24 h were used for RNA isolation and subsequent qPCR analyses, which showed significant up-regulation of miR-211–5p in cells and in all extracellular vesicle subsets isolated from the vemurafenib-treated tumors (Fig. 4C).
Fig. 4.
BRAF inhibition up-regulates miR-211–5p expression in MML-1 CDXs and PDXs. MML-1 cells (with the BRAFV600E mutation) and patient cells (with the BRAFV600K mutation) were transplanted s.c. into the mice, and tumors were allowed to grow until they attained a size of 150–200 mm3. The mice were then divided into vehicle and treatment groups, and the tumors were harvested at 3 d posttreatment. (A and D) Tumor size as measured with calipers. The treatment was initialized with PBS and vemurafenib in the food when the tumor size reached 150–200 mm3. (B and E) Weight of tumors harvested and measured 3 d after the treatment. (C and F) Validation of miR-211–5p in cells and extracellular vesicles derived from tumors. The fold change between the nontreated and treated cells and extracellular vesicles was normalized with respect to C. elegans external spike-in miR-39–3p (n = 5 in each group). Data are presented as ± SEM. *P < 0.05, **P < 0.01, ***P < 0.001, ****P < 0.0001. (Figs. 1 and 2 legends for repeated abbreviations.) Vem, vemurafenib.
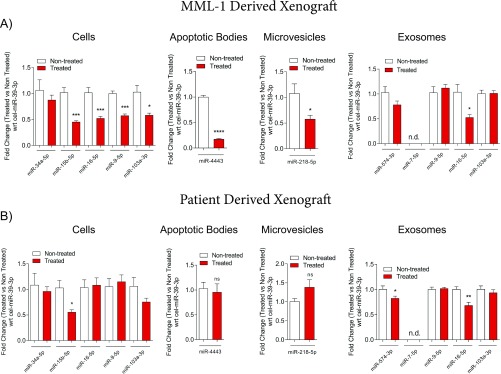
To make our work more clinically significant, we established PDXs by transplanting cells from a BRAFV600K mutated lymph node metastasis that had been surgically removed from a patient with stage IIIC malignant melanoma (18) into the flanks of 10 NOG mice. Tumors in this mouse model also responded to vemurafenib treatment (Fig. 4 D and E), and miR-211–5p was similarly up-regulated in cells and extracellular vesicles (Fig. 4F). We also observed differential expression of the other significantly altered miRNAs from the deep sequencing analysis in cells and extracellular vesicle subsets from the CDXs and PDXs, although the validation was not evident in all settings (Fig. S4 A and B). The levels of miR-211–5p in serum (∼200 µL) of mice bearing tumors and being treated with vemurafenib or dabrafenib, was not quantifiable with qPCR, and thus larger plasma or serum volumes may be required for its detection. Indeed, it is known from analysis of liver perfusates of liver metastatic uveal melanoma that melanoma-associated miRNAs can be detected in circulating exosomes when larger blood volumes are analyzed (19). Future clinical studies could determine whether miR-211–5p can be detected in clinical samples of melanoma patients undergoing BRAF-targeted therapy.
Fig. S4.
BRAF inhibition alters miRNA expression in cells and extracellular vesicles derived from xenografts. (A and B) Validation of miR-15b–5p, miR-34a–5p, miR-9–5p, miR-16–5p, and miR-103a–3p in cells from MML-1 cell-derived and patient-derived xenografts and miR-4443 in apoptotic bodies, miR-218–5p in microvesicles, and miR-574–3p, miR-7–5p, miR-9–5p, miR-16–5p, and miR-103a–3p in exosomes derived from both MML-1 cell-derived and patient-derived xenografts. The fold change in relative miRNA expression is shown with respect to the C. elegans external spike-in miR-39–3p in apoptotic bodies and microvesicles isolated from MML-1 cells and patient-derived xenografts (n = 5 in each group). Data are presented as ± SEM. *P < 0.05, **P < 0.01, ***P < 0.001, ****P < 0.0001.
Together the CDXs and PDXs models demonstrate that miR-211–5p is not only up-regulated upon vemurafenib treatment in our in vitro model but also in tumor cells and their extracellular vesicle subsets in vivo. Importantly, the up-regulation of miR-211–5p was increased severalfold in the PDXs, implying that the increase in miR-211–5p in tumor cells as well as secreted in extracellular vesicles is clinically relevant.
BRAF Inhibition Up-Regulates miR-211–5p Expression Through Master Regulator MITF.
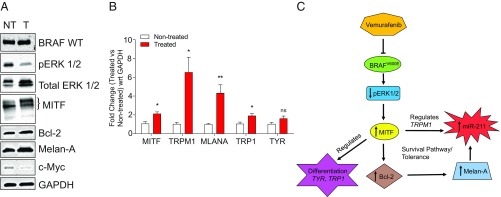
To determine the mechanism behind the increase in miR-211–5p expression after vemurafenib treatment, MML-1 whole-cell lysates from treated and nontreated cells were used to evaluate the genes involved in the MITF pathways in melanoma. It is well known that inhibition of BRAFV600E leads to down-regulation of pERK1/2, which consequently increases the levels of MITF in the nuclear component (20). This was confirmed by Western blot that showed a down-regulation of pERK1/2 and an increase in MITF (Fig. 5A). The increase in MITF was also confirmed with qPCR (Fig. 5B). Furthermore, it has been shown that MITF regulates TRPM1 gene expression as well as the expression of miR-211–5p, as it resides in the sixth intronic region of TRPM1 (21, 22). A significant up-regulation of TRPM1 was confirmed by qPCR (Fig. 5B), which may explain the induced expression of miR-211–5p in the melanoma cells as shown by qPCR in Fig. 3C. Further, high levels of MITF and miR-211 have also been shown to regulate the genes that are involved in the differentiation of melanoma cells (23, 24). This regulation of differentiation was also confirmed by qPCR, and the vemurafenib treatment induced significant changes in the expression of genes involved in differentiation, such as TYR and TRP1 (Fig. 5B). Additionally, it has been shown that the antiapoptotic protein Bcl-2 is a direct target of MITF and that modulation of Bcl-2 regulates Melan-A (25). We therefore also evaluated the expression of Bcl-2 and Melan-A with Western blot and qPCR. Bcl-2 and Melan-A expression was increased after vemurafenib treatment, which suggests that the high MITF levels directly regulate Bcl-2 and thus activate the survival pathway (Fig. 5 A and B). It has previously been shown that this pathway also leads to tolerance toward vemurafenib treatment in melanoma cells by inducing the expression of miR-211–5p in response to Melan-A expression (24). Together these results suggest that inhibition of BRAF by vemurafenib regulates the pERK 1/2 and MITF pathway leading to up-regulation of TRPM1 thus inducing miR-211–5p expression. The activation of this pathway also induces survival pathways, which suggests that tolerance to vemurafenib is induced in the melanoma cells.
Fig. 5.
BRAF inhibition up-regulates miR-211–5p expression by regulating the survival pathways. (A) Immunoblotting of genes involved in survival pathways. The images are representative of three individual experiments. GAPDH was used as the loading control for the cells. (B) Fold change expression of differentiation genes as well as TRPM1 and MITF genes upon vemurafenib treatment as measured by qPCR. GAPDH was used as the internal control (n = 3). (C) Flowchart showing the up-regulation of miR-211–5p upon vemurafenib treatment. Data are presented as ± SEM. *P < 0.05, **P < 0.01. NT, nontreated; ns, nonsignificant; T, treated; wrt, with respect to.
Stable Expression of miR-211–5p Reduces Sensitivity to BRAF Inhibition.
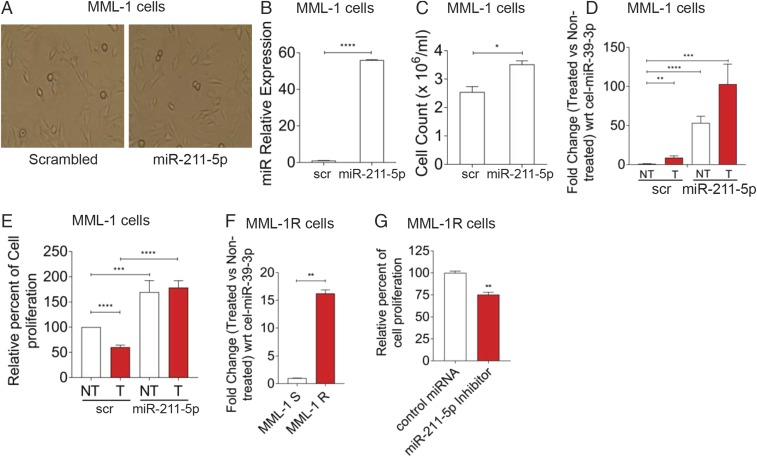
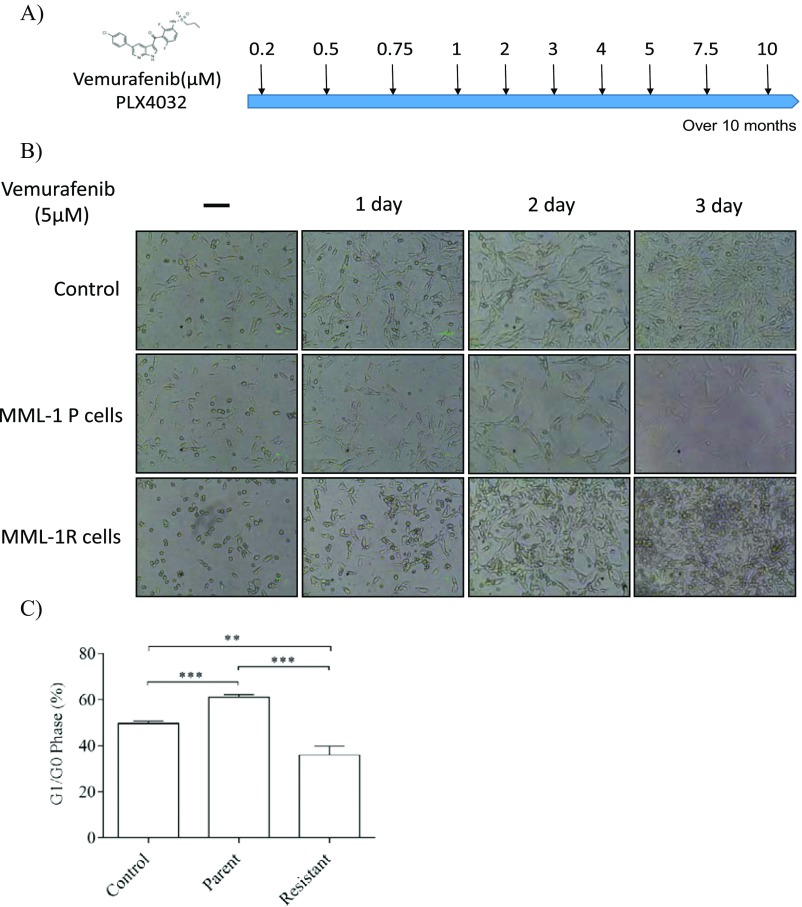
To determine whether stable expression of miR-211 in low-expressing miR-211–5p melanoma cells (26) could reduce the sensitivity toward vemurafenib treatment, MML-1 cells were transfected with miR-211 and scrambled lentiviral vectors and the cells were selected with puromycin, and 100% of the cells were positive for mCherry, which confirmed that only transfected cells were used for downstream analysis. The morphology of the cells was not affected by transfection with miR-211 compared with transfection with a scrambled vector (Fig. 6A). As determined by qPCR analysis, miR-211–5p was overexpressed in miR-211–transfected cells compared with the scrambled cells (Fig. 6B). Furthermore, miR-211–transfected cells showed enhanced proliferation as determined by cell counts after 72 h (Fig. 6C). To determine the mechanism of reduced sensitivity, the transfected cells were treated with vemurafenib and assayed for miR-211–5p expression by qPCR. Indeed, vemurafenib treatment of both scrambled and miR-211–transfected cells increased miR-211–5p expression compared with the nontreated cells (Fig. 6D). Interestingly, we found a 100-fold increase in miR-211–5p expression in vemurafenib-treated miR-211–5p–transfected cells (Fig. 6D), suggesting that vemurafenib regulates either the U6 promoter driving the exogenous expression or the processing of miR-211–5p. Furthermore, the MTT assay showed that treatment with vemurafenib reduced cell proliferation at 72 h in cells transfected with scrambled RNA but not in cells transfected with intact miR-211 (Fig. 6E), suggesting that miR-211–5p up-regulation upon vemurafenib treatment allows these cells to survive and grow into a population of cells that have reduced sensitivity to vemurafenib. To evaluate the expression of miR-211–5p in resistant cells, MML-1 cells were grown in the presence of increasing doses of vemurafenib (0.2 µM–10 µM) over a period of 10 months to generate a vemurafenib-resistant cell line (Fig. S5 A–C). Notably, the miR-211–5p expression was 16-fold significantly higher in resistant cells compared with the sensitive cells (Fig. 6F). Furthermore, inhibition of miR-211–5p in these cells at 24 h decreased cellular proliferation, suggesting the involvement of miR-211–5p in driving the reduced sensitivity to BRAFV600E inhibition in melanoma (Fig. 6G). Overall, these results suggest that miR-211–5p can reduce the sensitivity to vemurafenib treatment in melanoma cells by regulating cellular proliferation.
Fig. 6.
Stable expression of miR-211–5p reduces sensitivity to vemurafenib. (A) Representative images of the MML-1 cells transfected with scrambled (scr) or miR-211 vectors. (B) The relative expression of miR-211–5p in MML-1 cells transfected with the miR-211–expressing lentiviral vector compared with MML-1 cells transfected with the scrambled gene-expressing vector. C. Elegans miR-39–3p was used as the external spike-in control to normalize the expression. (C) Cell counting shows that miR-211–5p–transfected cells proliferate more than the cells transfected with the scrambled gene. Cells were counted with the trypan blue exclusion assay. (D) Fold change in miR-211–5p expression with respect to C. elegans miR-39–3p between the scrambled and miR-211–transfected cells upon vemurafenib treatment. (E) Relative percent cell proliferation measured by MTT assay. The MTT assay was performed after 72 h of vemurafenib treatment. (F) Fold change regulation of miR-211–5p in MML-1R cells compared with the sensitive parental MML-1 cells. The fold change was normalized to the external spiked-in C. elegans miR-39–3p. (G) MML-1R cells were plated onto a 96 well plate at a density of 10,000 cells per well. Cells were transfected with control oligos or miR-211–5p inhibitors and the cellular proliferation was assessed by MTT after 24 h by using absorbance spectrum at 570 nm. All experiments were performed three times independently. Data are presented as ± SEM. *P < 0.05, **P < 0.01, ***P < 0.001, ****P < 0.0001. (Fig. 5 legend for repeated abbreviations.) MML-1R, MML-1 resistant cells; MML-1S, MML-1 sensitive cells.
Fig. S5.
Generation of MML-1 resistant cells. (A) Diagrammatic representation of the generation of MML-1 cells over the period of 10 mo by treating MML-1 cells with increasing doses of vemurafenib (0.2 µM–10 µM). (B) MML-1 parent cells and resistant cells (MML-1R) were treated with vemurafenib (5 µM) to observe the cellular growth at three different time points by microscopy (Scale bars, 10 μm.) (C) Flow cytometry analysis showing the cell cycle arrest at G1/G0 phase. MML-1P, MML-1 parent cells; MML-1R, MML-1 resistant cells. **P < 0.01, ***P < 0.001.
In this study, we found that inhibition of BRAFV600E with vemurafenib (PLX4032) is associated with increased secretion of extracellular vesicles from melanoma cells. We also observed increased secretion of miRNAs, specifically miR-211–5p, which can be significant for melanoma progression. The fact that released extracellular vesicles shuttle significant amounts of functional proteins and biologically active RNA cargo between cells suggests that such communication is likely to be important for melanoma progression. We also discovered that miR-211–5p is induced upon BRAFV600E inhibition in melanoma cells and in certain subsets of vesicles, and that overexpression of miR-211–5p reduces sensitivity to BRAFV600E inhibition in the melanoma cells. Our results indicate that treatment of melanoma cells with an oncogene inhibitor causes significant changes in the RNA cargo in the melanoma cells and in the subsets of extracellular vesicles that they excrete, and such communication might lead to altered gene expression within the population of melanoma cells that reduces sensitivity to the inhibitor and decreases the inhibitor’s efficiency.
We show here that miR-211–5p expression is induced upon BRAFV600E inhibition due to the up-regulation of MITF, and this increase in miR-211–5p expression promotes survival in parent melanoma cells despite a reduction in ERK1/2 activity. This has also been discussed in a study that demonstrated that overexpression of MITF in melanoma cells promotes survival and proliferation (27). Another recent study also suggests that melanosomes, but not exosomes, derived from melanoma cells, transport miR-211 to cancer-associated fibroblasts, and transporting of miR-211 leads to increased proliferation, migration, and proinflammatory gene expression by the fibroblasts (28). Our study adds to the above finding by showing that the expression of miR-211–5p is substantially up-regulated upon vemurafenib treatment in the melanoma cells and in subsets of extracellular vesicles, including exosomes. Our finding of miR-211–5p in subsets of extracellular vesicles still needs to be functionally assessed to determine its possible role in the regulation of cancer progression.
Additionally, miR-211 has been shown to function as a metabolic switch in melanoma cells by targeting the hypoxia inducible factor 1α (HIF-1α), and loss of miR-211–5p is expected to promote cancer hallmarks in human melanomas (29). It was further suggested that miR-211 acts as a molecular switch that is usually turned off in many melanomas, and figuring out how and when to turn this switch on might provide insights into better treatment for melanomas (29, 30). Our finding that miR-211–5p is increased in cells upon vemurafenib treatment could support the development of more targeted therapies against melanoma cells in which miR-211 is up-regulated.
The emergence of BRAF inhibitors is a remarkable clinical success (31). However, the impressive response rates have been tempered by a short duration of response in a majority of patients (31). Until now, no studies have determined the effects of vemurafenib treatment on BRAF mutant melanoma cells or on the molecular contents of their extracellular vesicles. Our data provide a crucial starting point to understand the effects of BRAF inhibition on microRNA expression in the treated cells and their vesicular secretome, which can have implications for the progression and metastasis of malignant melanoma undergoing such treatment.
Materials and Methods
Cell Culture and Extracellular Vesicle Isolation.
The melanoma cell lines MML-1 and A375, both having a BRAFV600E mutation, were cultured as described previously (5). Vemurafenib (PLX4032) and dabrafenib were dissolved in DMSO as recommended by the manufacturer instructions (Selleckchem). MML-1 cells were treated with increasing concentrations of vemurafenib (0–1,000 nM) or dabrafenib (0–3,000 nM) to determine the optimal dose for the treatments. Cells were trypsinized, and cell viability and cell counts were obtained by trypan blue exclusion. For vesicle isolation, cells were first pelleted by centrifugation at 300 × g, and the conditioned medium was then spun at 2,000 × g for 20 min to pellet apoptotic bodies and then at 16,500 × g for 20 min to pellet microvesicles. Finally, after filtration through a 0.22-μm filter, the medium was centrifuged at 120,000 × g for 70 min to pellet exosomes. All of the vesicle-containing pellets were resuspended in PBS or lysed in RNA lysis buffer for further analysis.
Mouse Experiments.
All animal experiments were performed in accordance with European Union directive 2010/63 (Regional Animal Ethics Committee of Gothenburg approval 287/289–12 and 36–2014). Establishment of PDXs was performed as previously described (18). For the establishment of the CDXs, MML-1 cells were suspended in culture media and mixed 1:1 with Matrigel (BD Bioscience), and 2 × 10⁵ cells were transplanted s.c. into the flank of NOD-SCID IL2Rcnull (NOG) mice. Growth of the xenografts was followed by measuring with a caliper, and when the xenografts had increased two measurements in a row, the mice were randomized into two treatment groups, receiving either normal food or fodder containing Zelboraf (vemurafenib, Roche) (240 mg/kg/d; Research Diets Inc.). After 3 d of treatment, tumors were harvested and weighed. In addition, the tumors were dispersed into fine pieces using a tissue chopper, and collagenase D (2 mg/mL) and DNase (400 units/mL) were added and the tumor suspension was incubated for 30 min at 37 °C. The medium with the tumor cells was filtered through a 70-μm filter, and fresh medium containing 10% exosome-depleted FBS and penicillin–streptomycin (10 units/mL) was added to the required volume and cultured for 24 h. The isolation of extracellular vesicles was carried out as described in Cell Culture and Extracellular Vesicles Isolation.
Generation of Vemurafenib-Resistant MML-1 Cells.
To generate vemurafenib-resistant cells, MML-1 cells were cultured in RPMI-1640 growth medium without antibiotics. The concentration of vemurafenib was gradually increased from 0.2 µM to 10 µM for ∼10 mo, which resulted in a resistant cell line called MML-1R.
Flow Cytometry.
MML-1 (parent) and MML-1R cells were plated in 24-well plates at a cell density of 75,000 cells per well. The cells were allowed to adhere overnight and were then treated with vemurafenib at a concentration of 5 µM for 24 h. The cells were then trypsinized, washed with PBS, and labeled with 7-AAD in modified Vindelov’s solution (20 mM Tris pH 8.0, 100 mM NaCl, 1 μg/mL 7-AAD, 20 μg/mL RNase, and 0.1% Nonidet P-40) for 30 min at 37 °C. DNA content was analyzed on a BD Accuri C6 (Becton-Dickinson) using the FL3 channel in logarithmic scale for sub-G1 measurements (apoptosis).
Immunoblotting.
The lysis of extracellular vesicles and protein estimation was carried out using RIPA buffer and the BCA Protein Assay Kit (Pierce, Thermo Scientific) as described previously (5, 32). The primary antibodies used were Melan-A (1:1,000 dilution), Calnexin (1:1,000), CD81 (1:1,000), Bcl-2 (1:1,000), GAPDH (1:1,000), and BRAF (1:1,000) from Santa Cruz Biotechnology; TSG-101 (1:1,000; clone 4A10) from Abcam; c-Myc (1:1,000), β-actin (1:1,000), pERK1/2 (1:1,000), total ERK1/2 (1:1,000), and MITF (1:1,000) from Cell Signaling Technology; and BRAFV600E (1:1,000) from Spring Biosciences. The primary antibodies were incubated with the blot overnight at 4 °C. The membranes were washed three times in Tris buffer saline with 0.1% Tween 20 (TBST) and incubated with secondary antibodies for 1 h at room temperature. The secondary antibodies were ECL anti-rabbit IgG horseradish peroxidase-linked F(ab′)2 fragment (donkey anti-rabbit) and ECL anti-mouse IgG horseradish peroxidase-linked F(ab′)2 fragment (sheep anti-mouse) (GE Healthcare). The membranes were washed again three times for 5 min in TBST buffer and detected and analyzed with ECL Prime Western Blotting Detection (GE Healthcare) and a VersaDoc 4000 MP (Bio-Rad Laboratories).
Small RNA Sequencing and Analysis.
The RNA isolation and sequencing analysis of nontreated MML-1 cells and subsets of extracellular vesicles was performed as previously described (5). The isolation and analysis of treated cells and extracellular vesicles was performed using the same methods as nontreated cells and extracellular vesicles. Cellular RNAs with a RNA integrity number above 8 as measured by the Agilent Bioanalyzer RNA 6000 Nano assay were used for small RNA deep sequencing. Following RNA extraction, libraries were constructed from 50 ng of RNA using the Ion Total RNA-Seq Kit V2 (Life Technologies) and ligated to adapters containing a unique index barcode (Ion Xpress RNA-Seq Barcode 1–16 Kit; Life Technologies) according to the manufacturer’s protocol. The yields and size distributions of the small RNA libraries were assessed using the Agilent 2100 Bioanalyzer instrument with the high-sensitivity DNA chip (Agilent Technologies). Equally pooled libraries were prepared for deep sequencing using the Ion OneTouch System (Life Technologies) and sequenced on the Ion Torrent PGM using Ion 318 V2 chips (Life Technologies) and the Ion PGM 200 V2 Sequencing Kit (Life Technologies). Preprocessing of reads and the removal of adapters and barcodes were performed using Torrent Suite (v.3.4.1). Sequences were analyzed for quality control (FASTQC) and aligned to the human genome (HG19) using Torrent Suite, and files were transferred to Partek Genomic Suite and Flow (Partek, Inc.) for mapping against miRBase V.21 and Ensembl Release 75 to identify miRNA, ncRNA, and coding RNA species. Reads were normalized to reads per million. miRNAs identified with at least 10 reads were used for further analysis in the Partek Genomic suite, which included statistical analysis and hierarchical clustering.
MTT Cell Proliferation Assay.
MML-1 cells were plated on a 96-well plate to determine the dose–response after 72 h of vemurafenib or dabrafenib treatment. A total of 5,000 cells were plated in each well, and MTT was added at the end point to determine the cell viability.
Furthermore, stably expressing miR-211 MML-1 cells and MML-1R cells were also plated in 96-well plates at a seeding density of 5,000 and 10,000 cells per well, respectively. Additionally, the MML-1R cells were transfected with miR-211–5p inhibitors (Exiqon) or control miRNA oligos to determine the physiological relevance of cells by determining the cellular proliferation. Vemurafenib was used to treat both the stably expressing miR-211 MML-1 cells and MML-1R cells, and MTT was added at the end point to determine the cell proliferation.
Validation of miRNAs.
Separate miRNA primer assays (Exiqon) were performed on RNA prepared from MML-1, A375 cells (the same batch of cells used for the isolation of extracellular vesicles as previously published) (5), CDXs, PDXs, and extracellular vesicles. Before cDNA synthesis, all of the samples were treated with DNase (Ambion), deactivated with DNase inactivation buffer, and the RNA was extracted. For cDNA synthesis and qPCR, the protocol was followed as described earlier (5). Caenorhabditis elegans miR-39–3p was used as the normalizing control as an external spike in, and UniSp6 was used as an internal spike-in control. The plate was run on a Bio-Rad CFX96 (Bio-Rad Laboratories) real-time detection system for 40 cycles following the manufacturer’s protocol. Data were analyzed according to the fold-change difference between the treated and nontreated groups using the ΔΔCt method.
Establishment of a Stable miR-211 Expressing Cell Line.
MML-1 cells were transfected for the establishment of a stable miR-211 expressing cell line. MML-1 cells were seeded in six-well dishes and transfected with the modified PLKO.1 vectors using Lipofectamine 2000 (Invitrogen). PLKO-mcherry-luc-puro-shSCR and PLKO-mcherry-luc-puro-miR-211–5p (Addgene plasmids 29780 and 29784, respectively) were a kind gift from Carl Novina, Department of Dermatology, Massachusetts General Hospital, Harvard Medical School, Boston (33). Two days posttransfection, the cells were grown with 1 μg/mL of puromycin (Invitrogen). After 4–6 wk of selection, the cells were used in functional experiments.
Statistical Analysis.
To determine the statistical significance of the RNA and protein content, a two-tailed Student’s paired t test was used to calculate P values. For in vitro qPCR analysis, a paired t test and one-way ANOVA was used, and for in vivo qPCR analysis, an unpaired Mann–Whitney u test was performed. All of the analyses were performed using GraphPad Prism 7.0.
Acknowledgments
This work was funded by the Swedish Research Council [K2014-85x-22504-01-3 (for 2014 and 2015) and K2011-56K-20676-04-6 (for 2013)], the VBG Group Herman Krefting Foundation for Asthma and Allergy Research [20141209 (for 2015), 20131212 (for 2014), and 20121218 for 2013)], the Swedish Heart and Lung Foundation (20120528 for 2013–2015), and the Swedish Cancer Foundation [CAN2014/844 (for 2015) and CAN 2012/690 (for 2013 and 2014)]. A.F.H. is supported by the National Health Medical Research Council of Australia (Program Grant 628946) and the Australian Research Council (ARC Future Fellowship FT100100560). This work was also supported by grants from the Swedish Cancer Society, the Swedish Research Council, the Knut and Alice Wallenberg Foundation, and Region Västra Götaland (to J.A.N.); and grants from the Assar Gabrielsson Foundation, the Sahlgrenska University Hospital Research Grant, and the William and Martina Lundgren Foundation (to T.R.L., B.O.E., and S.V.M.).
Footnotes
Conflict of interest statement: J.L. has written several patents in the field of extracellular vesicles as therapeutics and is currently an employee of Codiak BioSciences, in parallel with his position at the University of Gothenburg. R.O.B. has received honoraria from Roche for lectures.
This article is a PNAS Direct Submission.
This article contains supporting information online at www.pnas.org/lookup/suppl/doi:10.1073/pnas.1705206114/-/DCSupplemental.
References
- 1.Davies H, et al. Mutations of the BRAF gene in human cancer. Nature. 2002;417:949–954. doi: 10.1038/nature00766. [DOI] [PubMed] [Google Scholar]
- 2.Tsai J, et al. Discovery of a selective inhibitor of oncogenic B-Raf kinase with potent antimelanoma activity. Proc Natl Acad Sci USA. 2008;105:3041–3046. doi: 10.1073/pnas.0711741105. [DOI] [PMC free article] [PubMed] [Google Scholar]
- 3.Monsma DJ, et al. Melanoma patient derived xenografts acquire distinct Vemurafenib resistance mechanisms. Am J Cancer Res. 2015;5:1507–1518. [PMC free article] [PubMed] [Google Scholar]
- 4.Kim VN. Small RNAs: Classification, biogenesis, and function. Mol Cells. 2005;19:1–15. [PubMed] [Google Scholar]
- 5.Lunavat TR, et al. Small RNA deep sequencing discriminates subsets of extracellular vesicles released by melanoma cells: Evidence of unique microRNA cargos. RNA Biol. 2015;12:810–823. doi: 10.1080/15476286.2015.1056975. [DOI] [PMC free article] [PubMed] [Google Scholar]
- 6.Fire A, et al. Potent and specific genetic interference by double-stranded RNA in Caenorhabditis elegans. Nature. 1998;391:806–811. doi: 10.1038/35888. [DOI] [PubMed] [Google Scholar]
- 7.Girard A, Sachidanandam R, Hannon GJ, Carmell MA. A germline-specific class of small RNAs binds mammalian Piwi proteins. Nature. 2006;442:199–202. doi: 10.1038/nature04917. [DOI] [PubMed] [Google Scholar]
- 8.Liu Y, et al. Identification of miRNomes in human stomach and gastric carcinoma reveals miR-133b/a-3p as therapeutic target for gastric cancer. Cancer Lett. 2015;369:58–66. doi: 10.1016/j.canlet.2015.06.028. [DOI] [PubMed] [Google Scholar]
- 9.Ren JW, Li ZJ, Tu C. MiR-135 post-transcriptionally regulates FOXO1 expression and promotes cell proliferation in human malignant melanoma cells. Int J Clin Exp Pathol. 2015;8:6356–6366. [PMC free article] [PubMed] [Google Scholar]
- 10.Lázaro-Ibáñez E, et al. Distinct prostate cancer-related mRNA cargo in extracellular vesicle subsets from prostate cell lines. BMC Cancer. 2017;17:92. doi: 10.1186/s12885-017-3087-x. [DOI] [PMC free article] [PubMed] [Google Scholar]
- 11.Mateescu B, et al. Obstacles and opportunities in the functional analysis of extracellular vesicle RNA: An ISEV position paper. J Extracell Vesicles. 2017;6:1286095. doi: 10.1080/20013078.2017.1286095. [DOI] [PMC free article] [PubMed] [Google Scholar]
- 12.Valadi H, et al. Exosome-mediated transfer of mRNAs and microRNAs is a novel mechanism of genetic exchange between cells. Nat Cell Biol. 2007;9:654–659. doi: 10.1038/ncb1596. [DOI] [PubMed] [Google Scholar]
- 13.Crescitelli R, et al. Distinct RNA profiles in subpopulations of extracellular vesicles: Apoptotic bodies, microvesicles and exosomes. J Extracell Vesicles. 2013;2 doi: 10.3402/jev.v2i0.20677. [DOI] [PMC free article] [PubMed] [Google Scholar]
- 14.Bellingham SA, Coleman BM, Hill AF. Small RNA deep sequencing reveals a distinct miRNA signature released in exosomes from prion-infected neuronal cells. Nucleic Acids Res. 2012;40:10937–10949. doi: 10.1093/nar/gks832. [DOI] [PMC free article] [PubMed] [Google Scholar]
- 15.Huang X, et al. Characterization of human plasma-derived exosomal RNAs by deep sequencing. BMC Genomics. 2013;14:319. doi: 10.1186/1471-2164-14-319. [DOI] [PMC free article] [PubMed] [Google Scholar]
- 16.Nolte-’t Hoen EN, et al. Deep sequencing of RNA from immune cell-derived vesicles uncovers the selective incorporation of small non-coding RNA biotypes with potential regulatory functions. Nucleic Acids Res. 2012;40:9272–9285. doi: 10.1093/nar/gks658. [DOI] [PMC free article] [PubMed] [Google Scholar]
- 17.Tomic T, et al. Metformin inhibits melanoma development through autophagy and apoptosis mechanisms. Cell Death Dis. 2011;2:e199. doi: 10.1038/cddis.2011.86. [DOI] [PMC free article] [PubMed] [Google Scholar]
- 18.Einarsdottir BO, et al. Melanoma patient-derived xenografts accurately model the disease and develop fast enough to guide treatment decisions. Oncotarget. 2014;5:9609–9618. doi: 10.18632/oncotarget.2445. [DOI] [PMC free article] [PubMed] [Google Scholar]
- 19.Eldh M, et al. MicroRNA in exosomes isolated directly from the liver circulation in patients with metastatic uveal melanoma. BMC Cancer. 2014;14:962. doi: 10.1186/1471-2407-14-962. [DOI] [PMC free article] [PubMed] [Google Scholar]
- 20.Wellbrock C, Arozarena I. Microphthalmia-associated transcription factor in melanoma development and MAP-kinase pathway targeted therapy. Pigment Cell Melanoma Res. 2015;28:390–406. doi: 10.1111/pcmr.12370. [DOI] [PMC free article] [PubMed] [Google Scholar]
- 21.Mazar J, et al. The regulation of miRNA-211 expression and its role in melanoma cell invasiveness. PLoS One. 2010;5:e13779. doi: 10.1371/journal.pone.0013779. [DOI] [PMC free article] [PubMed] [Google Scholar]
- 22.Boyle GM, et al. Melanoma cell invasiveness is regulated by miR-211 suppression of the BRN2 transcription factor. Pigment Cell Melanoma Res. 2011;24:525–537. doi: 10.1111/j.1755-148X.2011.00849.x. [DOI] [PubMed] [Google Scholar]
- 23.Lekmine F, Chang CK, Sethakorn N, Das Gupta TK, Salti GI. Role of microphthalmia transcription factor (Mitf) in melanoma differentiation. Biochem Biophys Res Commun. 2007;354:830–835. doi: 10.1016/j.bbrc.2007.01.075. [DOI] [PubMed] [Google Scholar]
- 24.Dai X, et al. Regulation of pigmentation by microRNAs: MITF-dependent microRNA-211 targets TGF-β receptor 2. Pigment Cell Melanoma Res. 2015;28:217–222. doi: 10.1111/pcmr.12334. [DOI] [PubMed] [Google Scholar]
- 25.De Luca T, et al. miR-211 and MITF modulation by Bcl-2 protein in melanoma cells. Mol Carcinog. 2016;55:2304–2312. doi: 10.1002/mc.22437. [DOI] [PubMed] [Google Scholar]
- 26.Babapoor S, et al. microRNA in situ hybridization for miR-211 detection as an ancillary test in melanoma diagnosis. Mod Pathol. 2016;29:461–475. doi: 10.1038/modpathol.2016.44. [DOI] [PubMed] [Google Scholar]
- 27.Müller J, et al. Low MITF/AXL ratio predicts early resistance to multiple targeted drugs in melanoma. Nat Commun. 2014;5:5712. doi: 10.1038/ncomms6712. [DOI] [PMC free article] [PubMed] [Google Scholar]
- 28.Dror S, et al. Melanoma miRNA trafficking controls tumour primary niche formation. Nat Cell Biol. 2016;18:1006–1017. doi: 10.1038/ncb3399. [DOI] [PubMed] [Google Scholar]
- 29.Mazar J, et al. MicroRNA 211 functions as a metabolic switch in human melanoma cells. Mol Cell Biol. 2016;36:1090–1108. doi: 10.1128/MCB.00762-15. [DOI] [PMC free article] [PubMed] [Google Scholar]
- 30.Margue C, et al. New target genes of MITF-induced microRNA-211 contribute to melanoma cell invasion. PLoS One. 2013;8:e73473. doi: 10.1371/journal.pone.0073473. [DOI] [PMC free article] [PubMed] [Google Scholar]
- 31.Flaherty KT, et al. Inhibition of mutated, activated BRAF in metastatic melanoma. N Engl J Med. 2010;363:809–819. doi: 10.1056/NEJMoa1002011. [DOI] [PMC free article] [PubMed] [Google Scholar]
- 32.Lunavat TR, et al. RNAi delivery by exosome-mimetic nanovesicles: Implications for targeting c-Myc in cancer. Biomaterials. 2016;102:231–238. doi: 10.1016/j.biomaterials.2016.06.024. [DOI] [PubMed] [Google Scholar]
- 33.Levy C, et al. Intronic miR-211 assumes the tumor suppressive function of its host gene in melanoma. Mol Cell. 2010;40:841–849. doi: 10.1016/j.molcel.2010.11.020. [DOI] [PMC free article] [PubMed] [Google Scholar]


