Abstract
Background
Primary progressive aphasia (PPA) is a neurodegenerative aphasic syndrome with three distinct clinical variants: non-fluent (nfvPPA), logopenic (lvPPA), and semantic (svPPA). Speech (non-) fluency is a key diagnostic marker used to aid identification of the clinical variants, and researchers have been actively developing diagnostic tools to assess speech fluency. Current approaches reveal coarse differences in fluency between subgroups, but often fail to clearly differentiate nfvPPA from the variably fluent lvPPA. More robust subtype differentiation may be possible with finer-grained measures of fluency.
Aims
We sought to identify the quantitative measures of speech rate—including articulation rate and pausing measures—that best differentiated PPA subtypes, specifically the non-fluent group (nfvPPA) from the more fluent groups (lvPPA, svPPA). The diagnostic accuracy of the quantitative speech rate variables was compared to that of a speech fluency impairment rating made by clinicians.
Methods and Procedures
Automatic estimates of pause and speech segment durations and rate measures were derived from connected speech samples of participants with PPA (N=38; 11 nfvPPA, 14 lvPPA, 13 svPPA) and healthy age-matched controls (N=8). Clinician ratings of fluency impairment were made using a previously validated clinician rating scale developed specifically for use in PPA. Receiver operating characteristic (ROC) analyses enabled a quantification of diagnostic accuracy.
Outcomes and Results
Among the quantitative measures, articulation rate was the most effective for differentiating between nfvPPA and the more fluent lvPPA and svPPA groups. The diagnostic accuracy of both speech and articulation rate measures was markedly better than that of the clinician rating scale, and articulation rate was the best classifier overall. Area under the curve (AUC) values for articulation rate were good to excellent for identifying nfvPPA from both svPPA (AUC=.96) and lvPPA (AUC=.86). Cross-validation of accuracy results for articulation rate showed good generalizability outside the training dataset.
Conclusions
Results provide empirical support for (1) the efficacy of quantitative assessments of speech fluency and (2) a distinct non-fluent PPA subtype characterized, at least in part, by an underlying disturbance in speech motor control. The trend toward improved classifier performance for quantitative rate measures demonstrates the potential for a more accurate and reliable approach to subtyping in the fluency domain, and suggests that articulation rate may be a useful input variable as part of a multi-dimensional clinical subtyping approach.
Keywords: PPA, subtyping, fluency, speech rate, articulation rate
Introduction
Primary progressive aphasia (PPA) is a neurodegenerative aphasic syndrome characterized by a primary language impairment, and relative preservation of non-linguistic cognitive function. PPA can be further classified into three main variants: agrammatic/non-fluent (nfvPPA), logopenic (lvPPA), and semantic (svPPA). The distribution of neuropathology, and consequently the type of language impairment (e.g., agrammatism, word-finding difficulties, naming impairments) vary according to subtype (Mesulam, 2007; Rogalski et al., 2011). Performance across multiple speech and language domains are central components to the differential diagnosis of PPA subtypes, making language phenotype a primary determiner of subtype assignment (Gorno-Tempini et al., 2011). Recent research has also demonstrated an association between clinical subtype—as determined by language phenotype—and underlying biological pathology (Grossman, 2010; Mesulam et al., 2014). This makes language-based subtyping important for advancing ongoing efforts to identify the neural basis of PPA, in addition to its value in informing differential subtype diagnosis.
The language-based classification criteria for PPA subtypes assess performance in several speech and language domains, of which speech fluency is a primary one (Ballard et al., 2014; Fraser et al., 2014; Wilson et al., 2010). Speech fluency and non-fluency are variably defined in the aphasia literature, with definitions based on a wide range of speech characteristics, including speech rate, articulatory accuracy, articulatory effort, phrase length, pausing, and prosody (Ash et al., 2010; Kerschensteiner, Poeck, & Brunner, 1972). In the PPA literature, definitions of non-fluency center primarily on slowed rate of speech, increased numbers of speech sound errors, and reduced and/or agrammatic verbal output (Gorno-Tempini et al., 2011; Wilson et al., 2010). These markers of speech fluency are generally accepted by the aphasia community and are distinct from those used in the speech motor literature, which primarily focus on the suprasegmental features of speech associated with stuttering, such as blocks, repetitions, and prolongations (O'Brian, Packman, Onslow, & O'Brian, 2004). The identification of non-fluent speech is crucial to subtype assignment in PPA because non-fluent or apraxic speech—typified by slow, halting speech and/or speech sound errors—is a core feature of nfvPPA, in addition to agrammatism (Gorno-Tempini et al., 2011). In contrast, lvPPA and svPPA are typically characterized as more fluent subtypes (Catani et al., 2013; Mesulam, 2007), though lvPPA patients are often described as having variable or intermediate fluency depending on the lexical constraints of the exchange (Gorno-Tempini et al., 2008; Rohrer, Rossor, & Warren, 2012; Teichmann et al., 2013; Thompson et al., 2012). Spared motor speech, characterized by the absence of apraxia of speech and other motor speech impairments, is considered a characteristic of both lvPPA and svPPA according to the consensus criteria (Gorno-Tempini et al., 2011).
Because speech (non-)fluency is a key diagnostic marker used to aid identification of clinical subtypes, researchers have been actively developing diagnostic tools to assess speech fluency, using both clinical rating scales and quantitative analyses. Sapolsky and colleagues (2010) proposed a clinician rating scale that included a fluency domain, and established the validity of the scale using correlative analyses relating clinician judgment to relevant standardized test scores (e.g., WAB Fluency in the fluency domain). However, the broad operational definition of fluency (e.g., clinicians are asked to rate features as diverse as speech rate, phrase length, and presence of hesitations/fillers) can prove a significant limitation. In response to that limitation, Several quantitative metrics of speech fluency have also been proposed, including the rate of speech (Ash et al., 2010; Fraser et al. 2014; Wilson et al., 2010) and/or the type and number of sound distortions (Ash et al., 2010; Croot, Ballard, Leyton, & Hodges, 2012; Sajjadi, Patterson, Tomek, & Nestor, 2010; Wilson et al., 2010). Although these measures reveal coarse differences between subgroups, they are less effective for differentiating nfvPPA from the variably fluent lvPPA (Sajjadi et al., 2012). More robust subtype classification may be possible with finer-grained measures of speech rate (Ballard et al., 2014; Wilson et al., 2010) that distinguish between the amount of pausing versus the rate of articulator movement, both of which can affect overall speech rate. As an example, a global measure of speech rate was not as effective in differentiating nfvPPA from both svPPA and lvPPA as was a measure of maximum speech rate, which approximates an articulation rate measure by calculating rate (words/minute) over a speech period with minimal pausing (Wilson et al., 2010).
Prior research suggests the potential for a speech rate measure to be a reliable indicator of non-fluent speech in the PPA population, which could provide an effective basis for differentiation of nfvPPA from both lvPPA and svPPA. The use of speech rate as a metric for speech non-fluency has several advantages: it is objective, automatable and most importantly, conveys information about both the motor speech system as well as higher-level cognitive and linguistic processing. In terms of the motor speech system, speakers can alter their rate of speech by changing the speed of movement or displacement of the articulators (Campbell & Dollaghan, 1995; Nip & Green, 2013). Speakers can also alter speech rate by changing the amount of time spent pausing, where pausing reflects higher-level cognitive/linguistic functioning (e.g., due to word finding, sentence planning difficulties). This decomposition of speech rate yields the subcomponent measures of articulation rate and pause amount, which represent motor and cognitive/linguistic contributions to speech, respectively.
To our knowledge, no research has looked specifically at the subcomponent measures of speech rate—including (1) articulation rate and (2) pausing measures—across all three main PPA variants. Separating out articulation rate from pausing will provide theoretically relevant information about the sources of non-fluency across groups, specifically whether these are primarily motor or cognitive/linguistic in nature. This may prove an especially useful approach for distinguishing between lvPPA individuals—for whom overall speech rate may be slowed due to increased pausing associated with word-finding problems, and nfvPPA individuals—for whom overall speech rate may be slowed due to reduced speed of articulator movement secondary to a motor speech impairment. Over and above this theoretical utility, the use of quantitative subcomponent measures of speech rate for clinical applications is particularly appealing because they can be automatically and reliably extracted from continuous speech samples (Green, Beukelman, & Ball, 2004).
The main goal of the current study is to compare the diagnostic efficacy of quantitative measures of speech rate to clinician ratings of fluency for identifying nfvPPA. Our hypothesis is that the subcomponent measures of speech rate better differentiate PPA subtypes (especially nfvPPA from the non-motor speech impaired lvPPA and svPPA groups) than do clinical rating scales or extant measures used to quantify speech fluency. For this analysis, we identified the quantitative measures of speech rate that best differentiated PPA subtypes, specifically the non-fluent group (nfvPPA) from the more fluent groups (lvPPA, svPPA). Second, we determined if the diagnostic accuracy of these select quantitative speech rate variables was greater than that of ratings of speech fluency impairment made by clinicians (Sapolsky et al., 2010). We hypothesized that quantitative rate measures will identify nfvPPA with greater accuracy than will the subjective clinician ratings, and that both types of measures will perform significantly better than chance identification. We predict diagnostic accuracy to be greatest for the articulation rate measure, because this measure is sensitive to the motor speech deficits that characterize many patients in the nfvPPA population.
Methods
Participants
Participants included individuals with a diagnosis of PPA (N= 38; 11 nfvPPA, 14 lvPPA, 13 svPPA) recruited through the Massachusetts General Hospital (MGH) Frontotemporal Disorders Unit PPA Program and healthy age-matched controls (N =8) enrolled as part of a larger study in the Speech and Feeding Disorders Lab at the MGH Institute of Health Professions. A diagnosis of PPA, and subsequent subtype classification, was made by consensus after extensive clinical assessments by an experienced neurologist and speech language pathologist (SLP) as described elsewhere (Sapolsky et al., 2010) based on published consensus criteria (Gorno-Tempini et al., 2011). These evaluations included behavioral observations of a patients' spontaneous speech and language and a structured interview with the patient and an informant (both neurologist and SLP), a neurological exam and cognitive assessment (neurologist), and a formal speech-language evaluation (SLP), which consisted of a battery of tests evaluating expressive and receptive language abilities (e.g., syntax, lexical retrieval, confrontation naming, repetition). For the nfvPPA group, participants met one of two core inclusion criteria: (1) agrammatism and/or (2) apraxia of speech. Diagnosis of either agrammatism or apraxia of speech was made by the speech-language pathologist (MQ) based on specified criteria, as described below. All 11 nfvPPA participants were judged clinically by the speech-language pathologist to have at least mild features of agrammatism. This judgment was based on qualitative assessment of agrammatic features (e.g., incorrect word order, omission of functor words or grammatical markers) in spontaneous speech and during a picture description task, as well as scores from the Northwestern Anagram Test (NAT; Thompson, Weintraub, & Mesulam, 2012). Ten of the 11 nfvPPA participants were judged to have at least mild apraxia of speech. This designation was based on a qualitative auditory-perceptual judgment of speech during a repetition task, cascading word length task (e.g., love, loving, lovingly), AMRs/SMRs, and spontaneous speech sample. Apraxic speech features assessed included presence of sound distortions, inaccurate/slow AMRs, increased sound distortions with increased syllable length/complexity, effortful speech, and articulatory groping (Strand, Duffy, Clark, & Josephs, 2014). One nfvPPA participant was judged to have dysarthric features in addition to apraxia of speech and agrammatism. The clinician's judgment of dysarthria was based on observations of a strained-strangled voice quality, hypernasality, and imprecise consonantal targets (Duffy, 2013). No participants in the lvPPA or svPPA groups were judged to have either apraxia of speech or dysarthria.
If multiple longitudinal samples for a single patient were available, only the first sample was selected for analysis. Exclusionary criteria for participants included prior history of stroke and other non-degenerative pathologies. Severity was measured for participants with PPA using the sum of boxes score on the Progressive Aphasia Severity Scale (PASS) (Sapolsky et al., 2010). A one-way ANOVA indicated that PPA subtype groups were not significantly different in terms of overall disease severity (Table 1). Measures of reliability and validity of PASS ratings across several domains have been previously reported (Sapolsky et al., 2010). In the current study, the reliability of PASS ratings in the Fluency domain were checked for a subset of patient population (18/38 participants). There were a total of three unique rater pairs: neurologist (BCD) / speech language pathologist (DS), speech language pathologist (DS) / speech language pathologist (MQ), speech language pathologist (MQ) / speech-language pathology graduate student (CC). Weighted Cohen's kappa (κw) per rater pair were 1.0 (BCD/DS), .78 (DS/MQ), and .83 (MQ/CC). The overall index of inter-rater agreement was judged acceptable at .87, calculated as the arithmetic mean of κw across the three rater pairs, following Light (1971).
Table 1.
Participant demographic information
| PPA | Normal controls (NC) | Omnibus significance | |||
|---|---|---|---|---|---|
| nfvPPA | lvPPA | svPPA | |||
| Age (yrs) | 66.4 ±11.40 | 71.8 ±7.75 | 66.0 ±9.03 | 61.7 ±8.44 | ns |
| Sex (M/F) | 6/5 | 9/5 | 4/9 | 4/4 | ns |
| Education (yrs) | 16.6=3.29 | 16.9 ±2.45 | 17.2 ±2.38 | 15.8 ±0.71 | ns |
| Severity (PASS SoB) | 6.05 ±4.44 | 6.43 ±3.89 | 5.73 ±2.64 | -- | ns |
PASS SoB= Progressive Aphasia Severity Scale sum of boxes score
Age-matched healthy controls were also included for analysis. These participants were screened for exclusionary medical history as well as basic speech, language, hearing, and cognitive functioning, and were determined to be unimpaired in all domains. The experimental and control groups were matched for age and education. One-way ANOVAs showed no significant difference between any groups in age or education level. Table 1 summarizes all participant demographic information.
Materials and collection
Participants were shown the black and white picnic scene picture of the Western Aphasia Battery (Kertesz, 1982) and asked to use sentences to describe the picture. No further prompting was given by the clinician except in cases where the participant's initial response was less than 30 seconds; in this case, the clinician prompted the participant by asking, “Can you tell me anything else about the picture?” The clinician did not provide explicit feedback on participant response during or after administration. Participants were given no maximum time limit for this task. Participants' descriptions were audio recorded using an Olympus VN-702PC digital recorder placed on a table approximately one foot in front of the participant (PPA participants) or a Countryman B3P4FF05B B3 head-mounted omnidirectional microphone positioned approximately 5 cm from the mouth (control participants).
Preprocessing of speech recordings
Audio samples were parsed in Adobe Audition 2.0 using an initial cut point immediately prior to the first content word and a final cut point immediately following the last content word. All instances of clinician cross-talk were deleted from the file. Parsed samples were noise-reduced (also in Audition 2.0) and any filled pause (e.g., um, uh) or non-speech vocalization (e.g., laughter, audible breathing) were manually zeroed in the waveform.
Extraction of quantitative fluency measures
The preprocessed audio were then analyzed using a MATLAB-based program, Speech Pause Analysis (SPA), which algorithmically estimated speech and pause segments in continuous speech based on a minimum pause (100ms; Fletcher, 2010), a minimum speech duration (25ms), and a signal amplitude threshold (Green et al., 2004). The amplitude threshold is defined as the amplitude value that is 3SD above the amplitude values obtained from a section of the recording that was identified by the analyst as a pause. In the first step of automated processing, the segments of the waveform that are below the signal amplitude threshold were classified as pauses, and segments above that threshold were classified as speech events. Then, speech and pause estimates were refined based on the minimum pause and speech durations criteria where all speech events less than 25ms were adjoined to its nearest speech event neighbor, and all pause events less than 100ms were removed to adjoin the two flanking speech events.
Manual transcriptions of each participant's audio samples were done using English orthography, and syllables were counted per transcription using an online syllable-counting tool (http://www.online-utility.org/text/analyzer.jsp). True words, phonemic paraphasias, and phonetically distorted words were all counted toward the overall syllable count. Unintelligible sequences—as judged by the transcriber—were not counted toward the syllable count. For repeated syllables, words and short phrases (≤ 3 words), only the first occurrence was counted. In a case where a phonemic paraphasia preceded a real word self-correction, it was considered a repetition, and only the first occurrence was counted.
Syllable counts and automatic SPA output regarding the frequency and duration of pause and speech events were combined to derive the following quantitative measures of speech fluency: speech rate, articulation rate, proportion speech/pause, mean pause duration, and pause event frequency. Table 2 lists all the quantitative fluency measures and their mathematical derivation.
Table 2.
Quantitative fluency measures
| Variable Name | Derivation |
|---|---|
| Speech rate | = # total syllables / total response duration (s) |
| Articulation rate | = # total syllables / total speech duration (s) |
| Mean pause duration | = total pause duration (s) / # pause events |
| Proportion pause | = total pause duration (s) / total response duration (s) |
| Pause event frequency | = # pause events / total response duration (s) |
Progressive Aphasia Severity Scale
The current study compared the quantitative fluency measures in Table 2 to a set of subjective clinician rating scales, known as the Progressive Aphasia Severity Scale (PASS; Sapolsky et al., 2010). The PASS is an instrument currently in use by some clinicians to rate severity of impairment across ten primary speech and language domains—articulation, fluency, syntax, word retrieval and expression, repetition, auditory comprehension, single word comprehension, reading, writing and functional communication. Impairment in each domain is rated from normal/no impairment to severe impairment on a 0–3 interval scale. Severity ratings across all PASS domains can be summed to yield a sum of boxes score representing overall severity. A fluency domain subscore was also obtained from the PASS, which reflected a clinician's estimation of speech fluency in terms of perceived rate of speech, phrase length, and number/frequency of hesitations and fillers.
Statistical analyses
Statistical analyses were conducted to (1) identify which variables differentiated PPA subgroups (2) determine the sensitivity and specificity of differentiating variables and (3) evaluate diagnostic accuracy of differentiating variables using estimates of the area under the curve (AUC), cross-validated AUC (cvAUC), and partial area under the curve (pAUC). Both full-set and cross-validated AUC values are reported to maximize the comparability of current results with previously reported statistics.
A series of one-factor ANOVAs were run using the R statistical software (R Development Core Team, 2015) to detect significant group differences in each of the experimental variables, with post-hoc tests (Tukey HSD) conducted as appropriate. Receiver operating characteristic (ROC) analyses were also conducted to generate AUC values as approximate measures of the diagnostic accuracy (DeLong, DeLong, & Clarke-Pearson, 1988; Robin et al., 2011). Because ROC analysis assumes a binary classification, a series of pairwise subgroup comparisons (i.e., nfvPPA~lvPPA, nfvPPA~svPPA, nfvPPA~NC) was conducted. Significance testing of AUC values was done using the pROC package (Robin et al., 2014) in R. Sensitivity, specificity, accuracy, cvAUC and pAUC were also calculated as part of ROC analyses (Lopez-Raton, Rodriguez-Alvarez, Cadarso-Suárez, & Gude-Sampedro, 2014). Cross-validated AUC was computed using a k-fold cross-validation technique as part of the DAAG package (Maindonald & Braun, 2012). pAUC was calculated for a restricted low-FPR range [(0,0.2)] and is reported as both an uncorrected raw value and a corrected value. This corrected value is standardized such that 1 is the maximum AUC and .5 represents the non-discriminant AUC in the designated region (Robin et al., 2014).
Results
Table 3 gives summary statistics for each of the quantitative fluency measures, as well as the PASS Fluency clinician rating scale.
Table 3.
Mean, standard deviation and significance for quantitative fluency measures
| p-value | nfvPPA (n=11) | lvPPA (n=14) | svPPA (n=13) | NC (n=8) | |
|---|---|---|---|---|---|
| Speech rate (syll/s) | <.001 | .93±.46c,d | 1.51 ±.55c,d | 2.16 ±.81a,b | 2.88 ±.5a,b |
| Articulation rate (syll/s) | <.001 | 2.35 ±.75b,c,d | 3.53 ±.64a,d | 4.13 ±.69a | 4.78±.32a,b |
| Mean pause duration (s) | .001 | 1.25 ±.55c,d | .91 ±.34 | .77 ±.33a | .50 ±.19a |
| Proportion pause | .002 | .61 ±.13d | .58 ±.12d | .49 ±.14 | .40 ±.09a,b |
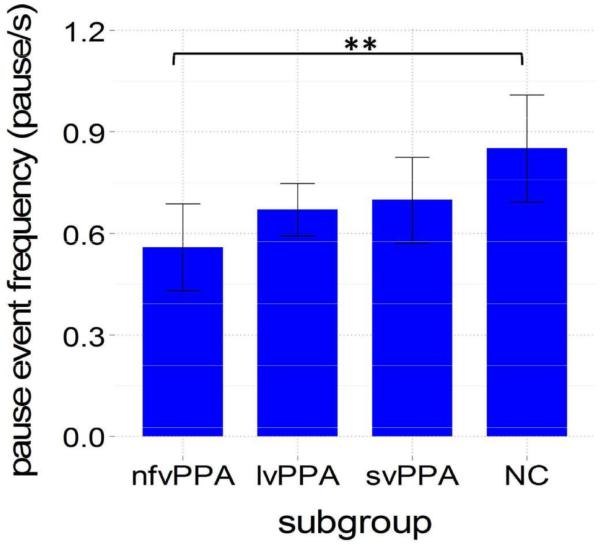
| Pause event frequency (#pause/s) | .014 | .56 ±.19d | .67 ±.13 | .70 ±.21 | .85 ±.20a |
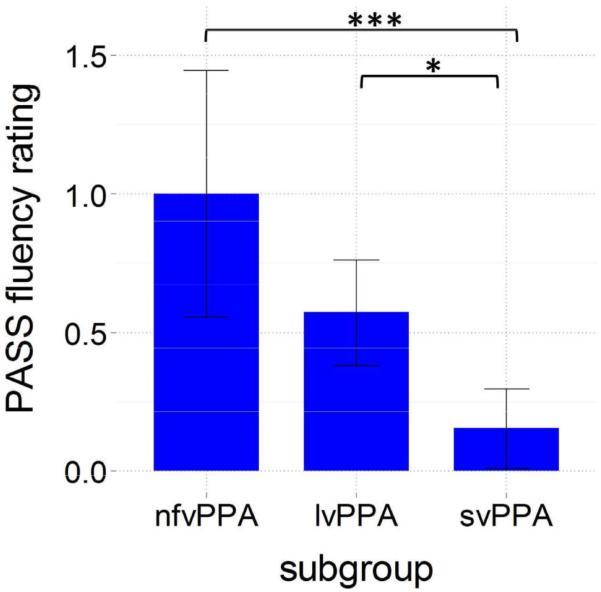
| PASS Fluency rating | <.001 | 1.0 ±.67c | .57 ±.33c | .15 ±.24a,b | -- |
NC = Normal controls. p-value refers to overall between-groups significance per variable. Superscript letters denote post-hoc significance relative to the anfvPPA blvPPA csvPPA and dNC at p<0.05. PASS Fluency rating range: 0 (normal/no impairment), .5 (questionable/very mild impairment), 1 (mild impairment), 2 (moderate impairment), and 3 (severe impairment).
Speech measures
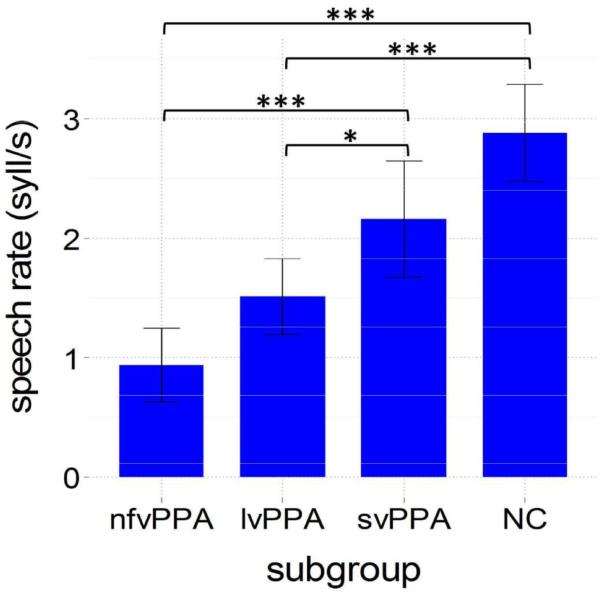
Speech measures included speech rate and articulation rate. Speech rate was a significant groups differentiator, F(3,42)=18.22, p<.001, as was articulation rate, F(3,42)=25.71, p<.001. All PPA subgroups had a lower overall speech rate when compared to normal controls (Figure 1), though this difference was significant only for nfvPPA (p<.001) and lvPPA (p<.001) groups. Within the PPA groups, svPPA individuals had significantly higher speech rates as compared to either lvPPA (p=.04) or nfvPPA (p<.001) individuals. Although speech rates were lowest for nfvPPA individuals, they were not statistically differentiable from lvPPA.
Figure 1.
Speech rate for each subgroup. NC = normal controls; Error bars = 95% CI; ***p<.001, **p<.01,*p<.05.
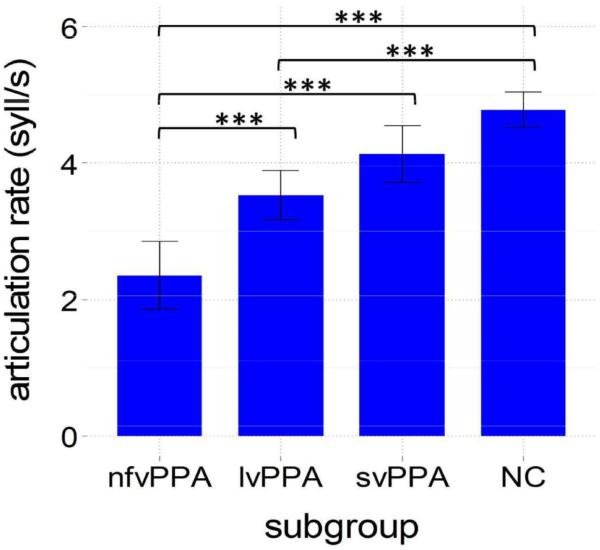
Articulation rate showed a step-wise trend similar to speech rate, with the rate for nfvPPA significantly decreased relative to lvPPA (p<.001), svPPA (p<.001) and normal controls (p<.001; Figure 2). Articulation rate was also significantly decreased for lvPPA individuals compared to normal controls (p<.001). There was no significant difference in articulation rate between lvPPA and svPPA, or between svPPA and normal controls.
Figure 2.
Articulation rate for each subgroup. NC = normal controls; Error bars = 95% CI; ***p<.001, **p<.01,*p<.05.
Pause measures
Pause measures included proportion pause and component submeasures of mean pause duration and pause event frequency. Proportion pause was a significant between-groups differentiator, F(3,42)=5.47, p=.002, along with both mean pause duration, F(3,42)=6.50, p=.001, and pause event frequency, F(3,42)=3.97, p=.014. Importantly, mean pause duration was the only pause measure to significantly differentiate among any of the PPA subgroups.
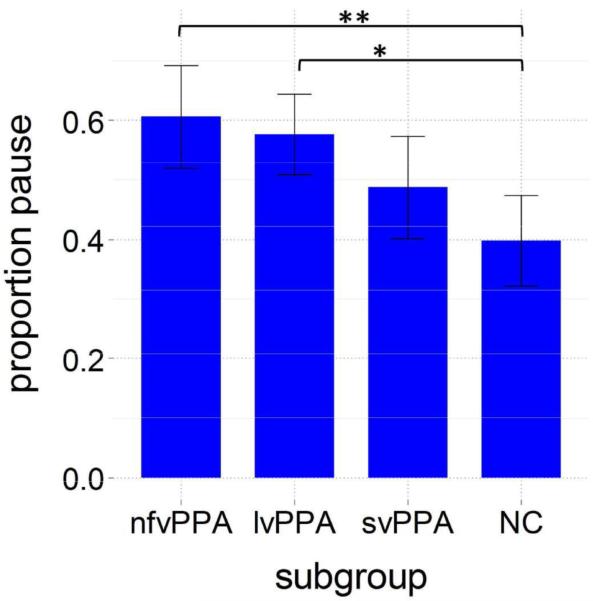
Overall, nfvPPA and lvPPA groups paused for a greater proportion of total response times (i.e., pause + speech time) compared to normal controls. Proportion pause time did not differentiate among PPA subgroups, although svPPA individuals paused for the smallest proportion of time compared to lvPPA and nfvPPA (Figure 3).
Figure 3.
Proportion pause for each subgroup. NC = normal controls; Error bars = 95% CI; ***p<.001, **p<.01,*p<.05.
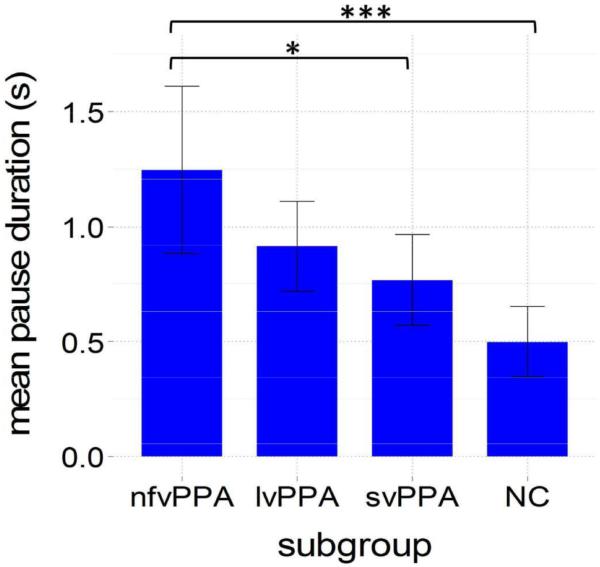
Mean pause duration was a significant group differentiator overall (Figure 4), showing a step-wise trend in the opposite direction as speech and articulation rate. Average pause times were longer for nfvPPA relative lvPPA, svPPA and normal controls; however, only the nfvPPA and svPPA groups were statistically differentiable (p=.02)
Figure 4.
Mean pause duration for each subgroup. NC = normal controls; Error bars = 95% CI; ***p<.001, **p<.01,*p<.05.
The nfvPPA group paused less frequently than lvPPA, svPPA and normal controls, although between-groups differences for the pause event frequency measure were significant only for the nfvPPA groups relative to the normal controls (Figure 5). Taken together, pause measure results show that the nfvPPA group is pausing less frequently, but for a longer (per pause) duration, compared to other groups. The opposite directional trends of component pause measures accounts for the non-significant finding with regards to the gross proportion pause measure.
Figure 5.
Pause event frequency for each subgroup. NC = normal controls; Error bars = 95% CI; ***p<.001, **p<.01,*p<.05.
PASS Fluency subscale rating
The PASS Fluency subscale rating significantly differentiated PPA subgroups overall, F(2,35)=11.3, p<.001. Mean PASS Fluency ratings were marginally higher (indicating greater impairment) for nfvPPA compared to both lvPPA (p=.05) and substantially higher for nfvPPA compared to svPPA (p<.001). Mean PASS Fluency ratings were also higher for lvPPA compared to svPPA (p=.045; Figure 6).
Figure 6.
PASS fluency rating for each subgroup (clinical groups only). Error bars = 95% CI; ***p<.001, **p<.01,*p<.05.
Classifier performance
Sensitivity, specificity and ROC analyses were conducted for the speech rate and articulation rate measures because these variables were the best between-groups differentiators (p<.001). For comparison, the same set of analyses was conducted for the PASS Fluency subdomain measure, which was also a good between-groups differentiator (p<.001). Each measure was treated as an independent classifier, and analyses focused exclusively on groups comparisons relative to nfvPPA (i.e., nfvPPA~lvPPA, nfvPPA~svPPA, nfvPPA~NC).
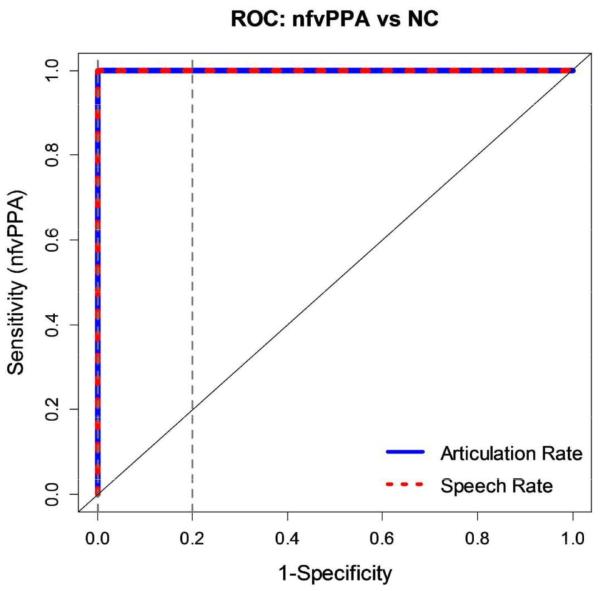
Sensitivity, specificity and accuracy values are reported in Table 4. The overall accuracy in identifying nfvPPA versus lvPPA was greatest for the articulation rate measure (92%). Values for both sensitivity (82%) and specificity (100%) suggested good to excellent discriminant accuracy. Sensitivity and specificity values for differentiating nfvPPA from svPPA were likewise high for the articulation rate measure (82%, 100%, respectively) and speech rate measure (91%, 85 %, respectively). Sensitivity and specificity values for differentiating nfvPPA from normal controls were 100% for both the articulation and speech rate measures.
Table 4.
Classifier performance of select fluency measures
| Groups Comparison | Sensitivity (%) | Specificity (%) | Accuracy (%) | AUC | cvAUC | pAUC uncorrected/corrected | ||
|---|---|---|---|---|---|---|---|---|
| AR | nfvPPA | lvPPA | 81.8 | 100.0 | 92.0 | 0.86 | .84 | .16/.90 |
| svPPA | 81.8 | 100.0 | 91.7 | 0.96 | .83 | .17/.91 | ||
| NC | 100.0 | 100.0 | 100.0 | 1.00 | .95 | .20/1.00 | ||
| SR | nfvPPA | lvPPA | 90.9 | 78.6 | 84.0 | 0.83 | .76 | .09/.68 |
| svPPA | 90.9 | 84.6 | 87.5 | 0.94 | .79 | .15/.87 | ||
| NC | 100.0 | 100.0 | 100.0 | 1.00 | .90 | .20/1.00 | ||
| PASS | nfvPPA | lvPPA | 27.3 | 100.0 | 68.0 | 0.66 | .56 | .07/.63 |
| svPPA | 100.0 | 61.5 | 79.2 | 0.90 | .67 | .12/.78 | ||
| NC | -- | -- | -- | -- | -- | -- | ||
AR=Articulation rate, SR=Speech rate, PASS=PASS Fluency subscore. Sensitivity = True Positive (TP)/(TP +False Negative (FN)), Specificity = True Negative (TN)/(TN + False Positive (FP)), Accuracy = (TN + TP)/(TN+TP+FN+FP). AUC= Area under the curve, cvAUC= Cross-validated AUC. pAUCuncorrected =absolute AUC for FPR [0, 0.2]. pAUCcorrected =scaled AUC for FPR [0.0.2] using McClish correction (Maindonald & Braun, 2012)
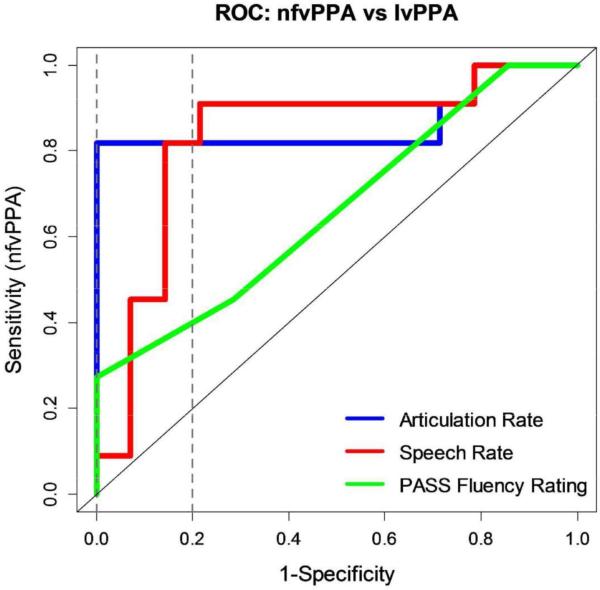
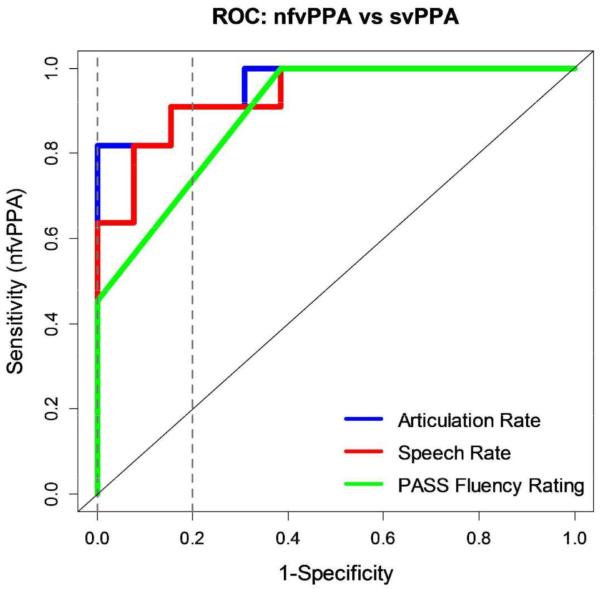
ROC curves for each pairwise group comparison are shown in Figures 7–9. Table 4 gives corresponding AUC values per classifier for each of the group comparisons. In differentiating nfvPPA from lvPPA, articulation rate was the best-performing classifier (AUC=.86), followed closely by the speech rate classifier (AUC=.83), and finally the PASS Fluency classifier (AUC=.66). In differentiating nfvPPA from svPPA, articulation rate was again the best-performing classifier (AUC=.96), followed closely by both the speech rate (AUC=.94) and PASS Fluency classifiers (AUC=.90). Speech and articulation rate perfectly differentiated (AUC=1.00) nfvPPA from normal controls.
Figure 7.
ROC curve for nfvPPA vs. lvPPA. Dashed vertical lines correspond to restricted false positive range (FPR; 0,0.2).
Figure 9.
ROC curve for nfvPPA vs. NC. Dashed vertical lines correspond to restricted false positive range (FPR; 0,0.2).
Although articulation rate and speech rate classifiers outperformed the PASS Fluency classifier in differentiating nfvPPA from both of the more fluent subtypes, no differences in AUC values were significant, possibly owing to the small sample size.
To evaluate generalizability of classifier performance, all ROC analyses were cross-validated using a k-fold (k=5) cross-validation technique. This approach yielded adjusted AUC estimates for each of the classifiers (Table 4). These estimates, though marginally lower than full-set AUCs, suggest good predictive performance for the articulation rate classifier (AUC=.84), fair performance for the speech rate classifier (AUC=.76) and relatively poorer performance for the PASS Fluency clinician rating scale classifier (AUC=.56) in identifying nfvPPA from lvPPA.
Partial AUC (pAUC) was estimated for a clinically relevant False Positive Rate (FPR; = (1−Specificity)) range (Dodd & Pepe, 2003)1. Table 4 gives pAUC values calculated for each of the three classifiers using a restricted FPR range (FPR [0–.2]). Figures 7–9 show the restricted FPR range graphically. In this focused analysis, articulation rate was again the best performing classifier and differentiated nfvPPA from lvPPA, svPPA and normal controls with excellent diagnostic accuracy (AUCcorrected=.90, .91, 1.00, respectively). Both articulation rate and speech rate out-performed the PASS Fluency measure in identifying nfvPPA. The pAUC for the articulation rate classifier (nfvPPA~lvPPA) was significantly greater than the PASS Fluency pAUC (p<.001); no statistically significant differences in pAUC were found between articulation rate and speech rate classifiers or speech rate and PASS Fluency classifiers for either of the clinical groups comparisons.
Discussion
This investigation examined the diagnostic efficacy of speech rate, and its subcomponent measures of articulation rate and pausing, for differentiating between non-fluent and fluent subtypes of PPA. Among the quantitative measures, articulation rate was the most effective for differentiating between nfvPPA and the more fluent lvPPA or svPPA groups. The diagnostic accuracy of these quantitative measures was markedly better than that of the clinician rating scale. These findings provided additional empirical support for (1) the efficacy of quantitative assessments of speech fluency and (2) a distinct non-fluent PPA subtype characterized, at least in part, by an underlying disturbance in speech motor control.
Speech rate differences driven by articulation rate
Consistent with previous research (Ballard et al., 2014; Fraser et al., 2014; Wilson et al., 2010), our results revealed a predictable slowing in speech rate from the most fluent svPPA to the variably fluent lvPPA to the least fluent nfvPPA. The findings from this study revealed that this difference is primarily driven by group differences in articulation rate rather than in pausing. More specifically, of the subcomponent measures of speech rate, only articulation rate differentiated between non-fluent nfvPPA and the more fluent lvPPA and svPPA groups.
The failure of the overall pausing measure to differentiate nfvPPA from lvPPA and svPPA is surprising given the association between agrammatic output and increased pausing in other agrammatic aphasias (Beeke, Wilkinson, & Maxim, 2009; Lesser & Milroy, 2014). Results showed that although individuals with nfvPPA tended to pause longer per pause compared to the lvPPA and svPPA groups, these individuals also paused less frequently. These opposite trends in pausing behavior could account for the non-significance between clinical subgroups of the overall proportion pause measure. The decreased frequency in pausing in the nfvPPA group is an unexpected finding and could be the result of a failure to pause at appropriate grammatical junctions, possibly related to the impaired sentence planning that is characteristic of the nfvPPA population (Gorno-Tempini et al., 2011; Grossman, 2012; Levelt, 1989).
All pause measures did significantly differentiate nfvPPA from normal controls, suggesting some degree of abnormal pausing behavior in the former group. However, several pause measures also differentiated the lvPPA group from normal controls. This finding suggests a more complicated picture of pausing behavior in PPA, in which both nfvPPA and lvPPA individuals are pausing more than normal controls but likely for different reasons. In the nfvPPA group, increased pausing is most likely a function of agrammatism, whereas in lvPPA, increased pausing likely results from impaired lexical retrieval (Gorno-Tempini et al., 2004; Henry & Gorno-Tempini 2010). It is possible that more fine-grained pausing measures (e.g., durational distribution of individual pauses, occurrence of pauses relative to syntactic boundaries) may differentiate between PPA subtypes. Increased pausing among lvPPA individuals is also a possible mechanism for decreased speech rate in this subgroup. The finding underscores the importance of breaking an overall speech rate measure into subcomponent measures of articulation rate and pausing in order to differentiate between sources of non-fluent speech. As an example, overall speech rate is reduced (cf. svPPA, normal controls) for both nfvPPA and lvPPA individuals and increased pausing is a feature of both of these subgroups; however, the articulation rate is decreased for the nfvPPA group as compared to lvPPA. Thus, a reduced overall speech rate for both groups is driven by breakdown at different levels in the speech/language system.
Decreased articulation rate reflects motor impairment in nfvPPA
The decreased rate of articulation for non-fluent individuals relative to more fluent individuals is consistent with previous research done by Wilson and colleagues (Wilson et al., 2010), who showed a significantly reduced maximum speech rate for nfvPPA relative to both lvPPA and svPPA. By definition, articulation rate is determined by parameters of articulatory performance such as articulator displacement and articulator speed (Nip & Green, 2013). Reduced articulation rate in nfvPPA, therefore, reflects motor impairment as a primary source of non-fluency in this population. This result is also consistent with clinical descriptions that establish apraxia of speech—and less frequently, dysarthria—as conditions associated with nfvPPA (Duffy, Strand, & Josephs, 2014). In the current sample, 10 of 11 participants diagnosed with nfvPPA had apraxic speech characteristics as judged by a speech language pathologist, thus providing additional support for the suggestion that slowed articulation rate is a characteristic speech feature in this group. Both apraxia of speech and dysarthria disrupt speech motor output, and a supporting body of research has established a connection between motor speech impairment and reduced articulation rate in other speech-disordered populations, including ALS (Yunusova et al., 2010) and multiple sclerosis (Rodgers, Tjaden, Feenaughty, Weinstock-Guttman, & Benedict, 2013).
Results of the current study showed no significant difference in articulation rate between lvPPA, svPPA, and normal controls. This result is consistent with the absence of a primary motor deficit among the more fluent subtypes, although a marginally significant difference in articulation rate between lvPPA and svPPA subgroups is also consistent with reports of secondary motor speech involvement in a minority of lvPPA individuals (Duffy et al., 2014).
High diagnostic accuracy of quantitative speech measures improves subtype classification
Results from the current investigation demonstrated higher diagnostic accuracy for speech and articulation rate measures compared to an existing clinician rating scale. This was especially true within a restricted, clinically relevant false positive range. Numeric cutoffs on rate measures enabled the highly sensitive and specific identification of nfvPPA relative to the more fluent subtypes and normal controls. Articulation rate, in particular, showed good overall accuracy in identifying nfvPPA, and good generalizability of accuracy results outside the training dataset. The trend toward improved classifier performance for quantitative rate measures (i.e., speech rate, articulation rate) suggests the potential for more accurate and reliable single-dimension (i.e., articulation rate) mapping of PPA subtypes, especially nfvPPA versus lvPPA, svPPA.
The importance of clinical subtyping within PPA has been well-established in previous research. One goal of this line of research is to test hypotheses about (1) the extent to which fluency characteristics among the three PPA variants can be attributed to one or multiple domains of spoken language production (i.e., motoric, syntactic, semantic) as well as (2) the clinicoanatomic validity of three PPA variants. More robust subtyping is particularly critical given the different probabilistic associations of the variants with Alzheimer's disease (AD) versus frontotemporal lobar degeneration (FTLD) pathology (e.g., Grossman, 2010). The use of language-based measures to reliably group PPA patients in accordance with probable underlying pathology is a clinically useful goal that links behavioral phenotypes with associated genotypes.
Successful subtyping algorithms have typically used two- or three-dimensional mapping approaches that consider multiple orthogonal language domains (Hu et al., 2010; Mesulam et al., 2009; 2012; Savage et al., 2013; Wilson et al., 2009), or a combination of linguistic and imaging features (Wilson et al., 2009). In theory, these multi-variable approaches are optimized when input variables are themselves optimal subtype differentiators. The improved diagnostic accuracy of quantitative rate measures (cf. clinician rating scales) in this study offers a more optimal approach to subtyping in the fluency domain, and suggests that articulation rate may be a useful input variable as part of a multi-dimensional subtyping approach. A multi-dimensional subtyping approach involves the classification of individuals into subtype groups based on performance on orthogonal speech/language tasks or features (e.g., articulation rate, scores on test of syntax); performance on these tasks is thus used as the input for the subtyping schema. Besides improved diagnostic accuracy, quantitative rate measures can be automatically and reliably extracted from continuous speech samples (Green et al., 2004). In the clinical setting, an accurate and automatable fluency classifier system has the potential to be a valuable diagnostic tool.
Conclusions and Future Directions
The current investigation identified select quantitative rate measures that distinguish nfvPPA from other forms of PPA and demonstrated the high diagnostic accuracy of these measures for classifying PPA into non-fluent and fluent subtypes. Data showed that between-groups differences in speech rate may be driven more by differences in articulation rate as compared with differences in pausing measures. This finding suggests that impaired motor speech function may be a primary source of non-fluency in the non-fluent (nfvPPA) population. Results also provide evidence that quantitative rate measures may enhance current approaches to fluency classification in PPA and increase diagnostic accuracy in this domain. Quantitative rate measures also have the potential to be useful for tracking progression of the disease over time, especially among nfvPPA individuals for whom longitudinal declines in rate could indicate a worsening motor speech impairment.
Results of this investigation suggest new directions in PPA research with regards to both cognitive/linguistic and motor aspects of fluency. Future cognitive/linguistic protocols—combining, for example, psycholinguistic and neuroimaging approaches—are needed to elucidate the role of higher level linguistic (e.g., syntactic, semantic) and cognitive (e.g., working memory, executive function) functions in modulating fluency in PPA. In addition, motor-based protocols are needed to provide information about the articulatory kinematics of speech fluency in PPA (especially nfvPPA). Together, this information will yield a more comprehensive understanding of non-fluent speech and will help to differentiate between different sources of non-fluency, thereby enabling clinicians to target the breakdown more effectively in a therapy setting.
Figure 8.
ROC curve for nfvPPA vs. svPPA. Dashed vertical lines correspond to restricted false positive range (FPR; 0,0.2).
Acknowledgments
This research was supported by NIH-NINDS grant R21-NS077051 (to BCD), NIH-NIDCD grants 1R01DC009890 and R01 DC0135470 (to JRG & YY), and by NIH-NIDCD training grant 5T32DC000038-23 (supporting CC). This work was conducted with support from Harvard Catalyst | The Harvard Clinical and Translational Science Center (National Center for Research Resources and the National Center for Advancing Translational Sciences, National Institutes of Health Award UL1 TR001102) and financial contributions from Harvard University and its affiliated academic healthcare centers. The content is solely the responsibility of the authors and does not necessarily represent the official views of Harvard Catalyst, Harvard University and its affiliated academic healthcare centers, or the National Institutes of Health.
Footnotes
Summary AUC estimates quantify classifier performance across the entire FPR/(1-Specificity) range, the upper limit of which is operationally undesirable for a clinically useful test. Partial AUC analyses allow for the estimation of AUC across a restricted, clinically relevant FPR range (i.e., low FPR).
References
- Ash S, McMillan C, Gunawardena D, Avants B, Morgan B, Khan A, Moore P, Gee J, Grossman M. Speech errors in progressive non-fluent aphasia. Brain and Language. 2010;113(1):13–20. doi: 10.1016/j.bandl.2009.12.001. [DOI] [PMC free article] [PubMed] [Google Scholar]
- Ballard KJ, Savage S, Leyton CE, Vogel AP, Hornberger M, Hodges JR. Logopenic and nonfluent variants of primary progressive aphasia are differentiated by acoustic measures of speech production. PLoS ONE. 2014;9(2):e89864. doi: 10.1371/journal.pone.0089864. [DOI] [PMC free article] [PubMed] [Google Scholar]
- Beeke S, Wilkinson R, Maxim J. Prosody as a compensatory strategy in the conversations of people with agrammatism. Clinical Linguistics & Phonetics. 2009;23(2):133–155. doi: 10.1080/02699200802602985. [DOI] [PubMed] [Google Scholar]
- Campbell TF, Dollaghan CA. Speaking rate, articulatory speed, and linguistic processing in children and adolescents with severe traumatic brain injury. Journal of Speech, Language, and Hearing Research. 1995;38(4):864–875. doi: 10.1044/jshr.3804.864. [DOI] [PubMed] [Google Scholar]
- Catani M, Mesulam MM, Jakobsen E, Malik F, Martersteck A, Wieneke C, Thompson CK, Thiebaut de Schotten M, Dell'Acqua F, Weintraub S, Rogalski E. A novel frontal pathway underlies verbal fluency in primary progressive aphasia. Brain. 2013;136(8):2619–2628. doi: 10.1093/brain/awt163. [DOI] [PMC free article] [PubMed] [Google Scholar]
- Croot K, Ballard K, Leyton CE, Hodges JR. Apraxia of speech and phonological errors in the diagnosis of nonfluent/agrammatic and logopenic variants of primary progressive aphasia. Journal of Speech, Language, and Hearing Research. 2012;55(5):S1562–S1572. doi: 10.1044/1092-4388(2012/11-0323). [DOI] [PubMed] [Google Scholar]
- DeLong ER, DeLong DM, Clarke-Pearson DL. Comparing the areas under two or more correlated receiver operating characteristic curves: a nonparametric approach. Biometrics. 1988:837–845. [PubMed] [Google Scholar]
- Dodd LE, Pepe MS. Partial AUC estimation and regression. Biometrics. 2003;59(3):614–623. doi: 10.1111/1541-0420.00071. [DOI] [PubMed] [Google Scholar]
- Du AT, Schuff N, Kramer JH, Rosen HJ, Gorno-Tempini ML, Rankin K, Miller BL, Weiner MW. Different regional patterns of cortical thinning in Alzheimer's disease and frontotemporal dementia. Brain. 2007;130(4):1159–1166. doi: 10.1093/brain/awm016. [DOI] [PMC free article] [PubMed] [Google Scholar]
- Duffy JR. Motor speech disorders: Substrates, differential diagnosis, and management. Elsevier Health Sciences; 2013. [Google Scholar]
- Duffy JR, Strand EA, Josephs KA. Motor speech disorders associated with primary progressive aphasia. Aphasiology. 2014;28(8–9):1004–1017. doi: 10.1080/02687038.2013.869307. [DOI] [PMC free article] [PubMed] [Google Scholar]
- Fraser KC, Meltzer JA, Graham NL, Leonard C, Hirst G, Black SE, Rochon E. Automated classification of primary progressive aphasia subtypes from narrative speech transcripts. Cortex. 2014;55:43–60. doi: 10.1016/j.cortex.2012.12.006. [DOI] [PubMed] [Google Scholar]
- Gorno Tempini ML, Dronkers NF, Rankin KP, Ogar JM, Phengrasamy L, Rosen HJ, Johnson JK, Weiner MW, Miller BL. Cognition and anatomy in three variants of primary progressive aphasia. Annals of Neurology. 2004;55(3):335–346. doi: 10.1002/ana.10825. [DOI] [PMC free article] [PubMed] [Google Scholar]
- Gorno-Tempini ML, Brambati SM, Ginex V, Ogar J, Dronkers NF, Marcone A, Perani D, Garibotto V, Cappa SF, Miller BL. The logopenic/phonological variant of primary progressive aphasia. Neurology. 2008;71(16):1227–1234. doi: 10.1212/01.wnl.0000320506.79811.da. [DOI] [PMC free article] [PubMed] [Google Scholar]
- Gorno-Tempini ML, Hillis AE, Weintraub S, Kertesz A, Mendez M, Cappa SF, Ogar J, Rohrer J, Black S, oeve BF, Manes F, Drokers NF, Vandenberghe R, Rascovsky K, Patterson K, Miller BL, Knopman DS, Hodges JR, Mesulam MM, Grossman M. Classification of primary progressive aphasia and its variants. Neurology. 2011;76(11):1006–1014. doi: 10.1212/WNL.0b013e31821103e6. [DOI] [PMC free article] [PubMed] [Google Scholar]
- Green JR, Beukelman DR, Ball LJ. Algorithmic estimation of pauses in extended speech samples of dysarthric and typical speech. Journal of Medical Speech-Language Pathology. 2004;12(4):149. [PMC free article] [PubMed] [Google Scholar]
- Grossman M. Primary progressive aphasia: Clinicopathological correlations. Nature Reviews Neurology. 2010;6(2):88–97. doi: 10.1038/nrneurol.2009.216. [DOI] [PMC free article] [PubMed] [Google Scholar]
- Grossman M. The non-fluent/agrammatic variant of primary progressive aphasia. The Lancet Neurology. 2012;11(6):545–555. doi: 10.1016/S1474-4422(12)70099-6. [DOI] [PMC free article] [PubMed] [Google Scholar]
- Fletcher J. The prosody of speech: timing and rhythm. In: Hardcastle WJ, Laver J, Gibbon FE, editors. The handbook of phonetic sciences. John Wiley & Sons; Malden, MA: 2010. pp. 573–574. [Google Scholar]
- Henry ML, Gorno-Tempini ML. The logopenic variant of primary progressive aphasia. Current Opinion in Neurology. 2010;23(6):633. doi: 10.1097/WCO.0b013e32833fb93e. [DOI] [PMC free article] [PubMed] [Google Scholar]
- Hu WT, McMillan C, Libon D, Leight S, Forman M, Lee VY, Trojanowski JQ, Grossman M. Multimodal predictors for Alzheimer disease in nonfluent primary progressive aphasia. Neurology. 2010;75(7):595–602. doi: 10.1212/WNL.0b013e3181ed9c52. [DOI] [PMC free article] [PubMed] [Google Scholar]
- Kerschensteiner M, Poeck K, Brunner E. The fluency-non fluency dimension in the classification of aphasic speech. Cortex. 1972;8(2):233–247. doi: 10.1016/s0010-9452(72)80021-2. [DOI] [PubMed] [Google Scholar]
- Kertesz A. Western Aphasia Battery. Grune and Stratton; New York: 1982. [Google Scholar]
- Lesser R, Milroy L. Routledge. 2014. Linguistics and aphasia: Psycholinguistic and pragmatic aspects of intervention. [Google Scholar]
- Levelt WJM. Speaking: From intention to articulation. MIT Press; Cambridge, MA: 1989. [Google Scholar]
- Light RJ. Measures of response agreement for qualitative data: Some generalizations and alternatives. Psychological Bulletin. 1971;76(5):365. [Google Scholar]
- Lopez-Raton M, Rodrıguez-Alvarez MX, Cadarso-Suárez C, Gude-Sampedro F. OptimalCutpoints: An R Package for Selecting Optimal Cutpoints in Diagnostic Tests. Journal of Statistical Software. 2014;61(8):1–36. [Google Scholar]
- Maindonald J, Braun WJ. [accessed 2 February 2015];DAAG: Data Analysis and Graphics data and functions. R package version 1.12. 2012 Avialable at: http://CRAN.R-project.org/package=DAAG.
- Mesulam MM. Primary progressive aphasia: a 25-year retrospective. Alzheimer Disease & Associated Disorders. 2007;21(4):S8–S11. doi: 10.1097/WAD.0b013e31815bf7e1. [DOI] [PubMed] [Google Scholar]
- Mesulam MM, Weintraub S, Rogalski EJ, Wieneke C, Geula C, Bigio EH. Asymmetry and heterogeneity of Alzheimer's and frontotemporal pathology in primary progressive aphasia. Brain. 2014;137(4):1176–1192. doi: 10.1093/brain/awu024. [DOI] [PMC free article] [PubMed] [Google Scholar]
- Mesulam M, Wieneke C, Rogalski E, Cobia D, Thompson C, Weintraub S. Quantitative template for subtyping primary progressive aphasia. Archives of Neurology. 2009;66(12):1545–1551. doi: 10.1001/archneurol.2009.288. [DOI] [PMC free article] [PubMed] [Google Scholar]
- Nip IS, Green JR. Increases in cognitive and linguistic processing primarily account for increases in speaking rate with age. Child Development. 2013;84(4):1324–1337. doi: 10.1111/cdev.12052. [DOI] [PMC free article] [PubMed] [Google Scholar]
- O'Brian S, Packman A, Onslow M, O'Brian N. Measurement of Stuttering in Adults: Comparison of Stuttering-Rate and Severity-Scaling Methods. Journal of Speech, Language, and Hearing Research. 2004;47(5):1081–1087. doi: 10.1044/1092-4388(2004/080). [DOI] [PubMed] [Google Scholar]
- Robin X, Turck N, Hainard A, Tiberti N, Lisacek F, Sanchez JC, Müller M. pROC: an open-source package for R and S+ to analyze and compare ROC curves. BMC Bioinformatics. 2011;12(1):77. doi: 10.1186/1471-2105-12-77. [DOI] [PMC free article] [PubMed] [Google Scholar]
- Rodgers JD, Tjaden K, Feenaughty L, Weinstock-Guttman B, Benedict RH. Influence of cognitive function on speech and articulation rate in multiple sclerosis. Journal of the International Neuropsychological Society. 2013;19(02):173–180. doi: 10.1017/S1355617712001166. [DOI] [PMC free article] [PubMed] [Google Scholar]
- Rogalski E, Cobia D, Harrison TM, Wieneke C, Thompson CK, Weintraub S, Mesulam MM. Anatomy of language impairments in primary progressive aphasia. The Journal of Neuroscience. 2011;31(9):3344–3350. doi: 10.1523/JNEUROSCI.5544-10.2011. [DOI] [PMC free article] [PubMed] [Google Scholar]
- Rohrer JD, Rossor MN, Warren JD. Alzheimer's pathology in primary progressive aphasia. Neurobiology of Aging. 2012;33(4):744–752. doi: 10.1016/j.neurobiolaging.2010.05.020. [DOI] [PMC free article] [PubMed] [Google Scholar]
- Sajjadi SA, Patterson K, Tomek M, Nestor PJ. Abnormalities of connected speech in the non-semantic variants of primary progressive aphasia. Aphasiology. 2012;26(10):1219–1237. [Google Scholar]
- Sapolsky D, Bakkour A, Negreira A, Nalipinski P, Weintraub S, Mesulam MM, Caplan D, Dickerson BC. Cortical neuroanatomic correlates of symptom severity in primary progressive aphasia. Neurology. 2010;75(4):358–366. doi: 10.1212/WNL.0b013e3181ea15e8. [DOI] [PMC free article] [PubMed] [Google Scholar]
- Savage S, Hsieh S, Leslie F, Foxe D, Piguet O, Hodges JR. Distinguishing subtypes in primary progressive aphasia: application of the Sydney language battery. Dementia and Geriatric Cognitive Disorders. 2013;35(3–4):208–218. doi: 10.1159/000346389. [DOI] [PubMed] [Google Scholar]
- Strand EA, Duffy JR, Clark HM, Josephs K. The apraxia of speech rating scale: a tool for diagnosis and description of apraxia of speech. Journal of Communication Disorders. 2014;51:43–50. doi: 10.1016/j.jcomdis.2014.06.008. [DOI] [PMC free article] [PubMed] [Google Scholar]
- Teichmann M, Kas A, Boutet C, Ferrieux S, Nogues M, Samri D, Rogan C, Dormont D, Dubois B, Migliaccio R. Deciphering logopenic primary progressive aphasia: a clinical, imaging and biomarker investigation. Brain. 2013:awt266. doi: 10.1093/brain/awt266. [DOI] [PubMed] [Google Scholar]
- Thompson CK, Cho S, Hsu CJ, Wieneke C, Rademaker A, Weitner BB, Mesulam MM, Weintraub S. Dissociations between fluency and agrammatism in primary progressive aphasia. Aphasiology. 2012;26(1):20–43. doi: 10.1080/02687038.2011.584691. [DOI] [PMC free article] [PubMed] [Google Scholar]
- Thompson CK, Weintraub S, Mesulam MM. The Northwestern Anagram Test. Evanston, IL: 2012. [Google Scholar]
- Wilson SM, Ogar JM, Laluz V, Growdon M, Jang J, Glenn S, Miller BL, Weiner MW, Gorno-Tempini ML. Automated MRI-based classification of primary progressive aphasia variants. Neuroimage. 2009;47(4):1558–1567. doi: 10.1016/j.neuroimage.2009.05.085. [DOI] [PMC free article] [PubMed] [Google Scholar]
- Wilson SM, Henry ML, Besbris M, Ogar JM, Dronkers NF, Jarrold W, Miller BL, Gorno-Tempini ML. Connected speech production in three variants of primary progressive aphasia. Brain. 2010;133(7):2069–2088. doi: 10.1093/brain/awq129. [DOI] [PMC free article] [PubMed] [Google Scholar]
- Yunusova Y, Green JR, Lindstrom MJ, Ball LJ, Pattee GL, Zinman L. Kinematics of disease progression in bulbar ALS. Journal of Communication Disorders. 2010;43(1):6–20. doi: 10.1016/j.jcomdis.2009.07.003. [DOI] [PMC free article] [PubMed] [Google Scholar]


