Abstract
The structure of the X-ray emission lines of the Cu Kα complex has been remeasured on a newly commissioned instrument, in a manner directly traceable to the Système Internationale definition of the meter. In this measurement, the region from 8000 eV to 8100 eV has been covered with a highly precise angular scale, and well-defined system efficiency, providing accurate wavelengths and relative intensities. This measurement updates the standard multi-Lorentzian-fit parameters from Härtwig, Hölzer, et al., and is in modest disagreement with their results for the wavelength of the Kα1 line when compared via quadratic fitting of the peak top; the intensity ratio of Kα1 to Kα2 agrees within the combined error bounds. However, the position of the fitted top of Kα1 is very sensitive to the fit parameters, so it is not believed to be a robust value to quote without further qualification. We also provide accurate intensity and wavelength information for the so-called Kα3,4 “satellite” complex. Supplementary data is provided which gives the entire shape of the spectrum in this region, allowing it to be used directly in cases where simplified, multi-Lorentzian fits to it are not sufficiently accurate.
I. INTRODUCTION
Precision measurements of the wavelengths, energies, and spectral structures of x-ray line complexes are needed for many purposes. Our group at NIST uses such data to certify lattice parameters of Standard Reference Materials (SRMs) (primarily [1–3]) which are used to calibrate powder diffractometers. Databases of x-ray wavelengths have been compiled over much of a century ([4–6], e.g.) by x-ray diffraction from single crystals. Until relatively recently, though, these measurements have not been traceable to SI base units, since there was no independent way to compare the lattice spacings of the crystals to the definition of the meter. The development of x-ray optical interferometers (XROIs) [7, 8] and lattice comparators [9] allowed direct comparison of the lattice spacing of silicon to the wavelength of an iodine-stabilized HeNe laser, which was traced to the Système Internationale (SI) definition of the meter [10]. This led to rounds of progressively finer measurements of standard x-ray wavelengths, in particular, that of the Cu Kα complex [7, 11–13], since it is used frequently in laboratory diffraction work. The most recent of these measurements involves data taken in the 1980s and analyzed in the 1990s. Since that time, changes to the way SI traceable measurements are made [14–17], and improvements to angle metrology [18–20] indicate the need for, and possibility of, updated measurements.
The primary purpose of this work is to provide a complete spectrum for the emission in the region of the Kα complex, independent of fitted models which might reduce its accuracy. Secondarily, we provide a wavelength measurement for the top of the Cu Kα1 component with an expanded (k=2) fractional error of 1×10⁻⁶, and multi-Lorentzian model shapes for the Kα1 and Kα2 lines which yield a centroid for the complex also correct within 1×10⁻⁶. This will enable powder diffraction work for which the contribution to the uncertainty from the spectrum is smaller than other uncertainties.
II. INSTRUMENT DESCRIPTION
A. General overview
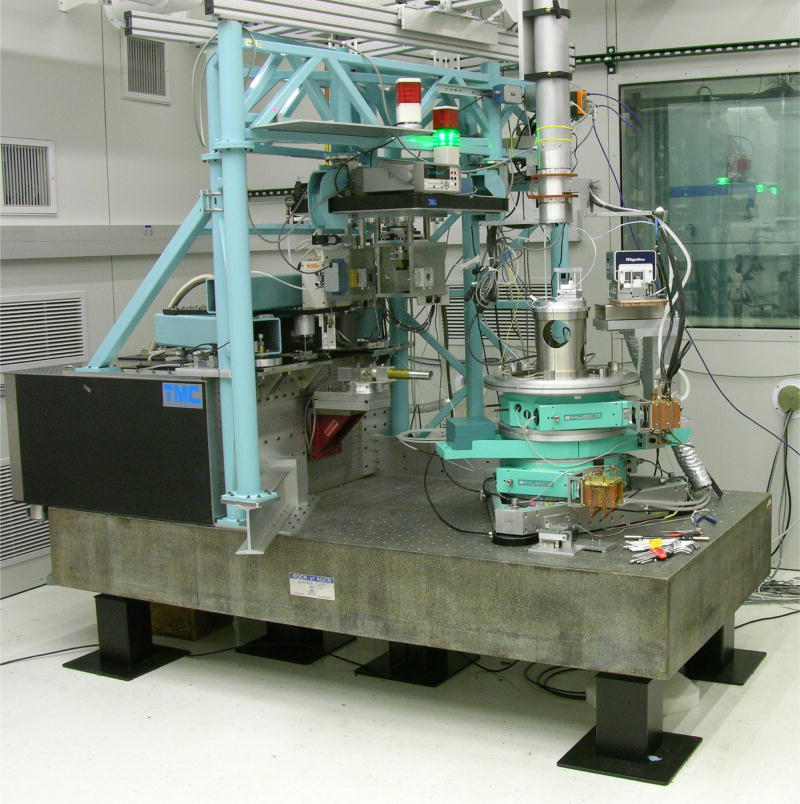
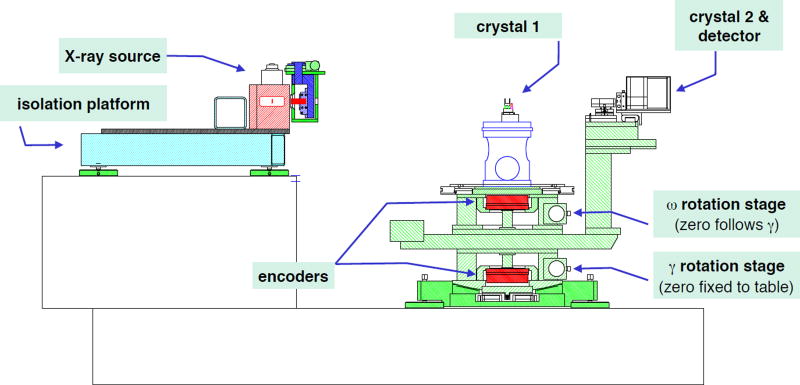
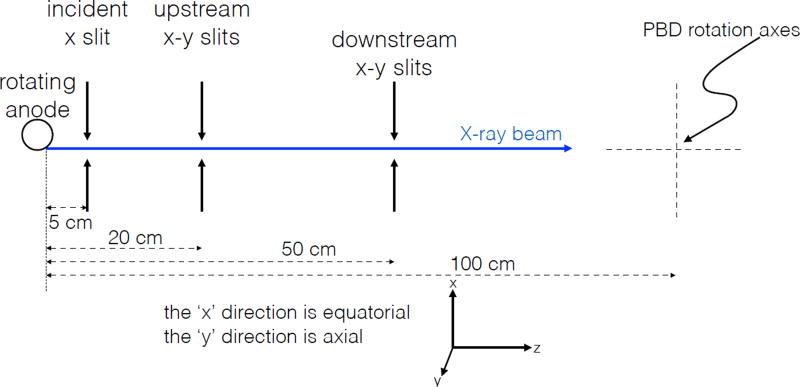
The system used to carry out the measurements described in this paper is a custom-built, triple, concentric, vertical-axis goniometer which is installed in the Advanced Measurement Laboratory at NIST. The space is controlled in temperature to 0.01° C during measurements, and isolated from almost any human interference. The machine consists of a Rigaku1 15 kW rotating-anode x-ray source, two stacked, high-precision Huber 430 rotation stages with Heidenhain RON-905 angle encoders, another low-precision stage used for calibration, two channel-cut 3-bounce silicon (440) crystals, and a Dectris Pilatus 100 K x-ray camera. The goniometer stage, and its calibration, is described in detail in [20]. A photograph of the system is shown in Figure 1, and a schematic is shown in Figure 2, with the beam path through the slits shown in Figure 3.
Figure 1.
The NIST x-ray diffraction goniometer system, in its 0.01° C temperature-regulated space. The control room is through the window visible at the back.
Figure 2.
Side-view, showing the source, the goniometers, encoders, and the x-ray camera
Figure 3.
Plan view, showing details of slits.
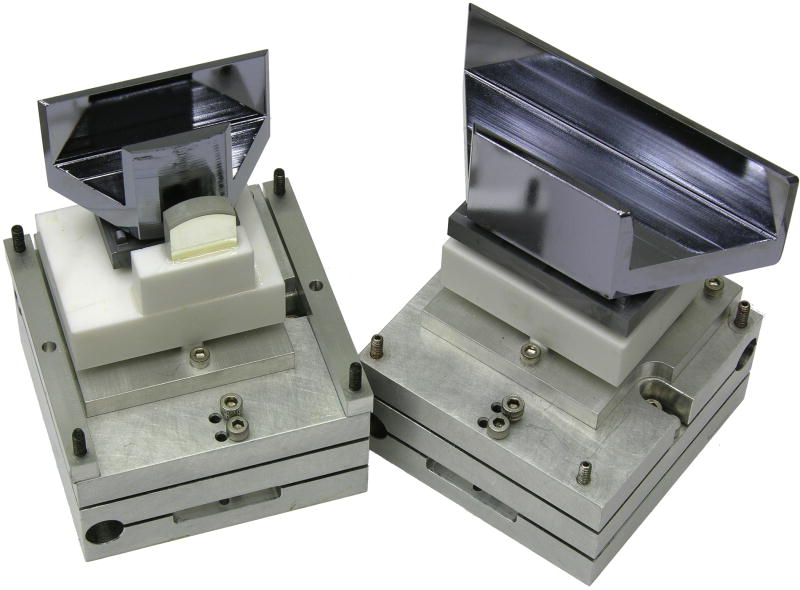
The crystals are shown in Figure 4. The small tombstone-shaped mirror visible in front of crystal 1 is approximately aligned to the lattice planes, and allows preliminary alignment of the crystal on the system using an optical autocollimating telescope. There is an equivalent mirror on the back side of crystal 2.
Figure 4.
Channel-cut silicon crystals (dark grey) on their aluminum tip-tilt mounts (light grey). The smaller crystal is crystal 1, mounted on the ω stage. The larger is crystal 2, mounted on the γ stage.
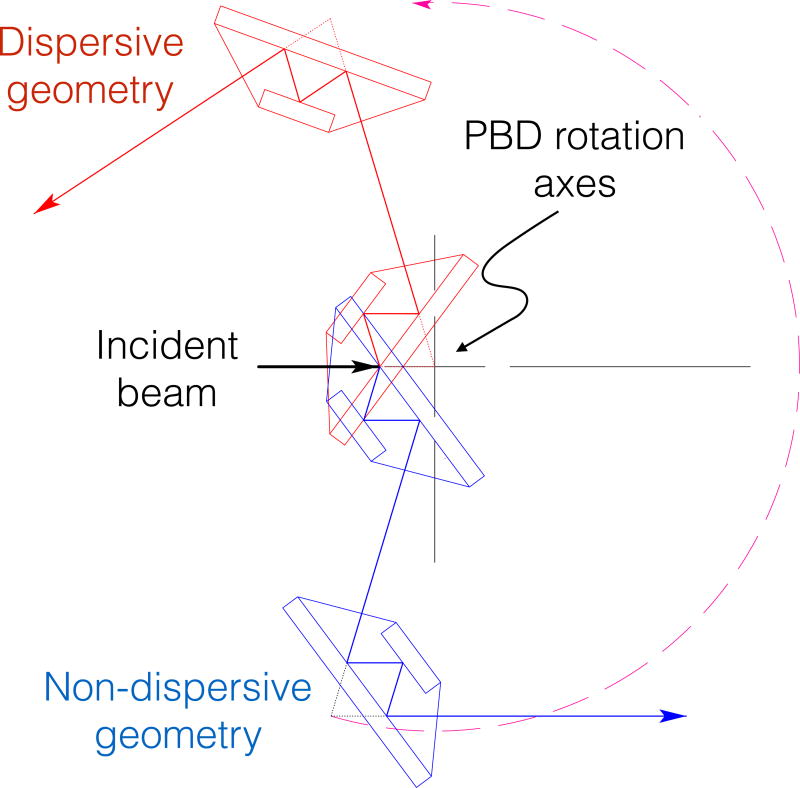
The coordinate system we will use for angles is shown in Figure 2 of [20]. Because of the stacking of the stages, the ω stage zero position follows γ; thus, the angle of crystal 1 relative to fixed space (mounted on the ω stage, on the goniometer rotation axis) is ω + γ. The angle of the camera mount and of crystal 2 (mounted on the lower stage, offset at a fixed radius from the goniometer axis) is γ. The non-encoded third (ϕ) stage is annular, so the crystal 1 mount passes through its center to sit on the ω stage. As the system is operated for the purposes of this paper, one channel-cut silicon crystal is mounted on the central (ω) axis, and the second crystal is mounted on the camera stage, which will be called the γ axis. The system can be rotated so the crystals are coupled either in dispersive or non-dispersive mode. The general layout of the system is shown in Figure 5. In non-dispersive mode, the crystals pass a broad band of wavelengths, with a sharp maximum in intensity when the lattices of the two crystals are exactly parallel; this effect is used to establish the angular relation of the two crystals relative to our goniometer coordinate system.
Figure 5.
Top-view schematic comparison of optical paths of the system in dispersive and non-dispersive modes. Components drawn in red are the setup for the dispersive mode; blue is non-dispersive mode.
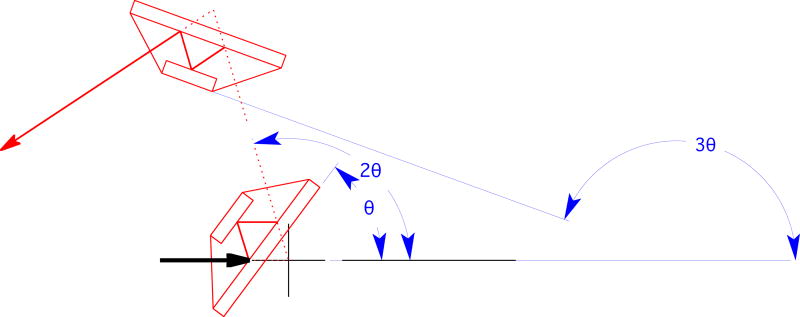
In dispersive mode, the system acts as an x-ray wavelength filter, only passing a narrow band of wavelengths around a center set by Bragg’s law λ = 2d sin θB where the wavelength λ and the angle θB are both as they exist inside the crystal; Snell’s law modifies this angle relative to the externally measured angle, and the index of refraction of the crystal also modifies the wavelength of the x-rays inside relative to the vacuum wavelength. These effects will be discussed much more later. In this mode, it is necessary to compute what the angles of the goniometer axes must be set to such that the Bragg’s law condition for the crystals is satisfied throughout. From Figure 6, the angle θ1 of the first crystal with respect to the beam axis is θ1 = ω + γ = θB, and the angle θ2 of the second crystal is θ2 = γ = 3θB. Note that, using these angles, the portion of the incoming beam which satisfies the Bragg condition always lies in the same direction (along the z-axis). Crystal 2 must be mounted at an offset angle, so that when its lattice is rotated by 3θB relative to the z-axis, its center of reflection is positioned at 2θB so that it intersects the beam from crystal 1. Solving these equations gives the angles required to scan the system in dispersive mode:
| (1) |
and γ = 3θB = −3ω/2. From these, one also observes that the Bragg angle, which is set by the angle between crystal 1 and crystal 2, depends only on ω. Keeping ω fixed and adjusting γ rotates the entire system around the y-axis in the xz-plane, thus adjusting the direction the optics are sampling from the beam around the y-axis, while leaving the system tuned to pass the same wavelength. Scanning γ independently of ω is used to find the center direction of the beam around the y-axis.
Figure 6.
Illustration of x-ray path through crystals, in dispersive mode, detailing the angles of the crystals and the reflected beams.
B. Temperature monitoring and thermal design
The temperature of various components of the system is monitored by six 10 kΩ thermistors, monitored with a Hart/Fluke BlackStack system, and calibrated in the NIST temperature calibration facility [21] to ± 0.002° C. These thermistors are epoxy-mounted in copper ring lugs, and bolted to the surfaces they are monitoring. The BlackStack operates them at an excitation current of 10 µA, resulting in a power dissipation of 1 µW. They are estimated to have a thermal impedance of 1000° C/W, resulting in an estimated bias of 0.001° C from self-heating. Data from the thermistors confirms that, once stabilized, the laboratory temperature is stable to within its specified 0.01° C design.
Heat from various thermal sources in the instrument, however, results in temperature differences of up to 0.2° C between various components. The angle encoders result in significant heating of the goniometer stage itself. As can be seen by close inspection of Figure 1, the stand for crystal 1 is a hollow, stainless-steel tube with large air ports on its side, which thermally isolates the crystal base from the goniometer, resulting in the crystal base staying close to ambient air temperature. Crystal 2 sits on the same pedestal as the x-ray camera; this requires significant thermal design to isolate it from the approximately 15 W thermal output of the camera. This is achieved by a number of methods. First, again by inspection of Figure 1, one can see a silver-colored flexible exhaust hose hanging from the back of the camera, which diverts its warm exhaust air away from the crystals. Second, the camera is mounted on a hollow, stainless steel base, which provides a high thermal impedance between it and the crystal mount. Finally, the base for the crystal mount for crystal 2 is an aluminum block wrapped with copper tubing, through which cooling water, controlled to 0.01° C, flows. This water temperature is adjusted so that the base temperature is very close to the ambient air temperature. With this system, the two crystals can be kept at a temperature which is constant to within 0.01° C, and the temperature difference between the two crystals is within 0.04° C. The temperature we use to compute the lattice constant of the crystals is the mean of the two crystal temperatures, as measured during the data collection.
C. X-ray source
The x-ray source used for this work is a 15 kW rotating-anode Rigaku tube, operated at 40 kV and 300 mA, with a copper anode. The take-off angle is approximately ψTO = 6°. The entire tube assembly is mounted on air-flotation pads to decouple vibration from the anode rotation from the angle encoders on the goniometer. The tube is typically allowed to operate for 24 h to stabilize before data are collected. The water cooling loop for the tube keeps its housing at a temperature constant to within 0.01° C after it is stabilized. The output stability is confirmed by the consistency of the intensity observed in replicated scans of the spectrum. Variation is less than 0.5% (1σ).
The energies and intensities we compute are corrected for self-absorption of the x-rays in the anode. Using data from estar [22], the full range re− for 40 keV electrons in copper is re− = 4.75×10⁻³ g cm−2. Depending on assumptions about multiple scattering, and the resulting ratio of the mean penetration depth of the electrons to the full range, one can put limits on the contribution of this self absorption. The correction is:
| (2) |
where μCu(E) is the photoelectric absorption of copper, from XCOM [23]. The parameter lfact is used to study the effect of the actual electron range distribution on the computed spectrum. Using lfact = 0.5, this creates a 4% correction to the intensity between 8000 eV and 8100 eV; using lfact = 1.0, the correction is 8%. Using lfact = 0.5 vs. using lfact = 1.0 changes the computed line energies by less than ΔE/E = 0.02 ppm.
D. Crystals
The quality and traceability of the lattice parameters of the silicon crystals is central to this project. Modern, high-quality silicon has a very well-defined lattice constant, and the CODATA 2010 [24, table XX, item B41.1] value of the (220) spacing of natural silicon of 192.015563(12) fm at 22.5° C and 0 Pa is likely representative of most crystals[25]. However, for the purpose of complete traceability, the crystals we use have been directly compared to the WASO4.2 material which was used for the CODATA determination using the NIST lattice comparator (delta-d) instrument [9]. Since the lattice constant of WASO4.2 has been directly compared on an XROI to the primary definition of the meter, via an iodine stabilized laser [8], this establishes traceability. The delta-d measurements determine the lattice parameter of the silicon we are using to be 192.0143390(20) fm at 20.0° C and a pressure of 0 Pa. Using equations 5 and 6 for the linear coefficient of expansion from [26]:
| (3) |
near 20° C, resulting in a lattice for our material of 192.015565 fm under the CODATA conditions. The lattice constant must then be corrected to our measured crystal temperature and atmospheric pressure to establish the proper value. From [27], the elastic constants of silicon at 20° C are c11 = 1.6573×10¹² dyne cm−2 = 165.73 GPa and c12 = 0.6392×10¹² dyne cm−2 = 63.92 GPa. The bulk (volume) modulus of a cubic material is Bν = (c11 + 2c12)/3 = 97.86 GPa. The linear compressibility is η = 3/Bν = 3.07×10⁻¹¹ Pa−1 and using 101325 Pa=1 atm, the lattice is fractionally compressed from its vacuum spacing by 3.45×10⁻⁷.
The alignment of the crystals to the vertical axis of the goniometer is carried out with the aid of a third crystal, which is a single-bounce thin lamella which can be reversed so reflections can be taken from both sides of it. To carry out the alignment the system is initially set up with the second crystal in its usual place, but the central crystal is replaced with the lamella. When a non-dispersive scan is taken, the beam will rock vertically across the x-ray camera if the crystals are not parallel. The procedure, then, is to adjust the system iteratively so that the beam does not rock vertically, with the lamella flipped 180° to each side. The consistency under flipping of the lamella guarantees that it is on the goniometer axis, and the lack of rocking guarantees that the second crystal is parallel to the lamella, so it is also vertical. Finally, the lamella is replaced with the normal central crystal, which is then aligned in the same manner to the outer crystal, so it is also vertical. Sensitivity tests of this procedure have verified that we can align the system to better than 10 seconds of arc to the axis of the goniometer. Also, in the data analysis section, we will discuss an independent measurement of the angle of the mirrors relative to the beam which is implicitly contained in the x-ray data.
E. Detector
The detector used in this system is a Dectris Pilatus 100 k x-ray camera [28]. It consists of a 320 µm thick monolithic, fully depleted silicon sensitive volume, bump bonded to an array of individual discriminators and counters for each pixel. The geometry is 197 × 487 pixels covering 33.5 mm × 83.8 mm, resulting in square pixels 170 µm on a side. The issues to be considered when using such a detector are: (1) the uniformity of the response over the face, which is necessary since in our geometry the beam moves as the wavelength is scanned, and (2) the efficiency vs. energy.
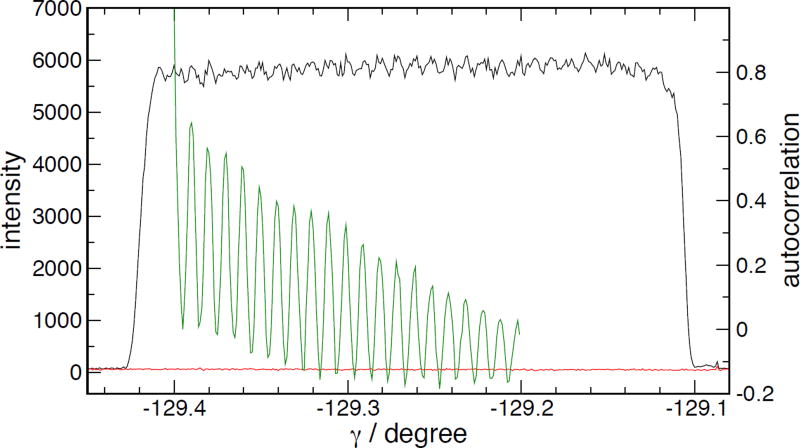
Since the beam, in dispersive mode, is much narrower than the pixel size, the uniformity can be established by scanning the beam across the camera face. This can be accomplished in a manner relevant to the measurements we make by setting the ω angle (angle between the two crystals) such that the system is parked on the top of Kα1, and then scanning γ, which walks the beam across the face of the camera. Figure 7 shows the result of such a scan. The black curve is the intensity of the top of Kα1; the green curve is an autocorrelation, which highlights the precisely periodic nature of the of the ripples in the intensity. Each ripple corresponds to the very sharp line of x-rays seen in dispersive mode walking across one pixel of the camera. Since this modulates the shape of the measured spectrum, it is necessary to make measurements at uniformly spaced positions within this periodic pattern, and average the results to get an unbiased spectrum.
Figure 7.
Uniformity of response of camera, measured by γ scan. Black curve is measured response at top of Kα1. Green curve is autocorrelation of intensity (black) curve, showing high periodicity in spite of noise on full signal, arbitrarily shifted horizontally to show on the same scale as the intensity.
Note that in non-dispersive mode, two factors mitigate the effect of this on the determination of the position of the rocking curve. First, in non-dispersive mode, the beam is very wide, so it automatically is averaging over many pixels on the camera. Second, the angular range of a non-dispersive scan is so narrow that the beam does not move across the camera face significantly during the scan.
The efficiency as a function of energy is essentially set by the photoelectric absorption cross section for the silicon wafer. We apply an energy efficiency correction to measured intensities, based on the Beer’s law absorption of photons in the detector crystal, of
| (4) |
where ηE0 is a constant peak efficiency (and not needed for our calculation, but approximately 97% from the detector documentation), μPE(E) is the photoelectric absorption cross section for silicon, from XCOM [23], ρ is the density of silicon, and tSi is the wafer thickness. This is a very weak correction over the energy range of interest. At E = 8000 eV, the correction is 0.9918; at E = 8100 eV, it is 0.9902. It is nonetheless included in our calculations.
F. Air absorption
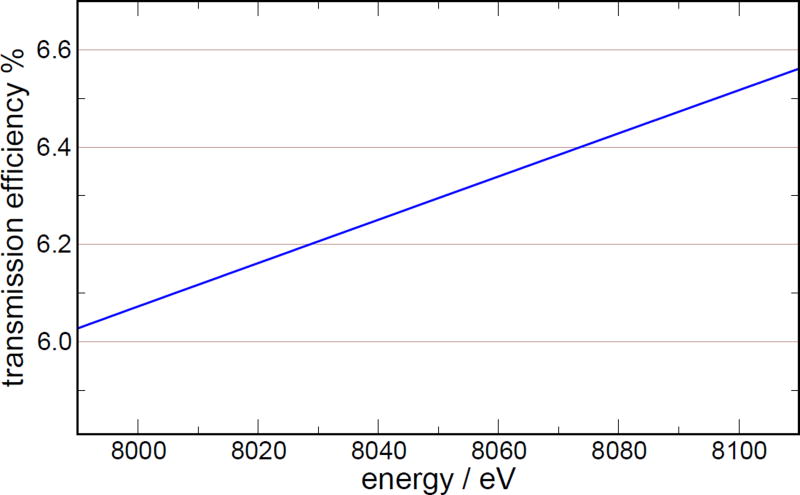
The path length of the x-ray beam in air for this system is approximately 1.38 m from the exit window of the source to the camera. For photons with an energy near 8047 eV, this presents strong absorption from the air in the path. This manifests itself as an intensity correction, in the same manner the the detector efficiency of the previous section. The correction is estimated from a mean air density of 1.181×10⁻³ g cm−3 and an air attenuation from table 4 of [29], the transmission of air ranges from 0.1985 at E = 8000 eV to 0.2104 at E = 8100 eV. This transmission function is included in the spectrum shape fits. Changing the atmospheric density by 10% has less than an 0.02 ppm on the computed energies of lines. Figure 8 shows the product of all of the transmission and efficiency corrections described above, along with the variability of the rocking efficiency of the crystals as calculated in section III. Note that, due to the narrow energy span we are sampling, the result is nearly linear, and only about 10% different at the two ends.
Figure 8.
Transmission and efficiency correction, including crystal efficiency, air absorption, and detector efficiency.
G. Slits
As shown in Figure 3, the system has multiple slit assemblies which can be used to define the shape of the x-ray beam. The first slit (“incident × slit” in the Figure) is about 5 cm from the anode; it has no effect on the beam in this experiment, and is typically open about 1 mm. The second slit assembly (“upstream x-y slits” in the Figure) is 21.5 cm from the anode. Because we are working with an x-ray camera that is sensitive to the vertical position at which photons strike it, we can use photons which are off the vertical axis (out of the plane of dispersion) of the machine, as long as the angle by which they are off axis is known. To accomplish this, we set the upstream vertical-limit slit to 500 µm open. This images the vertical structure of the emission of the x-ray source onto the camera, such that the vertical position of a photon can be directly correlated to its angle. The horizontal-limit slits in the system are not very critical, since the horizontal acceptance is set by the properties of the diffracting crystals. We set the upstream horizontal to about 1 mm. The third slits (“downstream x-y slits” in the Figure), 46 cm from the anode, are set to be just outside the bounds of the beam at their plane, to limit excess multiple scattering.
III. MONTE-CARLO INSTRUMENT SIMULATION
To understand the performance of the instrument, it is helpful to have Monte-Carlo ray tracing simulations of it in its different configurations. These simulations allow assessment of the effect of slits, crystal misalignments, and other instrument parameters. We carry out this simulation using the tool McXtrace v1.2 [30]. We have created an updated crystal model for this package, loosely derived from the PerfectCrystal.comp module provided. This model fixes some geometry problems (such as incorrect behavior for out-of-plane rays), and uses correct models for the Darwin reflectivity of a crystal. The reflectivity model used is equivalent to that used by XOP [31]; however, the scattering form factors are those provided with the McXtrace distribution. They are numerically indistinguishable.
This model computes the reflectivity as follows. Define λ as the x-ray photon wavelength in vacuum, θin as the incoming photon angle with respect to the crystal surface, d as the plane spacing, α as the asymmetry angle (in our system, 0), then
| (5) |
| (6) |
| (7) |
A polarization dependent scattering strength C is defined as C = 1 for p-polarization (electric field perpendicular to the scattering plane) and C = cos 2θ for s-polarization (electric field in the scattering plane). For a diamond lattice with h + k + l mod 4 = 0, as is true for our 440 reflection, define a scale factor fscale = 8 for the form factors. Note that for other reflections, and other symmetries, fscale may be complex; our code handles this, but it is not needed here. Then, using form factors f00, f0h, f′ and f″, a Debye-Waller B-factor for silicon of 0.4632×10⁻²⁰ m2 at room temperature, compute (using the equations corrected from those originally provided in the PerfectCrystal.comp model),
| (8) |
| (9) |
| (10) |
Using a classical electron radius of re = 2.817 940 289 4×10⁻¹⁵ m (which is used inside McXtrace; it is not quite the same as the CODATA value of 2.817 940 322 7×10⁻¹⁵ m [24], but does not affect the result for our purposes), we compute (with Re(x) and Im(x) being the real and imaginary part of x, respectively), following the PerfectCrystal.comp code:
| (11) |
| (12) |
| (13) |
| (14) |
| (15) |
| (16) |
| (17) |
Next, a change to the numerics in PerfectCrystal.comp computation of the reflectivity has been applied; the code originally computes the intensity reflectance as , which can potentially produce roundoff error when L is large. Instead, this can be multiplied by to get the exactly equivalent, but numerically stable, expression,
| (18) |
We define two symbols Rs and Rp to be the value of R as calculated above, using the s-polarization and p-polarization values for C as described above.
The beam polarization is handled in the tracking code as follows. Define k⃗ to be the direction of the incoming beam, and n⃗ to be the normal to the crystal reflecting planes. Then,
| (19) |
are the unit vectors in the scattering plane, and perpendicular to the scattering plane, respectively. If the incoming electric field unit vector is E⃗, it can be projected on the two directions and scaled by the square root of the reflectance for the appropriate polarization as
| (20) |
Using these field amplitudes, and defining an outgoing σ⃗′ direction by rotating σ⃗ around the π⃗ vector by the appropriate angle, and an outgoing direction k⃗′ from the same rotation of the incoming k⃗, we compute an outgoing electric field polarization and actual reflected intensity as:
| (21) |
The simulations using McXtrace are used to verify that we are treating dynamical diffraction correctly, including the absorption-induced asymmetry. The verification that we can correctly compute the non-dispersive peak shape for our system, as shown in Figure 13a provides confidence in the model. The important application of the Monte-Carlo is in the dispersive direction, where it can be used to calculate the dynamical asymmetry of the instrument response. The classical formula for the center angle of a Bragg-diffracted photon of wavelength λ from a crystal with lattice spacing d and an index of refraction n = 1 − δ − i β is
| (22) |
Figure 13.
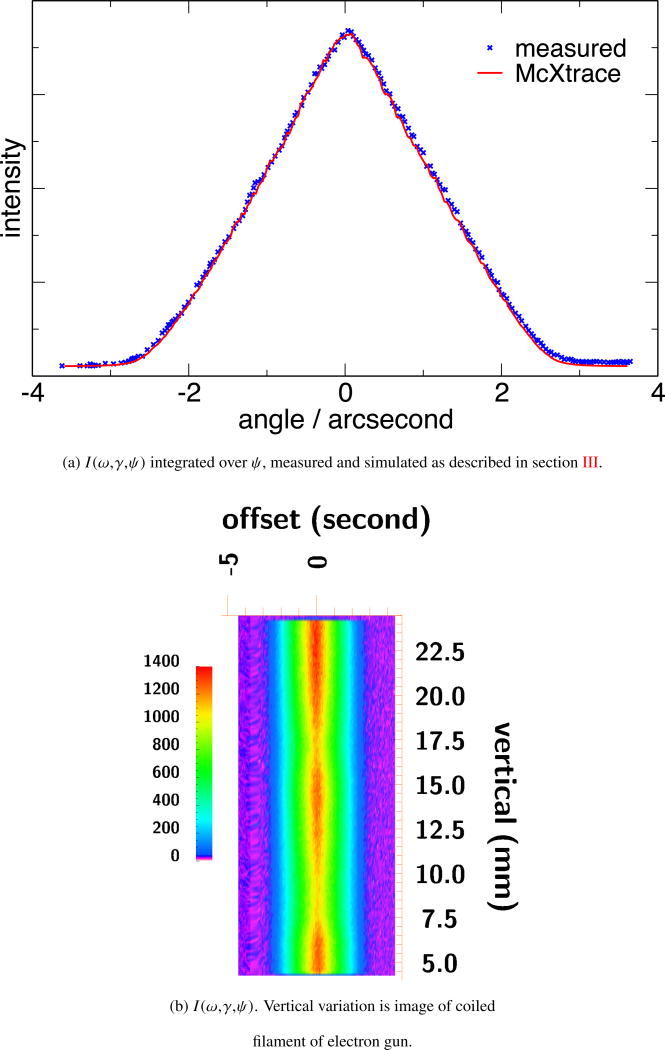
Scan in non-dispersive mode.
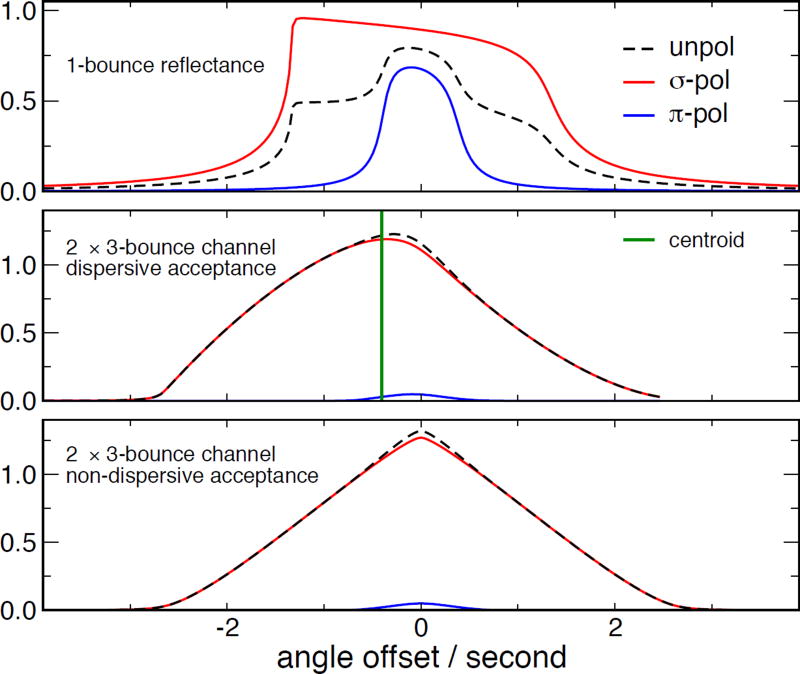
In Figure 9, we show the results of analytic computation using these equations, to verify their expected results. The top plot shows Ract from equation 21 for a single bounce from Si <440> at 8047 eV. The middle plot shows the dispersive angular acceptance as a function of the rocking offset from the angle defined by equation 22, showing the very small residual contribution of π-polarized photons after the 6 bounces, and showing the centroid of the peak, which is offset by −0.4 second from the prediction of equation 22, due to the absorption-induced asymmetry. The bottom plot shows the non-dispersive angular acceptance, when the crystal planes are nearly anti-parallel. These are computed using the standard equation for channel crystals, as in [32].
Figure 9.
Analytic computation of crystal system characteristics
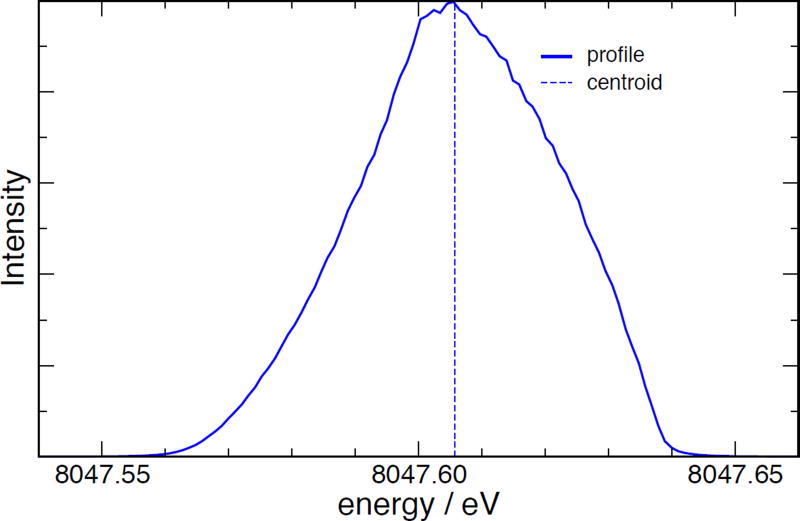
Including the above formalism in a full Monte-Carlo simulation with McXTrace results in a profile for our 6-bounce optics as shown in Figure 10; the centroid in this profile is displaced from the incident energy of 8047.600 eV to an apparent energy of 8047.606 eV. This effect will be included in the final analysis of our data. The new McXTrace modules used to carry out this simulation, NISTPerfectCrystal.comp and Source_lab_lorentzian.comp (which has been altered to correct an error in the actual lineshape produced) are provided with the supplementary data for this paper.
Figure 10.
Simulation of the instrument profile for monochromatic, 8047.60 eV x-rays.
IV. DATA COLLECTION PROCEDURE
A. X-ray camera data processing
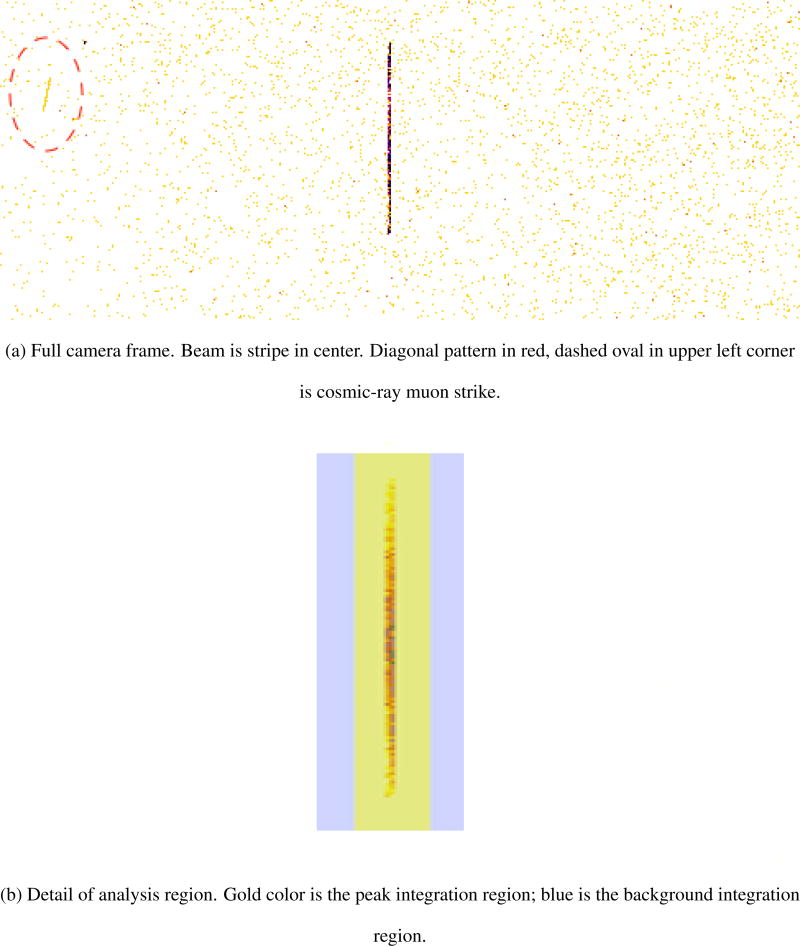
The geometry of the x-ray detector is discussed in section II E. In this experiment, we can take advantage of this geometry and performance to include extensive self-calibration information in the data. The information contained in the vertical profile of the detected x-rays makes it possible to verify much of the alignment of the instrument. The distribution of the x-rays horizontally on the camera face allows us to measure the true Compton-scattering background (from ambient air and the crystals), independent of the long, Lorentzian tails of the peaks. Because of the horizontal divergence of the x-rays from the source, the two-crystal system we use images the 100 µm wide source onto a vertical stripe on the camera face. Figure 11a shows a frame from a 4 s exposure on the camera taken near the top of the Kα1 line. There is a fairly uniform field of Compton-scattered x-rays over the face of the camera.
Figure 11.
Typical images from the x-ray camera.
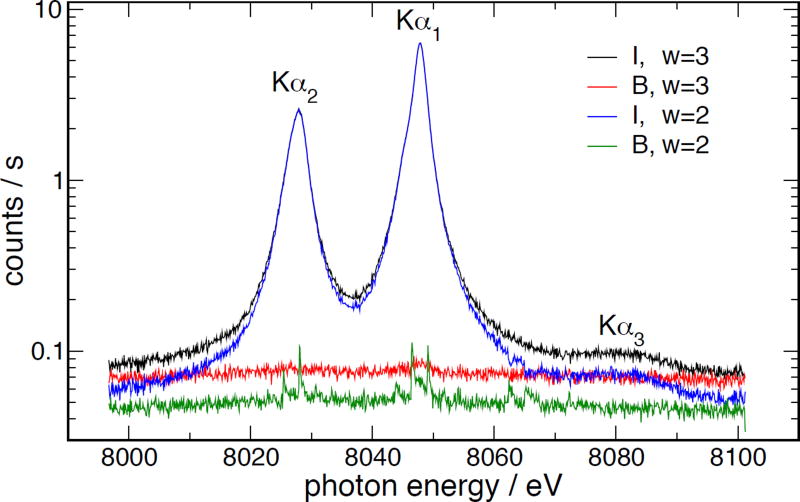
The analyzed x-ray intensity I (ω,γ,ψ) for a given set of goniometer angles ω and γ, and an angle ψ of the beam with respect to the horizontal plane, is computed by creating a region of interest (ROI) window of width wROI around the beam on the camera, and summing the pixels within this ROI. Also, on each side of this ROI, a region of background of width wROI/2 is integrated to compute the multiple scattering background B(ω,γ,ψ). For simple graphics, these are subtracted to produce a net intensity; however, for detailed analysis the background is kept separate so that its Poisson statistics can be treated independently of the statistics of the main peak, and so that it can be parametrized independently. These regions are detailed in Figure 11b. Because of the mismatch between the 3θ angle of the γ crystal and its 2θ position, the beam walks across the crystal, and hence across the face of the camera. The position of the ROI is computed so that it moves across the face of the camera to remain centered on the beam position. The effect of the choice of wROI is demonstrated in Figure 12. This shows the functions I and B across the entire complex; note that I − B is the net signal. For the case wROI = 3, the B (red) background curve shows very little structure (a slight leakage of about 10−3 of the total intensity is visible at the top of the Kα1 peak); however, the I (black) curve is very close to the B (red) curve in regions of low intensity, yielding reduced signal/noise. For wROI = 2, the B (green) curve shows odd steps at random places, as the window steps by an integral pixel distance, and collects a larger fraction of the on-peak counts off one edge (as much as 2%); however, the I (blue) curve has lower background under the signal and is better separated from the B(green) background, which is significant at low count rates. In this work, we use wROI = 3 everywhere, at the slight expense of signal-to-noise in the Kα3,4 region.
Figure 12.
Effect of width of the ROI window. Difference between “I” curves shows lowered background in tails for small “w”, but erratic behavior of “B, w=2” curve shows penalty for a narrow window when peak leaks into background.
B. Non-dispersive scanning
The system is operated in non-dispersive mode to establish the angle at which the 440 planes of the two silicon crystals are exactly anti-parallel to each other. This defines the point on the ω stage at which the Bragg angle 2θ is 0° (it is equivalent to operating in diffraction order zero). To do this, the system is configured as in the blue layout of Figure 5. The γ stage is not moved during a non-dispersive scan, since the total width of this scan is typically only about 10 second, so there is no issue of the system walking across the angular spread of the incoming x-ray beam by any significant amount. Because this scan is critical for the calibration of the instrument, the ω stage is stepped in 10−5 ° steps, and allowed to settle for 1 s after each step before data collection commences. The value of the angular encoders is read before and after each point is taken, to verify that the system has not drifted significantly. Each exposure is 1 s. This procedure results in a curve which looks like that in Figure 13a. The process by which this analysis takes places is described in section V. The angles at which the non-dispersive intensity is maximized are called ω0 and γ0. Figure 13b shows a vertically resolved map of the intensity. If the crystals are correctly aligned, this will present a vertical pattern. The variation of the brightness vertically is due to our small first slit imaging the filament of the x-ray source onto the camera; the data include about two full turns of the filament. This variation is seen both in non-dispersive and dispersive mode.
C. Dispersive scanning
Once the non-dispersive condition for the instrument is established, the crystals and camera are rotated into a configuration as shown in the red part of Figure 5. This involves moving the γ stage to γ0 + 4θB and the ω stage to ω0 + 180° − 2θB where θB is the nominal Bragg angle at the center of the scan, approximately 53.35° for the Kα1 line. To ascertain that the system is reasonably centered on the incident beam, the γ stage is scanned and γ0 recomputed so that maximum intensity is observed. This can be done more precisely in dispersive mode than in non-dispersive mode, since the horizontal angular acceptance of crystals is very small. A typical γ scan is shown in Figure 7.
Once the center of the beam is well established, the stages are moved with coupled angles such that
| (23) |
V. DATA ANALYSIS
Previous analyses of this spectrum have shown that it can be reasonably well represented as a sum of four Lorentzian peaks[12]. Our data collection allows us to determine the shape in the tails very well, since the instrumental background is directly measured, so that we also can resolve a weak continuum from bremsstrahlung. Two data collection runs were made, one in late 2015, and another in mid-2106; in between these, the instrument was completely disassembled and reconfigured, and one of the crystals remounted on its base. The comparison of these two sets gives some information about possible systematics due to the alignment of the machine.
We present three different analyses of the data. First, we present quadratic fits to the top of the Kα1 peak, for comparison to previous papers. Second, we present a multiple-Lorentzian fit to the data sets, as per [12] and its successors. Finally, we present a least-squares cubic-spline to the data, which is a high-accuracy, model-independent fit which will be the preferred representation for the data set. We will demonstrate that the first two techniques, although useful for comparison to literature, are not capable of providing unbiased estimates of the shape of the spectrum.
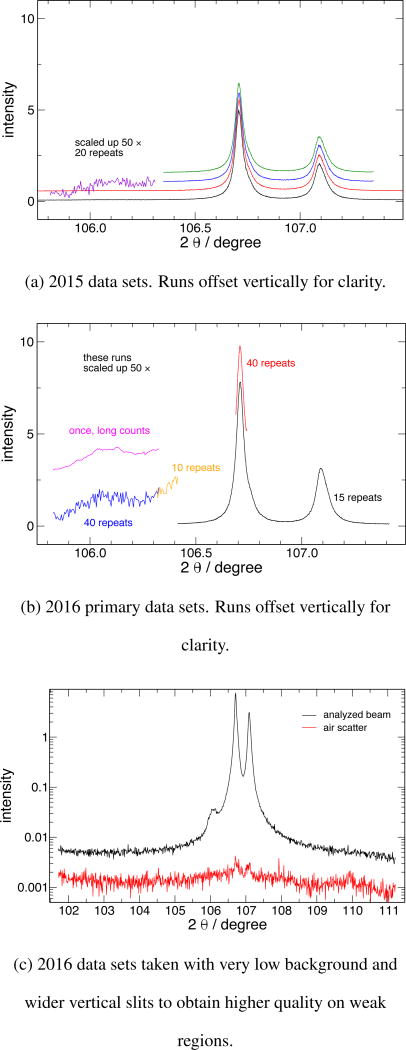
Figure 12 shows a sample scan on a log-vertical scale, in which the relative heights of all of the components can be seen. Figure 14 shows an overview of all the data that were analyzed for this work, comparing the data collection strategy for the two runs. The various scans have been offset vertically for visibility. Each run consisted of repeated scans of different regions of the spectrum, to accumulate counting statistics and replicates of the data from each region. Table I lists the statistics on the scans taken. Before the fitting can be carried out, conversion of the angular scale to an energy scale must be carried out. This involves some geometrical corrections and materials corrections.
Figure 14.
Synoptic view of all data sets analyzed. Data have binned for improved statistics in display. The low-intensity Kα3,4 region is scaled.
Table I.
Summary of data.
| year | angular region (°2θ) | step size (°2θ) | steps | dwell (s) | scan count |
|---|---|---|---|---|---|
| 2015 | 105.70 – 107.70 | 0.0002 | 10000 | 4 | 2 |
| 2015 | 106.35 – 107.35 | 0.0002 | 5000 | 4 | 2 |
| 2015 | 105.80 – 106.30 | 0.0002 | 2500 | 4 | 20 |
| 2016 | 106.40 – 107.40 | 0.0002 | 5000 | 5 | 15 |
| 2016 | 106.675 – 106.725 | 0.0002 | 250 | 5 | 40 |
| 2016 | 105.81 – 106.31 | 0.0002 | 2500 | 5 | 40 |
| 2016 | 106.30 – 106.40 | 0.0002 | 500 | 5 | 10 |
| 2016* | 101.5 – 111.5 | 0.005 | 2000 | 30 | 1 |
| 2016* | 105.81 – 106.31 | 0.0002 | 2500 | 30 | 1 |
note adjusted slits for very low background, to measure weak regions: axial limiting slits opened to 2 mm, downstream scrapers closed
A. Axial divergence correction
The function I (ω,γ,ψ), which is directly measured, must undergo transformation to correct the measured diffraction angle ω for geometrical effects due to the X-ray path not being perpendicular to the vertical axis of the crystals (ψ ≠ 0). This correction is commonly called the axial divergence (since it is in the direction of the rotation axis of the crystals) or vertical divergence (since in most high-precision machines the rotation axis is vertical). Following through the geometry yields a purely geometric formula for the offset ΔθB where ΔθB = θobserved − θcorrect:
| (24) |
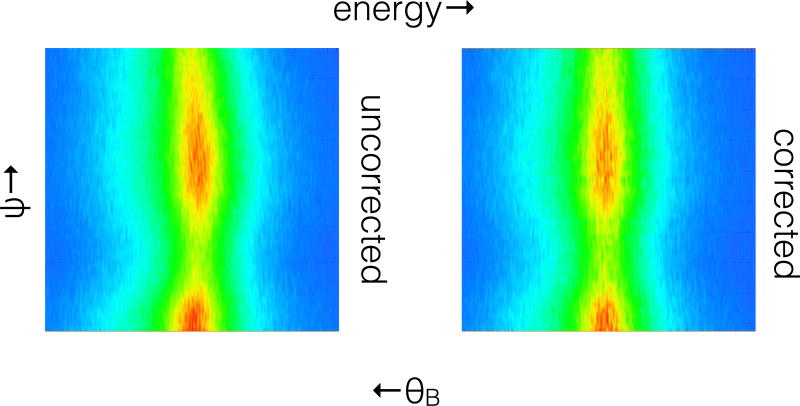
where θB is the Bragg angle, ψ is the angle offset of a given X-ray path from the horizontal, and δ1 and δ2 are the tilt angles of the two crystals out of vertical. Note that this formula is specific to the path of a single X-ray; it has not been integrated over the acceptance of any slits. The quadratic form implies that one expects to see the apparent Bragg angle curve away from correct value as the beam is shifted out of the plane of dispersion. In Figure 15, this effect is illustrated. The left-hand image is a map of I (ω,γ,ψ), as measured. Note that, from 1, ω = −2θB. The curvature of the diffraction peak is evident. The right-hand image shows this effect, as corrected by the procedure described below. First, we must derive from 24 the relation between the data on the image, ψ, and the actual θB. This requires knowledge of the crystal tilt angles δ1 and δ2, along with the vertical position ψ0 on the image which corresponds to the extremum ΔθB0 = ΔθB (ψ0). To do this, we solve for the extremum of 24:
| (25) |
Figure 15.
Map of I (ω, γ, ψ) across Kα1 in dispersive mode. Vertical variation is image of coiled filament of electron gun, projected through the slits.
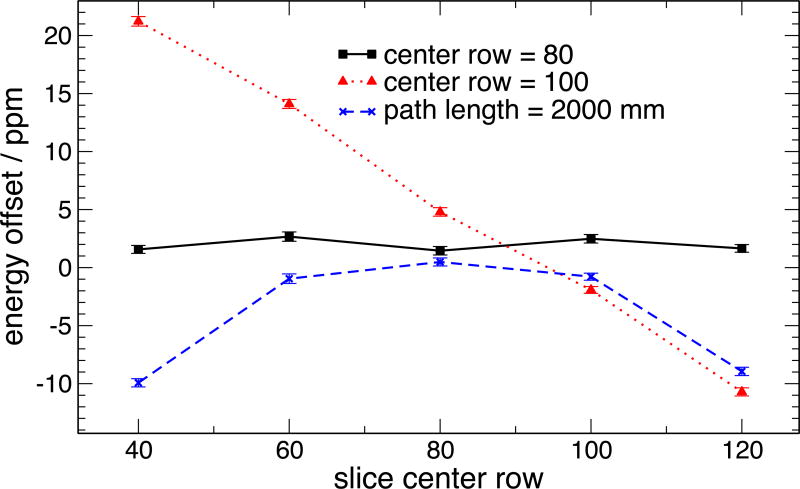
Note, though, that the data provide information about ψ0; we can fit the apparent position of the Bragg peak vs. ψ to find the position on the camera at which the extremum is found. Also, note that ΔθB0 is quadratic in δ1 and δ2; the crystal tilts do not strongly affect the Bragg peak position, as long as the position is measured at its extremum. In theory, determining ψ0 could be carried out by directly doing our final data fits with all parameters including ψ dependence; this would require parametrizing the vertical dependence of the intensity and the background, and is quite unwieldy. Instead, to find the center angle ψ0, we can slice the dataset into ranges of ψ, and compute the position of the Bragg peak for each slice. Figure 16 shows the results of this process. Note that for the purposes of all fitting, angles have been converted to X-ray energies as described below. This shows the results of various errors in the computation of ψ. The black (solid) curve shows the apparent energy vs. vertical position when ψ is correctly computed. The red (dotted) curve shows the dependence on vertical position when ψ0 is incorrect. The blue (dashed) curve shows the dependence when the beam path length is incorrect, since ψ = y/L, where y is the position on the camera face, and L is the path length. The result is very sensitive to both ψ0 and L. This sensitivity will be discussed quantitatively below.
Figure 16.
Dependence of Bragg peak position on vertical beam position on camera, as a function of the center angle ψ0 and beam path length L. Error bars are pure 1σ statistical errors from the fits.
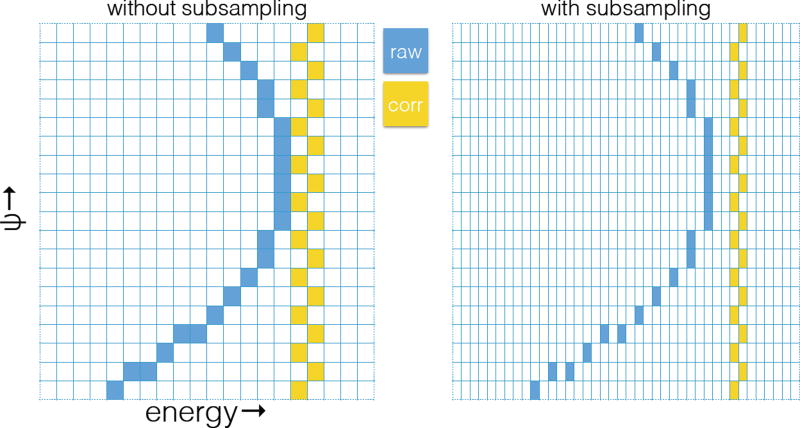
Using the values of L and y0 = Lψ0, we can re-bin the collected data as shown in Figure 15. To do this, we start with a map as in the left-hand side of the Figure, and shift pixels horizontally by an amount computed from 24. This process is illustrated in Figure 17. The left-hand side shows the process if we restricted ourselves to shifts by an integral number of horizontal steps. This results in significant uncertainty in the resulting position due to discretization of the energy bins. The blue boxes represent data as collected, corresponding to the left-hand side of Figure 15; the gold boxes represent data after the ψ-dependent horizontal shift has been applied, corresponding to the right-hand side of Figure 15. The right hand side of Figure 17 shows the process in which we take the raw pixel set, and increase the sampling density by a factor of two by inserting empty bins, and then compute the correction on this sub-sampled grid. The narrow width of the corrected data in this case relative to the non-subsampled case shows the benefit of subsampling. Our real data analysis used a sub-sampling factor 4; no benefit was seen for higher values.
Figure 17.
Schematic of process to re-bin I (ω,γ,ψ) to correct for axial divergence.
B. Determination of flight path L
Figure 16 highlights another issue in the data analysis: the axial divergence correction is dependent on the path length of the beam from the upstream slit to the detector, since the angle ψ is set by ψ = (y − y0)/L where y is the vertical position of a row of pixels on the camera, y0 is the centerline of the system (as determined by ψ0, the angle at which the extremum of the axial divergence parabola is found), and L is the path length. Intentionally incorrect choice of L results in the blue, dashed curve of Figure 16. To attain an accurate axial divergence correction, L must be determined to a level that minimizes its contribution to the error budget. The flight path of the beam follows the multiple bends of the 6-bounce crystal system, as well as traversing the distance from the camera window to the actual active surface of the detector. Careful measurements have set this distance as 1198 mm ± 20 mm, with the error bound due to the difficulty of finding straight paths to place rulers in the system without damaging the crystal optics. Using this value results in slight curvature in a plot equivalent to that of Figure 16. However, we can fit the curvature measured from such a plot, and compute an improved flight path estimate of 1218 mm. We can also estimate the effect of the curvature on the peak positions, and set a type B contribution to uncertainty based on this analysis. The axial divergence error is quadratic, ΔE = α(L − L0)y2, assuming we have y defined so that the extremum of the curve is at y = 0, and α is a constant of proportionality. Computing the average value of this over a symmetric window running from y = −y1/2 to y = y1/2 yields . Then, if L is exactly correct, the apparent energy correction 〈ΔE〉 as computed from the vertically-averaged axial-divergence-corrected data will be independent of the window height y1. Equivalently, this gives an extrapolation formula to compute the correction 〈ΔE(y1 = 0)〉, the correction, given a value L for the flight path, for a system with y1 = 0, i.e. for a system with no height and no axial divergence. This correction can be worked out, for a measured energy E1 when y1 = a and a measured energy E2 when y1 = b:
| (26) |
Using this formula, and expressing (for convenience) energies as a parts-per-million (ppm) shifts from 8047.8 eV, we get the results in table II. There is no extrapolation for L = 1218 mm, since this is the value which produces no quadratic variation. Note that the extrapolation agrees to 0.02 ppm in the energy shift over the range of L values consistent with our estimate of the uncertainty in our ability to measure L; however, even an error of a factor of 2 in L only results in 0.2 ppm shift in the energy scale when this extrapolation is carried out. This conclusively demonstrates that analysis of the data set itself contains sufficient information to determine L to the requisite level, without direct measurement. The optimized value L = 1218 mm is used for processing the data for the final analysis.
Table II.
Extrapolation of axial divergence correction to zero system height as a function of path length error.
| L (mm) | y1(pixels) | ΔE (ppm) | ΔE (y1 = 0) (ppm) |
|---|---|---|---|
| 2400 | 110 | −6.43 | |
| 2400 | 80 | −2.74 | 1.40 |
| 1218 | 110 | 1.23 | 1.23 |
| 1198 | 110 | 1.57 | |
| 1198 | 80 | 1.40 | 1.21 |
C. Dynamical diffraction correction
After the conversion of I (ω,γ,ψ) into I (θ,ψ) by means of the axial divergence correction, I (θ,ψ) can be summed along ψ to yield I (θ) (and likewise for B(θ)). To convert the angular scale to an energy scale, it is also necessary to apply further corrections. The dynamical asymmetry correction, computed from the McXtrace model, as shown in Figure 10 must be represented in θB space as opposed to the energy space of Figure 10; the correction is ΔθB = +0.20 second. When the correction for effects of axial divergence, shown in Figure 15 is applied, a residual degree of profile broadening results, resulting from the finite height of the slit form which the beam diverges. This causes slight shift in angle related to the upstream slit height, which can be computed by averaging equation 24 over a slit of height a at distance L from the detector. This gives ΔθB = a2 tan θB/(24L2) = −0.002 second for our 500 µm slit; this shift is applied but is insignificant. Then, it is necessary to assign a photon energy scale to the resulting angular scale, via Bragg’s law and dynamical diffraction corrections for the index of refraction of the silicon crystals. The first step in this is computing the index of refraction of silicon to sufficient precision to support this. This refraction correction is the largest of the corrections which will be applied. The complex index is normally written as (see section 1.7 of [33], e.g.)
| (27) |
where re is the classical electron radius, λ is the X-ray wavelength, j runs over the atomic species present, nj is the number atomic density of species j, and fj (λ,0) = f1,j (λ,0) + i f2,j (λ,0) is the q = 0 value of the atomic scattering factor for an X-ray of wavelength λ. We have compared tables from two sources, FFAST [34–36] and the LBNL tables [37, 38]. In the energy range relevant to this project, these two sources agree on f1 (which affects δ) to within 0.1%; this difference is included in our final type B error estimate. We interpolated the value for f1 using linear interpolation in log E vs. f1. and for f2 using linear interpolation in log E vs. log f2, since f2 varies roughly as a power law between absorption edges. The values from the FFAST tables which bracketed our region are in table III. From the index derived from this interpolation, we compute the wavelength in vacuo from the diffraction angle via 22. This is then converted to energy using E = hc/λ, using the CODATA 2010* [24] value hc = 1239.841929924 eV nm.
Table III.
FFAST values for the atomic scattering form factors of silicon bracketing our energy range
| E (keV) | f1 | f2 |
|---|---|---|
| 7.902609 | 14.2709 | 0.34129 |
| 8.447890 | 14.2537 | 0.30059 |
D. Spectrum fitting
At this point, the raw data sets {B(ω, γ, ψ)} and {I (ω,γ,ψ)} have been reduced to the sets {B(E)} and {I (E)}, the scattering background and on-peak X-ray intensity as measured for angles corresponding to the photon energy E. In this form, they are ready for non-linear, weighted, least squares fitting to our model function, a sum of Lorentzians plus a linear continuum for the diffracted beam, and a cubic for the scattered background. The details of the fitting machinery will not be discussed, since any fitting package could used. The functions fit are:
| (28) |
The Ei are the centers of the Lorentzian peaks, the Γi are the full-width at half maximum (FWHM) of peak i. The index i runs over the four Lorentzians which make up the standard representation of the main Kα1–Kα2 complex, plus four more for the Kα3,4 group. Ec is just used to center the polynomial fit, and is set to 8047 eV. T(E) is the product of all of the transmission and efficiency corrections described in the subsections of section II; T(E) contains no free parameters. All other parameters are allowed to vary independently, except for the widths of one pair of lines in the Kα3,4 group which share the same upper state, hence the same width, and the other pair of Kα3,4 components, which fit to the same width and are now so constrained; this is discussed further below. The data are weighted with pure Poisson statistics w = 1/n where n is the number of photon counts in the bin. The weight is initially set to 1/(nk +1) where nk is the number of counts in bin k, to avoid possible divide-by-zero errors in the startup of the fit; after a few convergence passes, w is reset to w = 1/nfit, where nfit is the (no longer integer) bin mean value computed from the fit function.
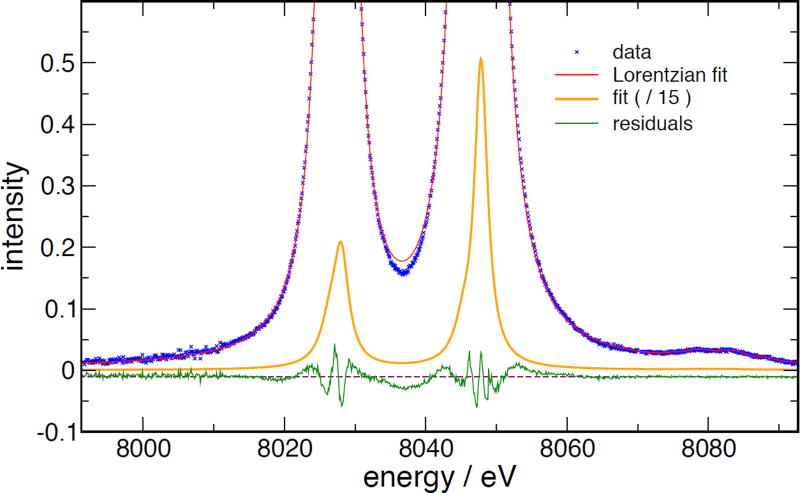
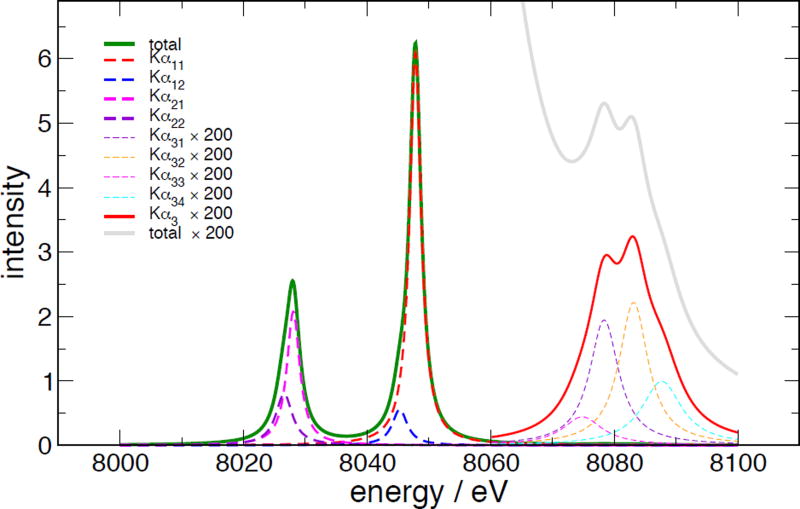
Table IV shows the results of this fitting procedure from the 2016 data. The second index of sub-components of a major line, e.g. Kα32, is not indicative of any meaningful spectroscopic assignment; these are our own indices for book-keeping. The summed intensity for the three components includes the full variance-covariance matrix to propagate the errors. It is worthy of note how much smaller the uncertainties in the areas of the grouped peaks are; because the various components are heavily overlapped, individual areas are quite uncertain, but the total strength of each group is very well defined. (See discussion of correlation matrix, below) Figure 18 shows the data and fit. The residuals highlight significant discrepancies between the multiple-Lorentzian model and the actual spectral shape, which result in such models producing biased estimates of the peak shape parameters. This is clearly an issue with the 4-Lorentzian model for this region; the same issue is visible in the data from [39]. The authors have spent significant effort searching for a way to improve this without introducing many more parameters, without success. Figure 19 shows the peak shapes extracted from the fit. Note that in this plot, the function B(E) is not included; this is the net peak intensity which would result from an idealized detector, without scattering background.
Table IV.
Table of peak parameters, from 2016 data sets, with pure statistical (k=1 type A) uncertainties. Wavelengths in nm and widths in pm are included for easy use in analysis software.
| component | energy eV |
±1σ |
λ nm |
FWHM eV |
±1σ | FWHM pm |
Area | ±1σ |
|---|---|---|---|---|---|---|---|---|
| Kα11 | 8047.8254 | 0.0003 | 0.154 059 25 | 2.275 | 0.001 | 0.0436 | 3.91 | 0.0023 |
| Kα12 | 8045.2956 | 0.0047 | 0.154 107 69 | 2.915 | 0.009 | 0.0558 | 0.474 | 0.0023 |
| Kα11 + Kα12 | (correlated sum) | 4.39 | 0.00089 | |||||
| Kα21 | 8028.0503 | 0.0027 | 0.154 438 73 | 2.529 | 0.005 | 0.0487 | 1.53 | 0.0085 |
| Kα22 | 8026.5386 | 0.0092 | 0.154 467 82 | 3.274 | 0.008 | 0.0630 | 0.754 | 0.0085 |
| Kα21 + Kα22 | (correlated sum) | 2.28 | 0.00085 | |||||
| Kα31 | 8078.6274 | 0.0584 | 0.153 471 85 | 5.51 | 0.136 | 0.1047 | 0.0153 | 0.00042 |
| Kα32 | 8083.3528 | 0.0383 | 0.153 382 14 | 5.51 | 0.136 | 0.1046 | 0.0182 | 0.00051 |
| Kα33 | 8074.9536 | 0.146 | 0.153 541 68 | 3.22 | 0.213 | 0.0612 | 0.0016 | 0.00031 |
| Kα34 | 8088.1086 | 0.0569 | 0.153 291 95 | 3.22 | 0.213 | 0.0610 | 0.0034 | 0.00034 |
| Σ Kα3 | (correlated sum) | 0.0408 | 0.00025 | |||||
| Σ Kα2/Σ Kα1 | (correlated ratio) | 0.52 | 0.00022 | |||||
| Σ Kα3/Σ Kα1 | (correlated ratio) | 0.0090 | 0.0002 | |||||
| Kα1 top | 8047.8162 | 0.00038 | 0.154 059 42 | (extrema of multi-Lorentz fit) (uncertainties from resampling) | ||||
| Kα2 top | 8027.9435 | 0.0022 | 0.154 440 79 | |||||
Figure 18.
Plots of fit to data, with residuals. The dashed line is to guide the eye to the zero of the residuals.
Figure 19.
Separated peak components from the fit.
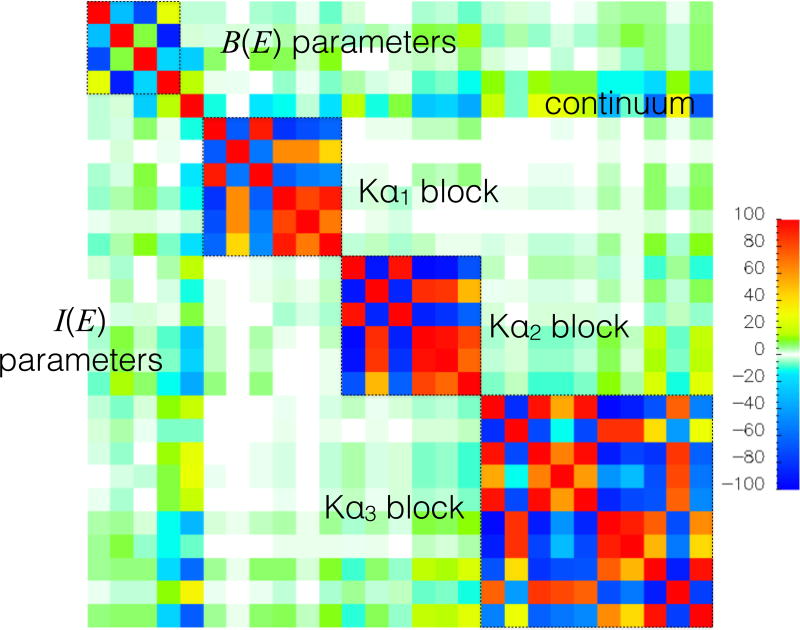
The correlation matrix from this fit is shown in Figure 20. The extreme block-diagonal structure of it makes it clear that peaks within each group are completely entangled, and the intensities, positions, and widths of individual components are not well determined. However, collective properties of the groups, such as the area and position of the top, are very well determined. Thus, the area ratios Kα2/Kα1 and Kα3/Kα1 have very small statistical uncertainties. Also, B(E), the scattering background, is almost completely uncorrelated with all other parameters; this is what makes it possible for our system to measure very weak intensities, such as those of the Kα3,4 group, next to very strong peaks, with confidence.
Figure 20.
Correlation matrix, in %.
E. Peak top fitting
Independently of the full-spectrum fits, which introduce model dependencies into the determination of the brightest point on the spectrum, we fit quadratic polynomials over the tops of data sets which included only the Kα1 peak. This provides an independent estimate of the brightest point, and is most directly comparable to the results of [39], and is the metric putatively reported in data compilations [5, 6].
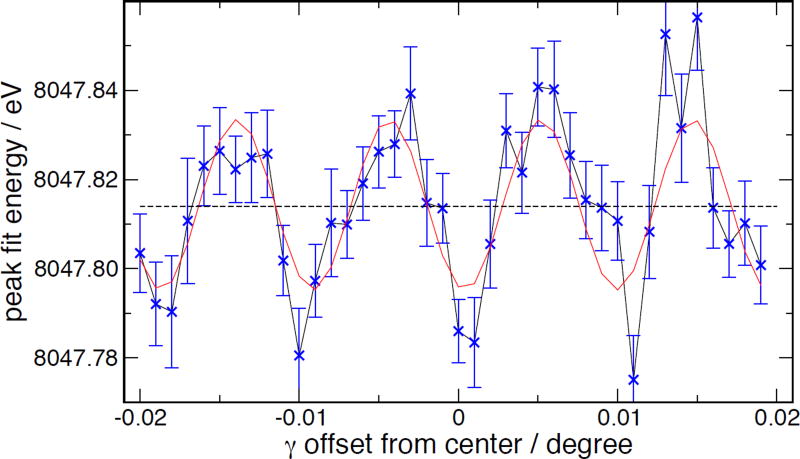
As noted in section II E and Figure 7, the X-ray camera does not have completely uniform sensitivity across its pixels. The multi-Lorentzian fits are relatively insensitive to this, since the beam moves across many pixels while the whole peak is acquired. Nevertheless, the multi-Lorentzian fits from the 2016 data set included a scan over multiple γ-offset values to further average this behavior out. On the other hand, the peak top fits are the result of 0.05° scans across the peak, and the beam only moves approximately one pixel across the camera face. This results in significant distortion of the peak shape and of the apparent position of the brightest point. Figure 21 shows these results quantitatively as a function of the γ-offset angle of the goniometer, which shifts the position of the X-ray image on the camera across pixel boundaries. The bias in the result can be modeled empirically as a sinusoidally varying offset from the true value; a fit to a sinusoid plus a constant is shown in the red curve of Figure 21. This results in a position for the brightest point of Kα1 of 8047.815 eV ± 0.002 eV where the reported uncertainty is the pure 1σ statistical value, based on the 2016 data set.
Figure 21.
Quadratic-fit derived peak top positions, plotted as a function of goniometer angle γ, showing effect of camera response non-uniformity across pixel boundaries on the apparent position. Blue crosses, measurements; red curve, sinusoidal fit. (2016 data)
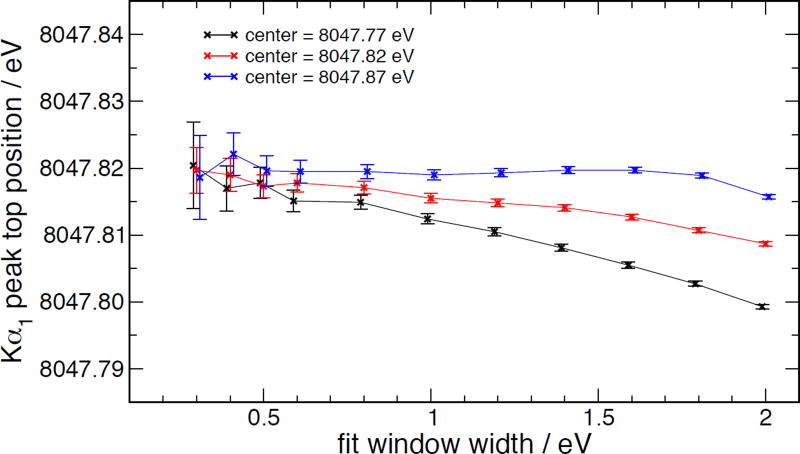
The fit was carried out using a range of windows from 0.2 eV to 1.2 eV half-width window centered at 3 positions near the top of Kα1 to estimate the contribution of bias from the asymmetry to the result. The convergence of the results to a common value for narrow fit windows (with wider error bars since less data lies within the window) implies a results of 8047.817 eV ± 0.004 eV. The error bound is just an estimate from the consistency of the different curves in Figure 22. For an arbitrary, asymmetric peak, a fit to position of the peak top is nonetheless problematic; it involves using information from just around the top of the peak, where there is the least information about position, since it is close to an extremum.
Figure 22.
Quadratic-fit derived peak top positions, plotted as a function of the fit window parameters. (2016 data)
VI. ERROR ESTIMATION
The estimate of total uncertainties on the parameters from this experiment is based on a combination of the statistical uncertainties from the data themselves, combined with estimates of the contribution of systematic errors, per the method stated in the Guide to Uncertainty in Measurement (GUM) documents [14, 15]. Table V shows some critical fit parameters, as computed using various data sets and fitting scenarios; these results give hints as to the reliability of the parameters from the multi-Lorentzian fits due to instrumental alignment effects and pulling of results due to inaccuracies in the model. The comparison between the 2015 data and the subset of the 2016 data which is equivalent (no extra data sets over the top of Kα1) shows the reliability of the instrument itself. However, the position of the highest point computed from the Lorentzian fits is biased by the inaccuracies of the model function, and varies by much more than the instrumental component. It is for this reason that we provide the full spectrum shape as supplementary data to this paper; none of the models represents the actual data set to its full accuracy. Table VI lists these estimates from the Lorentzian fits, based solely on the 2016 data sets. The authors are, however, suspicious of quoting a final k=2 expanded uncertainty in this peak position of 2×0.13 = 0.26 ppm which corresponds to 0.002 eV which is just larger than 10−3 of the FWHM of the peak. The data of table V clearly rule out the use of the Lorentzian fits to compute peak tops this well, since the fit systematics are much worse than this. Using the quadratic fits to the peak tops, we arrive at a final peak-top position and k=2 expanded uncertainty 8047.817(8) eV. Based on the measured intensity stability of our system, we also will quote the intensity ratios of the lines with k=2 expanded uncertainties of Kα2/Kα1 = 0.520(2) and Kα3,4/Kα1 = 0.0090(5), based on the multi-Lorentzian fit. Note that the Kα3,4/Kα1 ratio is significantly below the previously reported values of around 0.011; the result is strongly dependent on the ignored (in previous cases) or measured (in this work) intensity of the underlying bremsstrahlung. Also, we do not quote top positions for Kα2, since the peak is so asymmetrical that the systematics make such a measurement nearly meaningless.
Table V.
Summaries of various data sets and fits
| scenario | Kα1 peak top / eV | ΔE / E0 vs. Härtwig / ppm | λ / nm | Kα2/Kα1 intensity |
|---|---|---|---|---|
| 2015 data | 8047.810 | −1.65 | 0.154 059 54 | 0.518 |
| 2016 without extra peak tops | 8047.811 | −1.51 | 0.154 059 52 | 0.518 |
| 2016, 5 % relative error weighting | 8047.815 | −1.08 | 0.154 059 45 | 0.521 |
| 2016, pure Poisson weighting | 8047.817 | −0.84 | 0.154 059 41 | 0.521 |
| quadratic peak tops | 8047.817 | −1.84 | 0.154 059 41 | n/a |
Table VI.
Contributions to the k=1 uncertainty of the position of the Kα1 peak, from the 2016 data. All contributions except the counting statistics are type ’B’
| correction source |
magnitude (ppm) in λ |
uncertainty (ppm) |
explanation |
|---|---|---|---|
| counting statistics | 0.00 | 0.05 | contribution of type A from bootstrapped fits |
| axial divergence | −5.00 | 0.01 | 1218.4 mm axial fit, limited by survey consistency with extrapolation |
| slit height | −0.002 | 0.00 | Δθ = a2 tan θ/(24L2) |
| temperature | −6.63 | 0.05 | (t = tlab) − (t = 22.5) lattice parameter shift from crystal lattice reference temperature, limited by 0.02C temp uncertainty |
| index of refraction | −11.78 | 0.02 | δ/ sin2 θ, limited by form factor uncertainty estimated at 0.2 % |
| dynamical asymmetry | 0.70 | 0.01 | very good non-dispersive mcxtrace rocking curve model agreement implies this is very well known |
| efficiency slope T (E) | 0.03 | 0.05 | from atmospheric pressure 10 % bounds + anode self-absorption lfact estimate variation from 0.5 to 1.0 |
| angle errors | 0.00 | 0.09 | assuming 0.05 second k=1 uncertainty [20] |
| Si d-spacing | 0.00 | 0.03 | in vacuo uncertainty |
| Si atmospheric compression | 0.35 | 0.015 | 95 kPa to 105 kPa atmospheric pressure range (extreme limits) |
| quadrature sum | 0.13 |
VII. COMPLETE SPECTRUM (SUPPLEMENTARY DATA)
The traditional 4-Lorentzian used for the shape of the Kα1 – Kα2 complex, augmented with 4 more Lorentzians for the Kα3,4 complex, and a contribution from a bremsstrahlung continuum, provides a useful model of the complete copper Kα spectral region. Nonetheless, the data presented in this work show correlated residuals when compared to this model which far exceed their error bounds. As a result, it is important to present the entire spectrum as a numerical data set as supplementary information to this work, so that future improvements to the models can be tested against the full, high-precision data set. To present the data, we have pooled all of the year-2016 data sets so that the region around Kα1 – Kα2, where we have collected the most statistically significant results, is presented on a grid of 0.01 eV, the region around Kα3,4 is presented on a grid of 0.1 eV, and the region in the tails, where there is no significant structure, is gridded at 1.0 eV. Each point is presented as a bin center energy, with an absolute energy accuracy of the bin center of 0.002 eV within 95% confidence limits (per table VI, with the counting statistics contribution removed), an intensity of the spectrum at that point, and k = 1, non-expanded counting statistics uncertainty on that intensity. These intensities have been corrected for the efficiency slope T(E). The data are also provided in a much sparser format, as a cubic spline coefficient table. The coefficients are derived from a least-squares fit of the spline to the data. This table has 102 entries, and the resulting spline fits the data to χ2 = 1.10. Increasing the number of spline knots does not rapidly decrease χ2. Each row of the table has three columns: energy (in eV) (e), intensity (y), and the second derivative (y″). If the two entries bracketing an energy e have values e1, y1, and e2, y2, , then the interpolated intensity at e is found by:
| (29) |
VIII. DISCUSSION AND SPECTROSCOPY
The choice of the 4-Lorentzian shape for the Kα1–Kα2 complex has been thoroughly discussed by the authors of previous papers on this subject. However, the choice is essentially empirical; there is substructure in the spectrum, and the result is well approximated by this shape, but it is distinctly not perfect. Figure 4 of [40] shows various options for underlying structure computations. The fact that the fits over-estimate the intensity in the trough between Kα1 and Kα2 implies that the shape is not right, and not in a simple way. If the fit were underestimating this intensity, one could easily add another line of some width to fill in the gap; a correction is needed here in the opposite direction. Adding other Lorentzians, per [41], to fill in 1s3d states, did not improve the fit. Fits were also attempted used multiple Voigt functions, as in [42]; this also resulted in no significant decrease in χ2. The measured intensity ratio for the total strength of the Kα2 complex relative to the Kα1 complex of 0.518(2) supports current literature [40, 41].
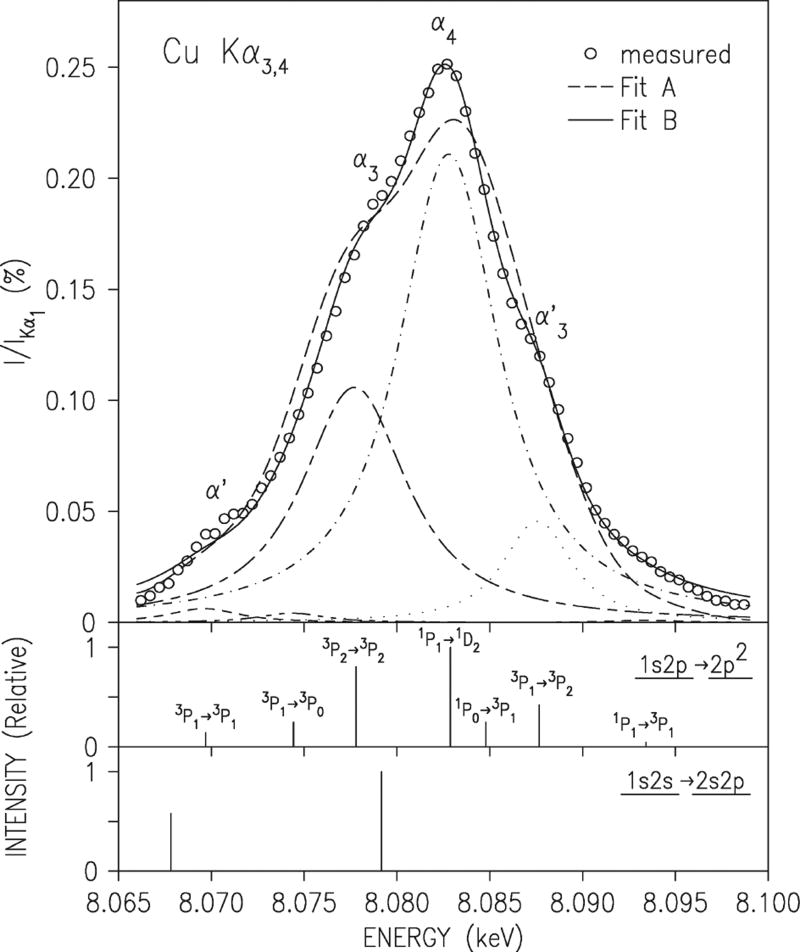
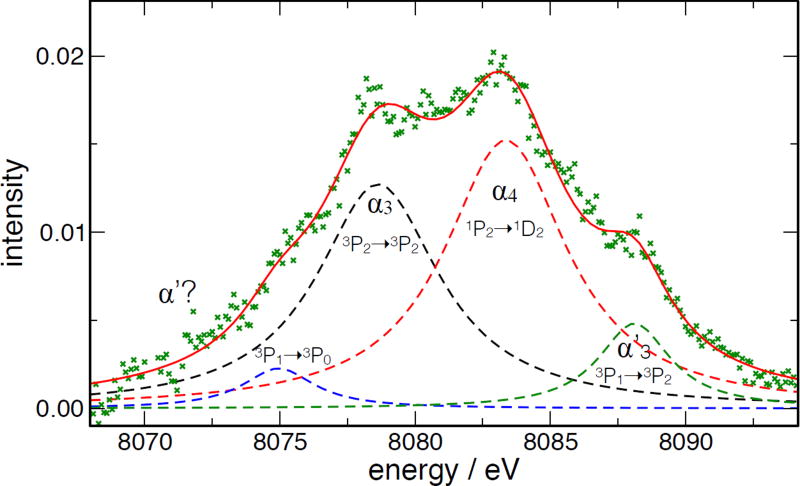
The situation in the Kα3,4 region is more difficult; the intensity here is very low, and the complex rides on the Lorentzian tails of Kα1. Figure 23 shows the measurements and fits to this region from Figure 13 of [40]; the tails of the fit are not very good, indicating a possible issue with the assumptions about the shape of the underlying Kα1 tail. Figure 24 shows the current measurement, with the tails of the strong peaks subtracted using the parameters from the global fit. Note the large number of data points in the set; the statistics here are very good, and the lines are much better resolved than what is shown in Figure 23. The red curve shows the global fit in this region; the agreement is very good, even in the tails of Kα3,4. The spectroscopic assignments shown are based on [40], with one critical difference: we assign the peak on the low-energy shoulder to 3P1 → 3P0 since the 3P1 → 3P2 line, which comes from the same upper state, is quite strong. The statistics are not good enough in either the data set from [40] or in our data to resolve the α′ component of this complex; if it is present, it is quite weak. Also, the intensity ratios are quite different. We have no sure explanation for why the shape of the complex as we measure it is so different from that of [40]; however, the peak sits on a steeply sloping tail of Kα1, and small errors in determination of the shape of this tail could result in large changes to the apparent intensity of these lines.
Figure 23.
Previous measurement and fits to the Kα3,4 complex, from Figure 13 of [40].
Figure 24.
Current measurement and fits to the Kα3,4 complex.
IX. CONCLUSIONS
A new measurement of the copper Kα emission complex has been provided using a modified, coaxial double-crystal diffractometer which is capable of measurement in non-dispersive and dispersive modes such that the zero of the angular scale is determined, resulting in a high-resolving-power measurement with minimized uncertainty in the reference point of the angular scale. Distilling this measurement down to a small set of parameters, as has been done in previous work, results in an incomplete representation of the data, and the fine details of how the reduction is done (fitting peak window for quadratic fit to peak tops, number of Lorentzians in a more complex fit, weighting of different regions of a fit) affect the extracted parameters strongly. These systematic biases require enlarging previously published uncertainties for parameter values, of which there are only 2 primary, SI traceable measurements (Deslattes and Härtwig). Because of this, we provide two representations of the entire shape of the spectrum in this region as supplementary data: a binned-statistics presentation of the original data, and a least-squares cubic spline which provides a compact representation of the spectrum with high fidelity to the underlying measurements. Both of these representations are provided with respect to an energy scale which is traceable to the SI definition of the second, with a k=2 expanded uncertainty in this scale of ΔE/E = 2.5×10⁻⁷.
Supplementary Material
Acknowledgments
Author C.I. Szabo performed this work under the financial assistance award No. 70NANB15H051 from U.S. Department of Commerce, National Institute of Standards and Technology.
Footnotes
Certain commercial equipment, instruments, or materials are identified in this paper in order to specify the experimental procedure adequately. Such identification is not intended to imply recommendation or endorsement by the U.S. government, nor is it intended to imply that the materials or equipment identified are necessarily the best available for the purpose.
References
- 1.NIST. SRM certificate. NIST, U.S. Department of Commerce; Gaithersburg, MD, USA: Mar 10, 2015. Standard Reference Material 660c: Line position and line shape standard for powder diffraction (lanthanum hexaboride powder) URL https://www-s.nist.gov/srmors/view_detail.cfm?srm=660c. [Google Scholar]
- 2.NIST. SRM certificate. NIST, U.S. Department of Commerce; Gaithersburg, MD, USA: Mar 10, 2015. Standard Reference Material 640e: Line position and line shape standard for powder diffraction (silicon powder) URL https://www-s.nist.gov/srmors/view_detail.cfm?srm=640e. [Google Scholar]
- 3.NIST. SRM certificate. NIST, U.S. Department of Commerce; Gaithersburg, MD, USA: Jun 24, 2015. Standard Reference Material 1976b: Instrument response standard for X-Ray powder diffraction. URL https://www-s.nist.gov/srmors/view_detail.cfm?srm=1976b. [Google Scholar]
- 4.Bearden JA. X-ray wavelengths. Rev. Mod. Phys. 1967 Jan;39(1):78–124. doi: 10.1103/RevModPhys.39.78. [DOI] [Google Scholar]
- 5.X-ray transition energies. Standard Reference Database 128. NIST, U.S. Department of Commerce; Gaithersburg, MD, USA: 2016. URL http://www.nist.gov/pml/data/xraytrans/index.cfm. [Google Scholar]
- 6.Deslattes Richard D, Kessler Ernest G, Indelicato P, de Billy L, Lindroth E, Anton J. X-ray transition energies: new approach to a comprehensive evaluation. Rev. Mod. Phys. 2003 Jan;75:35–99. doi: 10.1103/RevModPhys.75.35. [DOI] [Google Scholar]
- 7.Deslattes Richard D, Henins Albert. X-ray to visible wavelength ratios. Phys. Rev. Lett. 1973 Oct;31(16):972–975. doi: 10.1103/PhysRevLett.31.972. [DOI] [Google Scholar]
- 8.Becker Peter, Dorenwendt Klaus, Ebeling Gerhard, Lauer Rolf, Lucas Wolfgang, Probst Reinhard, Rademacher Hans-Joachim, Reim Gerhard, Seyfried Peter, Siegert Helmut. Absolute measurement of the (220) lattice plane spacing in a silicon crystal. Phys. Rev. Lett. 1981 Jun;46(23):1540–1543. doi: 10.1103/PhysRevLett.46.1540. [DOI] [Google Scholar]
- 9.Kessler EG, Henins A, Deslattes RD, Nielsen L, Arif M. Precision comparison of the lattice parameters of silicon monocrystals. J. Res. NIST. 1994 Jan;99(1):1–18. doi: 10.6028/jres.099.002. [DOI] [PMC free article] [PubMed] [Google Scholar]
- 10.Schweitzer WG, Kessler EG, Deslattes RD, Layer HP, Whetstone JR. Description, performance, and wavelengths of iodine stabilized lasers. Appl. Opt. 1973 Dec;12(12):2927–2938. doi: 10.1364/AO.12.002927. [DOI] [PubMed] [Google Scholar]
- 11.Härtwig J, Hölzer G, Wolf J, Förster E. Remeasurement of the profile of the characteristic Cu Kα emission line with high precision and accuracy. J. Appl. Cryst. 1993;26(4):539–548. doi: 10.1107/S0021889893000160. [DOI] [Google Scholar]
- 12.Hölzer G, Fritsch M, Deutsch M, Härtwig J, Förster E. Kα1,2 and Kβ1,3 x-ray emission lines of the 3d transition metals. Phys. Rev. A. 1997 Dec;56(6):4554–4568. doi: 10.1103/PhysRevA.56.4554. [DOI] [Google Scholar]
- 13.Deutsch M, Hölzer G, Härtwig J, Wolf J, Fritsch M, Förster E. Kα and Kβ x-ray emission spectra of copper. Phys. Rev. A. 1995 Jan;51(1):283–296. doi: 10.1103/PhysRevA.51.283. [DOI] [PubMed] [Google Scholar]
- 14.Taylor BN, Kuyatt CE. Technical report. NIST; 1994. TN1297: Guidelines for evaluating and expressing the uncertainty of NIST measurement results. URL http://physics.nist.gov/cuu/Uncertainty/index.html. [Google Scholar]
- 15.JCGM. Uncertainty of measurement–part 3: Guide to the expression of uncertainty in measurement (JCGM 100:2008, GUM: 1995) Technical report, Joint Committee for Guides in Metrology. 2008 URL http://www.iso.org/sites/JCGM/GUM-introduction.htm.
- 16.JCGM. International vocabulary of metrology, basic and general concepts and associated terms (VIM) Technical report, Joint Committee for Guides in Metrology. 2008 URL http://www.bipm.org/en/publications/guides/vim.html.
- 17.BIPM. The International System of Units (SI) 8. Bureau International des Poids et Mesures, Sèvres; France: 2006. URL http://www.bipm.org/utils/common/pdf/si_brochure_8_en.pdf. [Google Scholar]
- 18.Kinnane Mark N, Hudson Lawrence T, Henins Albert, Mendenhall Marcus H. A simple method for high-precision calibration of long-range errors in an angle encoder using an electronic nulling autocollimator. Metrologia. 2015 Mar;52:244–250. doi: 10.1088/0026-1394/52/2/244. [DOI] [Google Scholar]
- 19.Mendenhall Marcus H, Windover Donald, Henins Albert, Cline James P. An algorithm for the compensation of short-period errors in optical encoders. Metrologia. 2015 Sep;52(5):685–693. doi: 10.1088/0026-1394/52/5/685. [DOI] [Google Scholar]
- 20.Mendenhall Marcus H, Henins Albert, Windover Donald, Cline James P. Characterization of a self-calibrating, high-precision, stacked-stage, vertical dual-axis goniometer. Metrologia. 2016 Apr;53(3):933–944. doi: 10.1088/0026-1394/53/3/933. [DOI] [PMC free article] [PubMed] [Google Scholar]
- 21.Vaughn CD, Strouse Gregory F. The NIST Industrial Thermometer Calibration Laboratory. 8th Int’l Symp. Temperature and Thermal Measurements in Industry and Science, Berlin. 2001 Jun; URL http://ws680.nist.gov/publication/get_pdf.cfm?pub_id=830734.
- 22.NIST. estar: stopping-power and range tables for electrons. 2015 URL http://physics.nist.gov/PhysRefData/Star/Text/ESTAR.html.
- 23.NIST. XCOM: Photon cross sections database. 2015 URL http://www.nist.gov/pml/data/xcom/index.cfm.
- 24.Mohr Peter J, Taylor Barry N, Newell David B. CODATA recommended values of the fundamental physical constants 2010*. Rev. Mod. Phys. 2012 Nov;84(4):1527–1605. doi: 10.1103/RevModPhys.84.1527. [DOI] [PMC free article] [PubMed] [Google Scholar]
- 25.Kessler EG, Szabo CI, Cline JP, Henins A, Hudson LT, Mendenhall MH, Vaudin MD. The lattice spacing variability of intrinsic float-zone silicon. J. Res. NIST. 2017 Apr;122 doi: 10.6028/jres.122.024. [DOI] [PMC free article] [PubMed] [Google Scholar]
- 26.Bartl Guido, Nicolaus Arnold, Kessler Ernest, Schödel René, Becker Peter. The coefficient of thermal expansion of highly enriched 28 Si. Metrologia. 2009;46(5):416–422. doi: 10.1088/0026-1394/46/5/005. [DOI] [Google Scholar]
- 27.McSkimin HJ. Measurement of elastic constants at low temperatures by means of ultrasonic waves – data for silicon and germanium single crystals, and for fused silica. J. Appl. Phys. 1953;24(8):988–997. doi: 10.1063/1.1721449. [DOI] [Google Scholar]
- 28.Dectris. Pilatus 100k-s technical specifications v1.8. 2014 URL https://www.dectris.com/technical_pilatus.html?file=tl_files/root/support/technical_notes/pilatus/Technical_Specification_PILATUS_100K-S_V1_8.pdf.
- 29.NIST. Tables of x-ray mass attenuation coefficients…. 2015 URL http://www.nist.gov/pml/data/xraycoef/index.cfm.
- 30.Knudsen Erik Bergbäck, Prodi Andrea, Baltser Jana, Thomsen Maria, KjærWillendrup Peter, Sanchez del Rio Manuel, Ferrero Claudio, Farhi Emmanuel, Haldrup Kristoffer, Vickery Anette, Feidenhans’l Robert, Mortensen Kell, Nielsen Martin Meedom, Poulsen Henning Friis, Schmidt Søren, Lefmann Kim. McXtrace: a Monte Carlo software package for simulating x-ray optics, beamlines and experiments. J. Appl. Cryst. 2013;46(3):679–696. doi: 10.1107/S0021889813007991. [DOI] [Google Scholar]
- 31.del Río Manuel Sánchez, Dejus Roger J. XOP v2.4: recent developments of the x-ray optics software toolkit. Proc. SPIE, Advances in Computational Methods for X-Ray Optics II. 2011 Sep;8141 doi: 10.1117/12.893911. 814115–1–5. [DOI] [Google Scholar]
- 32.Authier André. IUCr / Oxford Science. 2001. Dynamical Theory of X-Ray Diffraction. [Google Scholar]
- 33.X-ray data booklet. Technical report, Lawrence Berkeley National Laboratory. 2009 URL http://xdb.lbl.gov.
- 34.Chantler CT. Theoretical form factor, attenuation, and scattering tabulation for Z=1–92 from E=1–10 eV to E=0.4–1.0 MeV. Journal of Physical and Chemical Reference Data. 1995;24(1):71–643. doi: 10.1063/1.555974. [DOI] [Google Scholar]
- 35.Chantler CT. Detailed tabulation of atomic form factors, photoelectric absorption and scattering cross section, and mass attenuation coefficients in the vicinity of absorption edges in the soft x-ray (Z=30–36, Z=60–89, E=0.1 keV–10 keV), addressing convergence issues of earlier work. Journal of Physical and Chemical Reference Data. 2000;29(4):597–1056. doi: 10.1063/1.1321055. [DOI] [PubMed] [Google Scholar]
- 36.Standard Reference Database 66. NIST, U.S. Department of Commerce; Gaithersburg, MD, USA: 2016. Detailed tabulation of atomic form factors, photoelectric absorption and scattering cross section, and mass attenuation coefficients for Z = 1–92 from E = 1–10 eV to E = 0.4–1.0 MeV. URL http://physics.nist.gov/ffast. [Google Scholar]
- 37.Henke BL, Gullikson EM, Davis JC. X-ray interactions: Photoabsorption, scattering, transmission, and reflection at E=50–30,000 eV, Z=1–92. Atomic Data and Nuclear Data Tables. 1993;54(2):181–342. doi: 10.1006/adnd.1993.1013. [DOI] [Google Scholar]
- 38.X-ray interactions with matter. Online data, Lawrence Berkeley National Laboratory. 2016 URL http://henke.lbl.gov/optical_constants.
- 39.Härtwig J, Hölzer G, Förster E, Goetz K, Wokulska K, Wolf J. Remeasurement of characteristic X-ray emission lines and their application to line profile analysis and lattice parameter determination. phys. stat. sol. (a) 1994 May;143(1):23–34. doi: 10.1002/pssa.2211430104. [DOI] [Google Scholar]
- 40.Deutsch M, Förster E, Hölzer G, Härtwig J, Hämäläinen K, Kao C-C, Huotari S, Diamant R. X-ray spectrometry of copper: New results on an old subject. J. Res. NIST. 2004;109(1):75–98. doi: 10.6028/jres.109.006. [DOI] [PMC free article] [PubMed] [Google Scholar]
- 41.Chantler CT, Hayward ACL, Grant IP. Theoretical determination of characteristic x-ray lines and the copper Kα spectrum. Phys. Rev. Lett. 2009 Sep;103(12):123002. doi: 10.1103/PhysRevLett.103.123002. [DOI] [PubMed] [Google Scholar]
- 42.Illig AJ, Chantler CT, Payne AT. Voigt profile characterization of copper Kα. J. Phys. B. 2013;46(23):235001. doi: 10.1088/0953-4075/46/23/235001. [DOI] [Google Scholar]
Associated Data
This section collects any data citations, data availability statements, or supplementary materials included in this article.


