

Abstract
Brain energy metabolism is held to reflect energy demanding processes in neuropil related to the density and activity of synapses. There is recent evidence that men have higher density of synapses in temporal cortex than women. One consequence of these differences would be different rates of cortical energy turnover and blood flow in men and women. To test the hypotheses that rates of oxygen consumption (CMRO2) and cerebral blood flow are higher in men than in women in regions of cerebral cortex, and that the differences persist with aging, we used positron emission tomography to determine cerebral blood flow and cerebral metabolic rate of oxygen as functions of age in healthy volunteers of both sexes. Cerebral metabolic rate of oxygen did not change with age for either sex and there were no differences of mean values of cerebral metabolic rate of oxygen between men and women in cerebral cortex. Women had significant decreases of cerebral blood flow as function of age in frontal and parietal lobes. Young women had significantly higher cerebral blood flow than men in frontal and temporal lobes, but these differences had disappeared at age 65. The absent sex difference of cerebral energy turnover suggests that the known differences of synaptic density between the sexes are counteracted by opposite differences of individual synaptic activity.
Keywords: Aging, cerebral blood flow measurement, energy metabolism, gender, positron emission tomography
Introduction
The neuropil is responsible for a large part of the brain’s oxygen consumption, with 62% of neuronal mitochondria found in dendrites.1 Neuronal signaling has been estimated to account for ∼75% of cortical energy consumption, while the remaining 25% is used for housekeeping. Of the 75%, 44% is used on synaptic transmission and 16% on action potentials, i.e., energy usage directly related to neuronal firing.2 A recent study3 showed that men have higher synaptic density in temporal cortex than women. Because total energy turnover depends on the density of synapses as well as on the strength of individual synapses, as expressed by the large fraction of the energy budget accounted for by synaptic activity, including postsynaptic depolarization,2 we expect the higher density of synapses in men to be associated with a higher rate of oxygen metabolism, when men are compared to women.
Measures of cerebral blood flow (CBF) and cerebral metabolic rate of oxygen (CMRO2) have been recorded for more than half a century, yet the effects of age and sex on these variables are not fully elucidated. Leenders et al.4 showed lower CBF and CMRO2 in older subjects compared to younger, but did not study the effect of sex. The effects of gender on CBF were studied extensively by both positron emission tomography (PET) and single-photon emission computed tomography (SPECT),5–12 showing that CBF is lower in men than in women. However, among CMRO2 studies, only one tested for a difference between men and women, but no difference was revealed.9
In an early study, Raichle et al.13 concluded that CBF and CMRO2 are tightly coupled. A recent study by Ibaraki et al.9 showed that CBF is significantly higher in women than in men, as shown previously with PET and SPECT, while CMRO2 is the same in the two sexes, suggesting different resting state oxygen extraction fractions (OEF) in men and women. Thus, the measures of synaptic density ex vivo, and of CBF and metabolism in vivo, do not agree. One hypothetical explanation of this discrepancy could be lower synaptic strength in men than in women, with consequences for neurovascular regulation.
The measures of CBF have great variability in healthy subjects (for review, see Aanerud et al.14). Previous studies addressed the variability of CBF in relation to the arterial CO2 concentration and revealed that both hypo- and hypercapnia influence CBF significantly.15–17 A more recent study9 found the CBF measure to be inversely correlated with the hemoglobin concentration, whereas the CMRO2 measure was unrelated to the levels of the hemoglobin concentration. However, in all four studies, CBF measures were highly variable, also after correction for the CO2 tension and hemoglobin concentration differences. The origin of the remaining variability is not known, although differences of neuronal uncoupling18 and functional activity of brain tissue17 are possible explanations.
In the present study, we tested the hypotheses (1) that men have higher rates of cortical oxygen consumption than women, and (2) that this difference persists with aging.
Materials and methods
Subjects
Fifty-eight healthy subjects (38 men) between 21 and 65 years were included from previous studies conducted at the PET-center at Aarhus University Hospitals from 1999 to 2005.14 Each subject underwent an interview, and a physical and neurological examination to exclude neurological and psychiatric disease, and use of medication that could influence blood flow or metabolism. Further information on these subjects has been published earlier.19–23 We obtained written informed consent from all subjects to the protocols approved by the official Science Ethics Committee of Region Mid-Jutland, in accordance with the declaration of Helsinki.
Magnetic resonance imaging
The majority of the subjects had T1-weighted scans obtained on a 3.0 T Signa Excite GE Magnet using a 3DIR-fSPGR sequence (256 × 256, TE1 = min full, TI = 450, slice thickness = 1.5 mm). A few subjects were scanned with GE MR 1.5-T Echo Speed tomograph (3D-SPGR, 256 × 256, 1 Splap, NEX: 1, slice thickness 1.5).
PET
Fifty-eight subjects each had one dynamic [15O]H2O emission recording and one or two [15O]O2 emission recordings, except one subject who did not have a [15O]H2O recording and another subject who did not have a [15O]O2 recording. All records were obtained with the subjects resting in a supine position in a quiet room with eyes open, except in one study where subjects had their eyes closed. Recordings were acquired in 3D mode with an ECAT EXACT HR 47 (CTI/Siemens) whole-body tomograph. Isometric resolution was 4.6 mm. To minimize any possible group effects, all PET images were collected as raw images and then reconstructed as 128 × 128 matrices of 2 × 2 mm voxels using filtered back-projections with a 0.5 cycle−1 Hann filter. The reconstructed images were corrected for random and scatter events, detector efficiency variations, and dead time. Tissue attenuation scans were performed using a rotating 68Ge source. Catheters were inserted in the left radial artery and right cubital vein. The arterial blood radioactivity was measured by an automated blood sampling system (Allogg AB, Mariefred, Sweden), cross-calibrated with the tomograph, and then corrected for external delay and dispersion. Dynamic emission recordings lasting 3 min (21 frames) were initiated upon bolus intravenous injection of [15O]H2O (500 MBq) or inhalation of [15O]O2 (500 or 1000 MBq).
Image processing
The dynamic PET scans were blurred to a full-width half-maximum (FWHM) of 6 mm. Parametric maps of the unidirectional clearances (K1) of the two tracers were calculated with the linearized two-compartment model,24 as extended by Ohta et al.,25,26 in which we obtained measures of CMRO2 by multiplication with the arterial oxygen concentration. We used Lawson and Hanson27 non-negative least squares to solve general least squares functions. Individual MR images were coregistered, by a combination of linear and non-linear coregistration,28,29 to a template consisting of 85 brains from young healthy people in ICBM152 space.30 Summed PET images were coregistered to individual MR images, and the concatenated transformation files were applied to the dynamic PET images. The automated coregistration algorithm extracted a binary mask of cortical gray matter (GM) from each individual's MR image. These binary masks were then multiplied with generic masks for each volume of interest (VOI), yielding individualized masks for all VOIs. The GM masks were manipulated to be of approximately the same thickness as the PET signal from cortical GM.
Data analysis
The individualized masks were used to extract mean GM values from parametric PET images. Where subjects had two CMRO2 images, we used the mean. First, a mixed-model multi-linear regression was performed on logarithmically transformed data to account for differences in mean CBF and CMRO2 among the groups of subjects from separate studies.19–23 Calculations were performed in STATA IC 10 for Mac (TX, USA). Individual PET images were then corrected for group differences, and linear regressions with the interaction between age and sex as dependent variables, were performed in all VOIs. As mentioned above, hemoglobin concentration and PaCO2 have been found to positively correlate with CBF.9,15,16 Therefore, PaCO2 and hemoglobin concentration were added as covariates in the regression of CBF over age.
Differences in blood flow and metabolism between men and women were calculated by means of the regression, where y-intercepts were set at either age 20 or age 65. The difference between men and women was then given as the difference between intercepts for each sex's regression line (Figure 3). Interaction between sex and age was investigated by comparing regression coefficients for men and women.
Figure 3.

Plots of cortical gray CBF (mL/100 g/min) and CMRO2 (µmol/100 g/min) in men (black circles) and women (red circles), adjusted for the effects of studies and age, and in the case of CBF also adjusted for PCO2 and hemoglobin concentration. Black lines are regression line for men and red lines for women. For more details, see Table 1.
Mean images were calculated from individual parametric images, corrected for variations between studies, pCO2, and hemoglobin concentration. The “young” group of subjects was composed of all subjects 49 years of age or younger, and the “old” group of subjects as all subjects 50 years of age or older.
A percentage difference image for the “young” age group was calculated voxel-wise by the formula 100 (CBFwomen–CBFmen)/CBFmen. Voxel-wise Student's t-test for differences between men and women in the “young” age groups was calculated using Statistical Parametric Mapping (SPM 8) (London, UK) in MATLAB (R2008b) (Natick, MA) after smoothing individual images with a Gaussian filter FWHM 8 mm isometric (threshold p < 0.01, uncorrected, extent 20 voxels).
Results
Figures 1 and 2 show the mean CBF and CMRO2 images, respectively. The CBF maps (Figure 1) display the highest values in the thalamus and occipital cortex and generally higher CBF in cortex than in white matter. CMRO2 maps also display higher values in cortical and subcortical GM than in white matter, with occipital cortex having considerably higher metabolism than the remaining parts of the GM.
Figure 1.
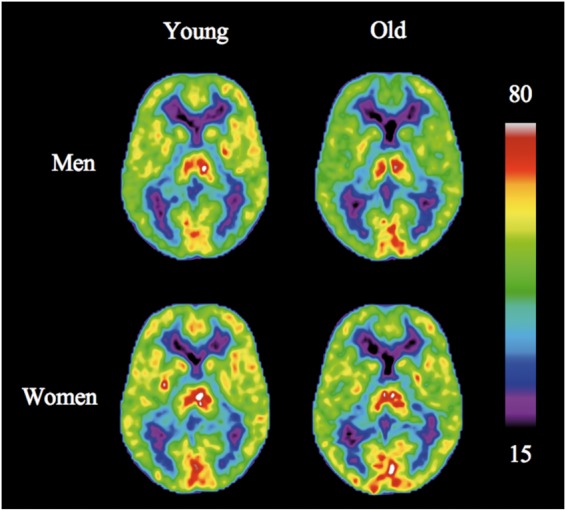
Average images of CBF (mL/100 g/min) for males (top) and females. Before calculating average images, the individual scans were adjusted for study and age effects, and pCO2 and hemoglobin concentration values.
Figure 2.
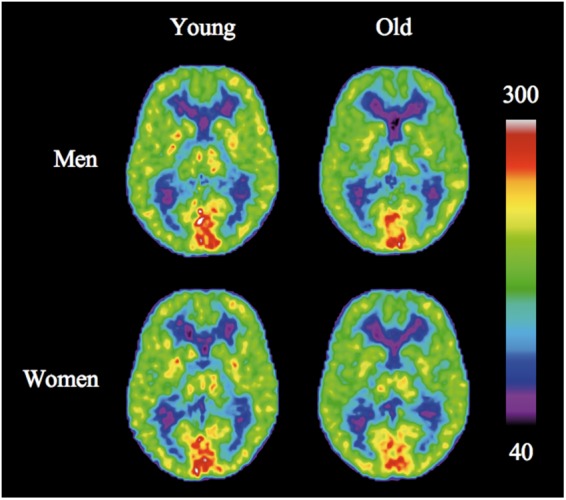
Average images of CMRO2 (µmol/100 g/min) for males (top) and females. Before calculating average images, the individual images were adjusted for study and age effects.
Gender effect
Numerically, CBF was higher in women than in men (Figures 1, 3, and 4, and Tables 1 and 2), and the effect was significant at age 20 in parietal and temporal lobes, while in cortical GM, the difference was close to significance with p = 0.06. In older subjects, CBF did not differ between the sexes. As shown in Table 2, the CMRO2 measures revealed no difference between the sexes in young or old subjects (all p values >0.3). The regression coefficients for CBF and CMRO2 over age were tested for differences between men and women, and none were significant (all p values >0.2).
Figure 4.

Top row shows areas where women under 50 years have higher CBF than men in the same age group in percentage (not tested for significant differences). Color bar refers to percentage differences. Bottom row illustrates areas where women had significantly higher CBF than men. CBF differences and statistically significant clusters are superimposed on an average MRI brain template in MNI space.
Table 1.
Mean values for CBF (mL/100 g/min) and CMRO2 (µmol/100 g/min) are given for each VOI at 20 and 65 years (SD).
| CBF |
||||||||
|---|---|---|---|---|---|---|---|---|
| Men |
Women |
|||||||
| % | p | age 20 | age 65 | % | P | age 20 | age 65 | |
| Cortical gray | −1.0 | 0.374 | 48 (1.7) | 46 (1.5) | −3.8 | 0.063 | 56 (3.4) | 47 (2.3) |
| Frontal | −2.0 | 0.098 | 51 (1.8) | 47 (1.5) | −4.7 | 0.023 | 58 (3.6) | 47 (2.3) |
| Parietal | −1.1 | 0.394 | 49 (1.9) | 47 (1.6) | −4.4 | 0.049 | 58 (3.9) | 48 (2.5) |
| Occipital | 1.0 | 0.425 | 49 (1.9) | 51 (1.8) | −1.1 | 0.630 | 57 (3.8) | 54 (2.9) |
| Temporal | −0.8 | 0.468 | 45 (1.6) | 43 (1.4) | −3.9 | 0.056 | 53 (3.2) | 45 (2.2) |
| CMRO2 | ||||||||
| Cortical gray | −0.6 | 0.662 | 176 (5.8) | 171 (6.5) | −2.5 | 0.177 | 183 (9.7) | 164 (7.5) |
| Frontal | −1.1 | 0.402 | 176 (5.9) | 168 (6.5) | −2.9 | 0.121 | 185 (9.9) | 162 (7.5) |
| Parietal | −1.0 | 0.446 | 182 (5.9) | 174 (6.5) | −2.5 | 0.167 | 192 (10) | 171 (7.7) |
| Occipital | 0.4 | 0.779 | 199 (7.1) | 203 (8.3) | −1.4 | 0.480 | 208 (12) | 195 (9.6) |
| Temporal | −0.3 | 0.786 | 170 (5.2) | 167 (5.9) | −2.6 | 0.136 | 178 (8.8) | 158 (6.7) |
Note: Percentages and p-values refer to changes in CBF or CMRO2 pr. decade.
Table 2.
Differences between women and men in percentage, f > m means females higher than males.
| CBF |
CMRO2 |
|||||||
|---|---|---|---|---|---|---|---|---|
| Age 20 |
Age 65 |
Age 20 |
Age 65 |
|||||
| f > m (%) | p | f > m (%) | p | f > m (%) | p | f > m (%) | p | |
| Cortical gray | 17 | 0.064 | 2 | 0.697 | 4 | 0.498 | −4 | 0.662 |
| Frontal | 14 | 0.092 | <1 | 0.855 | 5 | 0.498 | −4 | 0.521 |
| Parietal | 18 | 0.050 | 2 | 0.739 | 5 | 0.393 | −2 | 0.774 |
| Occipital | 16 | 0.090 | 6 | 0.409 | 5 | 0.539 | −4 | 0.543 |
| Temporal | 18 | 0.038 | 5 | 0.639 | 5 | 0.433 | −5 | 0.319 |
Note: Significant p-values in bold face.
Aging effect
As seen in Figures 1 and 2, CBF rates generally declined with age, while oxygen metabolism remained stable. We noted an insignificant trend towards higher CBF and CMRO2 measures in older men than in younger men in the visual cortex (Table 1). For CBF, women had significant declines with age of the frontal and parietal cortices, as well as a trend towards decrease in temporal cortex and cortical GM in general (Table 1). Men had no significant decline. For CMRO2, no significant changes were observed in either sex.
The percentage difference image (Figure 4) shows areas where women under the age of 50 had higher CBF estimates than men of the same age group. The images show higher CBF estimates in large parts of cortex, white matter, and subcortical structures, with the majority of significant areas residing in white matter. Testing for voxels in which CBF estimates of men exceeded those of women in the same age group did not yield any significant sites.
Discussion
To our knowledge, this is the first study of the differences of brain oxygen consumption between men and women during aging. Contrary to the first hypothesis, oxygen consumption neither differed between men and women, nor changed with age. Pakkenberg and Gundersen30 showed that neocortical thickness is constant in healthy aging from 18 to 93 years of age. They also found a significant difference of neocortical thickness between the sexes, with men having a 4.1% thicker cortex. In terms of the partial volume effect, these differences would have no significant impact on the present measures, as neocortex averages 2.72 mm in men and 2.61 mm in women, compared to the PET resolution of 5 mm. However, as Alonso-Nanclares et al.3 found that synaptic density is higher in men than in women, we expected oxygen metabolism to be higher in men than in women. A possible, albeit speculative, conclusion from the lack of difference between the CMRO2 measures of the two sexes can be a lower rate of synaptic transmission per spine or neuron in men than in women, in keeping with the higher total number of neurons in cerebral cortex of men compared to women.30
The relations between sex and CBF were studied extensively in the past, and most authors report higher CBF in women than in men,4–12 with a single report of CBF measures that did not differ between the sexes.31 The present results indicate that women do have higher blood flow rates than men, but only in young subjects, in whom the difference is significant in temporal and parietal cortices. Interestingly, with advancing age, women's CBF measures approach those of men: At age 65, none of the differences remains, as also noted in some earlier studies.8,32–34 Since the subjects included in this study were participants in earlier studies, our statistical analysis accounted for any systematic differences between groups through means of a mixed-model multi-variate regression.
It is well known that men have higher arterial hemoglobin concentrations than women, and this was also the case in the present study, both in the younger (<50 years) and older (≥50 years) age groups. Since measures of oxygen consumption had the same magnitudes in men and women, a reasonable explanation would be that neurovascular regulatory mechanisms raised CBF in women to maintain a normal oxygen supply. In the group of young subjects, the mean hemoglobin concentration difference was 1.3 mM (p < 0.0001, two-sided t-test). In the group of old subjects, the difference was 0.8 mM (p = 0.004, two-sided t-test). We found the CBF of women to decline with aging to the same level as in men, at variance with the hypothesis that higher CBF in women is a compensation for lower oxygen carrying capacity.
It is speculated that the higher CBF in women could be due to higher levels of estrogens.35 Chang et al.36 used aortic smooth muscle in rats to show that estradiol increased activity of prostaglandin cyclooxygenase and prostaglandin synthetase, thereby increasing prostacyclin bioreactivity. Prostacyclin has a permissive role in the vasodilatory effect of carbon dioxide37 and Masotti et al.38 measured prostacyclin levels and found higher levels in young women compared to young men. In old age, there was no difference between men and women. Kastrup et al.35 tested flow in middle cerebral arteries in men and women during varying levels of CO2 and found that women have a greater response to increased CO2 than men. When the authors blocked the production of prostacyclin (and other cyclooxygenases) with indomethacin, the CO2 reactivity became the same in the two sexes. This indicates that women of reproductive age with higher estrogen and prostacyclin levels than men, and therefore higher vascular CO2 reactivity, would have higher CBF per unit CO2. When women reach menopause, both estrogen and prostacyclin levels approach those of men, as does their CO2 reactivity. This interpretation fits the present findings when we remove the PCO2 from the CBF analysis and still find that young women have higher CBF than young men, while there was no difference between sexes in the older age group. Thus, even when young men and women have the same PCO2, the vasodilatory effect of any given CO2 level would be greater in women.
There was a tendency towards decreased CBF for men, but this did not reach significance. The large variability of CBF in healthy people39 may have contributed to the absent statistical evidence of CBF decrease in men. PET studies of aging have a potential bias in the degree of atrophy that in principle can account for the decrease in signal with increasing age,4,40 and the results did reveal decreased CBF in women during aging. The decline with age of CBF in women, in theory can be biased by atrophy, but the lack of change of CMRO2 with age makes this explanation less likely.
Conclusion
We tested whether measures of CBF and CMRO2 are different in men and women, and whether aging affects CBF and CMRO2 differently in men and women. The measures of CMRO2 were the same in the two sexes and remained stable during aging. The observation that there is no difference of CMRO2 between the sexes implies that men may have lower relative synaptic activity in cerebral cortex, in light of recent evidence that men have higher synaptic density than women. Young women have significantly higher blood flows in the temporal and parietal lobes and nearly significantly higher in cortical GM as a whole, when compared to men. At age 65, no differences remained. Women's CBF measures also decreased significantly with aging (frontal and parietal lobes), while men's CBF measures did not change with age. Our findings support an earlier hypothesis35 that women of reproductive age have a higher capacity for vasodilatory response to CO2, possibly due to estrogens with increased prostacyclin production.
Funding
The author(s) disclosed receipt of the following financial support for the research, authorship, and/or publication of this article: This work was supported by the Danish National Research Foundation, University of Aarhus and the Danish Council for Independent Research, Medical Sciences.
Declaration of conflicting interests
The author(s) declared no potential conflicts of interest with respect to the research, authorship, and/or publication of this article.
Authors’ contributions
Joel Aanerud: Data analysis, designing images, drafting, and revising of manuscript. Per Borghammer: Interpretation of data, drafting, and revising manuscript. Anders Rodell: Data analysis, drafting, and revising manuscript. Kristjana Y Jónsdottir: Statistical analysis, drafting, and revising manuscript. Albert Gjedde: Original idea, interpretation of data, drafting, and revising manuscript.
References
- 1.Wong-Riley MTT. Cytochrome oxidase: an endogenous metabolic marker for neuronal activity. Trends Neurosci 1989; 12: 34–101. [DOI] [PubMed] [Google Scholar]
- 2.Howarth C, Gleeson P, Attwell D. Updated energy budgets for neural computation in the neocortex and cerebellum. J Cereb Blood Flow Metab 2012; 32: 1222–1232. [DOI] [PMC free article] [PubMed] [Google Scholar]
- 3.Alonso-Nanclares L, Gonzalez-Soriano J, Rodriguez JR, et al. Gender differences in human cortical synaptic density. Proc Natl Acad Sci USA 2008; 105: 1461–1469. [DOI] [PMC free article] [PubMed] [Google Scholar]
- 4.Leenders KL, Perani D, Lammertsma AA, et al. Cerebral blood flow, blood volume and oxygen utilization. Brain 1990; 113: 27–47. [DOI] [PubMed] [Google Scholar]
- 5.Bertsch K, Hagemann D, Hermes M, et al. Resting cerebral blood flow, attention, and aging. Brain Res 2009; 1267: 77–88. [DOI] [PubMed] [Google Scholar]
- 6.Daniel DG, Mathew RJ, Wilson WH. Sex roles and regional cerebral blood flow. Psychiatry Res 1989; 27: 55–64. [DOI] [PubMed] [Google Scholar]
- 7.Esposito G, Van Horn JD, Weinberger DR, et al. Gender differences in cerebral blood flow as a function of cognitive state with PET. J Nucl Med 1996; 37: 559–564. [PubMed] [Google Scholar]
- 8.Gur RC, Gur RE, Obrist WD, et al. Age and regional cerebral blood flow at rest and during cognitive activity. Arch Gen Psychiatry 1987; 44: 617–621. [DOI] [PubMed] [Google Scholar]
- 9.Ibaraki M, Shinohara Y, Nakamura K, et al. Interindividual variations of cerebral blood flow, oxygen delivery, and metabolism in relation to hemoglobin concentration measured by positron emission tomography in humans. J Cereb Blood Flow Metab 2010; 30: 1296–1305. [DOI] [PMC free article] [PubMed] [Google Scholar]
- 10.Parkes LM, Rashid W, Chard DT, et al. Normal cerebral perfusion measurements using arterial spin labeling: reproducibility, stability, and age and gender effects. Magn Reson Med 2004; 51: 736–743. [DOI] [PubMed] [Google Scholar]
- 11.Podreka I, Baumgartner C, Suess E, et al. Quantification of regional cerebral blood flow with IMP-SPECT. Reproducibility and clinical relevance of flow values. Stroke 1989; 20: 183–191. [DOI] [PubMed] [Google Scholar]
- 12.Rodriguez G, Warkentin S, Risberg J, et al. Sex differences in regional cerebral blood flow. J Cereb Blood Flow Metab 1988; 8: 783–789. [DOI] [PubMed] [Google Scholar]
- 13.Raichle ME, Grubb RL, Jr., Gado MH, et al. Correlation between regional cerebral blood flow and oxidative metabolism. In vivo studies in man. Arch Neurol 1976; 33: 523–526. [DOI] [PubMed] [Google Scholar]
- 14.Aanerud J, Borghammer P, Chakravarty MM, et al. Brain energy metabolism and blood flow differences in healthy aging. J Cereb Blood Flow Metab 2012; 32: 1177–1187. [DOI] [PMC free article] [PubMed] [Google Scholar]
- 15.Ito H, Yokoyama I, Iida H, et al. Regional differences in cerebral vascular response to PaCO2 changes in humans measured by positron emission tomography. J Cereb Blood Flow Metab 2000; 20: 1264–1270. [DOI] [PubMed] [Google Scholar]
- 16.Ramsay SC, Murphy K, Shea SA, et al. Changes in global cerebral blood flow in humans: effect on regional cerebral blood flow during a neural activation task. J Physiol 1993; 471: 521–534. [DOI] [PMC free article] [PubMed] [Google Scholar]
- 17.Rodell AB, Aanerud J, Braendgaard H, et al. Low residual CBF variability in Alzheimer's disease after correction for CO2 effect. Front Neuroenerget 2012; 4: 8. [DOI] [PMC free article] [PubMed] [Google Scholar]
- 18.Gjedde A, Aanerud J, Peterson E, et al. Variable ATP yields and uncoupling of oxygen consumption in human brain. Adv Exp Med Biol 2011; 701: 243–248. [DOI] [PubMed] [Google Scholar]
- 19.Ashkanian M, Gjedde A, Mouridsen K, et al. Carbogen inhalation increases oxygen transport to hypoperfused brain tissue in patients with occlusive carotid artery disease: increased oxygen transport to hypoperfused brain. Brain Res 2009; 1304: 90–95. [DOI] [PubMed] [Google Scholar]
- 20.Borghammer P, Jonsdottir YK, Cumming P, et al. Normalization in PET group comparison studies – the importance of a valid reference region. Neuroimage 2008; 40: 529–540. [DOI] [PubMed] [Google Scholar]
- 21.Gjedde A, Johannsen P, Cold GE, et al. Cerebral metabolic response to low blood flow: possible role of cytochrome oxidase inhibition. J Cereb Blood Flow Metab 2005; 25: 1183–1196. [DOI] [PubMed] [Google Scholar]
- 22.Iversen P, Sørensen M, Bak LK, et al. Low cerebral oxygen consumption and blood flow in patients with cirrhosis and an acute episode of hepatic encephalopathy. Gastroenterology 2009; 136: 863–871. [DOI] [PubMed] [Google Scholar]
- 23.Møller A, Roepstorff A, Cumming P, et al. Cerebrometabolic Effects of Non-Ionizing Radiation from Cell Phones. Lausanne: International Conference On Brain Energy Metabolism, poster session, 2006.
- 24.Blomqvist G. On the construction of functional maps in positron emission tomography. J Cereb Blood Flow Metab 1984; 4: 629–632. [DOI] [PubMed] [Google Scholar]
- 25.Ohta S, Meyer E, Fujita H, et al. Cerebral [15O]water clearance in humans determined by PET: I. Theory and normal values. J Cereb Blood Flow Metab 1996; 16: 765–780. [DOI] [PubMed] [Google Scholar]
- 26.Ohta S, Meyer E, Thompson CJ, et al. Oxygen consumption of the living human brain measured after a single inhalation of positron emitting oxygen. J Cereb Blood Flow Metab 1992; 12: 179–192. [DOI] [PubMed] [Google Scholar]
- 27.Lawson G, Hanson RJ. Solving least squares problems, New Jersey, NY: Prentice Hall Inc., 1974. [Google Scholar]
- 28.Grabner G, Janke AL, Budge MM, et al. Symmetric atlasing and model based segmentation: an application to the hippocampus in older adults. Med Image Comput Comput Assist Interv 2006; 9(Pt 2): 58–66. [DOI] [PubMed] [Google Scholar]
- 29.The MNI brain and the Talairach atlas, http://imaging.mrc-cbu.cam.ac.uk/imaging/MniTalairach (accessed 26 August 2016).
- 30.Pakkenberg B, Gundersen HJ. Neocortical neuron number in humans: effect of sex and age. J Comp Neurol 1997; 384: 312–320. [PubMed] [Google Scholar]
- 31.Melamed E, Lavy S, Bentin S, et al. Reduction in regional cerebral blood flow during normal aging in man. Stroke 1980; 11: 31–35. [DOI] [PubMed] [Google Scholar]
- 32.Devous MD, Sr., Stokely EM, Chehabi HH, et al. Normal distribution of regional cerebral blood flow measured by dynamic single-photon emission tomography. J Cereb Blood Flow Metab 1986; 6: 95–104. [DOI] [PubMed] [Google Scholar]
- 33.Davis SM, Ackerman RH, Correia JA, et al. Cerebral blood flow and cerebrovascular CO2 reactivity in stroke-age normal controls. Neurology 1983; 33: 391–399. [DOI] [PubMed] [Google Scholar]
- 34.Shaw TG, Mortel KF, Meyer JS, et al. Cerebral blood flow changes in benign aging and cerebrovascular disease. Neurology 1984; 34: 855–862. [DOI] [PubMed] [Google Scholar]
- 35.Kastrup A, Happe V, Hartmann C, et al. Gender-related effects of indomethacin on cerebrovascular CO2 reactivity. J Neurol Sci 1999; 162: 127–132. [DOI] [PubMed] [Google Scholar]
- 36.Chang WC, Nakao J, Orimo H, et al. Stimulation of prostaglandin cyclooxygenase and prostacyclin synthetase activities by estradiol in rat aortic smooth muscle cells. Biochim Biophys Acta 1980; 620: 472–482. [PubMed] [Google Scholar]
- 37.Leffler CW, Mirro R, Pharris LJ, et al. Permissive role of prostacyclin in cerebral vasodilation to hypercapnia in newborn pigs. Am J Physiol 1994; 267(1 Pt 2): H285–H2291. [DOI] [PubMed] [Google Scholar]
- 38.Masotti G, Pogessi L, Galanti G, et al. Prostacyclin production in man. In: Lewis PJ, ÓGrady J. (eds). Clinical pharmacology of prostacyclin, New York: Raven, 1981, pp. 9–19. [Google Scholar]
- 39.Yen YF, Field AS, Martin EM, et al. Test-retest reproducibility of quantitative CBF measurements using FAIR perfusion MRI and acetazolamide challenge. Magn Reson Med 2002; 47: 921–928. [DOI] [PubMed] [Google Scholar]
- 40.Meltzer CC, Cantwell MN, Greer PJ, et al. Does cerebral blood flow decline in healthy aging? A PET study with partial-volume correction. J Nucl Med 2000; 41: 1842–1848. [PubMed] [Google Scholar]