

Abstract
Ketones (principally β-hydroxybutyrate and acetoacetate (AcAc)) are an important alternative fuel to glucose for the human brain, but their utilisation by the brain remains poorly understood. Our objective was to use positron emission tomography (PET) to assess the impact of diet-induced moderate ketosis on cerebral metabolic rate of acetoacetate (CMRa) and glucose (CMRglc) in healthy adults. Ten participants (35 ± 15 y) received a very high fat ketogenic diet (KD) (4.5:1; lipid:protein plus carbohydrates) for four days. CMRa and CMRglc were quantified by PET before and after the KD with the tracers, 11C-AcAc and 18F-fluorodeoxyglucose (18F-FDG), respectively. During the KD, plasma ketones increased 8-fold (p = 0.005) while plasma glucose decreased by 24% (p = 0.005). CMRa increased 6-fold (p = 0.005), whereas CMRglc decreased by 20% (p = 0.014) on the KD. Plasma ketones were positively correlated with CMRa (r = 0.93; p < 0.0001). After four days on the KD, CMRa represented 17% of whole brain energy requirements in healthy adults with a 2-fold difference across brain regions (12–24%). The CMR of ketones (AcAc and β-hydroxybutyrate combined) while on the KD was estimated to represent about 33% of brain energy requirements or approximately double the CMRa. Whether increased ketone availability raises CMR of ketones to the same extent in older people as observed here or in conditions in which chronic brain glucose hypometabolism is present remains to be determined.
Keywords: Metabolism, ketone, glucose, ketogenic diet, neuroimaging, acetoacetate
Introduction
A very high fat ketogenic diet (KD) can be used to induce moderate ketosis over a sustained period. Severe dietary carbohydrate reduction with somewhat lower protein intake reduces post-prandial insulin response which in turn allows ketosis to develop to levels equivalent of those seen during fasts of 2–5 days.1,2 The therapeutic utility of the KD in diseases such as intractable infantile epilepsy3 and glucose transporter deficiency4 is well documented, but its effects on regional brain energy metabolism remain unclear. Positron-emitting tomography (PET) is widely used to assess regional brain glucose metabolism using the radiotracer, 18F-fluorodeoxyglucose (18F-FDG).5 We developed 11C-acetoacetate (11C-AcAc) as a PET tracer to measure brain ketone metabolism6 and have applied it in tandem with 18F-FDG to quantify the cerebral metabolic rate (CMR) of both acetoacetate (CMRa) and glucose (CMRglc), respectively, in the same individual on the same day.7,8 In the brain as a whole, CMRglc decreases during normal aging7 and more so in Alzheimer’s disease,8,9 but there is no significant change in global CMRa under these conditions.7,8 One limitation to those studies is that they were conducted after 12 h fasting, during which plasma ketone levels were relatively low (usually <0.5 mM of β-hydroxybutyrate (β-HBA)) and contributed to no more than 3% of brain energy requirements.
Ketogenic interventions have been proposed as part of a treatment not only for intractable epilepsy but also for other neurological diseases, especially Alzheimer’s.10,11 As such, it is important to better understand how CMRglc and CMR of ketones (AcAc and β-HBA combined; CMRket) change in humans during moderate nutritional ketosis. Studies in humans show that ketosis induced by acute or chronic fasting raises CMRket in direct proportion to the rise in plasma ketones over a plasma range of 0.02–12 mM β-HBA.10,12 Arterio-venous difference studies in humans also show that acute intravenous ketone infusion reduces CMRglc in proportion to the rise in plasma ketones.13,14 However, our dual tracer PET technique unexpectedly showed that rats on a KD not only have the expected increase in CMRket but increased CMRglc as well.15,16 This apparent discrepancy in glucose metabolism by the brain during ketosis in humans compared to rats can be studied using 18F-FDG and 11C-AcAc PET.
The aim of the present study was therefore to quantify the short-term effects of a very high fat isocaloric KD on CMRglc and CMRa in healthy adults using PET. Our two specific aims were – (i) to determine whether CMRa (global and regional) was proportional to plasma ketone concentration as previously seen in arterio-venous studies17–19 and (ii) to determine whether CMRglc increased or decreased in relation to increased ketone supply to the brain. CMRa can be expected to start increasing within twelve hours of raising blood ketones,2 so we provided the KD for four days with the dual tracer PET being done before and at the end of this period to quantify the increase in CMRa and the changes in CMRglc.
Methods
Participants
The study was conducted in line with the Helsinki Declaration and approved by the Research Ethics Committee of the Eastern Townships Integrated University Health and Social Services Sherbrooke University Hospital Centre (Sherbrooke, QC, Canada), which oversees all human research done at the Research Center on Aging. Written informed consent was obtained from all participants prior to screening. Participants (n = 10) were between 23 and 64 years old (35 ± 15 y). After medical histories and blood screening, all participants were judged to be in good health and were unmedicated. All participants were non-smokers, non-diabetic (fasting glucose <6.1 mmol/L and glycosylated hemoglobin <6.0%), had normal renal function, serum electrolytes, liver function (normal aspartate aminotransferase and alanine aminotransferase), thyroid-stimulating hormone, HDL and LDL cholesterol, triglycerides and albumin and had no overt nutritional problems.
KD
After a 12 h overnight fast, all participants consumed the KD in liquid form for the next four consecutive days. The KD had the classical lipid to protein + carbohydrate ratio of 4.5:1.20 It was prepared in-house and was composed of 20 parts 35% cream, seven parts 3.5% milk, three parts medium-chain triglycerides oil (Alpha Health Products, Burnaby, BC, Canada) and six parts liquid egg white. Participants were instructed to take one multivitamin and mineral tablet daily, while they were on the KD (Centrum forte, Pfizer Consumer Healthcare, Ontario, Canada). The amount of KD to be consumed by each participant was adjusted according to the Harris-Benedict equation to take into account differences in sex, age, height and weight.21,22 The diet was to be consumed ad libitum during the day and to entirely replace the participant’s normal diet during the four days of the KD. Participants assessed their own glycemia and ketonemia twice a day, 30 min after breakfast and supper (Diabetes Management System, Precision Xtra, Abbott Diabetes Care Inc., Alameda, CA, United States).
Magnetic resonance and PET imaging
Three-dimensional T1-weighted MR images were obtained on a 1.5 Tesla scanner (Sonata, Siemens Medical Solutions, Erlangen, Germany) for each participant before starting the KD. A non-local means denoising filter was applied to the magnetic resonance images.23,24
11C-AcAc and 18F-FDG scans were obtained before and on the fourth day of the KD for each participant. After the breakfast, each participant was fasted for 6–7 h before the PET scans which were scheduled to run between 1:30 and 4:30 pm. In preparation for each PET scan, one arm was warmed to 44℃, and an indwelling venous catheter was installed into a forearm vein for blood sampling.5 A second catheter was placed in the contralateral forearm vein for the injection of the radiotracer, which was infused over 20 s at 6 mL/min using an infusion pump (11C-AcAc, 370 MBq and; 18F-FDG, 185 MBq). During both acquisitions, blood samples obtained from the warmed arm were used to calibrate the arterial input function.25 Radioactivity in the plasma samples obtained during the infusion was counted in a gamma counter (Cobra, Packard, United States) cross-calibrated to the PET scanner in order to determine the plasma time–activity curves. PET scans were acquired on a Philips Gemini time-of-flight PET/CT scanner (Philips Medical System, Eindhoven, the Netherlands) using list mode acquisition, with isotropic voxel size of 2 mm3, field-of-view of 25 cm and axial field of 18 cm. 11C-AcAc data were reconstructed into 21 frames – 12 frames × 10 s, 8 × 30 s and 1 × 240 s, for a total scan length of 10 min. There was rest/wash-out period of three 11C half-lives prior the 18F-FDG infusion. 18F-FDG frames were reconstructed according to 12 × 10 s, 8 × 30 s, 6 × 240 s and 3 × 600 s, for a total scan length of 60 min.
Brain 11C-AcAc and 18F-FDG PET images were analysed as previously described.8 Briefly, CMRa and CMRglc were quantified according to the multiple time graphical analysis method of Patlak et al.26 using the following equation: CMR-K*Cp/LC, where K is the rate constant for net uptake CMR of the tracer, Cp is the arterial plasma concentration of the tracer and LC is the lumped constant. The LCs used to calculate CMRglc and CMRa was set to 0.8 and 1.0, respectively.7,14,27 The LC of 0.8 for CMRglc was based on Graham et al.27 who compared the CMR of 11C-glucose to that of 18F-FDG and established a ratio to correct for the difference in CMR of both tracers. The LC for CMRa was set at 1.0 since the 11C-AcAc tracer was chemically identical to native AcAc, so no correction was needed to calculate CMRa. CMR was expressed as µmol/100 g/min. The regional analysis used tools implemented in PMOD 3.3 (PMOD Technologies Ltd, Zurich, Switzerland). Brain segmentation was defined by Freesurfer parcellation labels (Freesurfer Suite 5.0). Brain parametric maps of CMRglc and CMRa were produced using the PMOD 3.3 pixel-wise kinetic modeling tool (PXMOD) and the 3D surface projection of the MIMvista medical program 6.4 (MIM Software Inc., Cleveland, OH, USA).
Plasma metabolites
Plasma glucose, cholesterol, triglycerides (Siemens Medical Solutions USA, Inc., Deerfield, IL, USA) and free fatty acids (Wako Diagnostics, Richmond, VA, USA) were measured by commercially available kits. Plasma ketone concentrations were measured by automated colorimetric assay as previously described.28–31 Briefly, for AcAc, 25 µL of plasma was mixed with 330 µL of fresh reagent (Tris buffer, pH 7.0, 100 mmol/L; sodium oxamate 20 mmol/L; NADH 0.15 mmol/L; β-hydroxybutyrate dehydrogenase (BHBDH); 1 U/mL). For β-HBA, the reagent was Tris buffer (pH 9.0; sodium oxamate 20 mmol/L; NAD 1 mmol/L; BHBDH 1 U/mL). Tris, oxamate, DL-β-HBA sodium salt, Li-AcAc standard and NAD were purchased from Sigma (St. Louis, MO, USA), NADH, from Roche (Mannheim, Germany), and BHBDH from Toyobo (Osaka, Japan). The change in absorbance at 340 nm between 15 and 120 s after the addition of the reagent was measured on an automated clinical chemistry analyzer (Dimension Xpand Plus; Siemens, Deerfield, IL, USA). The assay was calibrated with freshly diluted standards from frozen aliquots of a 10 mmol/L standard of Li-AcAc or DL-β-HBA sodium salt, which is stable at −20℃ for two and six months, respectively. Calibrations and quality controls were performed for each assay to ensure the precision of the kits (coefficient of variation between tests was 5 ± 1% based on n = 360 measurements). Plasma insulin was analysed by enzyme-linked immunosorbent assay (Alpco Diagnostics Ltd, Salem, NH, USA) with a microplate reader (Victor multilabel plate reader 2030; Perkin Elmer, MA, USA).
Statistical analysis
To establish the necessary sample size for the current study, a power calculation was conducted using change in global CMRa as the primary outcome. Published studies showed that a similar increase in plasma ketones to that expected on the KD would increase global CMRa by 3–8-fold.14,32 With a required power of 80% and a significance level set at 5%, n = 6 participants were needed; we increased this to n = 10 to permit more detailed analysis on a region-by-region basis. All statistical analyses were performed using SPSS 15.0 software (SPSS Inc., Chicago, IL, USA). Pre- to post-KD differences were established using non-parametric statistical test (Wilcoxon rank-sum test) because of the small sample size (n < 30). Pre- to post-KD differences in continuous variables (CMR and the rate constant, K) across 35 brain regions were assessed using repeated measures one-way ANOVA. All comparisons underwent a p ≤ 0.05 false discovery rate (FDR) correction for multiple comparisons.33 Correlations were established by Spearman’s test using Prism 6 (GraphPad, La Jolla, CA, USA).
Results
Moderate ketosis induced on the KD
At baseline, participants had a plasma β-HBA of 0.4 ± 0.4 mM and AcAc of 0.2 ± 0.2 mM. Plasma glucose, free fatty acids, triglycerides and cholesterol were within the normal range (Table 1). The KD significantly increased plasma ketones 8-fold compared to baseline (β-HBA and AcAc combined increased from 0.6 ± 0.6 to 4.8 ± 0.9 mM; p < 0.001; Table 1). The KD significantly decreased plasma glucose on the scan day by ∼24% from baseline (5.1 ± 0.4 to 3.9 ± 0.3 mM; p < 0.05; Table 1). Measurements with a portable meter by the participants themselves showed that ketosis (plasma β-HBA) gradually increased throughout the four days of the KD, whereas the decrease in glucose happened mostly on the fourth day (Figure S1). The KD decreased insulin by 52% (5.4 ± 0.7 to 2.6 ± 0.5 μU/L; p = 0.012) and increased plasma-free fatty acids by 2.5-fold (0.37 ± 0.25 to 0.95 ± 0.29 mM; p < 0.05), but did not significantly change plasma cholesterol or triglycerides (Table 1).
Table 1.
Characteristics of the participants before (pre-) and at the end of (post-) the four-day ketogenic diet (KD).
| Pre-KDa | Post-KD | pb | |
|---|---|---|---|
| Age (y) | 35 ± 15 | – | – |
| Gender (M/F) | 6/4 | – | – |
| Weight (kg) | 73 ± 7 | 73 ± 8 | 0.866 |
| Height (cm) | 170 ± 11 | – | – |
| Body mass index | 25.4 ± 4.0 | 25.4 ± 4.0 | 0.866 |
| Plasma measurements Glucose (mM) | 5.1 ± 0.4 | 3.9 ± 0.3 | 0.005 |
| Insulin (IU/L) | 5.4 ± 0.7 | 2.6 ± 0.5 | 0.012 |
| Acetoacetate (mM) | 0.2 ± 0.2 | 1.7 ± 0.4 | 0.005 |
| β-hydroxybutyrate (mM) | 0.4 ± 0.4 | 3.1 ± 0.7 | 0.005 |
| Free fatty acids (mM) | 0.4 ± 0.2 | 1.0 ± 0.3 | 0.005 |
| Triglycerides (mM) | 1.3 ± 0.8 | 0.9 ± 0.7 | 0.236 |
| Cholesterol (mM) | 5.3 ± 0.9 | 5.1 ± 0.9 | 0.575 |
Mean ± SD (n = 10 pre- and post-KD).
Wilcoxon rank-sum test.
Brain ketone and glucose metabolism
Before starting the KD, glucose accounted for ∼98% of whole brain energy metabolism as determined by the mean global CMRglc of 31.6 ± 3.0 vs. 0.7 ± 0.6 µmol/100 g/min for CMRa (Figure 1(a)). After four days on the KD, CMRa increased to 4.8 ± 2.4 µmol/100 g/min which represented an increase from ∼2% to 17% for the contribution of CMRa to whole brain energy metabolism. CMRglc decreased to 24.5 ± 5.5 µmol/100 g/min during the KD (Figure 1(a)). Net whole brain CMR (CMRa + CMRglc) did not differ significantly pre- to post-KD (32.3 ± 2.9 to 29.3 ± 4.7 µmol/100 g/min). Global and regional brain rate constants remained unchanged pre- to post-KD for both AcAc (Ka; 0.029 ± 0.003 to 0.029 ± 0.002 min−1; p ≥ 0.832; Figure 1(b)) and FDG (Kglc; 0.054 ± 0.004 min−1 to 0.056 ± 0.005 min−1; p ≥ 0.266; Figure 1(b) and Table S1).
Figure 1.
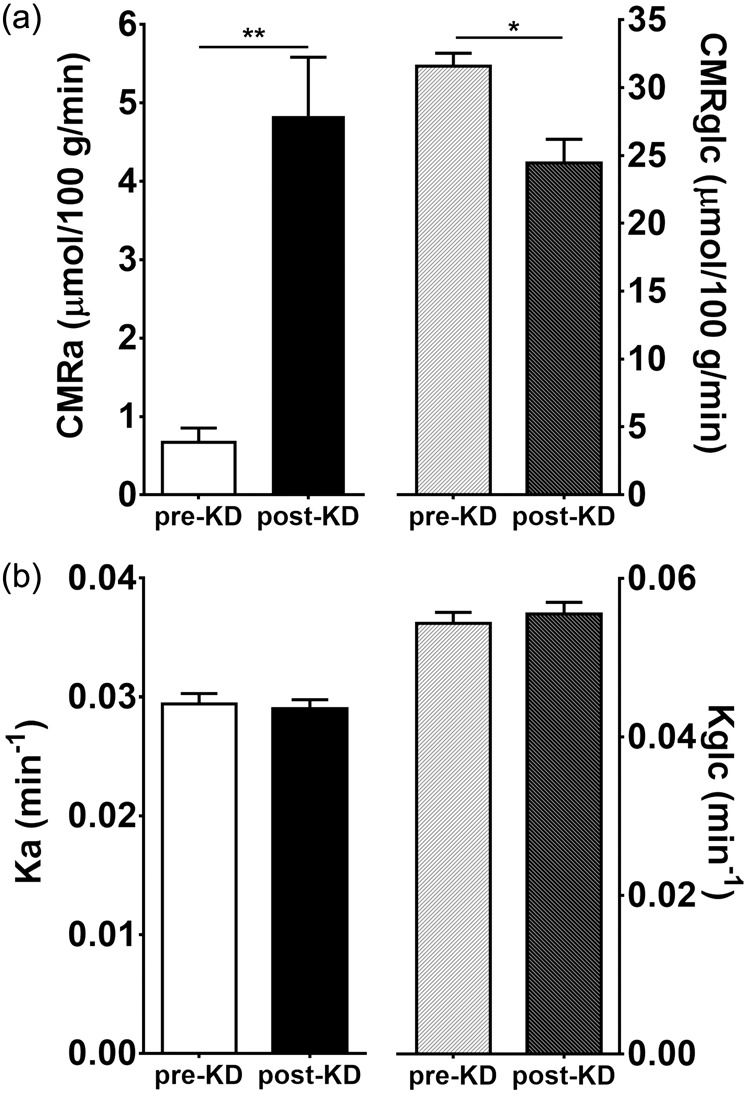
(a) Whole brain cerebral metabolic rates of acetoacetate (CMRa) and glucose (CMRglc) before and after the ketogenic diet (KD). (b) Whole brain rate constants of acetoacetate (Ka) and glucose (Kglc) before and after the KD. Means ± SD; n = 10. *p < 0.05, **p < 0.01; Wilcoxon rank-sum test.
The increase in CMRa after the KD differed significantly across specific brain regions with the caudate showing lowest increase (+2.9 µmol/100 g/min) and the frontal pole the highest increase (+5.6 µmol/100 g/min) (Figure 2(a); Table 2). These region-by-region changes in CMRa post-KD were confirmed in a three-dimensional voxel-wise surface representation of the brain (Figure 3, upper panel). When expressed as the % contribution of AcAc to total brain energy metabolism (CMRa/(CMRa + CMRglc) × 100), the increase in CMRa post-KD was highest in the entorhinal cortex and temporal pole (+30.3 and +27.8%, respectively; Figure 2(b)) and lowest in the caudate and putamen (+13.1 and +13.9%, respectively; Figure 2(b)). The decrease in CMRglc post-KD was greatest in the caudal middle frontal cortex (−9.6 µmol/100 g/min), whereas the putamen was the least affected (−4.6 µmol/100 g/min) (Figures 2(a) and 3, lower panel; Table 2). The increase in CMRa was significantly inversely correlated to the decrease in CMRglc across brain regions (r = −0.91, p < 0.0001; Figure 4). The CMRglc pre-KD was strongly correlated with the CMRglc post-KD in every brain region (r = 0.99; p < 0.0001; Figure S2).
Figure 2.

(a) Regional increase in cerebral metabolic rate of acetoacetate (CMRa; white bars), and decrease in cerebral metabolic rate of glucose (CMRglc; blue bars). (b) Regional% contribution of ketones to brain metabolism before (pre-KD; yellow bars) and at the end (post-KD; black bars) of four days on a ketogenic diet. Means; n = 10/region. Error bars not shown; mean SD for all 35 regions were 4.2 and 2.5 µmol/100 g/min (CMRglc and CMRa respectively; (a)) and 1.9 and 9.0% (pre-KD and post-KD, respectively; (b)). Repeated measures two-way ANOVA were used to assess the differences between regions; significant at p < 0.05. Brain regions: (1) caudate; (2) white matter; (3) hippocampus; (4) putamen; (5) thalamus; (6) rostral anterior cingulate; (7) insula; (8) caudal anterior cingulate; (9) parahippocampus; (10) posterior cingulate; (11) transverse temporal; (12) medial orbital frontal; (13) isthmus cingulate; (14) fusiform; (15) superior temporal; (16) temporal pole; (17) entorhinal; (18) grey matter; (19) precentral; (20) lateral orbital frontal; (21) superior frontal; (22) supramarginal; (23) caudal middle frontal; (24) paracentral; (25) middle temporal; (26) inferior temporal; (27) inferior parietal; (28) inferior frontal; (29) precuneus; (30) lingual; (31) rostral middle frontal; (32) superior parietal; (33) cuneus; (34) lateral occipital; (35) frontal pole.
Table 2.
Cerebral metabolic rate of acetoacetate (CMRa; µmol/100 g/min) and glucose (CMRglc; µmol/100 g/min) before (pre-) and at the end (post-) of the four-day ketogenic diet (KD).
| Brain regions | CMRa |
CMRglc |
||
|---|---|---|---|---|
| Pre-KD | Post-KD | Pre-KD | Post-KD | |
| Frontal | ||||
| Superior | 0.8 ± 0.1 | 5.6 ± 0.5 | 39.2 ± 3.7 | 30.4 ± 3.0 |
| Rostral middle | 0.8 ± 0.1 | 6.0 ± 0.4 | 42.0 ± 3.6 | 32.7 ± 2.9 |
| Caudal middle | 0.8 ± 0.1 | 5.6 ± 0.6 | 41.8 ± 4.6 | 32.1 ± 4.7 |
| Inferior | 0.8 ± 0.1 | 5.8 ± 0.8 | 40.6 ± 3.5 | 31.0 ± 7.6 |
| Lateral orbital | 0.8 ± 0.1 | 5.5 ± 0.5 | 36.7 ± 2.7 | 28.5 ± 3.3 |
| Medial orbital | 0.7 ± 0.1 | 4.9 ± 0.6 | 34.6 ± 3.2 | 28.0 ± 3.0 |
| Precentral | 0.8 ± 0.1 | 5.5 ± 0.5 | 38.1 ± 4.4 | 29.3 ± 3.2 |
| Paracentral | 0.8 ± 0.1 | 5.5 ± 0.5 | 35.3 ± 4.6 | 27.2 ± 3.6 |
| Pole | 0.8 ± 0.2 | 6.5 ± 0.7 | 41.8 ± 4.0 | 32.6 ± 4.5 |
| Temporal | ||||
| Superior | 0.7 ± 0.1 | 5.0 ± 0.4 | 32.0 ± 3.3 | 23.9 ± 2.4 |
| Middle | 0.8 ± 0.1 | 5.7 ± 0.4 | 34.5 ± 3.1 | 26.3 ± 2.6 |
| Inferior | 0.8 ± 0.1 | 5.8 ± 0.4 | 33.0 ± 2.7 | 25.1 ± 3.4 |
| Fusiform | 0.7 ± 0.1 | 5.0 ± 0.5 | 28.7 ± 2.8 | 21.2 ± 2.2 |
| Enthorhinal | 0.7 ± 0.1 | 5.3 ± 0.5 | 23.3 ± 1.3 | 17.2 ± 2.0 |
| Transverse | 0.7 ± 0.1 | 4.9 ± 0.6 | 39.4 ± 4.7 | 31.1 ± 3.7 |
| Pole | 0.7 ± 0.1 | 5.2 ± 0.5 | 26.1 ± 2.5 | 18.8 ± 2.6 |
| Hippocampus | 0.4 ± 0.0 | 3.3 ± 0.3 | 20.4 ± 2.1 | 15.5 ± 1.6 |
| Parahippocampus | 0.6 ± 0.0 | 4.5 ± 0.4 | 25.0 ± 1.5 | 18.6 ± 1.5 |
| Parietal | ||||
| Superior | 0.9 ± 0.1 | 6.2 ± 0.4 | 37.8 ± 6.7 | 28.3 ± 4.3 |
| Inferior | 0.8 ± 0.1 | 5.9 ± 0.5 | 37.5 ± 5.3 | 28.9 ± 3.9 |
| Supramarginal | 0.8 ± 0.1 | 5.7 ± 0.5 | 37.2 ± 4.5 | 28.8 ± 2.9 |
| Precuneus | 0.8 ± 0.1 | 5.9 ± 0.5 | 39.5 ± 4.9 | 30.8 ± 3.7 |
| Occipital | ||||
| Lateral | 0.9 ± 0.1 | 6.4 ± 0.5 | 34.6 ± 4.6 | 25.3 ± 3.6 |
| Lingual | 0.8 ± 0.1 | 5.9 ± 0.4 | 32.6 ± 2.9 | 23.9 ± 3.3 |
| Cuneus | 0.9 ± 0.1 | 6.3 ± 0.6 | 37.9 ± 4.6 | 28.3 ± 4.1 |
| Cingulate | ||||
| Rostral anterior | 0.6 ± 0.1 | 4.0 ± 0.6 | 30.0 ± 2.2 | 24.0 ± 2.7 |
| Caudal anterior | 0.6 ± 0.1 | 4.3 ± 0.4 | 29.1 ± 2.3 | 22.7 ± 3.0 |
| Posterior | 0.7 ± 0.1 | 4.8 ± 0.6 | 33.8 ± 3.1 | 26.8 ± 2.6 |
| Isthmus | 0.7 ± 0.2 | 4.9 ± 0.5 | 34.6 ± 3.8 | 27.3 ± 2.4 |
| Subcortical | ||||
| Thalamus | 0.5 ± 0.1 | 3.7 ± 0.6 | 25.3 ± 1.2 | 20.6 ± 1.2 |
| Caudate | 0.5 ± 0.1 | 3.2 ± 0.7 | 32.1 ± 2.0 | 26.0 ± 2.4 |
| Putamen | 0.5 ± 0.1 | 3.5 ± 0.6 | 30.5 ± 2.8 | 25.8 ± 2.0 |
| Insula | 0.6 ± 0.1 | 4.1 ± 0.4 | 28.1 ± 1.8 | 22.1 ± 2.0 |
| Grey matter | 0.8 ± 0.1 | 5.5 ± 0.4 | 35.2 ± 3.1 | 27.0 ± 2.4 |
| White matter | 0.5 ± 0.1 | 3.3 ± 0.3 | 22.4 ± 2.1 | 17.1 ± 1.5 |
Note: Values are mean ± SD (n = 10 pre- and post-KD).
Figure 3.
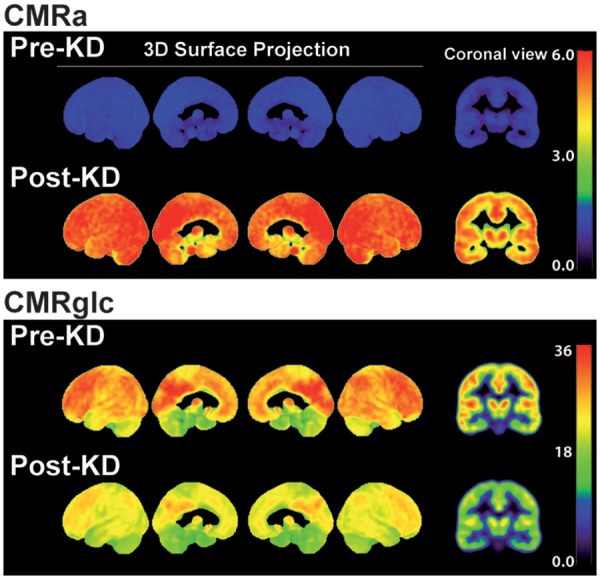
Voxel-wise three-dimensional view of the medial and lateral brain surfaces and a representative coronal slice showing the cerebral metabolic rate of acetoacetate (CMRa) and glucose (CMRglc) pre- and post-ketogenic diet (KD). Scale is shown on the right (umol/100 g/min).
Figure 4.
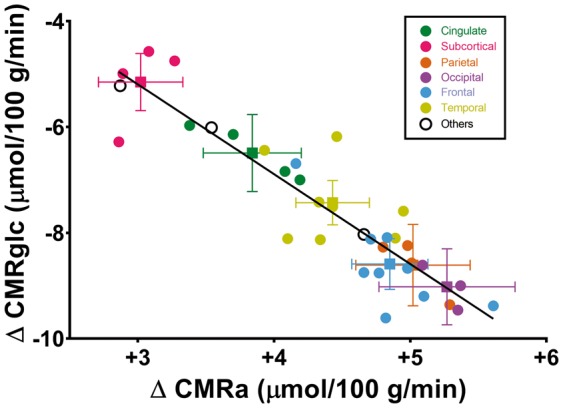
Inverse correlation between the regional change in cerebral metabolic rate of acetoacetate (ΔCMRa) and cerebral metabolic rate of glucose (ΔCMRglc) pre- to post-ketogenic diet (n = 10/data point). Brain regions are grouped by colour as the mean ± SEM of the major anatomic regions (squares) with circles representing the main sub-regions of each major region. Black circles represent (from left to right) overall white matter, the insula and overall grey matter, respectively. The regression equation is y = −1.69x−0.06 (r = −0.91; p < 0.0001).
The increase in plasma AcAc pre- to post-KD was significantly positively correlated with the increase in whole brain CMRa (r = +0.90; p ≤ 0.0001; Figure 5(a)). Similarly, the decrease in plasma glucose pre- to post-KD was significantly positively correlated with the decrease in whole brain CMRglc (r = +0.64; p = 0.002; Figure 5(b)). There was no significant correlation between Ka and plasma AcAc (p = 0.75) nor between Kglc and plasma glucose (p = 0.58). CMRa was significantly positively correlated with plasma free fatty acids (r = +0.54; p = 0.01). CMRglc was significantly negatively correlated with plasma AcAc (r = −0.69; p < 0.0001; Figure S3). There was no statistically significant relationship between CMRa, CMRglc, Kglc or Ka with age, plasma cholesterol or plasma triglycerides.
Figure 5.
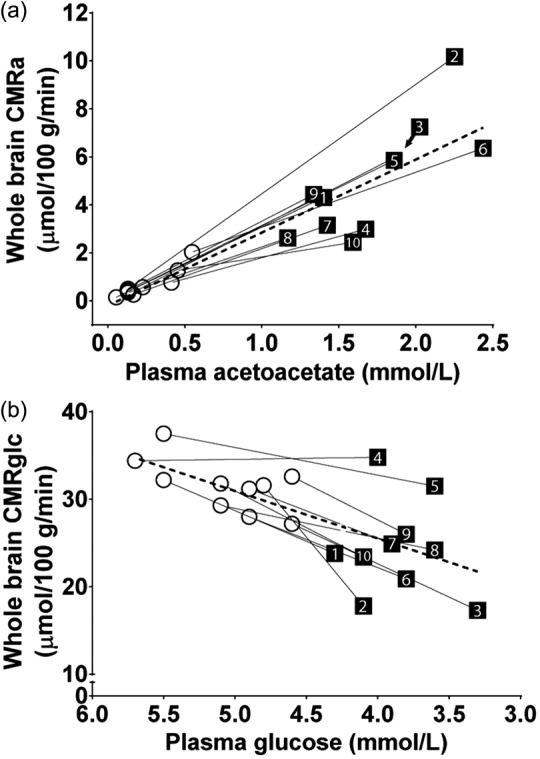
Correlation between whole brain cerebral metabolic rate of acetoacetate (CMRa) and plasma acetoacetate (a), and between whole brain cerebral metabolic rate of glucose (CMRglc) and plasma glucose (b) in each participant (numbered 1 to 10). The dotted lines represent the mean of all 10 participants (A: y = 3.04x + 0.07; r = 0.94; p < 0.0001; B: y = 5.42x − 0.70; r = 0.64; p = 0.002).
Discussion
This study is the first to report the quantitative changes in CMRa and CMRglc across multiple brain regions in humans in moderate short-term ketosis. The two main results are that, post-KD, the changes in regional and whole brain CMRa were directly proportional to blood AcAc concentration, and that CMRglc decreased inversely with the increase in CMRa. Quantitative region-by-region analysis showed that a blood AcAc of 1.7 mM would sustain about 17% of total brain energy requirements. Thus, when plasma ketones increase, the healthy adult brain meets its metabolic needs by modulating CMRglc in relation to brain ketone availability and uptake. As the brain’s main back-up fuel to glucose, it seems logical that the brain would be capable of rapid ketone uptake when ketone availability increases, which normally only occurs when glucose and insulin decrease over a period of at least several hours. The present study did not experimentally control the rate of change in plasma glucose or ketones, but this has been reported elsewhere13 and shows that CMRglc decreases rapidly as plasma ketones increase during β-HBA infusion. Our results agree with those of Hasselbalch et al.13 in suggesting that CMRa is modulated by plasma ketone availability and not by hypoglycemia per se. Thus, in humans in moderate short-term ketosis, CMRglc is down-regulated in proportion to the increase in ketone supply, while brain oxygen consumption remains essentially constant.13 As previously proposed, there appears to be a sparing effect of higher ketone availability on brain glucose utilisation.34 This would explain the significant inverse relation between CMRa and CMRglc across brain regions while on the KD (r = 0.91; p < 0.0001; Figure 4).
Our results are in good agreement with previous studies demonstrating a linear positive relationship over a 60-fold concentration range between plasma ketones and CMRket,10 with measurements made by arterio-venous difference,13,17–19 11C-β-HBA PET or 11C-AcAc PET.14 The strong correlation between plasma AcAc and CMRa in the present study (r = 0.94; Figure 5(a)) confirms this tight relationship between plasma AcAc and CMRa.
The four-day KD used in this study enabled us to rapidly achieve a moderate safe level of ketosis (∼5 mM) which was somewhat higher than what would normally be seen in short-term fasting (0.5–2 mM) but still far lower than seen during diabetic ketoacidosis (15–25 mM). The blood concentration of ketones achieved in the present study was in the range aimed for in children given a therapeutic KD to treat intractable seizures.3,35,36
The present results are different from what was seen in rats on a KD using the same dual PET protocol.15,16 This discrepancy may due in part to the fact that those animal studies15,16 were done in aged rats, whereas the humans in the present study averaged 35 years old. Aged rats, like cognitively normal older persons7 and Alzheimer’s disease,8 exhibit a specific regional pattern of brain glucose hypometabolism. Also, other animal studies using KD have shown a decrease in CMRglc as seen in the present study.37,38
In older people, brain glucose metabolism deteriorates regionally7,39,40 years before the onset of cognitive decline,10,41,42 but plasma glucose remains normal or somewhat elevated.43 Hence, during aging, hypoglycemia and hypoinsulinemia which are the normal stimuli for ketogenesis are less activated even though the brain is not receiving sufficient glucose, so it experiences a chronic metabolic demand that is unmet. Our present results suggest that a ketogenic intervention could, at least in principle, correct or bypass this brain glucose hypometabolism. At 4.8 mM ketones, the 33% of brain energy requirements met by ketones (AcAc and β-HBA combined) would be sufficient to compensate for a considerable part of the global brain glucose hypometabolism observed in Alzheimer’s disease which is on the order of 20–40% depending on the stage of the disease.10
The present study has some limitations, including the relatively high inter-individual variation in plasma ketones on the KD. This variability is well known with ketogenic treatments in both animals15,16 and humans.31,44 Variable plasma ketone response to the KD increased the inter-individual range of CMRa values but also helped demonstrate the dynamic range of the linear relationship between increased CMRa and decreased CMRglc. β-HBA is more widely studied than AcAc, but this study did not include a direct assessment of CMRb. β-HBA has to be converted to AcAc in order to be metabolized by the TCA cycle45 so using 11C-AcAc as the tracer provides an excellent measure of brain ketone metabolism in the short time frame of a PET study with 11C (about 10 min). The present study used a four-day KD but longer term ketosis could potentially produce different results, especially if upregulating the transcription of certain enzymes or monocarbolxylic acid transporters implicated in ketogenesis, ketone transport or ketone catabolism requires more than four days.
CMRket was not directly measured in this study but can be estimated from the measured CMRa and an estimate of the CMR of β-HBA (CMRb). Using Blomqvist’s equation to estimate CMRket46 from CMRb, we estimated CMRket from our measured CMRa and AcAc and β-HBA plasma values. We found that CMRket would be 2.2-fold and 2.5-fold higher than CMRa pre-KD and post-KD, respectively. This would correspond to ketones (AcAc plus β-HBA) supplying about 5% and 33% of total brain energy requirements, compared to AcAc alone supplying 2 and 17% of total brain energy requirements, pre-KD and post-KD, respectively. This estimate agrees with results obtained in a previous human study in which brain ketone metabolism following 3.5 days of starvation was measured by arterio-venous difference.47
Under ketogenic conditions varying from 24 h fasting to 60 days starvation, ketone uptake by the brain increases linearly with plasma ketone concentration, and this is true whether brain ketone uptake is measured by arterio-venous difference or by ketone PET.10 Hence, the change in MCT expression when ketosis is induced seems to be rapid and does not seem to reach saturation under even an extreme range of physiological circumstances. The up-regulation of monocarboxylic acid transporters used by ketones in the brain may not have been maximal after four days but would certainly have been increased via stimulation by cyclic AMP.48,49
Conclusion
This study confirms that in humans undergoing short-term ketosis induced by a KD, the brain’s overall metabolic rate is driven by blood ketone concentration and that CMRglc declines proportionally so as to meet but not exceed the brain’s net metabolic needs. This PET protocol provides an opportunity to assess whether similar ketogenic conditions induce the same metabolic changes in the brain in healthy aging and Alzheimer’s disease.
Supplementary Material
Acknowledgements
Invaluable help was provided by Christine Brodeur-Dubreuil, Éric Lavallée, Sébastien Tremblay, and the whole PET clinical team of the Sherbrooke University Hospital Center.
Funding
The author(s) disclosed receipt of the following financial support for the research, authorship, and/or publication of this article: Financial support from CIHR, CFI, Sojecci 2, Alzheimer Association USA, FRQS and Université de Sherbrooke.
Declaration of conflicting interests
The author(s) declared no potential conflicts of interest with respect to the research, authorship, and/or publication of this article.
Authors’ contribution
ACL, CAC and SCC participated in the study design. ACL, EC, CAC, VSP and MH conducted experiments. ACL, EC and CAC performed data and statistical analysis. ACL, EC, CAC, VSP, MH and SCC wrote or contributed to the writing of the manuscript.
Supplementary material
Supplementary material for this paper is available at: http://jcbfm.sagepub.com/content/by/supplemental-data
References
- 1.Garber AJ, Menzel PH, Boden G, et al. Hepatic ketogenesis and gluconeogenesis in humans. J Clin Invest 1974; 54: 981–989. [DOI] [PMC free article] [PubMed] [Google Scholar]
- 2.Foster DW. Studies in the ketosis of fasting. J Clin Invest 1967; 46: 1283–1296. [DOI] [PMC free article] [PubMed] [Google Scholar]
- 3.Neal EG, Chaffe H, Schwartz RH, et al. The ketogenic diet for the treatment of childhood epilepsy: a randomised controlled trial. Lancet Neurol 2008; 7: 500–506. [DOI] [PubMed] [Google Scholar]
- 4.Pascual JM, Liu P, Mao D, et al. Triheptanoin for glucose transporter type I deficiency (G1D): modulation of human ictogenesis, cerebral metabolic rate, and cognitive indices by a food supplement. JAMA Neurol 2014; 71: 1255–1265. [DOI] [PMC free article] [PubMed] [Google Scholar]
- 5.Phelps ME, Huang SC, Hoffman EJ, et al. Tomographic measurement of local cerebral glucose metabolic rate in humans with (F-18)2-fluoro-2-deoxy-D-glucose: validation of method. Ann Neurol 1979; 6: 371–388. [DOI] [PubMed] [Google Scholar]
- 6.Tremblay S, Ouellet R, Rodrigue S, et al. Automated synthesis of 11C-acetoacetic acid, a key alternate brain fuel to glucose. Appl Radiat Isot 2007; 65: 934–940. [DOI] [PubMed] [Google Scholar]
- 7.Nugent S, Tremblay S, Chen KW, et al. Brain glucose and acetoacetate metabolism: a comparison of young and older adults. Neurobiol Aging 2014; 35: 1386–1395. [DOI] [PubMed] [Google Scholar]
- 8.Castellano CA, Nugent S, Paquet N, et al. Lower brain 18F-fluorodeoxyglucose uptake but normal 11C-acetoacetate metabolism in mild Alzheimer's disease dementia. J Alzheimers Dis 2015; 43: 1343–1353. [DOI] [PubMed] [Google Scholar]
- 9.Craft S. The role of metabolic disorders in Alzheimer disease and vascular dementia: two roads converged. Arch Neurol 2009; 66: 300–305. [DOI] [PMC free article] [PubMed] [Google Scholar]
- 10.Cunnane SC, Courchesne-Loyer A, St-Pierre V, et al. Can ketones compensate for deteriorating brain glucose uptake during aging? Implications for the risk and treatment of Alzheimer's disease. Ann N Y Acad Sci 2016; 1367: 12–20. [DOI] [PubMed] [Google Scholar]
- 11.Veech RL, Chance B, Kashiwaya Y, et al. Ketone bodies, potential therapeutic uses. IUBMB Life 2001; 51: 241–247. [DOI] [PubMed] [Google Scholar]
- 12.Cunnane S, Nugent S, Roy M, et al. Brain fuel metabolism, aging, and Alzheimer's disease. Nutrition 2011; 27: 3–20. [DOI] [PMC free article] [PubMed] [Google Scholar]
- 13.Hasselbalch SG, Madsen PL, Hageman LP, et al. Changes in cerebral blood flow and carbohydrate metabolism during acute hyperketonemia. Am J Physiol 1996; 270(5 Pt 1): E746–E751. [DOI] [PubMed] [Google Scholar]
- 14.Blomqvist G, Alvarsson M, Grill V, et al. Effect of acute hyperketonemia on the cerebral uptake of ketone bodies in nondiabetic subjects and IDDM patients. Am J Physiol Endocrinol Metab 2002; 283: E20–E28. [DOI] [PubMed] [Google Scholar]
- 15.Pifferi F, Tremblay S, Croteau E, et al. Mild experimental ketosis increases brain uptake of (11)C-acetoacetate and (18)F-fluorodeoxyglucose: a dual-tracer PET imaging study in rats. Nutr Neurosci 2011; 14: 51–58. [DOI] [PubMed] [Google Scholar]
- 16.Roy M, Nugent S, Tremblay-Mercier J, et al. The ketogenic diet increases brain glucose and ketone uptake in aged rats: a dual tracer PET and volumetric MRI study. Brain Res 2012; 1488: 14–23. [DOI] [PubMed] [Google Scholar]
- 17.Owen OE, Morgan AP, Kemp HG, et al. Brain metabolism during fasting. J Clin Invest 1967; 46: 1589–1595. [DOI] [PMC free article] [PubMed] [Google Scholar]
- 18.Drenick EJ, Alvarez LC, Tamasi GC, et al. Resistance to symptomatic insulin reactions after fasting. J Clin Invest 1972; 51: 2757–2562. [DOI] [PMC free article] [PubMed] [Google Scholar]
- 19.Lying-Tunell U, Lindblad BS, Malmlund HO, et al. Cerebral blood flow and metabolic rate of oxygen, glucose, lactate, pyruvate, ketone bodies and amino acids. Acta Neurol Scand 1981; 63: 337–350. [DOI] [PubMed] [Google Scholar]
- 20.Mahan LK, Escott-Stump S. Krause's food, nutrition, & diet therapy, 10th ed Philadelphia: W.B. Saunders Company, 2000. [Google Scholar]
- 21.Harris JA, Benedict FG. A biometric study of human basal metabolism. Proc Natl Acad Sci USA 1918; 4: 370–373. [DOI] [PMC free article] [PubMed] [Google Scholar]
- 22.Roza AM, Shizgal HM. The Harris Benedict equation reevaluated: resting energy requirements and the body cell mass. Am J Clin Nutr 1984; 40: 168–182. [DOI] [PubMed] [Google Scholar]
- 23.Coupe P, Yger P, Prima S, et al. An optimized blockwise nonlocal means denoising filter for 3-D magnetic resonance images. IEEE Trans Med Imaging 2008; 27: 425–441. [DOI] [PMC free article] [PubMed] [Google Scholar]
- 24.Bernier M, Chamberland M, Houde JC, et al. Using fMRI non-local means denoising to uncover activation in sub-cortical structures at 1.5 T for guided HARDI tractography. Front Hum Neurosci 2014; 8: 715. [DOI] [PMC free article] [PubMed] [Google Scholar]
- 25.Zanotti-Fregonara P, Chen K, Liow JS, et al. Image-derived input function for brain PET studies: many challenges and few opportunities. J Cereb Blood Flow Metab 2011; 31: 1986–1998. [DOI] [PMC free article] [PubMed] [Google Scholar]
- 26.Patlak CS, Blasberg RG, Fenstermacher JD. Graphical evaluation of blood-to-brain transfer constants from multiple-time uptake data. J Cereb Blood Flow Metab 1983; 3: 1–7. [DOI] [PubMed] [Google Scholar]
- 27.Graham MM, Muzi M, Spence AM, et al. The FDG lumped constant in normal human brain. J Nucl Med 2002; 43: 1157–1166. [PubMed] [Google Scholar]
- 28.Li PK, Lee JT, MacGillivray MH, et al. Direct, fixed-time kinetic assays for beta-hydroxybutyrate and acetoacetate with a centrifugal analyzer or a computer-backed spectrophotometer. Clin Chem 1980; 26: 1713–1717. [PubMed] [Google Scholar]
- 29.Harano Y, Ohtsuki M, Ida M, et al. Direct automated assay method for serum or urine levels of ketone bodies. Clin Chim Acta 1985; 151: 177–183. [DOI] [PubMed] [Google Scholar]
- 30.Freemantle E, Vandal M, Tremblay Mercier J, et al. Metabolic response to a ketogenic breakfast in the healthy elderly. J Nutr Health Aging 2009; 13: 293–298. [DOI] [PubMed] [Google Scholar]
- 31.Tremblay-Mercier J, Tessier D, Plourde M, et al. Bezafibrate mildly stimulates ketogenesis and fatty acid metabolism in hypertriglyceridemic subjects. J Pharmacol Exp Ther 2010; 334: 341–346. [DOI] [PubMed] [Google Scholar]
- 32.Gottstein U, Muller W, Berghoff W, et al. Utilization of non-esterified fatty acids and ketone nbodies in human brain. Klin Wochenschr 1971; 49: 406–411. [DOI] [PubMed] [Google Scholar]
- 33.Benjamini Y, Drai D, Elmer G, et al. Controlling the false discovery rate in behavior genetics research. Behav Brain Res 2001; 125: 279–284. [DOI] [PubMed] [Google Scholar]
- 34.Hawkins RA, Mans AM, Davis DW. Regional ketone body utilization by rat brain in starvation and diabetes. Am J Physiol 1986; 250: E169–E178. [DOI] [PubMed] [Google Scholar]
- 35.DB A. The ketogenic diet in epilepsy. Can Med Assoc J 1931; 24: 106–107. [PMC free article] [PubMed] [Google Scholar]
- 36.Balietti M, Casoli T, Di Stefano G, et al. Ketogenic diets: an historical antiepileptic therapy with promising potentialities for the aging brain. Ageing Res Rev 2010; 9: 273–279. [DOI] [PubMed] [Google Scholar]
- 37.Zhang Y, Kuang Y, Xu K, et al. Ketosis proportionately spares glucose utilization in brain. J Cereb Blood Flow Metab 2013; 33: 1307–1311. [DOI] [PMC free article] [PubMed] [Google Scholar]
- 38.LaManna JC, Salem N, Puchowicz M, et al. Ketones suppress brain glucose consumption. Adv Exp Med Biol 2009; 645: 301–306. [DOI] [PMC free article] [PubMed] [Google Scholar]
- 39.Mosconi L, Sorbi S, de Leon MJ, et al. Hypometabolism exceeds atrophy in presymptomatic early-onset familial Alzheimer's disease. J Nucl Med 2006; 47: 1778–1786. [PubMed] [Google Scholar]
- 40.Baker LD, Cross DJ, Minoshima S, et al. Insulin resistance and Alzheimer-like reductions in regional cerebral glucose metabolism for cognitively normal adults with prediabetes or early type 2 diabetes. Arch Neurol 2011; 68: 51–57. [DOI] [PMC free article] [PubMed] [Google Scholar]
- 41.Reiman EM, Chen K, Alexander GE, et al. Functional brain abnormalities in young adults at genetic risk for late-onset Alzheimer's dementia. Proc Natl Acad Sci USA 2004; 101: 284–289. [DOI] [PMC free article] [PubMed] [Google Scholar]
- 42.Bateman RJ, Xiong C, Benzinger TL, et al. Clinical and biomarker changes in dominantly inherited Alzheimer's disease. N Engl J Med 2012; 367: 795–804. [DOI] [PMC free article] [PubMed] [Google Scholar]
- 43.Nugent S, Castellano CA, Bocti C, et al. Relationship of metabolic and endocrine parameters to brain glucose metabolism in older adults: do cognitively-normal older adults have a particular metabolic phenotype? Biogerontology 2016; 17: 241–255. [DOI] [PubMed] [Google Scholar]
- 44.Courchesne-Loyer A, Fortier M, Tremblay-Mercier J, et al. Stimulation of mild, sustained ketonemia by medium-chain triacylglycerols in healthy humans: estimated potential contribution to brain energy metabolism. Nutrition 2013; 29: 635–640. [DOI] [PubMed] [Google Scholar]
- 45.Avogaro A, Nosadini R, Bier DM, et al. Ketone body kinetics in vivo using simultaneous administration of acetoacetate and 3-hydroxybutyrate labelled with stable isotopes. Acta Diabetol Lat 1990; 27: 41–51. [DOI] [PubMed] [Google Scholar]
- 46.Blomqvist G, Thorell JO, Ingvar M, et al. Use of R-beta-[1-11C]hydroxybutyrate in PET studies of regional cerebral uptake of ketone bodies in humans. Am J Physiol 1995; 269: E948–E959. [DOI] [PubMed] [Google Scholar]
- 47.Hasselbalch SG, Knudsen GM, Jakobsen J, et al. Brain metabolism during short-term starvation in humans. J Cereb Blood Flow Metab 1994; 14: 125–131. [DOI] [PubMed] [Google Scholar]
- 48.Simpson IA, Carruthers A, Vannucci SJ. Supply and demand in cerebral energy metabolism: the role of nutrient transporters. J Cereb Blood Flow Metab 2007; 27: 1766–1791. [DOI] [PMC free article] [PubMed] [Google Scholar]
- 49.Halestrap AP, Wilson MC. The monocarboxylate transporter family – role and regulation. IUBMB Life 2012; 64: 109–119. [DOI] [PubMed] [Google Scholar]
Associated Data
This section collects any data citations, data availability statements, or supplementary materials included in this article.