Abstract
Background
Acquired drug resistance to the chemotherapeutic drug irinotecan (the active metabolite of which is SN-38) is one of the significant obstacles in the treatment of advanced colorectal cancer (CRC). The molecular mechanism or targets mediating irinotecan resistance are still unclear. It is urgent to find the irinotecan response biomarkers to improve CRC patients’ therapy.
Methods
Genetic Omnibus Database GSE42387 which contained the gene expression profiles of parental and irinotecan-resistant HCT-116 cell lines was used. Differentially expressed genes (DEGs) between parental and irinotecan-resistant cells, protein-protein interactions (PPIs), gene ontologies (GOs) and pathway analysis were performed to identify the overall biological changes. The most common DEGs in the PPIs, GOs and pathways were identified and were validated clinically by their ability to predict overall survival and disease free survival. The gene-gene expression correlation and gene-resistance correlation was also evaluated in CRC patients using The Cancer Genomic Atlas data (TCGA).
Results
The 135 DEGs were identified of which 36 were upregulated and 99 were down regulated. After mapping the PPI networks, the GOs and the pathways, nine genes (GNAS, PRKACB, MECOM, PLA2G4C, BMP6, BDNF, DLG4, FGF2 and FGF9) were found to be commonly enriched. Signal transduction was the most significant GO and MAPK pathway was the most significant pathway. The five genes (FGF2, FGF9, PRKACB, MECOM and PLA2G4C) in the MAPK pathway were all contained in the signal transduction and the levels of those genes were upregulated. The FGF2, FGF9 and MECOM expression were highly associated with CRC patients’ survival rate but not PRKACB and PLA2G4C. In addition, FGF9 was also associated with irinotecan resistance and poor disease free survival. FGF2, FGF9 and PRKACB were positively correlated with each other while MECOM correlated positively with FGF9 and PLA2G4C, and correlated negatively with FGF2 and PRKACB after doing gene-gene expression correlation.
Conclusion
Targeting the MAPK signal transduction pathway through the targeting of the FGF2, FGF9, MECOM, PLA2G4C and PRKACB might increase tumor responsiveness to irinotecan treatment.
Introduction
Colorectal cancer (CRC) is the third most frequently diagnosed cancer and the third leading cause of cancer deaths worldwide representing 10% of the world-wide cancer incidence and mortality[1]. Surgical removal of the tumor is the first choice treatment for non-metastatic CRC though approximately one-quarter of CRC patients have metastases at diagnosis and half developing metastases even after complete resection[2,3]. The addition of cytotoxic drugs oxaliplatin and irinotecan and the monoclonal anti-bodies cetuximab, bevacizumab or panitunumab to the backbone of the antimetabolite 5-fluorouracil has improved the median survival of metastatic CRC(mCRC) from 8 to 24 months[4–6]. Drug resistance still hampers the efficient treatment of mCRC as half of the patients have intrinsic or acquired resistance contributing to a 5-year survival rate of 60% to 65%[7–10] and with the chemotherapy side effects being many, there is an unmet need for therapy response predictive biomarkers[11].
Attempts to identify chemotherapy predictive biomarkers of treatment response and resistance has yielded some results with high thymidylate synthase (TS) expression being a predictor of poorer outcome in 5-fu-based therapy and also 5-fu adjuvant treatment being ineffective in tumors with microsatellite instability[12–14];likewise higher levels of TOP1 is correlated with greater sensitivity of colon tumors to camptothecin derivatives compared with normal colonic mucosa, but there is no irinotecan predictive biomarkers that have reached a level of evidence allowing for routine clinical use[15].
The testing of predictive biomarkers is not applied routinely in clinical practice, also in prediction studies on response of colon cancer cells, it has been demonstrated that the assessment of multiple biomarkers provides accurate prediction of drug response than a single biomarker[16–18]. Gene expression profiling has been applied effectively in classifying CRC molecular tumor subtypes and several studies have shown the feasibility of identifying genes involved in the progression and the prognosis of CRC[16,19]. However the mechanism of acquired resistance to irinotecan are not fully understood[20,21].
This study used microarray gene expression profile to identify biomarkers and pathways involved in the acquired resistance to irinotecan in CRC and we tested these biomarkers in the prediction of irinotecan resistance, overall survival and disease free survival in clinical data of patients with metastatic colon cancer.
Methods and materials
Microarray data
The Gene Expression Omnibus (GEO) database (http://www.ncbi.nlm.nih.gov/geo/) gene expression profile with accession number GSE42387 was downloaded. The data was sequenced on the platform of GPL16297 Agilent-014850 Whole Human Genome Microarray 4x44K G4112F (Agilent Systematic Name, collapsed probe, version). The GSE42387 dataset had 27 samples which included in triplicate three parental human colon cancer cell lines of HCT116, HT29 and LoVo and their acquired resistant subset generated after being exposed in vitro to gradually increasing concentrations of oxaliplatin or irinotecan for nine months. MTT colorimetric assays were used to determine the 50% inhibitory concentration (IC50) for oxaliplatin or irinotecan resistant and the parental cell lines with the sensitivity criteria of IC50 of <1 μM for Oxaliplatin and <1nM for irinotecan. Then the total RNA was extracted and converted into cDNA through reverse transcription and transcribed with T7 RNA Polymerase. Then, the labeled cRNA was hybridized to Agilent Human Gene Expression Microarrays and scanned using an Agilent DNA Microarray scanner. The quality of the RNA was assessed using a Bio analyzer 2100 and microarray data was processed in R (www.r-project.org) using the Bioconductor bioinformatics software package (http://www.bioconductor.org/) using the Limma package [22,23]and normalized between arrays using quantile normalization[24] and the expression values were log2 transformed.
Data preprocessing and DEGs screening
The GEO2R online analytical tool[25], which uses the R language in applying GEOquery and Limma packages was used to recalculate gene expressions. The HCT116 parental cell lines and their corresponding irinotecan resistant cell lines were selected to identify the differentially expressed genes (DEGs) between parental and resistant cell lines. The t-test method was utilized to calculate the p-values of genes. Then, Benjamin & Hochberg's method [26]was used to calculate the adjusted p-values (false discovery rate, FDR) the DEGs with the log2 fold change (FC) of > 1 or < - 1 and FDR <0.05 were selected.
Hierarchical clustering analysis
After extracting the expression values from the gene expression profile, a bidirectional hierarchical clustering heatmap was constructed using multiExperimental Viewer(MEV) v4.8 software[27].
Construction of PPI network
In the construction of the PPI networks, STRING version 10.0 (http://www.string-db.org/) [28]was used. This is a web biological database for prediction of known and unknown protein interaction relationships. A combined score of >0.7(High confidence) was selected as as the cut-off criterion. Then, the PPI pairs were inputted into Cytoscape software version 3.4.0 (http://www.cytoscape.org)[29] to construct the PPI network. The highly connected proteins (hub nodes) with important biological functions were identified by calculating the number of lines connecting the proteins (the degree) and how much nodes that are not directly connected by a certain node (betweenness value) of each node by CytoNCA app for cytoscape with the node degree cutoff criterion of ≥2[30].
Enrichment analysis of DEGs
The database for Annotation, Visualization and Integrated Discovery (DAVID, https://david.ncifcrf.gov) [31]was used to classify significant DEGs by their biological processes, molecular functions, or cellular components using Gene Ontology consortium reference(GO, http://www.geneontology.org/) [32]and the significant transcripts(Benjamini-Hochberg FDR <0.05) were identified using the David Functional Annotation clustering tool[31]. The DAVID database was also used to perform pathway enrichment analysis with reference from Kyoto Encyclopedia of Genes and Genomes (KEGG, http://www.genome.jp/kegg/) database website and Benjamini-Hochberg FDR <0.05 as a cut-off point[33,34].
Clinical validation of the DEGs
For clinical assessment of the DEGs identified to be associated with irinotecan resistance, survExpress[35], an online biomarker validation tool was used to perform survival analysis. The colon metabase including GSE12945, GSE14333, GSE17536, GSE17537, GSE31595 and GSE41258 with a total of 808 cases was chosen. The survival profiles were compared based on high or low mRNA expression of a particular gene and independently for overall survival and disease free survival in months. The hazard ratio(HR) with 95% confidence intervals(CI) and log rank P-value (<0.05 as significance value) were calculated and the results were downloaded and loaded in SPSS version 21 for plotting of Kaplan-Meier survival curves.
Confirmation of irinotecan resistant genes
To evaluate the candidate genes’ role in predicting irinotecan resistance, RNA expression profiles generated from TCGA-COAD RNA-sequence dataset (level 3.1.12.0) were used. The patients were divided into two groups: those who received irinotecan and had recurrent tumors within one-year treatment, were defined as irinotecan resistant. In contrast, the patients who did not develop tumor relapse after one-year of irinotecan treatment were classified as irinotecan sensitive (responders). There were nine irinotecan-resistant and five irinotecan- sensitive patients in the TCGA-COAD RNA sequence dataset. The gene expression level in this dataset was represented in log2-transformed RSEM format. The resistant genes were found by comparing the expression level of each target gene in the irinotecan-sensitive and resistant patients and the significance value was found by the Mann-Whitney U test method with <0.05 as significant.
Gene co-expression in colorectal cancer data
The cancer genome atlas (TCGA; https://cancergenome.nih.gov/) was used to find colo- rectal cancer data which contained gene expression profiles. Level 3 RNA-Seq data containing 635 colorectal cancer cases with gene expression profiles (463 colon adenocarcinoma cases and 172 rectal adenocarcinoma cases) was downloaded, Standard Pearson correlation coefficients (-1 to 1) of the desired gene pairs were calculated using SPSS version 21 software with significance level p-value of <0.05 was set as the cutoff criteria.
Results
DEGs in GEO2R
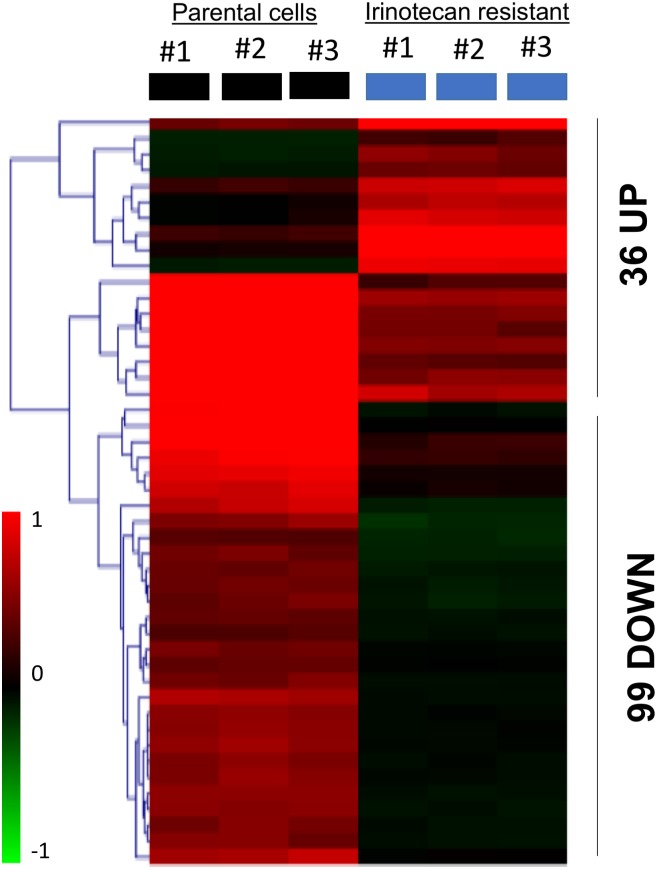
The data derived from the GPL16297 oligonucleotide microarray platform by using the GEOR2 tool consisted of 32,701 probe sets. Then 135 DEGs were identified to be related to irinotecan resistance after calculation of log2FC and FDR values, of which 36 were upregulated and 99 were downregulated, then gene expression values were extracted and a bidirectional hierarchical clustering heat map was plotted using the the MultiExperiment Viewer v4.8 software to present the DEGs (Fig 1, S1 and S2 Tables).
Fig 1. Heat map showing upregulated and downregulated differentially expressed genes (DEGs) in irinotecan-resistant colon cancer cells.
A bidirectional hierarchical clustering heat map Constructed using multiExperimental Viewer(MEV). The expression values are log2 fold changes (>1 or <−1, FDR <0.05)) between corresponding irinotecan-resistant HCT116 cell lines and parental HCT116 cell lines. Black represents no change in expression, green represents downregulation, and red represents upregulation.
PPI networks
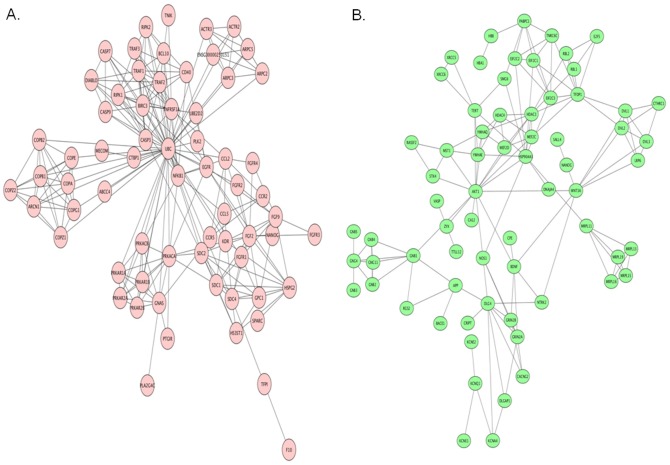
After mapping gene and protein interactions using STRING database to obtain the PPI pairs, the PPI pairs were imported into Cytoscape software. The upregulated DEGs network contained 83 nodes and 238 edges, 7 DEGs; PRKACB, GNAS, FGF2, FGF9, HS3ST1, PLA2G4C and MECOM had higher degrees and betweenness values (Fig 2A, Table 1). In the down regulated group which contained 147 nodes and 149 edges, 7 DEGs; BDNF, WNT3A, BMP6, HDAC4, DLG4, CAMK1 and CPE had higher degrees and betweenness values(Fig 2B, Table 2).
Fig 2. Protein–protein interaction (PPI) network of differentially expressed genes (A) upregulated genes and (B) downregulated genes.
The PPI pairs were imported into Cytoscape software as described in Methods and Materials. Pink nodes represent up regulated genes while green nodes represent down regulated genes. The lines represent interaction relationship between nodes.
Table 1. Up-regulated genes which had interactions in the protein–protein interaction (PPI) network.
| Gene symbol | Gene name | Degree | Betweenness |
|---|---|---|---|
| PRKACB | protein kinase, cAMP-dependent, catalytic, beta | 34.0 | 237.86037 |
| GNAS | GNAS complex locus | 28.0 | 56.964874 |
| FGF2 | fibroblast growth factor 2 (basic) | 28.0 | 289.1067 |
| FGF9 | fibroblast growth factor 9 (glia-activating factor) | 19.0 | 52.558647 |
| HS3ST1 | heparan sulfate (glucosamine) 3-O-sulfotransferase 1 | 7.0 | 0.0 |
| PLA2G4C | phospholipase A2, group IVC (cytosolic, calcium-independent) | 4.0 | 0.4871795 |
| MECOM | MDS1 And EVI1 Complex Locus | 2.0 | 0.0 |
Table 2. Down-regulated genes which had interactions in the protein–protein interaction (PPI) network.
| Gene symbol | Gene name | Degree | Betweenness |
|---|---|---|---|
| BDNF | brain-derived neurotrophic factor | 28.0 | 39.905716 |
| WNT3A | wingless-type MMTV integration site family, member 3A | 25.0 | 14.574099 |
| HDAC4 | histone deacetylase 4 | 16.0 | 6.1847615 |
| DLG4 | discs, large homolog 4 (Drosophila) | 15.0 | 4.1179338 |
| BMP6 | bone morphogenetic protein 6 | 13.0 | 3.048329 |
| CAMK1 | calcium/calmodulin-dependent protein kinase I | 8.0 | 0.79026806 |
| CPE | carboxypeptidase E | 4.0 | 0.2857143 |
GO analysis
DAVID online tool was used to classify the 135 DEGs according to their common GO functions of biological processes, molecular functions, or cellular components. We included 1454 GO gene sets in the reference database, of which 37 were significantly enriched (with p < 0.05) and had an FDR of <0.05. The most significant gene set was signal transduction (GO:0007165) (FDR = 6.9E-1, p = 1.3E-3) which contained 18 genes. The top 10 GOs are summarised in the Table 3.
Table 3. The top ten enriched gene ontologies (GOs).
| GO term | Count | FDR | P-value |
|---|---|---|---|
| Signal transduction(GO:0007165) | 18 | 6.9E-1 | 1.3E-3 |
| cellular response to glucagon stimulus(GO:0071377) | 4 | 6.4E-1 | 2.2E-3 |
| positive regulation of osteoblast differentiation (GO:0045669) | 4 | 8.8E-1 | 7.0E-3 |
| positive regulation of protein binding (GO:0032092) | 4 | 8.1E-1 | 7.3E-3 |
| axon guidance(GO:0007411) | 5 | 9.8E-1 | 2.0E-2 |
| Inner ear development(GO:0048839) | 3 | 9.9E-1 | 2.9E-2 |
| bone development(GO:0060348) | 3 | 9.8E-1 | 3.0E-2 |
| heart development(GO:0007507) | 5 | 9.7E-1 | 3.1E-2 |
| Phosphatidylinositol-3-phosphate biosynthetic process(GO:0036092) | 3 | 9.9E-1 | 4.0E-2 |
| positive regulation of canonical Wnt signaling pathway(GO:0090263) | 4 | 9.8E-1 | 4.3E-2 |
GO, Gene ontology; FDR, False discovery rate
KEGG pathway analysis
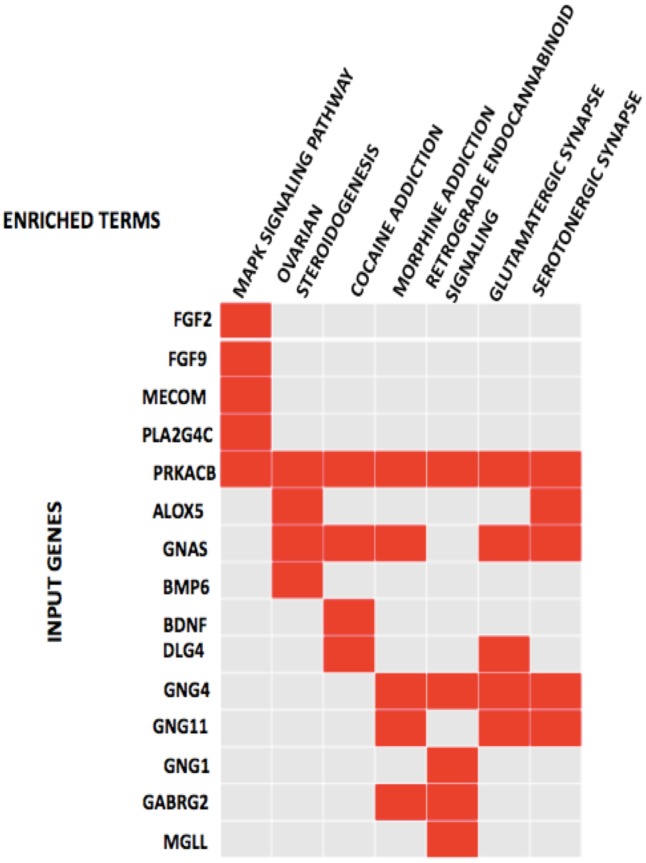
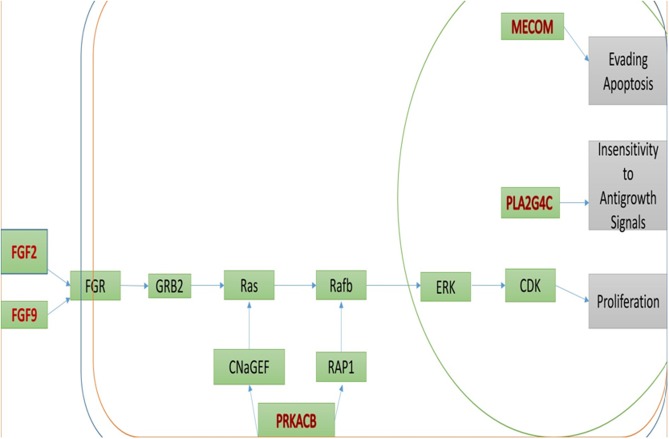
DAVID online tool was also used to classify the 135 DEGs using the KEGG pathway reference. The KEGG pathway analysis indicated that 7 pathways reached the statistical significance (p-value <0.05, FDR <0.05) including the MAPK signaling pathway, ovarian steroidogenesis, cocaine addiction, morphine addiction, retrograde endocannabinoid signaling, glutamatergic synapse and serotonergic synapse (Fig 3 and Table 4). Next the MAPK signaling pathway ID of hsa04010 was used to locate the position of the enriched genes in the pathway using DAVID online tool, the pathway was summarized and presented in Fig 4.
Fig 3. Significant KEGG pathways and the genes involved.
Gene enrichment analysis of the DEGs involved in irinotecan resistance showing KEGG pathways significantly enriched in irinotecan resistant cell lines and the genes involved in the pathways (the pathways in order of their enrichment from left to right) (FDR <0.05 p-value of <0.05).
Table 4. Enriched KEGG pathways.
| KEGG pathway | Count | FDR | P-value |
|---|---|---|---|
| MAPK signaling pathway (hsa04010) | 5 | 0.0025 | 0.0001 |
| ovarian steroidogenesis (hsa04913) | 4 | 0.0149 | 0.0003 |
| cocaine addiction (hsa05030) | 4 | 0.0149 | 0.0003 |
| morphine addiction (hsa05032) | 5 | 0.0149 | 0.0004 |
| retrograde endocannabinoid signaling (hsa04723) | 5 | 0.0181 | 0.0006 |
| glutamatergic synapse (hsa04724) | 5 | 0.0208 | 0.0010 |
| serotonergic synapse (hsa04726) | 5 | 0.0208 | 0.0009 |
KEGG, Kyoto Encyclopedia of Genes and Genomes; FDR, False discovery rate
Fig 4. Simplified MAPK pathway showing the location of the significant genes in the pathway.
The DAVID online tool was used to download the pathway and show the position of the DEGs in the pathway using the pathway ID of hsa04010. Input genes are in red. And the final effect of the pathway is represented in gray.
Common genes between PPI networks, GOs and pathway analysis
Nine genes (GNAS, PRKACB, MECOM, PLA2G4C, BMP6, BDNF, DLG4, FGF2 and FGF9) were observed to be commonly enriched after the analysis of the PPI networks, GOs and pathways. GNAS, PRKACB, MECOM, PLA2G4C, FGF2 and FGF9 were up-regulated and BMP6, BDNF, DLG4 were down-regulated. To further compare with both the signal transduction and the MAPK pathway, we found that five genes were significantly enriched including PRKACB, MECOM, PLA2G4C, FGF2 and FGF(Tables 3 and 4). It was also observed that all these genes were upregulated (Fig 3).
Genes which correlate to colorectal cancer patient survival
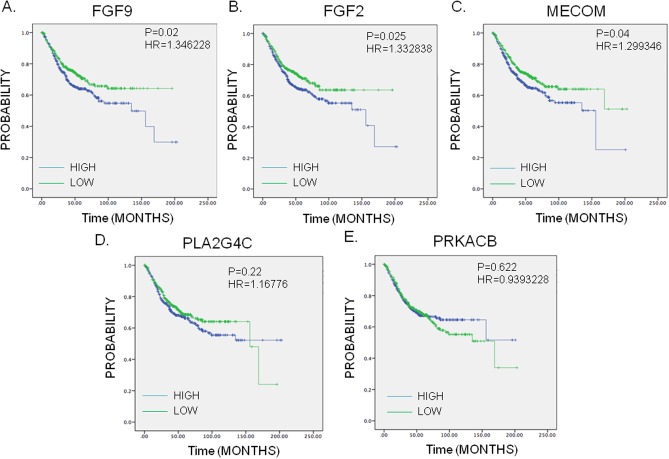
To further check the role of PRKACB, MECOM, PLA2G4C, FGF2 and FGF in colorectal cancer, we further analyzed the genes involved in the MAPK pathway for their association with patient’s survival using the survExpress online tool. As shown in Fig 5, three genes; MECOM, FGF2 and FGF9 were associated with survival with high expression of the genes correlating with poor survival (Fig 5A–5C) while PLA2G4C and PRKACB did not predict survival (Fig 5C and 5D). The combination of 5 genes showed the highly association with patients’ outcome (S1 Fig). In addition, we also analyzed the correlation of those five genes with disease free survival. We found highly FGF9 expression was associated with poor disease free survival with all the other 4 genes not significant (S2A–S2E Fig).
Fig 5. Kaplan-Meier survival curves presenting the prognostic relationship between high and low expression of specific genes involved in irinotecan resistance to overall survival (A) MECOM, (B) FGF2, (C) FGF9, (D) PLA2G4C and (E) PRKACB.
The survival curves were plotted using the survExpress online tool. The specific DEGs expression levels were dichotomized by median value and the results presented visually by Kaplan-Meier survival plots. P-values were calculated using log-rank statistics. Patient number = 808, HR = Hazard Ratio, P = Logrank P-value.
Mechanism of gene correlation in tumor tissues
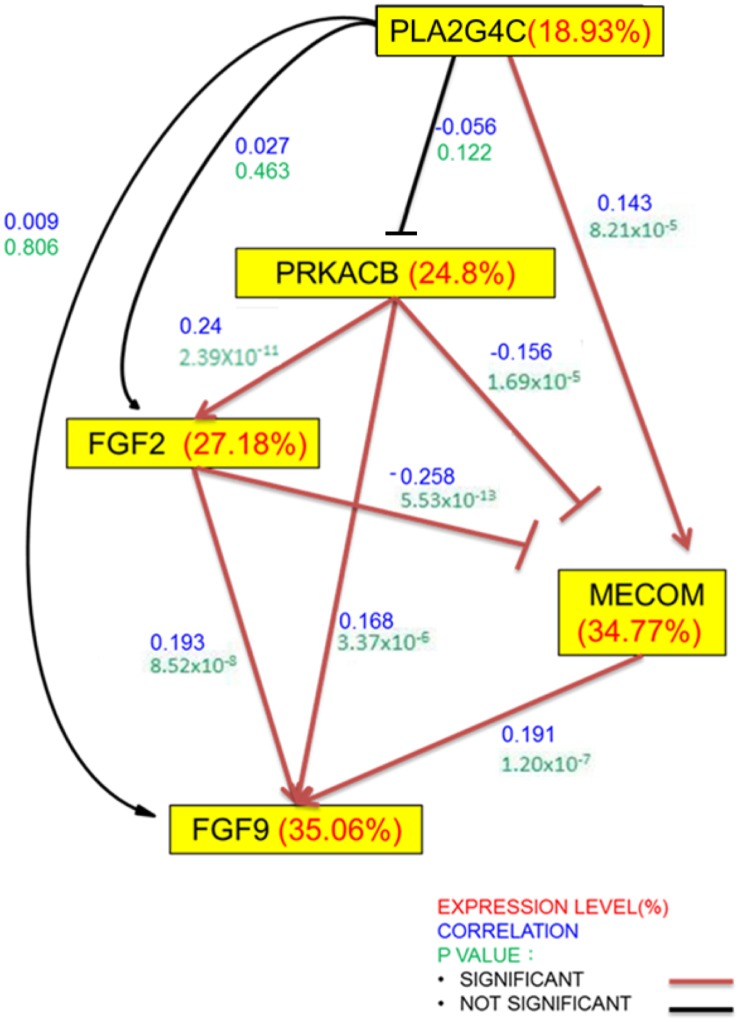
To understand the mechanism of gene-gene correlation expression of PRKACB, MECOM, PLA2G4C, FGF2 and FGF, the pooled microarray datasets downloaded from NCBI were used to identify the relationship of these candidate genes. As shown in Fig 6, we found that FGF2, FGF9 and PRKACB were positively correlated with each other. MECOM correlated positively with FGF9 and PLA2G4C, but correlated negatively with FGF2 and PRKACB (Fig 6)
Fig 6. Gene expression correlation of the genes involved in the MAPK pathway in the CRC tumor samples from the TCGA data base.
The pooled microarray datasets downloaded from NCBI were used to identify the relationship of these candidate genes. The genes in the upstream of the network were assumed to be less variant, so coefficient of variation (CV) of each gene (presented in percent) was calculated to determine its site in the regulatory network. Besides, Spearman’s rank correlation coefficients (-1 to 1) of the desired gene pairs decide whether they were negative/positive control with significance level p<0.05. Number of patients = 653. The red lines or arrows represent significant correlation (P-value <0.05). Coefficient of variation in red, correlation coefficient in blue and P-value in green.
Genes which correlated to irinotecan resistance colorectal cancer patients
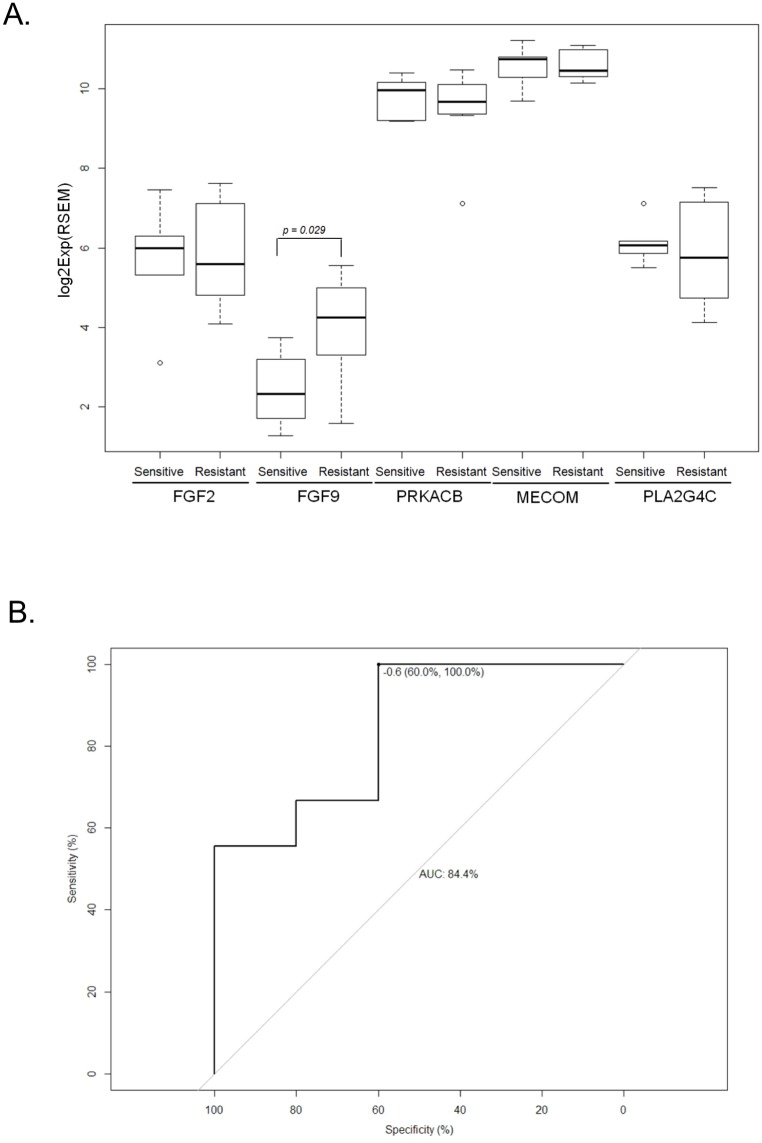
The data generated from TCGA-COAD RNA-sequence dataset comprising 14 irinotecan treated patients of which nine were resistant and five were responders, was used. To evaluate the roles of the candidate genes in irinotecan resistance, box plots were plotted comparing gene expression between the sensitive and the resistant group. It was found that only FGF9 was significantly elevated in irinotecan-resistant patients as compared to irinotecan sensitive patients (p = 0.029, Mann-Whitney U test). The other genes had no significant difference between the irinotecan-sensitive and resistant groups (Fig 7A).
Fig 7.
(A)Box plots presenting the gene expression status between irinotecan sensitive and irinotecan resistant patients of the five candidate genes (MECOM, FGF2, FGF9, PLA2G4C and PRKACB). (B) The receiver operating characteristic (ROC) curve showing area under ROC curve (AUC) and the threshold of score between FGF9 and PLA2G4C. The regression model was also estimated based on the two genes and the score was calculated representing irinotecan resistance. TCGA-COAD RNA-sequence dataset (level 3.1.12.0) was used. The patients were divided into sensitive and resistant. The significance value was found by the Mann-Whitney U test method (P <0.05 as significant). Number of patients = 14.
To further evaluate the explanation power of each candidate gene, logistic regression was run and the significance was tested. The results showed that only FGF9 and PLA2C4G significantly contributed to irinotecan resistance. The regression model was estimated based on the two genes and the score was calculated representing irinotecan resistance. This model was followed by receiver operating characteristic (ROC) analysis[36]. Its area under the ROC curve (AUC) was found to be 84.4%. The threshold of score, calculated by Youden’s method, was found to be -0.6 with 100% sensitivity and 60% specificity (Fig 7B).
Discussion
CRC remains a significant cause of morbidity and mortality worldwide with high disease incidence and significant numbers of patients presenting with advanced, metastatic disease[37]. Despite advances in medical and surgical therapy, the 5-year overall survival rate is still is low at 60% to 65% [10]. The development of resistance to irinotecan treatment is still the major challenge in managing CRC [38]. The mechanisms leading to development of irinotecan-resistance are poorly characterized. The understanding of the etiological factors and mechanisms of irinotecan-resistance will help to improve the therapeutic efficacy of CRC patients.
In the present study, we demonstrated that FGF9, FGF2, MECOM, PRKACB and PLA2G4C are the new candidate genes for irinotecan resistance. To further check the correlation between those five genes with overall survival or disease free survival rate, FGF9, FGF2 and MECOM were associated with survival rate and only FGF9 was associated with disease free survival (Fig 5, S2 Fig). The possible explanation for the inconsistency may be that this analysis is based on the general CRC patients who were not specifically receiving irinotecan therapy. This may be needed to be verified by specific irinotecan treatment cohort.
Our finding has revealed that FGF9 is positively correlated with FGF2, PRKACB and MECOM therefore placing it at a central role (Fig 6). All these genes have been correlated to resistance status in different cancers [39–44], though the role of those genes in irinotecan resistance is still unclear. In addition, FGF9 is also the only gene that predicted irinotecan resistance and disease free survival making it an important gene in that, the targeting of FGF9 might affect the expression levels and prognostic and therapeutic effects of FGF2, PRKACB and MECOM. The effects of FGF9 were also observed with its interaction with PLA2G4C in the irinotecan resistant cohort (Fig 7B). Thus FGF9 was found to play a crucial role as it was involved in all the stages in this study and was also observed to interact with all other genes.
FGFs interact with FGF receptors for signal transduction which regulates cell growth and differentiation and have also been implicated in tumorigenesis and induction of drug resistance in cancer cells [45–47]. The targeting of either FGF2/FG2R or FGF9 has been shown to increase the sensitivity of chemotherapy [39,48–52]. Those studies also support our finding that the upregulation of FGF2 and FGF9 appears to reduce the response to irinotecan.
Besides FGFs, we also found that MECOM is related to irinotecan resistance in CRC and also has a prognostic role. MECOM is a nuclear zinc finger transcription factor [53] involved in the cell cycle, proliferation, and differentiation and is said to suppress the JNK1-mediated phosphoration of c-Jun thereby exhibiting antiapoptotic effects[54]. MECOM is a transcription factor with no clear downstream targets and with no transcription profile been reported before, therefore more in-depth research on the relationship of FGF9 and MECOM biological functions could lead to the discovery of potential irinotecan targets, which can hasten a new chemical drug therapy for metastatic CRC which will improve the survival time and life quality of CRC patients therefore increasing the significance of FGF9 and MECOM in irinotecan treatment in CRC.
The other two identified biomarkers play a role either in resistance or in prognosis in cancer. PRKACB may involve in type 1 cAMP-dependent protein kinase a-related pathway which modulates breast, pancreatic, colon and ovarian cancers to be resistant to different cytotoxic agents [55–57]. PLA2G4C plays the prognostic role in breast and colon cancer [44,58].
MAPK signal transduction pathway restrains the efficacy of irinotecan in CRC. The modifications in the MAPK signal transduction pathway increase resistance to irinotecan with the upregulation of growth factors responsible for tumor growth CRC[59]. The MAPK p38 which is required for cell proliferation and survival, is also said to be activated in irinotecan resistant HCT116 CRC cells[60–62]. The pharmacological inhibition of MAPK p38 may overcome irinotecan resistance both in vitro and in vivo by mediating cell cycle arrest and autophagy-mediated cell death[60–62].
The findings provide important new target genes which could predict irinotecan treatment response and the emergence of resistance. This approach can also predict patient prognosis however further studies need to be conducted to validate these findings and determine whether they can be applied in a clinical setting.
Conclusion
In conclusion, targeting the MAPK signal transduction pathway through the targeting of FGF9, FGF2, MECOM, PRKACB and PLA2G4C might increase tumor responsiveness to irinotecan and improve patient survival thus being therapeutically and prognostic significant in CRC patients.
Supporting information
The survival curves were plotted using the survExpress online tool. The target genes’ expression levels were dichotomized by median value and the results presented visually by Kaplan-Meier survival plots. P-values were calculated using log-rank statistics. Patient number = 808, HR = Hazard Ratio, P = Logrank P-value.
(TIF)
The survival curves were plotted using the survExpress online tool. The genes’ expression levels were dichotomized by median value and the results presented visually by Kaplan-Meier survival plots. P-values were calculated using log-rank statistics. Patient number = 808, HR = Hazard Ratio, P = Logrank P-value.
(TIF)
(DOCX)
(DOCX)
Acknowledgments
We thank the help from Dr.Ji-Dung Luo and Lee, P-Y for the data analysis and revised figure preparation.
Data Availability
All relevant data are within the paper and its Supporting Information files.
Funding Statement
The author(s) received no specific funding for this work.
References
- 1.Siegel RL, Miller KD, Jemal A (2015) Cancer statistics, 2015. CA Cancer J Clin 65: 5–29. doi: 10.3322/caac.21254 [DOI] [PubMed] [Google Scholar]
- 2.Nordlinger B, Van Cutsem E, Gruenberger T, Glimelius B, Poston G, et al. (2009) Combination of surgery and chemotherapy and the role of targeted agents in the treatment of patients with colorectal liver metastases: recommendations from an expert panel. Ann Oncol 20: 985–992. doi: 10.1093/annonc/mdn735 [DOI] [PubMed] [Google Scholar]
- 3.Ruers T, Bleichrodt RP (2002) Treatment of liver metastases, an update on the possibilities and results. Eur J Cancer 38: 1023–1033. [DOI] [PubMed] [Google Scholar]
- 4.Gallagher DJ, Kemeny N (2010) Metastatic colorectal cancer: from improved survival to potential cure. Oncology 78: 237–248. doi: 10.1159/000315730 [DOI] [PubMed] [Google Scholar]
- 5.Van Cutsem E, Nordlinger B, Cervantes A (2010) Advanced colorectal cancer: ESMO Clinical Practice Guidelines for treatment. Ann Oncol 21 Suppl 5: v93–97. [DOI] [PubMed] [Google Scholar]
- 6.Macedo LT, da Costa Lima AB, Sasse AD (2012) Addition of bevacizumab to first-line chemotherapy in advanced colorectal cancer: a systematic review and meta-analysis, with emphasis on chemotherapy subgroups. BMC Cancer 12: 89 doi: 10.1186/1471-2407-12-89 [DOI] [PMC free article] [PubMed] [Google Scholar]
- 7.Van Cutsem E, Tabernero J, Lakomy R, Prenen H, Prausova J, et al. (2012) Addition of aflibercept to fluorouracil, leucovorin, and irinotecan improves survival in a phase III randomized trial in patients with metastatic colorectal cancer previously treated with an oxaliplatin-based regimen. J Clin Oncol 30: 3499–3506. doi: 10.1200/JCO.2012.42.8201 [DOI] [PubMed] [Google Scholar]
- 8.Venook AP, Weiser MR, Tepper JE (2014) Colorectal cancer: all hands on deck. Am Soc Clin Oncol Educ Book: 83–89. doi: 10.14694/EdBook_AM.2014.34.83 [DOI] [PubMed] [Google Scholar]
- 9.Des Guetz G, Uzzan B, Morere JF, Perret G, Nicolas P (2010) Duration of adjuvant chemotherapy for patients with non-metastatic colorectal cancer. Cochrane Database Syst Rev: Cd007046 doi: 10.1002/14651858.CD007046.pub2 [DOI] [PMC free article] [PubMed] [Google Scholar]
- 10.Grothey A, Sargent D, Goldberg RM, Schmoll HJ (2004) Survival of patients with advanced colorectal cancer improves with the availability of fluorouracil-leucovorin, irinotecan, and oxaliplatin in the course of treatment. J Clin Oncol 22: 1209–1214. doi: 10.1200/JCO.2004.11.037 [DOI] [PubMed] [Google Scholar]
- 11.Reimers MS, Zeestraten EC, Kuppen PJ, Liefers GJ, van de Velde CJ (2013) Biomarkers in precision therapy in colorectal cancer. Gastroenterol Rep (Oxf) 1: 166–183. [DOI] [PMC free article] [PubMed] [Google Scholar]
- 12.Lurje G, Manegold PC, Ning Y, Pohl A, Zhang W, et al. (2009) Thymidylate synthase gene variations: predictive and prognostic markers. Mol Cancer Ther 8: 1000–1007. doi: 10.1158/1535-7163.MCT-08-0219 [DOI] [PubMed] [Google Scholar]
- 13.Afzal S, Gusella M, Jensen SA, Vainer B, Vogel U, et al. (2011) The association of polymorphisms in 5-fluorouracil metabolism genes with outcome in adjuvant treatment of colorectal cancer. Pharmacogenomics 12: 1257–1267. doi: 10.2217/pgs.11.83 [DOI] [PubMed] [Google Scholar]
- 14.Ciaparrone M, Quirino M, Schinzari G, Zannoni G, Corsi DC, et al. (2006) Predictive role of thymidylate synthase, dihydropyrimidine dehydrogenase and thymidine phosphorylase expression in colorectal cancer patients receiving adjuvant 5-fluorouracil. Oncology 70: 366–377. doi: 10.1159/000098110 [DOI] [PubMed] [Google Scholar]
- 15.Jensen NF, Smith DH, Nygard SB, Romer MU, Nielsen KV, et al. (2012) Predictive biomarkers with potential of converting conventional chemotherapy to targeted therapy in patients with metastatic colorectal cancer. Scand J Gastroenterol 47: 340–355. doi: 10.3109/00365521.2012.640835 [DOI] [PubMed] [Google Scholar]
- 16.Ross JS, Torres-Mora J, Wagle N, Jennings TA, Jones DM (2010) Biomarker-based prediction of response to therapy for colorectal cancer: current perspective. Am J Clin Pathol 134: 478–490. doi: 10.1309/AJCP2Y8KTDPOAORH [DOI] [PubMed] [Google Scholar]
- 17.Zlobec I (2013) Novel biomarkers for the prediction of metastasis in colorectal cancer. Expert Opin Med Diagn 7: 137–146. doi: 10.1517/17530059.2013.753054 [DOI] [PubMed] [Google Scholar]
- 18.Maurel J, Postigo A (2015) Prognostic and Predictive Biomarkers in Colorectal Cancer. From the Preclinical Setting to Clinical Practice. Curr Cancer Drug Targets 15: 703–715. [DOI] [PubMed] [Google Scholar]
- 19.Perea J, Lomas M, Hidalgo M (2011) Molecular basis of colorrectal cancer: towards an individualized management? Rev Esp Enferm Dig 103: 29–35. [DOI] [PubMed] [Google Scholar]
- 20.Asghar U, Hawkes E, Cunningham D (2010) Predictive and prognostic biomarkers for targeted therapy in metastatic colorectal cancer. Clin Colorectal Cancer 9: 274–281. doi: 10.3816/CCC.2010.n.040 [DOI] [PubMed] [Google Scholar]
- 21.Jensen NF, Stenvang J, Beck MK, Hanakova B, Belling KC, et al. (2015) Establishment and characterization of models of chemotherapy resistance in colorectal cancer: Towards a predictive signature of chemoresistance. Mol Oncol 9: 1169–1185. doi: 10.1016/j.molonc.2015.02.008 [DOI] [PMC free article] [PubMed] [Google Scholar]
- 22.Ritchie ME, Phipson B, Wu D, Hu Y, Law CW, et al. (2015) limma powers differential expression analyses for RNA-sequencing and microarray studies. Nucleic Acids Res 43: e47 doi: 10.1093/nar/gkv007 [DOI] [PMC free article] [PubMed] [Google Scholar]
- 23.Smyth GK, Michaud J, Scott HS (2005) Use of within-array replicate spots for assessing differential expression in microarray experiments. Bioinformatics 21: 2067–2075. doi: 10.1093/bioinformatics/bti270 [DOI] [PubMed] [Google Scholar]
- 24.Bolstad BM, Irizarry RA, Astrand M, Speed TP (2003) A comparison of normalization methods for high density oligonucleotide array data based on variance and bias. Bioinformatics 19: 185–193. [DOI] [PubMed] [Google Scholar]
- 25.Barrett T, Wilhite SE, Ledoux P, Evangelista C, Kim IF, et al. (2013) NCBI GEO: archive for functional genomics data sets—update. Nucleic Acids Res 41: D991–995. doi: 10.1093/nar/gks1193 [DOI] [PMC free article] [PubMed] [Google Scholar]
- 26.Klipper-Aurbach Y, Wasserman M, Braunspiegel-Weintrob N, Borstein D, Peleg S, et al. (1995) Mathematical formulae for the prediction of the residual beta cell function during the first two years of disease in children and adolescents with insulin-dependent diabetes mellitus. Med Hypotheses 45: 486–490. [DOI] [PubMed] [Google Scholar]
- 27.Saeed AI, Bhagabati NK, Braisted JC, Liang W, Sharov V, et al. (2006) TM4 microarray software suite. Methods Enzymol 411: 134–193. doi: 10.1016/S0076-6879(06)11009-5 [DOI] [PubMed] [Google Scholar]
- 28.Szklarczyk D, Franceschini A, Wyder S, Forslund K, Heller D, et al. (2015) STRING v10: protein-protein interaction networks, integrated over the tree of life. Nucleic Acids Res 43: D447–452. doi: 10.1093/nar/gku1003 [DOI] [PMC free article] [PubMed] [Google Scholar]
- 29.Shannon P, Markiel A, Ozier O, Baliga NS, Wang JT, et al. (2003) Cytoscape: a software environment for integrated models of biomolecular interaction networks. Genome Res 13: 2498–2504. doi: 10.1101/gr.1239303 [DOI] [PMC free article] [PubMed] [Google Scholar]
- 30.Tang Y, Li M, Wang J, Pan Y, Wu FX (2015) CytoNCA: a cytoscape plugin for centrality analysis and evaluation of protein interaction networks. Biosystems 127: 67–72. doi: 10.1016/j.biosystems.2014.11.005 [DOI] [PubMed] [Google Scholar]
- 31.Huang da W, Sherman BT, Lempicki RA (2009) Systematic and integrative analysis of large gene lists using DAVID bioinformatics resources. Nat Protoc 4: 44–57. doi: 10.1038/nprot.2008.211 [DOI] [PubMed] [Google Scholar]
- 32.Ashburner M, Ball CA, Blake JA, Botstein D, Butler H, et al. (2000) Gene ontology: tool for the unification of biology. The Gene Ontology Consortium. Nat Genet 25: 25–29. doi: 10.1038/75556 [DOI] [PMC free article] [PubMed] [Google Scholar]
- 33.Kanehisa M, Sato Y, Kawashima M, Furumichi M, Tanabe M (2016) KEGG as a reference resource for gene and protein annotation. Nucleic Acids Res 44: D457–462. doi: 10.1093/nar/gkv1070 [DOI] [PMC free article] [PubMed] [Google Scholar]
- 34.Kanehisa M, Goto S (2000) KEGG: kyoto encyclopedia of genes and genomes. Nucleic Acids Res 28: 27–30. [DOI] [PMC free article] [PubMed] [Google Scholar]
- 35.Aguirre-Gamboa R, Gomez-Rueda H, Martinez-Ledesma E, Martinez-Torteya A, Chacolla-Huaringa R, et al. (2013) SurvExpress: an online biomarker validation tool and database for cancer gene expression data using survival analysis. PLoS One 8: e74250 doi: 10.1371/journal.pone.0074250 [DOI] [PMC free article] [PubMed] [Google Scholar]
- 36.Metz CE (1978) Basic principles of ROC analysis. Semin Nucl Med 8: 283–298. [DOI] [PubMed] [Google Scholar]
- 37.Siegel R, Desantis C, Jemal A (2014) Colorectal cancer statistics, 2014. CA Cancer J Clin 64: 104–117. doi: 10.3322/caac.21220 [DOI] [PubMed] [Google Scholar]
- 38.Gongora C, Vezzio-Vie N, Tuduri S, Denis V, Causse A, et al. (2011) New Topoisomerase I mutations are associated with resistance to camptothecin. Mol Cancer 10: 64 doi: 10.1186/1476-4598-10-64 [DOI] [PMC free article] [PubMed] [Google Scholar]
- 39.Mizukami T, Togashi Y, Naruki S, Banno E, Terashima M, et al. (2016) Significance of FGF9 gene in resistance to anti-EGFR therapies targeting colorectal cancer: A subset of colorectal cancer patients with FGF9 upregulation may be resistant to anti-EGFR therapies. Mol Carcinog. [DOI] [PubMed] [Google Scholar]
- 40.Dutta P, Bui T, Bauckman KA, Keyomarsi K, Mills GB, et al. (2013) EVI1 splice variants modulate functional responses in ovarian cancer cells. Mol Oncol 7: 647–668. doi: 10.1016/j.molonc.2013.02.008 [DOI] [PMC free article] [PubMed] [Google Scholar]
- 41.Lavallee VP, Gendron P, Lemieux S, D'Angelo G, Hebert J, et al. (2015) EVI1-rearranged acute myeloid leukemias are characterized by distinct molecular alterations. Blood 125: 140–143. doi: 10.1182/blood-2014-07-591529 [DOI] [PMC free article] [PubMed] [Google Scholar]
- 42.Hou A, Zhao L, Zhao F, Wang W, Niu J, et al. (2016) Expression of MECOM is associated with unfavorable prognosis in glioblastoma multiforme. Onco Targets Ther 9: 315–320. doi: 10.2147/OTT.S95831 [DOI] [PMC free article] [PubMed] [Google Scholar]
- 43.Bordonaro M, Tewari S, Cicco CE, Atamna W, Lazarova DL (2011) A switch from canonical to noncanonical Wnt signaling mediates drug resistance in colon cancer cells. PLoS One 6: e27308 doi: 10.1371/journal.pone.0027308 [DOI] [PMC free article] [PubMed] [Google Scholar]
- 44.Olsen RS, Andersson RE, Zar N, Lofgren S, Wagsater D, et al. (2016) Prognostic significance of PLA2G4C gene polymorphism in patients with stage II colorectal cancer. Acta Oncol 55: 474–479. doi: 10.3109/0284186X.2015.1073350 [DOI] [PubMed] [Google Scholar]
- 45.Jang JH, Shin KH, Park JG (2001) Mutations in fibroblast growth factor receptor 2 and fibroblast growth factor receptor 3 genes associated with human gastric and colorectal cancers. Cancer Res 61: 3541–3543. [PubMed] [Google Scholar]
- 46.Levina V, Su Y, Nolen B, Liu X, Gordin Y, et al. (2008) Chemotherapeutic drugs and human tumor cells cytokine network. Int J Cancer 123: 2031–2040. doi: 10.1002/ijc.23732 [DOI] [PMC free article] [PubMed] [Google Scholar]
- 47.Dailey L, Ambrosetti D, Mansukhani A, Basilico C (2005) Mechanisms underlying differential responses to FGF signaling. Cytokine Growth Factor Rev 16: 233–247. doi: 10.1016/j.cytogfr.2005.01.007 [DOI] [PubMed] [Google Scholar]
- 48.Dorman SN, Baranova K, Knoll JH, Urquhart BL, Mariani G, et al. (2016) Genomic signatures for paclitaxel and gemcitabine resistance in breast cancer derived by machine learning. Mol Oncol 10: 85–100. doi: 10.1016/j.molonc.2015.07.006 [DOI] [PMC free article] [PubMed] [Google Scholar]
- 49.Pardo OE, Wellbrock C, Khanzada UK, Aubert M, Arozarena I, et al. (2006) FGF-2 protects small cell lung cancer cells from apoptosis through a complex involving PKCepsilon, B-Raf and S6K2. Embo j 25: 3078–3088. doi: 10.1038/sj.emboj.7601198 [DOI] [PMC free article] [PubMed] [Google Scholar]
- 50.Wu X, Yan Q, Huang Y, Huang H, Su Z, et al. (2010) Isolation of a novel basic FGF-binding peptide with potent antiangiogenetic activity. J Cell Mol Med 14: 351–356. doi: 10.1111/j.1582-4934.2008.00506.x [DOI] [PMC free article] [PubMed] [Google Scholar]
- 51.Qiu H, Yashiro M, Zhang X, Miwa A, Hirakawa K (2011) A FGFR2 inhibitor, Ki23057, enhances the chemosensitivity of drug-resistant gastric cancer cells. Cancer Lett 307: 47–52. doi: 10.1016/j.canlet.2011.03.015 [DOI] [PubMed] [Google Scholar]
- 52.Wang C, Lin S, Nie Y, Jia X, Wang J, et al. (2010) Mechanism of antitumor effect of a novel bFGF binding peptide on human colon cancer cells. Cancer Sci 101: 1212–1218. doi: 10.1111/j.1349-7006.2010.01501.x [DOI] [PMC free article] [PubMed] [Google Scholar]
- 53.Yatsula B, Lin S, Read AJ, Poholek A, Yates K, et al. (2005) Identification of binding sites of EVI1 in mammalian cells. J Biol Chem 280: 30712–30722. doi: 10.1074/jbc.M504293200 [DOI] [PubMed] [Google Scholar]
- 54.Kurokawa M, Mitani K, Yamagata T, Takahashi T, Izutsu K, et al. (2000) The evi-1 oncoprotein inhibits c-Jun N-terminal kinase and prevents stress-induced cell death. Embo j 19: 2958–2968. doi: 10.1093/emboj/19.12.2958 [DOI] [PMC free article] [PubMed] [Google Scholar]
- 55.Zwart W, Griekspoor A, Berno V, Lakeman K, Jalink K, et al. (2007) PKA-induced resistance to tamoxifen is associated with an altered orientation of ERalpha towards co-activator SRC-1. Embo j 26: 3534–3544. doi: 10.1038/sj.emboj.7601791 [DOI] [PMC free article] [PubMed] [Google Scholar]
- 56.Peng C, Zhang X, Yu H, Wu D, Zheng J (2011) Wnt5a as a predictor in poor clinical outcome of patients and a mediator in chemoresistance of ovarian cancer. Int J Gynecol Cancer 21: 280–288. doi: 10.1097/IGC.0b013e31820aaadb [DOI] [PubMed] [Google Scholar]
- 57.Nesterova MV, Johnson NR, Stewart T, Abrams S, Cho-Chung YS (2005) CpG immunomer DNA enhances antisense protein kinase A RIalpha inhibition of multidrug-resistant colon carcinoma growth in nude mice: molecular basis for combinatorial therapy. Clin Cancer Res 11: 5950–5955. doi: 10.1158/1078-0432.CCR-05-0624 [DOI] [PubMed] [Google Scholar]
- 58.Nanashima N, Yamada T, Shimizu T, Tsuchida S (2015) Deletion of phospholipase A2 group IVc induces apoptosis in rat mammary tumour cells by the nuclear factor-kappaB/lipocalin 2 pathway. Biochem J 469: 315–324. doi: 10.1042/BJ20150064 [DOI] [PubMed] [Google Scholar]
- 59.Thomaidis T, Maderer A, Formentini A, Bauer S, Trautmann M, et al. (2014) Proteins of the VEGFR and EGFR pathway as predictive markers for adjuvant treatment in patients with stage II/III colorectal cancer: results of the FOGT-4 trial. J Exp Clin Cancer Res 33: 83 doi: 10.1186/s13046-014-0083-8 [DOI] [PMC free article] [PubMed] [Google Scholar]
- 60.Paillas S, Causse A, Marzi L, de Medina P, Poirot M, et al. (2012) MAPK14/p38alpha confers irinotecan resistance to TP53-defective cells by inducing survival autophagy. Autophagy 8: 1098–1112. doi: 10.4161/auto.20268 [DOI] [PMC free article] [PubMed] [Google Scholar]
- 61.Paillas S, Boissiere F, Bibeau F, Denouel A, Mollevi C, et al. (2011) Targeting the p38 MAPK pathway inhibits irinotecan resistance in colon adenocarcinoma. Cancer Res 71: 1041–1049. doi: 10.1158/0008-5472.CAN-10-2726 [DOI] [PMC free article] [PubMed] [Google Scholar]
- 62.Rudolf E, Kralova V, Rudolf K, John S (2013) The role of p38 in irinotecan-induced DNA damage and apoptosis of colon cancer cells. Mutat Res 741–742: 27–34. doi: 10.1016/j.mrfmmm.2013.02.002 [DOI] [PubMed] [Google Scholar]
Associated Data
This section collects any data citations, data availability statements, or supplementary materials included in this article.
Supplementary Materials
The survival curves were plotted using the survExpress online tool. The target genes’ expression levels were dichotomized by median value and the results presented visually by Kaplan-Meier survival plots. P-values were calculated using log-rank statistics. Patient number = 808, HR = Hazard Ratio, P = Logrank P-value.
(TIF)
The survival curves were plotted using the survExpress online tool. The genes’ expression levels were dichotomized by median value and the results presented visually by Kaplan-Meier survival plots. P-values were calculated using log-rank statistics. Patient number = 808, HR = Hazard Ratio, P = Logrank P-value.
(TIF)
(DOCX)
(DOCX)
Data Availability Statement
All relevant data are within the paper and its Supporting Information files.


