Abstract
Focal adhesion kinase (FAK) is a cytoplasmic non-receptor tyrosine kinase essential for a diverse set of cellular functions. Current methods for monitoring FAK activity in response to extracellular stimulus lack spatiotemporal resolution and/or the ability to perform multiplex detection. Here we report on a novel approach to monitor real-time kinase phosphorylation activity of FAK in live single cells by fluorescence lifetime imaging.
Graphical abstract

An increasing body of evidence1–3 reveals that cells are very sensitive to extracellular mechanical cues. Mechanical signaling within a tissue is crucial for tensional homeostasis between and within cells, modulating a repertoire of cellular processes, such as differentiation4, development5, and survival6. Focal adhesion kinase (FAK) is a cytoplasmic non-receptor tyrosine kinase that is essential for diverse cellular function, especially cell motility, adhesion and migration7. FAK controls cell motility through its complex multifaceted molecular connections that regulate the dynamic interplay between cellular actin cytoskeleton, cell membrane protrusion8, and cell adhesion site with the extracellular matrix (or substrate). More importantly, FAK serves as a receptor-proximal regulator of cell movement, by transducing extracellular signals that ultimately govern cell motility9. FAK phosphorylation plays a pivotal role in transmitting extracellular cues, including mechanical tension, to a variety of intracellular targets. Regulation of FAK phosphorylation activity hence warrants specific cellular response to extracellular stimulation. Abnormal FAK activity has been implicated in malignancies such as angiogenesis-dependent diseases10, developmental disorders11, tumor progression and metastasis12, and neurological disorder13. Small molecule inhibitors14, 15 have been developed to inhibit FAK activities, resulting in inhibited angiogenesis16 or cell migration17 during tumor progression or other disease pathogenesis.
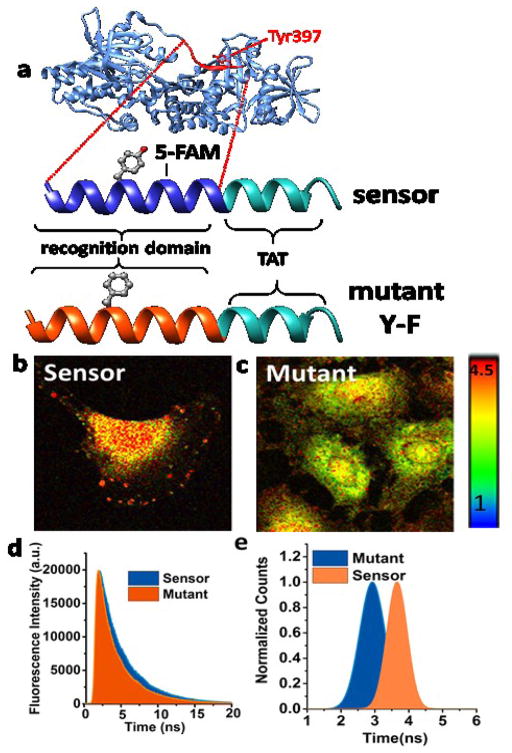
Understanding FAK signaling dynamics will help to address fundamental and applied questions in the field of biotechnology, medical biology, and drug development. FAK activation due to perturbation by a stimulii from extracellular matrix effects, growth factors, or drugs is a rapid, dynamic and a highly evolving process. Current methods18,19 for monitoring FAK phosphorylation activity predominantly use cell lysate or utilize genetically encoded sensors. A major drawback in phosphorylation monitoring using cell lysate is the loss of spatiotemporal information which is pivotal in intracellular signal transduction from environmental cues to downstream signaling protein. Although, real time monitoring can be achieved with genetically modified sensors, ease and feasibility of developing a stable transfection across different cell lines limit its application especially in cell lines derived from patient tumor. Moreover, genetically encoded sensors are limited in their ability to probe multiple pathways. Herein we report on a novel approach to monitor FAK signaling in live cells by measuring the real-time kinase phosphorylation activity of FAK. We utilized Time-Correlated Single Photon Counting (TCSPC) Fluorescence Lifetime Imaging (FLIM)18–23 to monitor FAK phosphorylation with a FAK peptide biosensor (FAKSOR) as depicted in Figure 2. Our design exploits the auto phosphorylation property of FAK at Tyr397 sites, used as the recognition motif (Fig. 2e) of the sensor.
Figure 2.
Sensor design and evaluation. (a) Schematic depicts FAK FERM (Four-point- one-Ezrin-Radixin-Moesin)-Kinase domain (blue) including the Tyr-397 auto-phosphorylation site (red). Our putative peptide sensor was designed by including Tyr-397 and its adjacent amino acids as the sensor recognition sequence (dark blue) conjugated with a TAT sequence, which enables live cell imaging and monitoring of phosphorylation. Fluorophore reporter, 5-FAM (Ex/Em, 492/518), was placed +2 amino acids from the Tyr-397 site. Mutant sensor was designed by replacing the tyrosine site with a phenylalanine (Y-F) (orange). (b) When FAKSOR is phosphorylated it exhibits a longer fluorescence decay (red) than the control mutant FAKSOR (orange) (c). Fluorescence lifetime images (d, e) of FAKSOR in 2D-cultured ECFC after treatment with Angiotensin II (1 μM, 30 min) (d) demonstrates a higher average fluorescence lifetime (3.82 ns) compared to (e) non-phopshorylatable FAKSOR mutant (2.91 ns).
A putative peptide substrate containing the Tyr397 phosphorylation site and its adjacent amino acid (Fig. 2e red), which serves as the sensors’ recognition sequence (Fig 2e. sensor dark blue part) was designed. Cellular FAK will identify the putative sequences in the biosensor and phosphorylate the Tyrosine (Tyr 397 residue).
Additionally, to facilitate live cell monitoring, we incorporate a cell-penetrating peptide sequence in the FAKSOR design (Fig. 2e. sensor light blue part). For signal reporting, 5-FAM (Ex/Em 492/518) fluorophore was conjugated to the lysine residue, two amino acids from the Tyr397 phosphorylation site (Fig. 2e). The working principle of FAKSOR is as follows: upon phosphorylation of the peptide sensor at the Tyr397 site by the cellular FAK, the phospho group in the FAKSOR (phopsho-Tyr) conforms to bind with the cellular phospho-binding domain of the kinase to alter the fluorescence lifetime of 5-FAM in a kinase phosphorylation dependent manner(Fig. 2a–d) due to a change in the solvatochromic microenvironment upon phosphorylation23.
A challenge with genetically encoded or nanoparticle-based sensors is the lack of uniform uptake by different cell lines24, 25. The efficacy of cellular delivery of the FAKSOR was tested in five different cell lines (ESI Fig. 6). FAKSOR was rapidly internalized by the cells within 20 minutes of incubation with the biosensor. To validate subcellular localization, cells were stained via immunofluorescence and visualized with confocal microscopy (ESI Fig. 7). In concordance with the FLIM image, immunostaining demonstrates two subcellular localizations of FAK; 1) cytoplasmic localization marked with punctate cytoplasmic sturcture and focal adhesion occupancy, and 2) nuclear localization. These observations are in agreement with previous studies reporting on FAK cytoplasmic8 and nuclear location26.
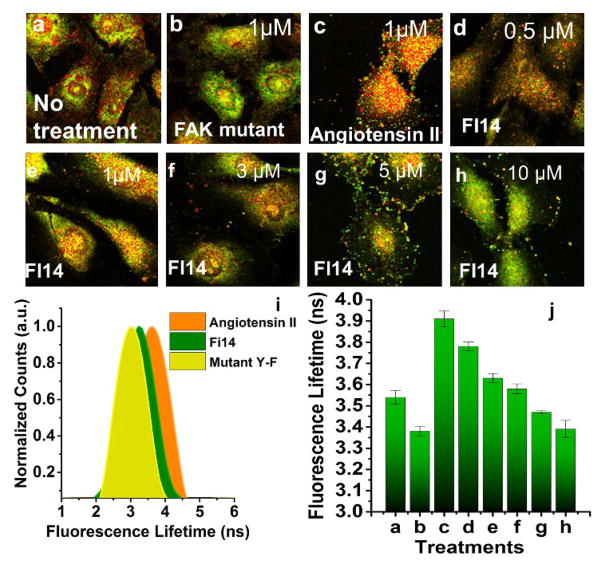
To assess specificity of FAKSOR and demonstrate FAK kinase phosphorylation dependant fluorescence lifetime shift, a FAK-specific small molecule activator (Angiotensin II), was utilized as the positive control, and tested in the three different cell types. After pretreatment of cells with Angiotensin II for 1 hour, the fluorescence lifetime of the internalized FAKSOR recorded was found to be greater than the untreated control (Fig. 3, ESI Fig. 8, 9). Two negative controls were tested: 1) an FAK-specific inhibitor (FI-14) and 2) a non-phosphorylatable mutant FAKSOR peptide (Fig. 3, ESI Fig. 3 a, b). Compared to Angiotensin II-stimulated cells (Fig. 3a, d, e; 3.9 ns), negative controls for FAKSOR demonstrated a decreased fluorescence lifetime with FI-14 at 3.2 ns (Fig. 3h; 3.2 ns) and the mutant FAKSOR at 2.9 ns (Fig. 3b, d, e, 3b; 2.9 ns).
Figure 3.
FAKSOR fluorescence lifetime depends on FAK phosphorylation. (a–h) Fluorescence lifetime images for different treatments; For FAKSOR positive controls, Angiotensin II (1 μM) was added to the medium (c) resulting in a higher average fluorescence lifetime (3.91 ns) compared to control (a,3.54 ns) as well as the negative control mutant FAKSOR (b, 3.38 ns). (d–h) Treatment with FI-14 (90 minutes), a Tyr397 inhibitor, decreased the average fluorescence lifetime of FAKSOR in a dose-dependent manner (d) 0.5 μM (3.78 ns), (e) 1 μM (3.63 ns), (f) 3 μM (3.58 ns), (g) 5 μM (3.47 ns), (h) 10 μM (3.39 ns) (I,j) Quantitative analysis; (i) Fluorophore lifetime per cell calculated based on the average from at least 50 cells in 3 replicates and, for each condition, and plotted as a distribution of observed lifetimes, (j) Quantitative analysis shows average fluorescence lifetime for different treatments (n=50).
Experiments show that FAKSOR exhibited a dose-dependent decrease in fluorescence lifetime upon inhibitor treatment (Fig. 3c–h, j). The histograms of average fluorescence lifetime of FAKSOR derived from approximately 50 cells for each condition (Fig. 3i) demonstrates that fluorescence lifetime of the labeled peptide biosensor increased by 12 % upon activation and found to be FAK phosphorylation dependent.
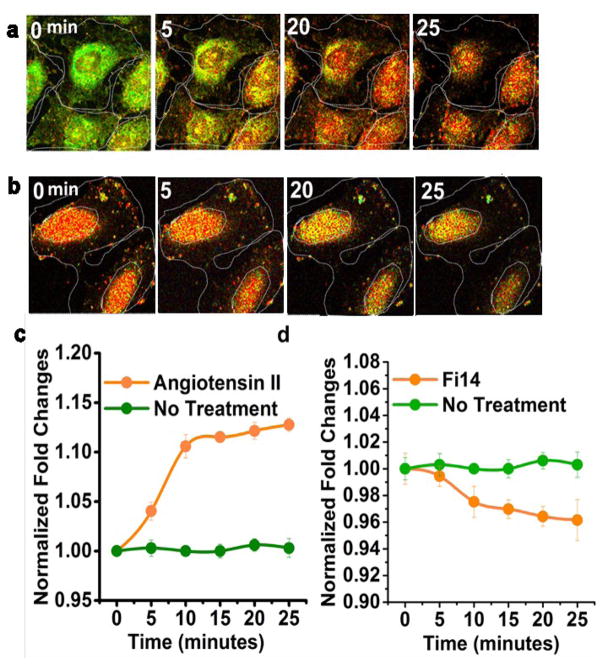
The difference in average fluorescence lifetimes between each treatment group was found to be statistically significant at α=0.05 (P <0.001). In addition to monitoring the temporal dynamics of the FAKSOR signal, distinct FAKSOR spatial profiles indicated its nuclear activation (Fig. 4a) after 15 minutes of stimulation with 20 ng/mL 1μM Angiotensin II.
Figure 4.
Real Time Fluorescence Lifetime Imaging of FAKSOR activity. (a), (b) Real time measurement of FAKSOR fluorescence lifetime in ECFC shows an increase (a) and decrease (b) of average florescence lifetime in (a) Angiotensin II- and (b) FI14-treated cells over a 25-minute observation. (c) quantitative analysis reveals that treating ECFC with Angiotensin II (1μM) (orange line and dot) increases average fluorescence lifetime (3.92 ns from 3.10 ns) over 25 minutes, while controls do not show a change in average lifetime (green line and dot). (d) When ECFC are treated with FI14, FAKSOR average lifetime decreases over 25 minutes (orange line and dot), while controls, again, did not experience a change in average fluorescence lifetime (green line with dot). Our observation is representative of three technical and three independent biological replicates.
Our findings are in concordance with the previous in vitro study on FAK nuclear localization and activation23. Quantitative analysis (Fig. 4c) confirmed that FAKSOR in ECFC treated with Angiotensin II (orange line) not only signals a higher average fluorescence than the control, but also experiences detectable changes in the initial average fluorescence lifetime (3.10 ns to 3.92 ns).
On the other hand, the control (green line) does not show any noticeable change in average lifetime over the 25-minute time course. This observation is representative of three technical and three independent biological replicates. For negative controls, real-time observations in three different cells was also conducted for FAKSOR using FI-14, a FAK phosphorylation inhibitor, treatment. After a 25-minute treatment with FI-14, the fluorescence lifetime images of FAKSOR in ECFCs exhibited decreased fluorescence lifetime compared to the control (Fig. 4b).
Quantitative analysis (Fig. 4d) validated the FLIM observations of FAKSOR in ECFC treated with FI-14 (orange), not only had a lower fluorescence lifetime compared to control but also exhibited a detectable decrease from its initial average fluorescence lifetime (3.9 ns to 3.34 ns). On the other hand, the control did not show any noticeable decrease in average lifetime over the 25-minute time course (green line). Our observation represents three technical and three independent biological replicates.
Under the same experimental conditions, a similar trend was observed for hMSC (ESI Fig. 9 a–c) and C2C12 (ESI Fig. 10a–c) cell types. Results from the positive and negative control demonstrated that the fluorescence lifetime of FAKSOR is phosphorylation and FAK kinase dependent and can be applied to a variety of cell types. After validating the performance of FAKSOR, we tested the sensors’ utility in a musculoskeletal cell line subjected to extracellular tension. The average fluorescence lifetime of FAKSOR was monitored in either bare culture flask or a PEG-based scaffold (ESI Fig. 10 a, b). FLIM images (ESI Fig. 10 a–d) and quantitative analysis (ESI Fig. 10 e, f) show that internalized FAKSOR in the musculoskeletal cells exhibited higher average fluorescence lifetime, when the cells were grown on PEG (ESI Fig. 10b) compared to those grown on plastic (ESI Fig. 10 a). Our results suggest that scaffold materials induce higher activity of FAK phosphorylation in musculoskeletal cells. Interestingly, real time recording of the fluorescence lifetime of FAKSOR on the scaffold reveals dynamic phenotype-dependent FAK phosphorylation (ESI Fig. 10 c, d, f, ESI Video 1). Our results demonstrate the ability of FAKSORs to report on FAK phosphorylation dynamics in live cells when triggered by an external stimulus, in this case, tension from the scaffolds.
Herewith, we demonstrate an approach to monitor real time cellular FAK signaling in response to extracellular cues, specifically chemokines or extracellular (substrate) tension. The developed methodology encompassing a non-genetically encoded peptide biosensor with fluorescence lifetime imaging at singe molecule resolution presents a compelling approach for real time monitoring of FAK phosphorylation dynamics. Our platform captures the real-time dynamics of FAK activity, allowing spatiotemporal monitoring of signaling in response to stimuli. With appropriate choice of fluorophores more complex interactions between FAK and its downstream signaling partners could be explored in a multiplex format. The methodology developed can also be applied to monitor phosphorylation dynamics in 3D cultures as well as in vivo models.
METHODS
Detailed experiment procedure is available in the ESI
Supplementary Material
Figure 1.
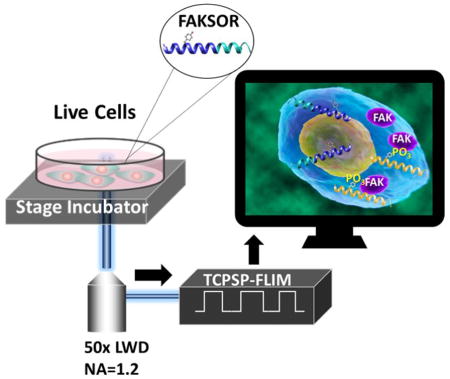
Schematic for FAK phosphorylation monitoring in live cells with a peptide biosensor by FLIM
Acknowledgments
The authors acknowledge the grant from W.M. Keck Foundation to JI. This research was supported in part by the grant R01HL10962 (S.L.V.-H. and M.C.Y.) from the National Heart, Lung, and Blood Institute as well as Incentive Grant funds provided by the Purdue University Office of the Executive Vice President for Research and Partnerships (S.L.V.-H.). The content is solely the responsibility of the authors and does not necessarily represent the official views of the National Heart, Lung, and Blood Institute or the National Institutes of Health. K.P.B. is a recipient of an NSF Graduate Fellowship (DGE-1333468).
Footnotes
Electronic Supplementary Information (ESI) available: Experimental and instrumentations details, peptide biosensor characterization, real time fluorescence images and video, immunofluorescence.
Notes
The authors declare no competing financial interest.
References
- 1.Janmey PA, Miller RT. Journal of Cell Science. 2011;124:9–18. doi: 10.1242/jcs.071001. [DOI] [PMC free article] [PubMed] [Google Scholar]
- 2.Thompson WR, Rubin CT, Rubin J. Gene. 2012;503:179–193. doi: 10.1016/j.gene.2012.04.076. [DOI] [PMC free article] [PubMed] [Google Scholar]
- 3.Kritikou E. Nature reviews. Molecular cell biology. 2009;10:3–3. [Google Scholar]
- 4.Yim EKF, Sheetz MP. Stem Cell Research & Therapy. 2012;3:1–12. doi: 10.1186/scrt132. [DOI] [PMC free article] [PubMed] [Google Scholar]
- 5.Farge E. Current topics in developmental biology. 2011;95:243–265. doi: 10.1016/B978-0-12-385065-2.00008-6. [DOI] [PubMed] [Google Scholar]
- 6.Chien S. American Journal of Physiology - Heart and Circulatory Physiology. 2007;292:H1209–H1224. doi: 10.1152/ajpheart.01047.2006. [DOI] [PubMed] [Google Scholar]
- 7.Zhao X, Guan JL. Advanced drug delivery reviews. 2011;63:610–615. doi: 10.1016/j.addr.2010.11.001. [DOI] [PMC free article] [PubMed] [Google Scholar]
- 8.Mitra SK, Hanson DA, Schlaepfer DD. Nature reviews Molecular cell biology. 2005;6:56–68. doi: 10.1038/nrm1549. [DOI] [PubMed] [Google Scholar]
- 9.Hauck CR, Klingbeil CK, Schlaepfer DD. Immunologic Research. 2000;21:293–303. doi: 10.1385/IR:21:2-3:293. [DOI] [PubMed] [Google Scholar]
- 10.Infusino GA, Jacobson JR. Microvascular research. 2012;83:89–96. doi: 10.1016/j.mvr.2011.09.011. [DOI] [PMC free article] [PubMed] [Google Scholar]
- 11.Vadali K, Cai X, Schaller MD. IUBMB life. 2007;59:709–716. doi: 10.1080/15216540701694245. [DOI] [PubMed] [Google Scholar]
- 12.Lechertier T, Hodivala-Dilke K. The Journal of pathology. 2012;226:404–412. doi: 10.1002/path.3018. [DOI] [PubMed] [Google Scholar]
- 13.Murase S. International Journal of Molecular Sciences. 2015;16:15659–15669. doi: 10.3390/ijms160715659. [DOI] [PMC free article] [PubMed] [Google Scholar]
- 14.O’Brien S, Golubovskaya VM, Conroy J, Liu S, Wang D, Liu B, Cance WG. Oncotarget. 2014 doi: 10.18632/oncotarget.2381. [DOI] [PMC free article] [PubMed] [Google Scholar]
- 15.Zhang J, He DH, Zajac-Kaye M, Hochwald SN. Cell Cycle. 2014;13:3143–3149. doi: 10.4161/15384101.2014.949550. [DOI] [PMC free article] [PubMed] [Google Scholar]
- 16.Dunn KB, Heffler M, Golubovskaya V. Anti-Cancer Agents in Medicinal Chemistry. 2010;10:722–734. doi: 10.2174/187152010794728657. [DOI] [PMC free article] [PubMed] [Google Scholar]
- 17.Megison ML, Stewart JE, Nabers HC, Gillory LA, Beierle EA. Clinical & experimental metastasis. 2013;30:555–568. doi: 10.1007/s10585-012-9560-7. [DOI] [PMC free article] [PubMed] [Google Scholar]
- 18.Chen J, Irudayaraj J. Acs Nano. 2009;3:4071–4079. doi: 10.1021/nn900743v. [DOI] [PubMed] [Google Scholar]
- 19.Chen J, Irudayaraj J. Analytical Chemistry. 2010;82:6415–6421. doi: 10.1021/ac101236t. [DOI] [PubMed] [Google Scholar]
- 20.Chen J, Miller A, Kirchmaier AL, Irudayaraj JM. J Cell Sci. 2012;125:2954–2964. doi: 10.1242/jcs.101592. [DOI] [PMC free article] [PubMed] [Google Scholar]
- 21.Vidi PA, Chen J, Irudayaraj JMK, Watts VJ. Febs Letters. 2008;582:3985–3990. doi: 10.1016/j.febslet.2008.09.062. [DOI] [PubMed] [Google Scholar]
- 22.Damayanti N, Craig A, Irudayaraj J. Analyst. 2013;138:7127–7134. doi: 10.1039/c3an01097j. [DOI] [PubMed] [Google Scholar]
- 23.Damayanti N, Parker L, Irudayaraj J. Angewandte Chemie-International Edition. 2013;52:3931–3934. doi: 10.1002/anie.201209303. [DOI] [PMC free article] [PubMed] [Google Scholar]
- 24.González-Vera AJ, Morris CM. Proteomes. 15:3. doi: 10.3390/proteomes3040369. [DOI] [PMC free article] [PubMed] [Google Scholar]
- 25.Madani F, Lindberg S, Langel U, Futaki S, Graslund A. Journal of biophysics (Hindawi Publishing Corporation: Online) 2011;2011:414729. doi: 10.1155/2011/414729. [DOI] [PMC free article] [PubMed] [Google Scholar]
- 26.Lim ST. Mol Cells. 2013;36:1–6. doi: 10.1007/s10059-013-0139-1. [DOI] [PMC free article] [PubMed] [Google Scholar]
Associated Data
This section collects any data citations, data availability statements, or supplementary materials included in this article.


