Abstract
The physiology of a cell can be viewed as the product of thousands of proteins acting in concert to shape the cellular response. Coordination is achieved in part through networks of protein-protein interactions that assemble functionally related proteins into complexes, organelles, and signal transduction pathways. Understanding the architecture of the human proteome has the potential to inform cellular, structural, and evolutionary mechanisms and is critical to elucidation of how genome variation contributes to disease1–3. Here, we present BioPlex 2.0 (Biophysical Interactions of ORFEOME-derived complexes), which employs robust affinity purification-mass spectrometry (AP-MS) methodology4 to elucidate protein interaction networks and co-complexes nucleated by more than 25% of protein coding genes from the human genome, and constitutes the largest such network to date. With >56,000 candidate interactions, BioPlex 2.0 contains >29,000 previously unknown co-associations and provides functional insights into hundreds of poorly characterized proteins while enhancing network-based analyses of domain associations, subcellular localization, and co-complex formation. Unsupervised Markov clustering (MCL)5 of interacting proteins identified more than 1300 protein communities representing diverse cellular activities. Genes essential for cell fitness6,7 are enriched within 53 communities representing central cellular functions. Moreover, we identified 442 communities associated with more than 2000 disease annotations, placing numerous candidate disease genes into a cellular framework. BioPlex 2.0 exceeds previous experimentally derived interaction networks in depth and breadth, and will be a valuable resource for exploring the biology of incompletely characterized proteins and for elucidating larger-scale patterns of proteome organization.
Understanding the cellular function and dysfunction of ~20,000 individual protein coding genes, alternatively spliced forms, and allelic variants8,9,10 will require a comprehensive model of proteome architecture that reveals how individual proteins assemble into functional modules and networks dedicated to specific biological activities. A first step towards this goal is a reference interaction map that places individual proteins within molecular assemblies. Previous large-scale efforts towards this goal in metazoans have involved binary interaction mapping via the yeast two-hybrid system11,12, as well as mass spectrometry-based correlation profiling1,2 and AP-MS4,11,12,13, yet interaction partners and co-complexes for only a fraction of the human proteome have been delineated.
To address challenges of scale in high-throughput AP-MS, we have established a robust AP-MS pipeline capable of targeting up to 500 human open reading frames (ORF’s) per month4, leveraging the human ORFEOME (v. 8.1)14 to create C-terminally HA-FLAG-tagged lentiviral constructs for stable expression and affinity purification in HEK293T cells. This platform includes CompPASS-Plus, a naïve Bayes classifier that identifies high-confidence candidate interacting proteins (HCIPs) using abundance, frequency, reproducibility of peptide spectral matches, and other features across thousands of parallel AP-MS experiments (see METHODS)4. CompPASS-Plus performance to exclude false positives is similar to or exceeds other HCIP detection methods when benchmarked against the CORUM database15 of high-quality protein interactions4. The aggregate output of this pipeline, termed BioPlex 2.0, contains 3297 new AP-MS experiments together with 2594 reanalyzed AP-MS experiments in BioPlex 1.04. BioPlex 2.0 is the largest collection of human co-complex data assembled from a single pipeline to date, containing 56,553 interactions from 10,961 proteins, (Fig. 1a–d and Supplementary Table 1). The number of proteins characterized is significantly larger than recent interaction studies using yeast-two-hybrid16,17, correlation profiling1,2, and affinity-purification mass spectrometry4,12 (Fig. 1a,c,d), including landmark interaction studies in humans and other metazoans11,13. Notably, 87% of BioPlex interactions have not been reported previously through independent research efforts, as reported in several protein interaction databases (Fig. 1d). Several protein families (e.g. kinases) are enriched more than by chance, suggesting that such proteins are highly interactive (Extended Data Fig. 1a). Thus, BioPlex 2.0 constitutes a powerful resource for biological inquiry.
Figure 1. BioPlex 2.0 Significantly Increases Depth and Breadth of Interactome Coverage.
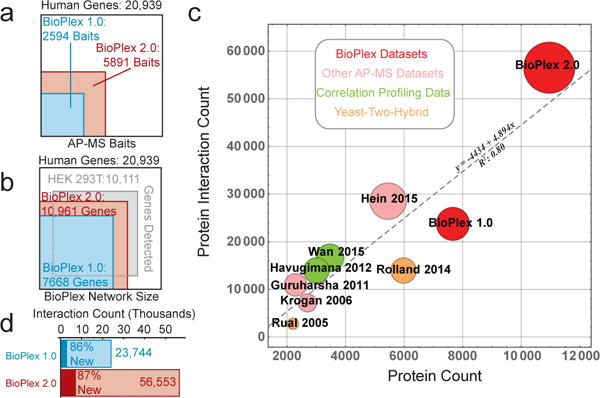
a, bait proteins targeted for AP-MS analysis. b, protein-coding genes included in BioPlex 2.0 as baits or preys. c, The BioPlex 2.0 network significantly exceeds previous experimentally derived interaction networks with respect to protein and interaction counts. Circle area is proportional to interaction counts, while shading denotes the experimental strategy used for interaction mapping. d, BioPlex 2.0 doubles the numbers of interactions revealed in BioPlex 1.0.
As AP-MS experiments have been added, increases in network scope and density have improved both quality and coverage of the protein interaction space. In its current form, 54% of proteins in BioPlex 2.0 have been targeted as baits and the mean number of interactions per protein has increased to 5.2, reflecting increased coverage and reciprocity within multi-subunit complexes. The range of bait expression levels as quantified by spectral counting has remained consistent with that seen in BioPlex 1.04. Of 340 CORUM complexes represented in BioPlex 2.0 with two or more bait proteins, 50% displayed greater than 90% coverage of co-complex membership, and 45% displayed 100% coverage (Fig. 2a). By this measure, the performance of BioPlex 2.0 substantially surpasses that of BioPlex 1.0, which displayed >90% coverage for only 33% of CORUM complexes (Fig 2a)4. In cases such as the Arp2/3 complex for which two bait proteins captured all seven members in BioPlex 1.0, addition of 2 bait proteins revealed 3 additional edge interactions (Fig. 2b). By comparison, inclusion of ~2-fold additional subunits fthe TFIIH complex (10 members), the checkpoint Rad complex (8 members), and the NuA4/Tip60 complex (8 members), which were sparsely (40–75%) covered in BioPlex 1.0, greatly increased coverage, now identifying 100% of complex members (Fig. 2c–e). A series of validation experiments examining: 1) interactions of 12 poorly studied BioPlex 2.0 proteins in HCT116 cells (Extended Data Fig. 1b–m), 2) reciprocal interactions of 14-3-3 interacting proteins in HEK293T cells (Extended Data Fig. 2a–c), and 3) a PDLIM7-PTPN14 network in MCF10A cells (Extended Data Fig. 2d–i) indicated that BioPlex 2.0 provides a robust platform for discovery of new interactions (see Extended Text in the METHODS section; see also Supplementary Table 2).
Figure 2. BioPlex 2.0 Maps Protein Complexes with Increased Resolution.
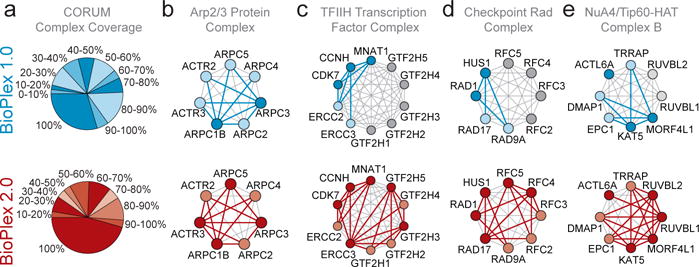
a, agreement among BioPlex networks and CORUM complexes. Pie charts indicate the fraction of CORUM complexes that attained the indicated protein coverage. When compared with BioPlex 1.0 (blue), BioPlex 2.0 (red) provides significantly improved coverage. b – e, network coverage achieved by BioPlex 1.0 (blue) and BioPlex 2.0 (red) for selected CORUM complexes. Dark and light shades depict bait and prey proteins, respectively, while gray proteins were not observed in the network. Red and blue edges represent detected protein interactions.
Proteome architecture is driven in part through modular interaction domains that form interfaces in multi-subunit complexes18 and through protein subcellular localization. Moreover, co-association can accelerate ontology-based annotation of poorly understood proteins19. Therefore, we mined BioPlex 2.0 for evidence of protein localization, domain co-association, or partitioning by biological function. We predicted the subcellular localization of largely uncharacterized proteins based on first- and second-degree interaction partners and their reported localizations in Uniprot20, resulting in localization predictions for hundreds of proteins, including 101 additional uncharacterized ORF (C_ORF) proteins (Extended Data Fig. 3a,b; Supplementary Table 3). Of 65 uncharacterized C_ORF proteins examined using antibodies in the Human Protein Atlas21, 41 were compatible with our predictions (Extended Data Fig. 3b), including several proteins with recently validated localizations (Extended Data Fig. 3c,d,e,g,i) as well as proteins that remain largely unknown (Extended Data Fig. 3f,h,i). Using immunofluorescence of 44 lentivirally-expressed proteins with predicted primary localizations, we confirmed 80% either localizing exclusively to the predicted location or localizing in multiple compartments including the predicted compartment (Extended Data Fig. 4), further indicating that the predictions are of general utility.
We next sought Protein Family (PFAM)22 domain pairs that were unusually likely to associate, directly or indirectly, through pairs of interacting proteins. The enhanced statistical power afforded by the larger network identified 7000 pairwise domain associations (2.3-fold more than BioPlex 1.0) while increasing the statistical significance of each pair (Extended Data Fig. 5a,b). While some of these additional associations are known (GDI/Ras and KBP_C/Kinesin; Extended Data Figure 5e–f), many place domains of unknown function (DUFs) into candidate biological processes (Extended Data Fig. 5c–d, g; Supplementary Table 4). The power of this approach to recognize functionally interactive pairs is highlighted by the cullin-RING E3 ubiquitin ligase system (CRL), which uses modular adaptor proteins to recruit substrates (Extended Data Fig. 6a). The cullin domain was paired de novo with 15 additional domains, many of which also co-associated (Extended Data Figure 6b). Complementary protein-centric quantification (Extended Data Figure 6c,d) revealed that every cullin domain association can be explained through direct or indirect interaction of cullins and their associated adaptors or regulatory proteins. Neighbors of proteins containing RBX1/2-binding cullin homology domains were enriched with BTB, BTB_2, SOCS and FBOX domains known to bind the cullin N-terminal domain (NTD) directly or indirectly through SKP1 or ELOC adaptors, as well as with substrate-binding WD40, FBA, ANK, SH2, and KELCH domains (Extended Data Fig. 6b–d). Similar conclusions were drawn for regulatory domains linked with cullins (Extended Data Fig. 6a–d). In contrast, other cullin-domain-containing proteins (ANAPC2 and CUL9) were not enriched in these domains, consistent with their known biology. Notably, while Kelch 2, Kinetochor Ybp2, and MitMem Reg domain enrichment failed to reach statistical significance among neighbors of any individual cullin-containing protein, seeking domain-domain associations across the entire interaction network increased sensitivity and enabled detection of associations involving these uncommon domains found in CRL regulators.
BioPlex 2.0 often suggests candidate functions for poorly characterized proteins (e.g. coiled-coil domain-containing, CCDC, and C_ORF) through guilt-by-association, as proteins neighboring most of these poorly characterized proteins are enriched for one or more gene ontology terms or known protein complexes (Extended Data Fig. 7a; Supplementary Table 5). These include, among others (Extended Data Fig. 7b–k), the RUBCN (RUBICON)23-related protein C13orf18 associated with the BECN1-PIK3R4-PIK3C3 complex, which was validated by reciprocal immunoprecipitation-western analysis (Extended Data Fig. 7b, l–n), and CCDC65 (mutated in a cilia-associated disease24) associated with the centrosome-localized proteins PCM1 and HERC2-NEURL4 (Extended Data Fig. 7k). Further exploration of BioPlex 2.0 interactions involving poorly studied proteins, together with the domain-domain and localization enrichment parameters, will assist elucidation of functional modules and pathways for poorly studied components of the human proteome.
Functionally-related proteins often segregate into tightly interconnected communities that correspond to multi-protein complexes or pathways important for cellular fitness or targeted in disease. To explore protein communities in BioPlex 2.0, we applied unsupervised Markov clustering (MCL)5 for data-driven discovery of highly interconnected protein clusters, identifying 1320 communities of between 3 and 76 proteins with 286 topologies (Figure 3a; Supplementary Tables 6, 7). While each community within BioPlex 2.0 is by definition highly interconnected, most are more sparsely defined in BioPlex 1.0, as exemplified by a cluster centered on the ribosomal biogenesis protein RRS1 (Figure 3e) and additional examples in Extended Data Fig. 8b–e. Through a binomial comparison of BioPlex 1.0 and 2.0 communities, we found that 45% of BioPlex 2.0 clusters showed no enrichment in BioPlex 1.0 above background interaction rates (p<8.08×10⁻⁴) (Figure 3b, see METHODS), underscoring the extent to which depth and coverage has increased in BioPlex 2.0.
Figure 3. BioPlex Communities Subdivide the Interaction Network according to Functional Properties and Fitness Effects.
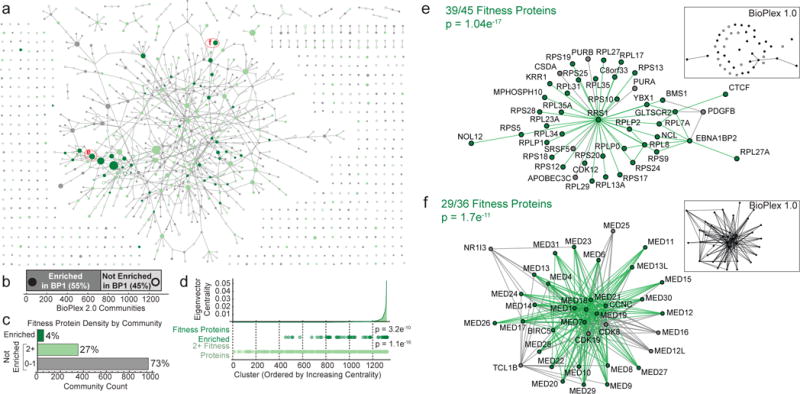
a, network of communities revealed through MCL clustering of the BioPlex 2.0 network. Nodes represent distinct communities and are scaled to reflect the numbers of proteins in each (3–76 proteins). Nodes are connected by edges when proteins within the respective communities interact with unusually high frequency (see Online Methods). Filled nodes depict communities that were also found to be interconnected by unusual numbers of interactions in BioPlex 1.0; open circles represent communities of proteins that exhibited only background numbers of interactions in BioPlex 1.0. Communities containing 2 or more proteins associated with increased cellular fitness are highlighted in light green; communities that are enriched with cellular fitness proteins (1% FDR) are highlighted in dark green. b, Mapping BioPlex 2.0 communities onto BioPlex 1.0 reveals lower connectivity, with 45% of complexes showing no significant enrichment of interactions above background levels (binomial test; Benjamini-Hochberg-adjusted p-values < 0.05). c, Relative fractions of 1320 communities that contain specified numbers of fitness proteins. d, When BioPlex 2.0 clusters are ranked according to their eigenvector centrality within the BioPlex 2.0 community network (panel a), clusters that contain multiple fitness proteins (light green) or are enriched for fitness proteins (dark green) tend to have higher centralities (Kolmogorov-Smirnov test). e–f, selected BioPlex 2.0 communities highlighting proteins associated with cellular fitness (green). Inset maps depict the same communities as observed in BioPlex 1.0. Filled nodes indicate proteins that were in BioPlex 1.0, while black edges indicate interactions that were visible. In contrast, open circles indicate proteins that were not found in BioPlex 1.0.
We next examined the community enrichment of proteins critical to cellular fitness6,7. Eighty-six percent of 2940 genes deemed important for cell fitness are detected in BioPlex 2.0, and 55% of these (1359 proteins) reside within one of 53 communities that are enriched with cellular fitness proteins (Fig. 3a–d, Extended Data Fig. 9a). An additional 350 clusters contained 2 or more fitness proteins without reaching statistically significant enrichment (Fig. 3c). Fitness genes within the BioPlex 2.0 network differed from the overall BioPlex 2.0 proteome with respect to several network properties (Fig. 3d, Extended Data Fig. 9b–e, p<10−200): 1) an increased number of average interacting proteins (10.3 versus 12.4), 2) increased eigenvector centrality indicative of an increased number and/or importance of neighbors, 3) elevated mean local clustering coefficient indicative of higher connectivity among neighbors, and 4) increased graph assortativity, which measures the extent to which fitness proteins and non-fitness proteins preferentially associate with their own kind. Communities enriched for fitness genes often involved core cellular functions, including transcription-splicing-translation [e.g. ribosome (39/45 subunits) and mediator (29/36 subunits)], electron transport chain function, protein degradation, and chromatin modification (Fig. 3e,f, Extended Data Fig 9f, Supplementary Table 8). Even communities with multiple essential proteins that lacked statistical enrichment nevertheless displayed increased centrality, consistent with essential proteins tending to reside in highly interactive complexes (Fig. 3d).
Disease alleles are often found in groups of genes that function in a common biological process, yet information relating interactions of disease-linked proteins within pathways, and how mutations affect complex assembly, is limited in part due to incomplete underlying network structure3. We therefore mapped genes associated with 13,000 partially redundant disease annotations from DisGeNET25 onto 1320 BioPlex 2.0 communities, identifying 4292 associations relating 442 communities to 2053 disease annotations (Fig. 4a; Supplementary Table 8). Neoplasms are unusually centrally located within these disease networks, reflecting: i) diverse pathways contributing to dysregulated growth characteristic of neoplasia; and ii) a small number of common communities linked to many neoplastic disorders. These principles are evident among eleven communities containing 99 proteins, 65 of which are linked with colorectal cancer (Fig. 4c). Hypertensive Disease, a centrally-located, non-neoplastic disease with systemic effects (Fig. 4d), spans communities containing ion channels, transcription factors, and metabolic enzymes. In contrast, congenital and hereditary diseases are less centrally located, targeting individual complexes that are not necessarily associated with multiple disease states. Typical examples include Bardet-Biedl Syndrome (Extended Data Fig. 10a), a genetic disruption of cilia formation and function driven by defects in a cluster of interacting proteins called the BBSome; genetic Mitochondrial Complex I Deficiency involving components of the electron transport chain (Extended Data Fig. 10b); and Hereditary Spastic Paraplegia (HSP) involving components of the WASH complex (Extended Data Fig. 10c). To demonstrate the utility of BioPlex 2.0 to identify complexes relevant to disease, we examined interactions of a poorly understood member of the WASH complex (KIAA0196, also called SPG8) in KIAA0196−/− 293T cells expressing flag-tagged wild-type and HSP patient mutant forms at near-endogenous levels with other WASH complex components using 10-plex tandem mass tagging as well as AP-Western (Extended data Fig. 10e,f). KIAA0196N471D, and to a lesser extent L619F, displayed reduced association with all detectable WASH complex components except KIAA1033, consistent with loss of function, while the V626F mutant displayed interactions similar to wild-type (Extended Data Fig. 10d,g–i, Supplementary Table 9).
Figure 4. Integration of BioPlex 2.0 and the DisGeNET Network Associates Protein Complexes with Disease Processes.
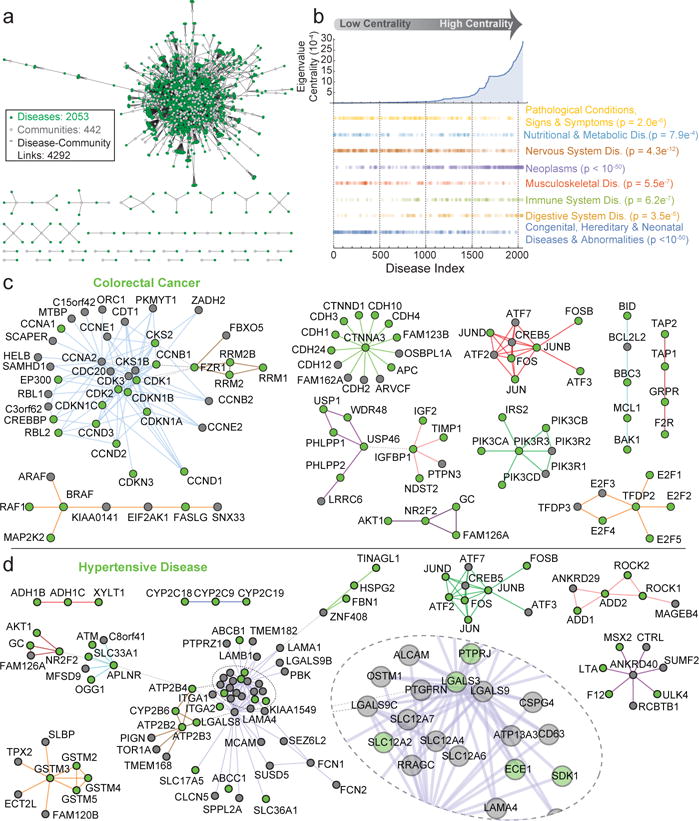
a, network of associations among protein interaction communities and disease conditions (see Online Methods). The network depicts 4292 associations between 442 protein complexes (gray) and 2053 disease states (green). b, Ranking of 2053 disease states based on eigenvalue centrality in the disease-complex network (panel a). Scatter plots below highlight disease classes that are non-randomly distributed (Kolmogorov-Smirnov Test; Benjamini-Hochberg p-value < 0.01). c – d, subnetworks associated with selected disease states: colorectal cancer (BRAF complex: p < 0.05) and hypertensive disease. Nodes associated with the indicated disease are highlighted in green, while other complex members are gray; thick, multi-colored edges connect proteins belonging to individual communities revealed through MCL clustering; thin, dashed, grey edges connect proteins among adjacent communities.
Although unparalleled in scope among experimentally-derived interaction networks, BioPlex 2.0 remains an incomplete model of the human interactome. This reflects the dynamic nature of the proteome, the potential for alternative interactions in distinct cell lineages, and the fact that certain classes of protein complexes (e.g. membrane proteins) are sensitive to detergents used for protein extraction26. For example, previous studies using digitonin recovered both the NDUFAB1-LYRM5-ETFA/B complex and the 8-subunit CoQ complex27, while we only recovered the NDUFAB1 complex using NP40 as detergent. BioPlex 2.0 can also be used for hypothesis generation and discovery of functional interactions. Recent mining of this network led to the discovery that the unstudied protein GATSL3 (now called CASTOR1), a binding partner of the mTOR regulatory complex GATOR24, functions as a cellular arginine sensor28. Similarly, association of SNX2 with VAPB in BioPlex4 led to the finding that SNX2 tethers the ER-localized VAPB protein to retromer binding sites on lysosomes29. To facilitate future studies, the entire BioPlex 2.0 network and supporting data are available to the community (http://bioplex.hms.harvard.edu), as are an additional 1712 AP-MS experiments performed subsequently to the analysis reported here. Ultimately, BioPlex 2.0 enables systems-level study of protein interactions while simultaneously providing a foundation for complementary targeted protein interaction studies with greater functional, mechanistic, and temporal resolution.
ONLINE EXPERIMENTAL METHODS
Clone Construction and Cell Culture
Stable cell lines expressing affinity-tagged bait proteins were created according to protocols described previously in detail4. Briefly, C-terminally HA-FLAG-tagged clones targeting human bait proteins were constructed from clones included in version 8.1 of the human ORFeome (http://horfdb.dfci.harvard.edu)14. All expression clones used in this study are available from the Dana Farber/Harvard Cancer Center DNA Resource Core Facility (http://dnaseq.med.harvard.edu/). Following sequence validation, clones were introduced into HEK293T, HCT116, or MCF10A cells (all from American Type Culture Collection) via lentiviral transfection. Cells were expanded under puromycin selection to obtain five 10-cm dishes per cell line prior to AP-MS. Bait proteins have been selected from the ORFeome for high-throughput AP-MS analysis in batches corresponding to individual 96-well plates. Plates have been selected for processing in random order. For AP-MS experiments in MCF10A cells, 1.15 × 10⁶ cells per 15 cm2 dish were harvested after 3 days (sub-confluent) or after 14 days in culture (contact inhibited) in order to allow for expulsion of YAP1 from the nucleus and Hippo pathway activation. MCF10A cells were grown in DMEM/F12 media supplemented with 5% horse serum, 20 ηg/ml EGF, 10 μg/ml insulin, 0.5 μg/ml hydrocortisone, 100 ng/ml cholera toxin, 50 U/ml penicillin, and 50 μg/ml streptomycin. All cell lines were found to be free of mycoplasma using Mycoplasma Plus PCR assay kit (Agilent). Karyotyping (GTG-banded karyotype) of Hela, HCT116, and HEK 293T cells for cell line validation was performed by Brigham and Women’s Hospital Cytogenomics Core Laboratory.
Affinity-Purification Mass Spectrometry
All affinity-purification mass spectrometry experiments were performed as presented previously in full4. Briefly, cell pellets were lysed in the presence of 50 mM Tris-HCl pH 7.5, 300 mM NaCl, 0.5% (v/v) NP40, followed by centrifugation and filtration to remove debris. Immunoprecipitation was achieved using immobilized and pre-washed mouse monoclonal α-HA agarose resin (Sigma-Aldrich, clone HA-7) that was incubated with clarified lysate for four hours at 4°C prior to removal of supernatant and four washes with lysis buffer followed by two washes with PBS (pH 7.2). Complexes were eluted in two steps using HA peptide in PBS at 37°C and subsequently underwent TCA precipitation. Baits were processed in batches corresponding to 96-well plates in the ORFeome collection; plates were processed in random order.
In preparation for LC-MS analysis, protein samples were reduced and digested with sequencing-grade trypsin (Promega). Peptides were then de-salted using homemade StageTips30 and approximately 1μg of peptides were loaded onto C18 reversed-phase microcapillary columns and analyzed on Thermo Fisher Q-Exactive mass spectrometers. Data acquisition methods were approximately 70 minutes long, including sample loading, gradient, and column re-equilibration. MS/MS spectra were acquired in data-dependent fashion targeting the top twenty precursors for MS2 analysis. Unless noted otherwise, a single biological replicate of each bait was subject to affinity purification followed by technical duplicate LC-MS analysis. For a complete description of data acquisition parameters, see Huttlin et al4.
Identification of Interacting Proteins
A brief synopsis of our methods for identifying peptides and proteins from LC-MS data and distinguishing bona fide interacting proteins from background is provided here. For full details, refer to Huttlin et al4. The BioPlex 2.0 network was generated by reanalyzing Sequest search results from the BioPlex 1.0 dataset, combined with additional new AP-MS datasets.
Sequest31 was used to match MS/MS spectra with peptide sequences from the Uniprot20 human protein database supplemented with sequences of GFP (our negative control), our FLAG-HA affinity tag, and common contaminant proteins. This version of the Uniprot database includes both SwissProt and Trembl entries and was current in 2013, at the outset of this project when the first AP-MS data were collected and searched. All protein sequences were included in forward and reversed orientations. Only fully tryptic peptides with 2 or fewer missed cleavages were considered and precursor and product ion mass tolerances were set to 50 ppm and 0.05 Da, respectively. The sole variable modification considered was oxidation of methionine (+15.9949). Target-decoy filtering32 was applied to control false discovery rates, employing a linear discriminant function for peptide filtering and probabilistic scoring at the protein level33. Linear discriminant analysis considered Xcorr, D-Cn, peptide length, charge state, fractions of ions matched, and precursor mass error to distinguish correct from incorrect identifications. Peptide-spectral matches from each run were filtered to a 1% protein-level FDR with additional entropy-based filtering4 to reduce the final dataset protein-level FDR to well under 1%. Protein identifications supported by only a single peptide were discarded as well. These additional post-search filters further reduced the dataset-level FDR by over 100-fold.
Scoring to identify high confidence candidate interacting proteins (HCIPs) was performed in multiple stages after combining technical duplicate analyses of each AP-MS experiment and mapping all protein ID’s to Entrez Gene ID’s to minimize technical issues due to protein isoforms. Protein abundances in each IP were quantified using spectral counts averaged across technical replicates. The CompPASS algorithm34,35 compared abundances of the proteins detected in each IP with their average levels across all other IPs, returning a Z-score that quantifies the extent that a protein’s abundance exceeds its average levels across the dataset as well as the empirical NWD-score that accounts for a protein’s abundance, frequency of detection, and consistency across duplicate analyses. Subsequent filtering based on PSM counts, entropy scoring, and each protein’s frequency of detection within each batch of samples minimized false positives, LC-carry-over and technical artifacts. Putative bait-prey interactions were further filtered using CompPASS-Plus4, a Naïve Bayes classifier that learns to distinguish true interacting proteins from nonspecific background and false positive identifications based on CompPASS scores and several other metrics described previously. The algorithm modeled true interactions using examples from STRING36 and GeneMania37 databases. False positive protein identifications were modeled using decoy identifications that had survived previous filters. All remaining data were used to model background. Cross-validation was applied by batch, with each 96-well plate of IPs scored using a model trained on ~57 different plates. Bait-prey interactions were then assembled across IPs to produce a single network, combining scores of reciprocal interactions to increase their weight. BioPlex 2.0 was obtained by pruning this network to retain only those interactions that earned scores above 0.75, as described previously4. See Supplementary Table 1 for a list of baits as well as a complete list of interactions.
Comparison with Interaction Databases
BioPlex 2.0 interaction data were compared with data from BioGRID38, CORUM15, STRING36, GeneMania37, and MINT39 databases as described previously4. Because the BioPlex 2.0 dataset incorporates the contents of BioPlex 1.0 and data from this project has been deposited directly into BioGRID, released to the scientific community via the project website (http://bioplex.hms.harvard.edu), and otherwise distributed40 at intervals throughout the project, snapshots of these databases predating public disclosure of any BioPlex data were used to ensure that no interactions derived from BioPlex were included in the comparison.
Quantifying Coverage of Protein Families
In Extended Data Figure 1a, several data sources were used to determine the fractions of various protein families included as baits or preys in BioPlex 1.0 or 2.0. The list of human kinases was downloaded from kinase.com (http://kinase.com/web/current/human/; Dec 07 Update). Mitochondrial proteins were taken from Mitocarta 2.041. Lists of transcription factors and chromatin-remodeling factors were drawn from www.bioguo.org. Drug target lists were taken from www.drugbank.ca. Cancer genes were taken from Vogelstein et al.42 Disease genes were extracted from the curated set of disease-gene associations in the DisGeNET database25. “Essential” genes were taken from recent papers describing CRISPR-Cas9 screening to identify human genes that confer a fitness advantage6,7. In each case, protein identifiers were converted to Entrez Gene IDs, if necessary, and compared against those gene products included in either interaction network.
Subcellular Localization, Domain Association, and GO Enrichment Analyses
Each of these analyses was performed exactly as described previously4. Brief summaries follow.
Subcellular localization predictions relied upon localization information provided for a subset of proteins by the Uniprot website (www.uniprot.org) in March 2016. These localization terms were manually condensed to 13 core localizations: Nucleus, Cytoplasm, Cytoskeleton, Endosome, ER, Extracellular, Golgi, Lysosome, Mitochondrion, Peroxisome, Plasma Membrane, Vesicle, and Cell Projection. Fisher’s Exact Test was used to calculate the enrichment of each term among each protein’s primary and secondary neighbors, with multiple testing correction43. Predictions were made when enrichments were significant at an adjusted FDR of 1%. Localization predictions are provided in Supplementary Table 3.
Domain-domain associations were uncovered by mapping PFAM domains onto the 56,553 protein-protein interactions in the BioPlex 2.0 network. After counting the numbers of interactions involving each domain individually and the number of interactions in which the domains were brought together within separate proteins, Fisher’s Exact Test was used to evaluate significance with subsequent correction for multiple hypothesis testing. Domains were considered significantly associated at an adjusted p-value less than 0.01. Significant domain-domain associations are summarized in Supplementary Table 4.
The enrichment of GO44 terms and PFAM22 domains was determined among each protein’s immediate neighbors and for each network community using Fisher’s Exact Test with multiple testing correction43. GO and PFAM data were downloaded from the Uniprot website (www.uniprot.org) in March 2016. Only terms occurring at least twice were considered. Enrichments of GO terms and PFAM domains among each protein’s neighbors are summarized in Supplementary Table 5.
Community Detection via MCL Clustering
The Markov Clustering Algorithm (MCL)5 was employed to partition the BioPlex 2.0 network into communities of tightly interconnected proteins, using an implementation provided by the algorithm’s creator, Stijn van Dongen, at micans.org/mcl/. The option –force-connected=y was used to ensure that final clusters correspond to connected components. The MCL algorithm requires specification of one parameter, the inflation parameter, which controls the granularity of the clusters that are produced. Clustering of BioPlex 2.0 was repeated for several values of the inflation parameter between 1.5 and 2.5. After comparing experimentally-derived clusters with known protein complexes, an inflation parameter of 2.0 was selected for final clustering. Clusters containing fewer than three proteins were discarded, producing a final list of 1320 protein communities. Each cluster and its members are summarized in Supplementary Table 6; GO terms and PFAM domains enriched in each community are provided in Supplementary Table 7.
One important question has been the extent to which each of the clusters observed in BioPlex 2.0 is also visible in BioPlex 1.0. To address this question, we mapped each cluster detected in BioPlex 2.0 onto the BioPlex 1.0 network. If a given cluster is also reflected in the BioPlex 1.0, then we would expect to see an enrichment of interactions; conversely, if interactions are not enriched among the relevant set of proteins above background, then there is no evidence to support the indicated cluster. After mapping each cluster of tightly interconnected proteins from BioPlex 2.0 onto the BioPlex 1.0 network, we used a binomial test to evaluate the enrichment of BioPlex 1.0 interactions among matching proteins. The probability of interaction was estimated from the fraction of all possible interactions in the BioPlex 1.0 network that was actually detected (8.08×10⁻⁴); the number of trials was taken to be the maximum number of interactions possible among those proteins within the cluster that were part of the BioPlex 1.0 network; the number of interactions actually observed in this portion of BioPlex 1.0 was taken as the number of successes. A one-sided binomial test was performed and a correction for multiple testing was applied43. Overall, 45% of complexes detected in BioPlex 2.0 did not show any enrichment for protein interactions in BioPlex 1.0, suggesting that these were macromolecular complexes not covered in the first interaction network. Moreover, although the remaining 55% of complexes were at least partially reflected in BioPlex 1.0, the density of their coverage consistently increased with incorporation of additional AP-MS data into the BioPlex 2.0 network.
In addition to using MCL clustering to partition the BioPlex 2.0 network into individual clusters of tightly interconnected proteins, we also wanted to explore patterns of interconnection within the network that relate these clusters to each other. For this purpose, we searched for pairs of clusters that were connected to each other through interactions among their constituent proteins more often than would be expected. First, the full set of 56,553 interactions was trimmed to include only those interactions connecting one cluster with another and the set of all cluster pairs connected by one or more interactions was identified. For each of these pairs of clusters, the number of interactions connecting the pair was determined, as were the numbers of interactions involving each cluster individually. Fisher’s Exact Test was used to identify pairs of clusters that were enriched for interactions among them, followed by multiple testing correction43. The 929 cluster-cluster associations that were accepted at a 1% FDR are displayed in Figure 3a and Extended Data Figure 9 and are provided in Supplementary Table 6. GO and PFAM enrichments for each community are summarized in Supplementary Table 7.
Fitness Gene Network Analysis
The first step toward examining network properties of fitness proteins was to combine lists of proteins associated with increased cellular fitness from Blomen et al. and Wang et al. into a single composite list6,7. For our purposes, we used the union of both lists to define the set of fitness proteins. Entrez gene IDs were associated with proteins on this list and mapped onto the BioPlex 2.0 network.
To assess network properties of fitness proteins, the composite list of proteins associated with increased cellular fitness was superimposed onto the BioPlex network, effectively subdividing all proteins in the network into two groups corresponding to fitness and non-fitness proteins. Vertex degrees, local clustering coefficients, and eigenvector centralities were then computed and averaged across all fitness proteins. To evaluate whether these values differed for fitness proteins compared to randomly selected protein subsets of equivalent size, fitness and non-fitness labels were scrambled across the network and a new average was calculated for the randomized list of fitness proteins. This process was repeated 10,000 times to define null distributions for each statistic. Since these distributions were normally distributed, Gaussian distributions were fitted to each and used to assign z-scores and p-values for each statistic associated with the true set of fitness proteins. To evaluate graph assortativity, the BioPlex network was subdivided into fitness and non-fitness proteins and the assortativity of the partitioned graph was calculated. This process was repeated 10,000 times, randomizing fitness and non-fitness labels, and the resulting distribution was fitted to a Gaussian distribution and used to determine a z-score and p-value associated with the true assortativity.
A second goal has been to identify clusters that are enriched with fitness proteins. For this purpose, a one-sided hypergeometric test was used to evaluate the enrichment of fitness proteins, taking into account the size of the cluster, the size of the BioPlex network, and the fraction of network proteins that were associated with increased cellular fitness. Only clusters containing two or more fitness proteins were considered for this analysis. Once a multiple testing correction43 was applied, 53 communities were found to be enriched with fitness proteins at a 1% FDR. These clusters are summarized in Extended Data Figure 9. Levels of enrichment are summarized for those communities containing two or more cellular fitness proteins in Supplementary Table 8.
To assess the tendency for clusters containing fitness proteins or enriched for fitness proteins to be centrally located within the cluster-cluster association network (Figure 3a), all clusters were sorted according to their eigenvector centralities. The Kolmogorov-Smirnov test was used to compare distributions of clusters enriched and not enriched with fitness proteins within the ranked list of all clusters. This process was repeated to compare distributions of clusters containing multiple fitness proteins with clusters containing 0 or 1 fitness proteins, as shown in Figure 3d.
Associating Protein Complexes and Disease Processes
The basis for our study of protein complexes and disease was the DisGeNET database of disease-gene associations25. For our analysis we employed the full database that relates over 16,000 genes with 13,000 partially redundant disease classifications. Each disease state and its associated proteins were then mapped onto each BioPlex 2.0 complex and evaluated for enrichment using a hypergeometric test, taking into account the size of the complex, the number of disease proteins in the complex, the number of disease proteins within the network, and the total network size. This process was repeated for each community and for each disease state. Following multiple testing correction43, those complexes enriched with proteins involved with each disease at a 1% FDR were deemed associated. The resulting disease-complex associations were assembled into a network in which clusters and disease states are both represented as nodes, with edges connecting clusters with significantly-associated disease states, depicted in full in Figure 4a. All significant disease-cluster associations are provided in Supplementary Table 8.
The eigenvector centralities assigned to disease states within the composite disease-community network were used to compare across a range of disease states. Disease classifications were taken from the DisGeNET database as reported in their SQLite download. All disease states in the network were ranked according to increasing eigenvector centrality. For each disease classification (e.g. “Neoplasms”), the Kolmogorov-Smirnov test was used to compare the distributions of matching and non-matching disease states within the entire ranked list. After multiple testing correction, disease states that appeared differentially distributed with respect to eigenvector centrality at a 1% FDR were identified and highlighted in Figure 4b.
Data Availability
The BioPlex 2.0 network and its underlying data are available to the scientific community in several formats. First, all interactions in the BioPlex network have been deposited in the BioGRID protein interaction database. Second, we have created a website devoted to the project (http://bioplex.hms.harvard.edu) which provides tools to download i) the interactions that make up BioPlex 1.0 and 2.0; ii) a customized viewer that enables browsing of either network to examine the interactions of specific proteins; iii) an interface for download of nearly 12,000 individual RAW files containing mass spectrometry data from individual AP-MS experiments; and iv) an R package and web-based tool for performing CompPASS analyses. Third, the BioPlex 2.0 network as bait-prey pairs has been incorporated into NDEx40, a web-based platform for biological Network Data Exchange. Fourth, our RAW files have been submitted for inclusion in ProteomicsDB45. Finally, all RAW files (3Tb) from this study will be provided to investigators upon request using investigator-provided hard drives. Finally, a table in. tsv format containing all proteins and spectral count information for all 5891 AP-MS experiments reported here is available for download at the BioPlex website.
Validation of interactions by IP-Western in 293T cells and AP-MS in MCF10A cells
HEK293T cells were transfected with FLAG-HA-GFP control plasmid, C13orf18-GFP, GFP-BECN1, or RUFY1-FLAG-HA plasmids, and after 48h, cells were harvested in lysis buffer (50mM Tris pH 7.5, 150mM NaCl, 1% NP-40), with protease and phosphatase inhibitors (Roche) on ice. Lysates were cleared by centrifugation, and subjected to affinity purification using α-GFP antibodies (Chromotek, GFP-Trap, GTMA-20) or α-FLAG magnetic beads (Sigma, A2220)) for 2 hours at 4°C. Beads were washed 4× with lysis buffer, and subsequently subjected to SDS-PAGE and immunoblotting with the following antibodies: BECN1 (Cell Signaling, clone D40C5), GFP (Roche, mouse IgG clones 7.1 and 13.1), C13orf18 (Proteintech, 21183-1-AP), and HA (Biolegend, clone HA.11).
For validation of Hippo pathway interactions within BioPlex 2.0, we performed AP-MS experiments in MCF10A cells. Unlike 293T cells, MCF10A cells undergo contact inhibition and activate the Hippo signaling pathway, therefore we employed cells under both sub-confluent and confluent conditions wherein YAP1 expulsion from the nucleus was verified by immunofluorescence (see Clone Construction and Cell Culture). Affinity purification was performed essentially as described previously34, but eluted α-HA immune complexes (Sigma-Aldrich, clone HA-7) were analyzed in two ways. First, immune complexes for PDLIM7, MAGI1, YAP1, WWC1, NF2, and MPP5 (Replicate 1) were subjected to LC-MS/MS analysis on an LTQ-Velos instrument and HCIPs identified using CompPASS34 in combination with a false positive background data set derived in MCF10A cells46. The second replicate set for PDLIM7, MAGI1, YAP1, WWC1, NF2, and MPP5, as well as both replicates for PTPN14 and INADL, were processed identically to the first set except that the HA eluted proteins were reduced and alkylated with DTT and iodoacetamide prior to trypsin digestion, and all the digested peptides corresponding to one sub-confluent and one confluent α-HA immunoprecipitation were labeled heavy and light respectively, by reductive dimethylation47. Sub-confluent and confluent sample pairs corresponding to each bait were mixed to normalize the amount of bait present in each heavy and light fraction to 1:1 and analyzed on an Orbitrap Elite hybrid ion trap-orbitrap mass spectrometer (Thermo). Complexes from each growth condition were deconvolved using LDA parameters that filtered for either heavy-only or light-only labeled peptides. The heavy or light specific search results were subsequently imported into CompPASS for protein interaction analysis. Spectral count and CompPASS score data for the MCF10A dataset is provided in Supplemental Data Table 10. α-PTPN14 antibodies were from Sigma (GW21498A).
Quantitative analysis of KIAA0196 association with WASH complex components
We employed CRISPR-Cas9 gene editing to knock out KIAA0196 using the gRNA sequence [GTCTAAGCCATTTAGACCAA] as described48. The KIAA0196 open reading frame (kind gift of Dr. Christoph Clemen, University of Cologne) was cloned into pLenti-NTAP-IRES-Puro and expressed in KIAA0196−/− cells after selection using Puromycin (1 μg/mL). Immunoprecipitation with anti-FLAG (Sigma M2) antibodies, trypsinization, TMT labeling, analysis by mass spectrometry, and quantification was performed as described previously4. Parallel immune complexes or whole cell lysates were subjected to immunoblotting with α-WASH1 (Sigma, SAB4200373), α-KIAA0196 (Santa Cruz Biotechnology, sc-87442), α-KIAA1033 (Bethyl Labs, A304-919A), α-CCDC53 (Proteintech, 24445-1-AP), α-PCNA (Santa Cruz Biotechnology, sc-56), or α-actin (Santa Cruz Biotechnology, sc-69879) and immunoblot signals quantified using Protein Simple M in biological triplicate.
Immunofluorescence
HeLa cells (ATCC) were plated on glass coverslips (Zeiss) and transiently transduced with lentiviral vectors expressing C-FLAG-HA tagged baits. At 48h post infection, cells were fixed with 4% paraformaldehyde for 15 minutes at room temperature. Cells were washed in PBS, then blocked for 1h with 5% normal goat serum (Cell Signaling Technology) in PBS containing 0.3% Triton X-100 (Sigma). Coverslips were incubated with α-HA antibodies (mouse monoclonal, clone HA.11, BioLegend) or α-HA plus α-TOMM20 (rabbit polyclonal mitochondrial marker, Santa Cruz Biotechnology, clone FL-145, catalog # 11415) for 2h at room temperature in a humidified chamber. Cells were washed three times with PBS, then incubated for 1h with appropriate Alexa-Fluor-conjugated secondary antibodies (ThermoFisher). Nuclei were stained with Hoechst, and cells were washed three times with PBS and mounted on slides using Prolong Gold mounting media (ThermoFisher). All images were collected with a Yokogawa CSU-X1 spinning disk confocal with Spectral Applied Research Aurora Borealis modification on a Nikon Ti-E inverted microscope using a X100 Plan Apo NA 1.4 objective lens (Nikon Imaging Center, Harvard Medical School). Confocal images were acquired with a Hamamatsu ORCA-AG cooled CCD camera controlled with MetaMorph 7 software (Molecular Devices). Fluorophores were excited using a Spectral Applied Research LMM-5 laser merge module with AOTF controlled solid state lasers (488nm and 561nm). A Lumencor SOLA fluorescence light source was used for imaging Hoechst staining. Z-series optical sections were collected with a step size of 0.2μm, using the internal Nikon Ti-E focus motor and stacked using MetaMorph to construct maximum intensity projections.
Extended text concerning interaction validation experiments
We performed three major validation experiments using either: 1) analysis of a dozen bait proteins in both HCT116 colon cells and HEK293T cells to examine overlap in interaction partners, 2) reciprocal AP-MS experiments directed at interacting proteins for a set of 14-3-3 proteins, and 3) analysis of the PDLIM7-PTPN14-YAP1 adhesion network in MCF10A cells.
Analysis of interactions in HCT116 cells
As a validation approach, we selected 12 largely unstudied proteins displaying a range of interaction partners from one to twenty-five in HEK293T cells and performed AP-MS in HCT116 cells, a cell line of distinct tissue origin from HEK293T cells. After identification of HCIPs for proteins in HCT116 cells, we determined the interactions in common with HEK293T cells (Extended data Fig. 1b–m). Over the 12 bait proteins identified, we observed 30–100% validation of interactions seen for individual baits in HEK293T cells. Cumulatively, this reflected an overall 60% validation (92 of 147 interactions seen in HEC293T cells were seen in HCT116). This rate of validation is comparable to that seen in focused studies examining F-box protein interactors in these two cell lines (51%)49. Thus, a substantial fraction of interactions seen in HEK293T cells are recapitulated in HCT116 cells.
Analysis of proteins interacting with 14-3-3 proteins
14-3-3 proteins represent a well-studied group of 7 proteins (YWHAB, YWHAE, YWHAZ, YWHAH, YWHAQ, YWHAG, and SFN) that typically associate with phosphorylated proteins. Thirty-nine baits in BioPlex 2.0 were found to interact with one or more of these 14-3-3 proteins, with YWHAZ being detected most frequently (35 baits) and SFN being detected the least frequently (4 baits) (Extended Data Fig. 2). Seventeen of these proteins are not known to interact with 14-3-3 proteins based on BioGrid. Because only the atypical 14-3-3 protein SFN had been targeted as a bait in BioPlex 2.0, the remaining six 14-3-3 proteins were submitted to our standard AP-MS pipeline using ORFEOME 8.1 clones; while the clone for YWHAE failed at the sequence validation stage, the remaining five 14-3-3 proteins were processed successfully, identifying 130–360 HCIP’s (Supplementary Table 2). While eight of 39 BioPlex 2.0 baits that had been observed to interact with one or more 14-3-3 proteins were not detected in 293T cells and thus may be impossible to detect in reciprocal IP’s, 63% of interactions eligible for reciprocal detection were confirmed (Extended Data Fig. 2a–c). This demonstrates that BioPlex 2.0 may reliably reveal novel reciprocally interacting partners even for proteins as well studied as 14-3-3 proteins.
Validation of the PDLIM7-PTPN14-YAP1 network in MCF10A cells
PTPN14 is a protein phosphatase that has recently been found to associate with several proteins within the Hippo pathway involving the transcription factor YAP1. The Hippo pathway is regulated by contact inhibition, and promotes YAP1 sequestration in the cytoplasm50. BioPlex 2.0 contains a highly connected group of proteins centered on PTPN14, MAGI1, MPP5, LIN7A/C, and INADL (Extended Data Fig. 2d). This network contained several interactions not seen in BioGrid. In order to validate these interactions, we performed an AP-MS analysis or IP-western analysis of PTPN14, MAGI1, MPP5, PDLIM7, INADL, WWC1, NF2, and YAP1 after stable expression in MCF10A cells in both sub-confluent and confluent states. This series of experiments strongly validated interactions seen in HEK293T cells (Extended Data Fig. 2d,f) with 65% of eligible interactions being seen in both cell lines, further validating our method and the ability of BioPlex 2.0 to robustly identify interactions. Furthermore, 63% of interactions identified in both BioPlex 2.0 and MCF10A cells were novel, having not been previously described in several previous interaction profiling experiments (Extended Data Fig. 2g).
Overall, these three lines of study indicate the ability of BioPlex 2.0 to identify interactions that can be validated reciprocally or in other cell lines.
Extended Data
Extended Data Figure 1. BioPlex network coverage and validation of interactions for a set of poorly studied proteins in BioPlex 2.0 using HCT116 cells.
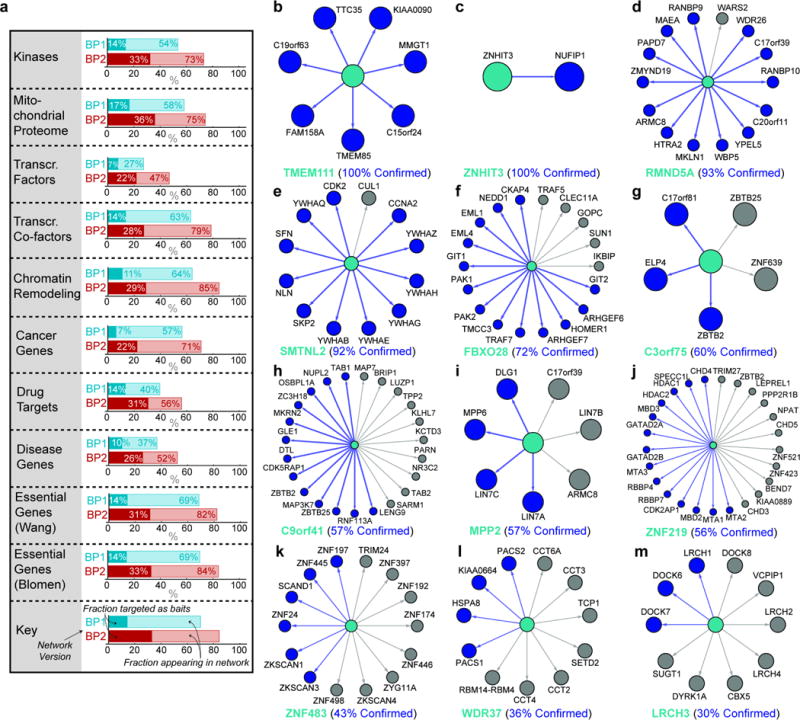
a, BioPlex network coverage of selected protein classes. Light shades represent total proteins, while dark shades represent baits targeted for AP-MS. BioPlex 1.0 is depicted in blue shades while BioPlex 2.0 is highlighted in red. b – m, The indicated bait proteins (teal) were expressed in HCT116 cells and α-HA immune complexes analyzed by mass spectrometry. HCIPs were determined using CompPASS-Plus. Interactions observed in both HCT116 and HEK293T cells are indicated with blue edges and nodes. Interactions seen in HEK293T but not HCT116 are shown in grey edges and nodes. b, TMEM111; c, ZNHIT3; d, RMND5A; e, SMTNL2; f, FBXO28; g, C3orf75; h, c9orf41; i, MPP2; j, ZNF219; k, ZNF483; l, WDR37; m, LRCH3.
Extended Data Figure 2. Validation of interactions in BioPlex 2.0.
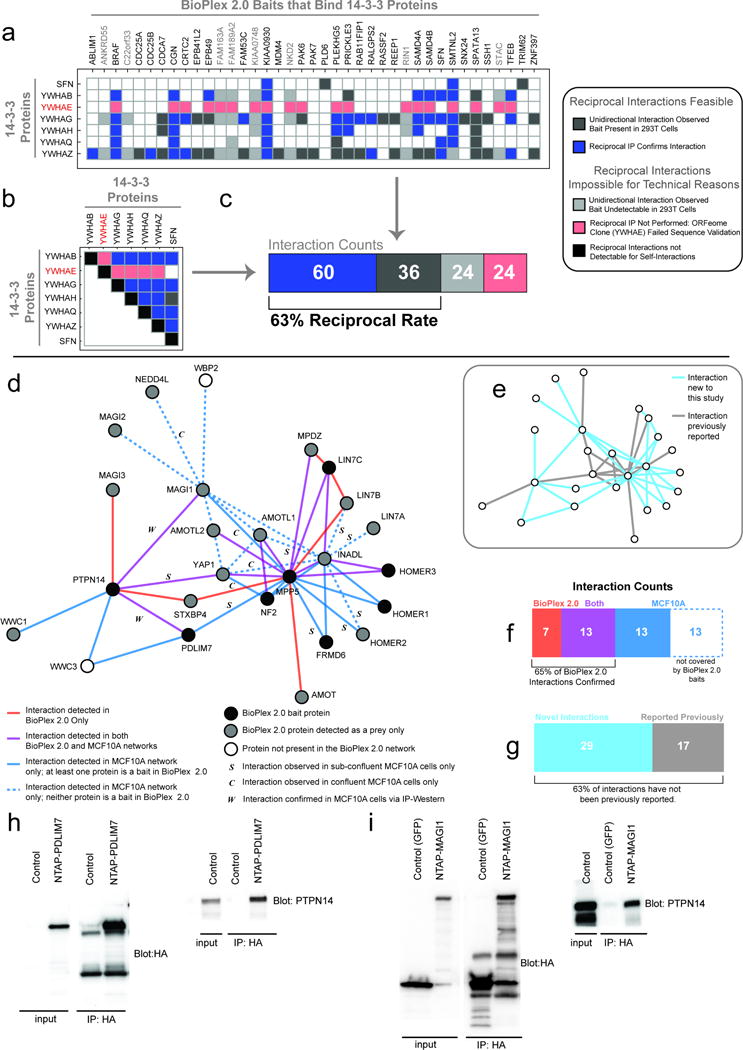
a–c, Systematic analysis of 14-3-3 interactions by reciprocal AP-MS. a, the matrix relates 39 BioPlex 2.0 baits (horizontal) with six 14-3-3 proteins (left) which were detected as preys one or more times. Colored (i.e. non-white) boxes indicate interactions that were observed in BioPlex 2.0; the specific color indicates the outcome of a reciprocal AP-MS experiment targeting the 14-3-3 protein instead. Boxes shaded red could not be detected in the reciprocal direction because the 14-3-3 protein YWHAE failed sequence validation and could not be subjected to AP-MS analysis; boxes shaded light gray were also not observed in reciprocal orientation, likely because those particular proteins (shaded in gray across the top) were not detectable in HEK293T cells and are not expected to appear as preys in the 14-3-3 pull-downs. Blue boxes indicate interactions that were observed in reciprocal orientation, while dark gray boxes were not observed in reciprocal orientation. Note that SFN is listed in both horizontal and vertical directions because it was a prey in the BioPlex 2.0 network. b, reciprocal interactions among 14-3-3 proteins. Shading is the same as above, with black indicating that self-interactions are not considered for reciprocal analysis. c, summary of interaction results across panels a and b. Overall, more than 40% of 14-3-3 interactions were confirmed via reciprocal IP; after accounting for YWHAE and those BioPlex baits that are not detected in HEK293T cells in the absence of over-expression, the reciprocal rate rises to 63% of eligible interactions. d–i, validation of a PDLIM7-PTPN14 BioPlex 2.0 network in MCF10A cells. This network is regulated by the Hippo kinase system, which is activated upon contact inhibition of cell proliferation. In order to validate this network, including previously unreported interactions, a series of AP-MS experiments were performed in proliferating or contact inhibited MCF10A cells and HCIPs identified using CompPASS. d, summary of interactions identified in BioPlex 2.0 or MCF10A AP-MS experiments. Edges detected in BioPlex 2.0 only are red, while edges detected in both cell lines are purple and edges unique to the MCF10A IP’s are shaded blue. MCF10A-specific edges that could not appear in BioPlex 2.0 because neither of their constituent proteins has been targeted as a bait are shown as dashed lines. Nodes are colored to represent their status in the BioPlex network: black nodes have been targeted as baits in BioPlex 2.0 and gray nodes appear as preys, while white nodes do not appear in BioPlex at all. Edges observed in MCF10A experiments are assumed to have been detected in both confluent and sub-confluent cells, unless they have been labeled with an “S” or a “C”, implying that they were detected only under sub-confluent or confluent conditions, respectively. Interactions further confirmed via IP-Western are labeled with “W” (see panels h and i). e, duplicate network highlighting previously un-reported edges within the combined BioPlex 2.0/MCF10A Hippo interaction network. Edges highlighted in gray have been reported previously, while new edges are highlighted in blue. f, summary of overlap between BioPlex 2.0 and the MCF10A interaction networks. 65% of eligible interactions were confirmed. g, summary of novel and previously reported interaction counts in the combined Hippo network: 63% of interactions have not been previously reported. H–I, IP-Western confirmation of interactions among PDLIM7-PTPN14 (h) and PTPN14-MAGI1 (i).
Extended Data Figure 3. BioPlex 2.0 Enables Subcellular Localization Prediction for Additional Uncharacterized Proteins.
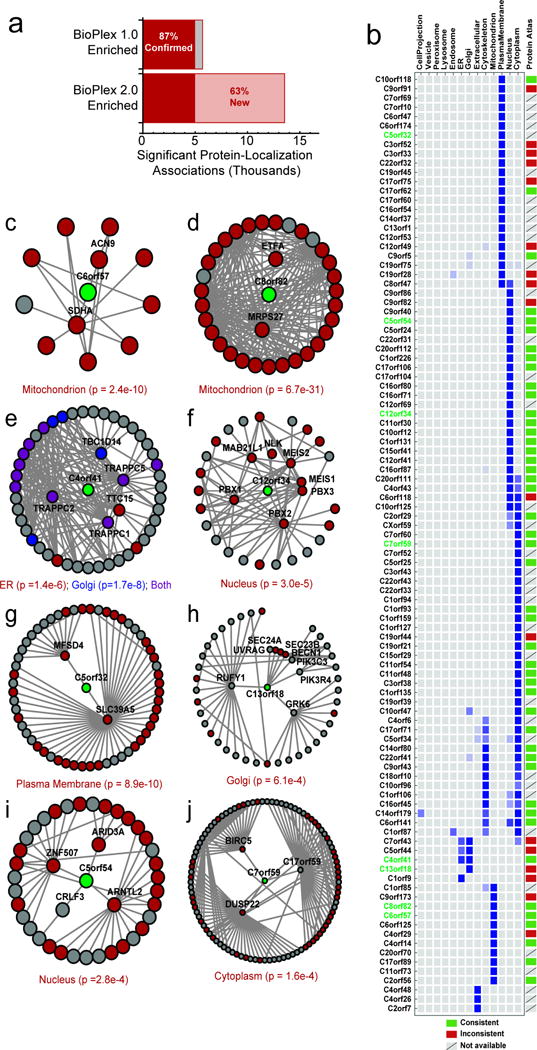
a, increased interaction density expands subcellular localization predictions from BioPlex 2.0. b, subcellular localization predictions for a selection of uncharacterized human proteins for which no confident prediction could be made in BioPlex 1.0. Where possible, the figure indicates whether predicted localization is consistent with the Human Protein Atlas (Uhlen et al. 2015). c – j, subnetworks highlighting primary and secondary neighbors for selected uncharacterized human proteins whose subcellular localization can be predicted using the BioPlex network. Nodes are colored according to subcellular localization data provided by UniProt. P-values were calculated by Fisher’s Exact Test as described in Online Methods with multiple testing correction. Localizations depicted in panels c, e, g, and i are consistent with recent characterization as listed in UniProt; The localization given in panel d is consistent with MitoCarta 2.0 (Calvo et al. 2015 Nuc. Acids Res.).
Extended Data Figure 4. Validation of subcellular localization predictions using α-HA immunofluorescence.
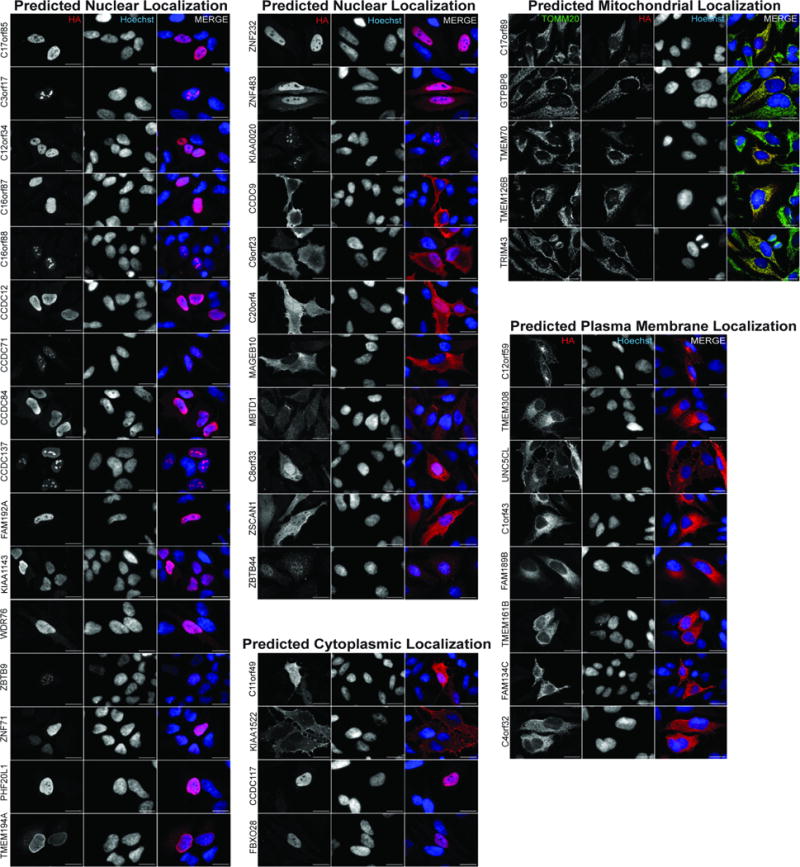
The indicated bait proteins fused at their C-terminus with an HA tag were expressed after transient infection of lentiviruses at low multiplicity of infection and after 2 days, cells were fixed and subjected to α-HA-based immunofluorescence (red). Nuclei were stained with Hoechst. For baits with predicted mitochondrial localization, cells were co-stained with α-TOMM20 antibodies (green). Z-series optical sections were acquired via spinning disk confocal microscopy; maximum intensity projections are shown. Scale bar=20 μm.
Extended Data Figure 5. Increased Scope of BioPlex 2.0 Network Reveals Additional Domain-Domain Associations.
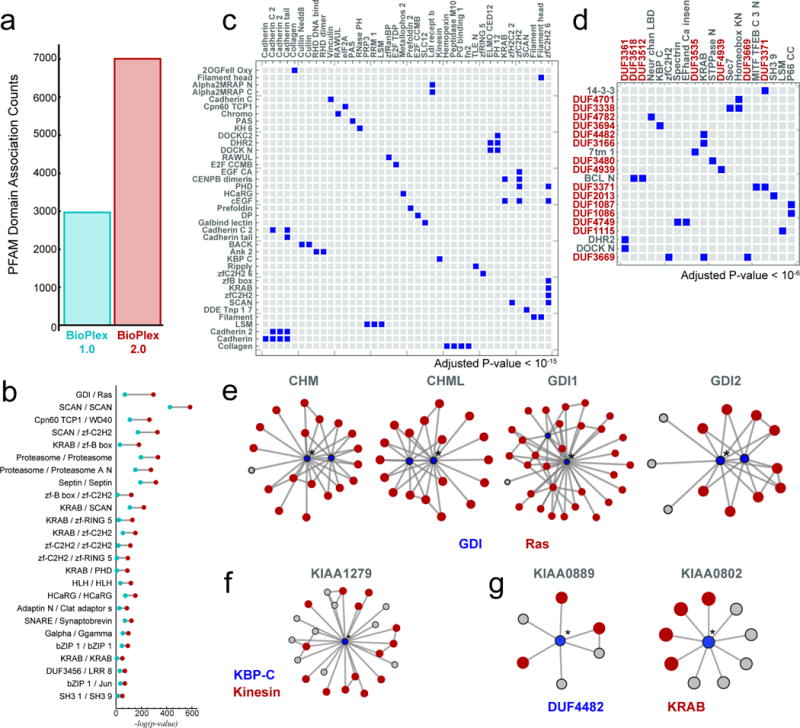
a, numbers of PFAM domain associations detected within BioPlex 1.0 and 2.0 interaction networks. b, a selection of domain interactions detected in both networks highlighting increased significance owing to greater coverage of the BioPlex 2.0 network (red) versus its earlier form (blue). c, a subset of domain-domain associations detected within BioPlex 2.0, but not BioPlex 1.0. Although over 4000 new domain-domain associations were detected overall (panel a; Benjamini-Hochberg adjusted p-value < 0.01), for purposes of display only domain associations with p-values < 10−15 are shown. d, selected domain-domain associations involving domains of unknown function (DUF*); an adjusted p-value smaller than 10−6 was required. e – g, subnetworks highlighting interactions that underlie associations among selected domain pairs. Blue and red shading highlights proteins bearing the indicated domains. Asterisks denote central proteins whose names are denoted above each subnetwork. e, GDI/Ras association; f, KBP-C/Kinesin association; g, DUF4482/KRAB association.
Extended Data Figure 6. Cullin Domain Associations Reflect Regulatory Proteins and Substrate Adaptors.
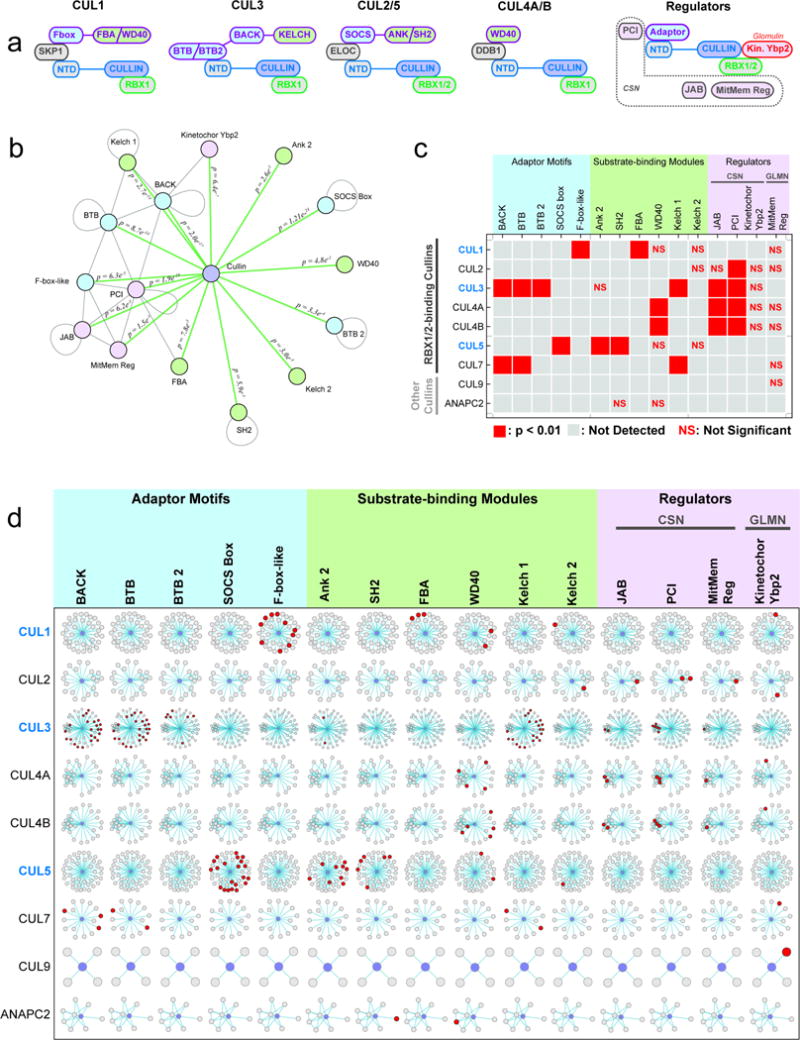
a, modular structure of cullin-RING E3 ubiquitin ligases (CRL). Edge colors unite domain(s) within the same protein molecules. Shading highlights individual domains as cullins (purple), adaptor proteins (light blue), substrate-binding modules (green), or other (gray). CSN: Cop9/signalsome. b, Cullin domain associations. Edges connect domains that were found to associate with each other more frequently than expected (see Online Methods). P-values were calculated by Fisher’s Exact Test with multiple testing correction. Self-loops indicate domains that were found to preferentially associate with other domains containing the same domain. Nodes are colored to reflect protein function as described in part a. c–d, pairwise enrichment of the indicated PFAM domains among neighbors of each indicated cullin-domain-containing protein. Proteins that have been specifically targeted for AP-MS as baits are highlighted in blue; those that appear as preys only are black. Domains are grouped by function with color coding as described above. CSN: Cop9/signalsome; GLMN: Glomulin. c, Red boxes indicate significant enrichment (p < 0.01) after multiple testing correction; NS indicates the specified domain was found, but significance thresholds were not met. d, networks depict the immediate neighbors of each cullin-domain-containing protein (center, blue). Neighbors that contain the indicated domains are highlighted in red.
Extended Data Figure 7. BioPlex 2.0 Expands Functional Insights into Uncharacterized Proteins.
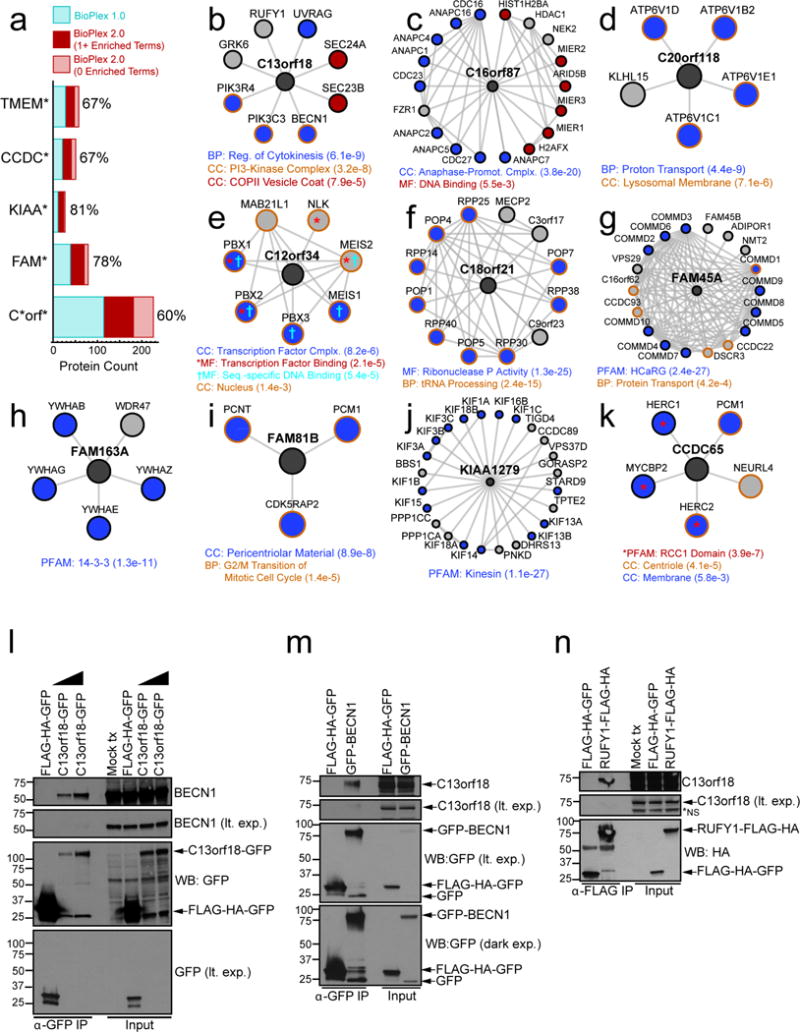
a, stacked bar graph depicting the number of baits targeted in BioPlex 1.0 and BioPlex 2.0 with Gene Symbols matching each pattern; BioPlex 2.0 matches have been subdivided to indicate the fraction that are associated with one or more enriched functional classes (hypergeometric test; Benjamini-Hochberg adjusted p-value < 0.01). This fraction is also expressed as a percentage for each bar. b – k, nearest neighbor sub-networks centered on selected human proteins with limited prior characterization. Color coding is used to highlight proteins that match any enriched functional categories. l–n, Validation of C13orf18 association with components of the BECN1 complex (panel h). Extracts prepared from 293T cells expressing the indicated constructs were subjected to affinity purification using α-GFP resin (l,m) or α-FLAG magnetic beads (n), followed by immunoblotting with α-BECN1 or α-C13orf18 antibodies.
Extended Data Figure 8. MCL Clustering Subdivides the BioPlex 2.0 Network into Clusters of Functionally Associated Proteins.
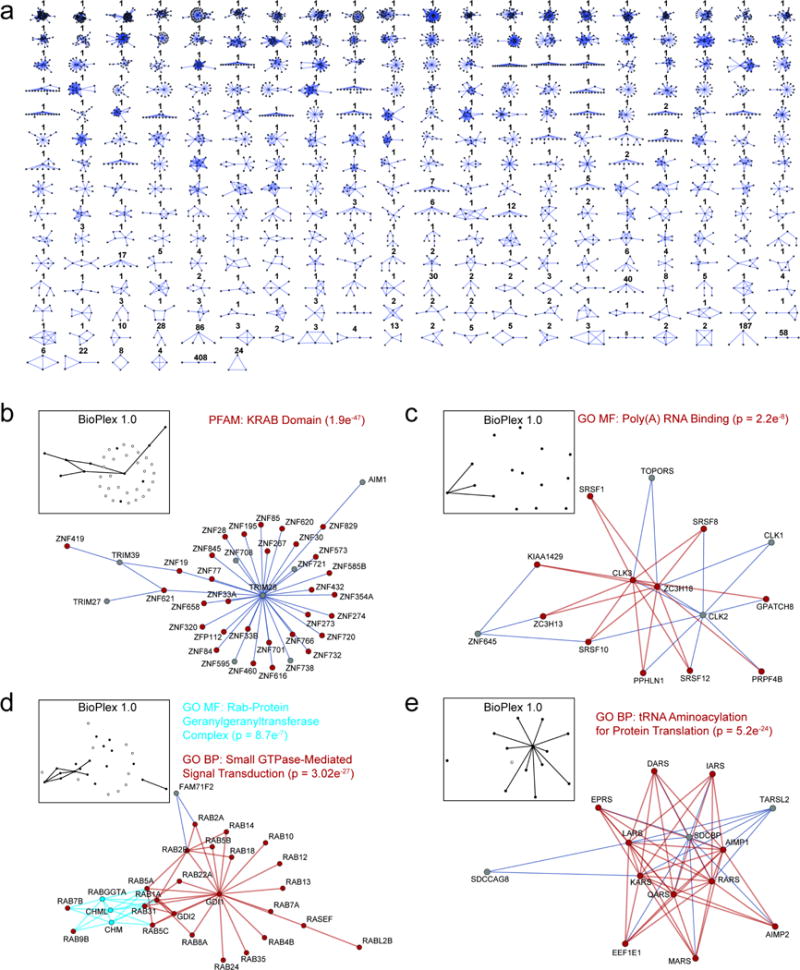
a, summary of subnetwork topologies for all 1320 complexes. Numbers indicate the counts of complexes matching each topology. b–e, selected protein complexes that associate proteins with related functions. Colored nodes and edges associate individual proteins with enriched classifications. Inset diagrams indicate complex coverage in BioPlex 1.0. Black nodes and edges indicate proteins and interactions that were present in the BioPlex 1.0; empty nodes depict proteins from the BioPlex 2.0 community that were not detected in BioPlex 1.0.
Extended Data Figure 9. Network Properties and Community Distribution of Fitness Genes.
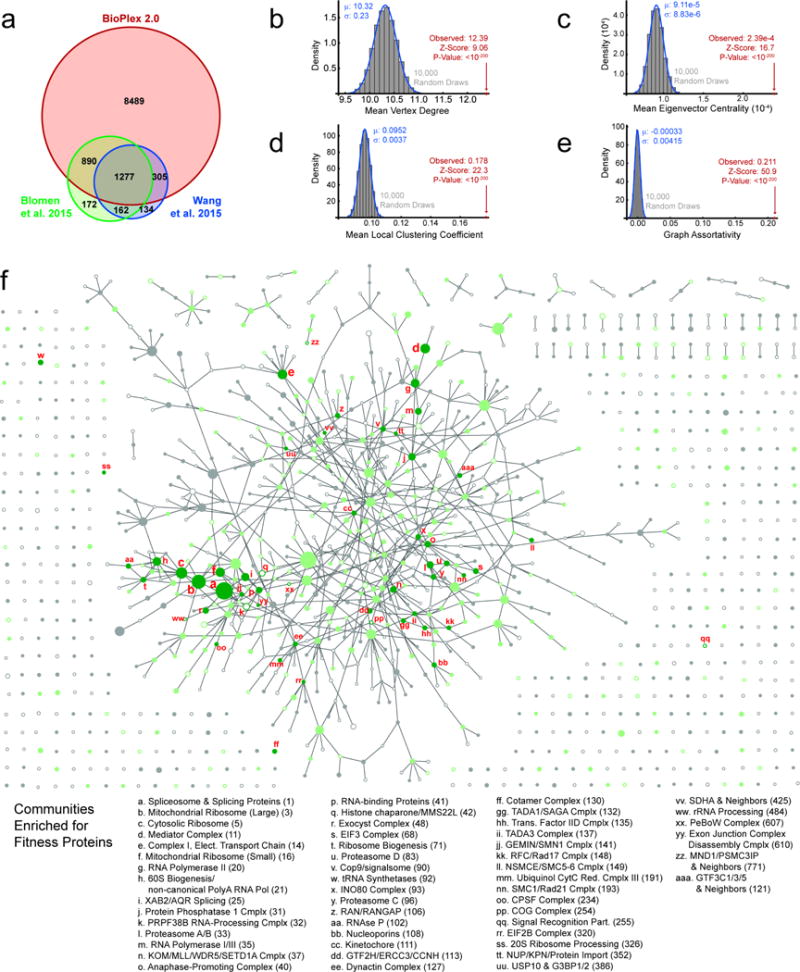
a. Overlap among BioPlex 2.0 and two published lists of cellular fitness genes. b–e, simulations reveal distinctive network properties of cellular fitness genes (see Online Methods for details). b, mean vertex degree; c, mean eigenvector centrality; d, mean local clustering coefficient; e, graph assortativity. f, expanded view of the BioPlex community network from Figure 3a, including descriptions of 53 communities that are enriched for cellular fitness proteins. Numbers after each community description correspond to cluster indices as found in Supplementary Tables 6 – 8.
Extended Data Figure 10. The BioPlex interaction network and hereditary disease: Patient mutations in the Hereditary Spastic Paraglegia protein KIAA0196/SPG8 affect formation of the WASH complex.
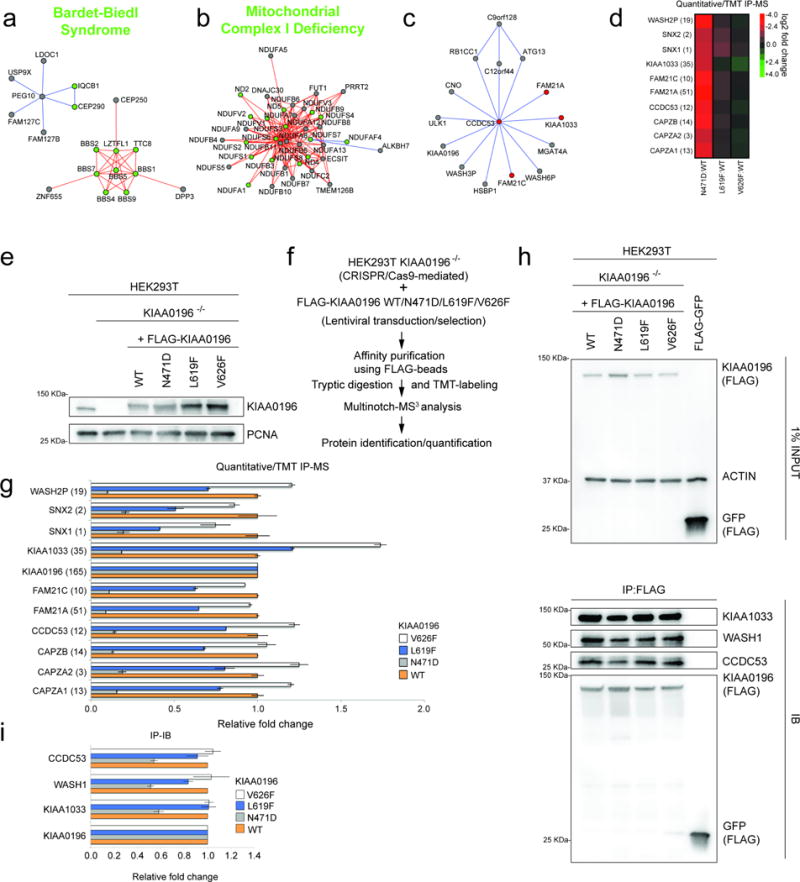
a–c, BioPlex 2.0 communities associated with congenital or hereditary disease states. Green nodes are associated with the indicated disease (DisGeNET), while other community members are gray. Edge colors indicate connectivity of individual communities revealed through MCL clustering. a, Bardet-Biedl Syndrome; b, Mitochondrial Complex I deficiency; c, Hereditary Spastic Paraplegia (the WASH complex). d, Quantitative analysis of association of KIAA0196/SPG8 and its mutant forms found in Hereditary Spastic Paraplegia was performed using TMT proteomics and the relative abundance of individual WASH complex subunits displayed as a heat map. e, HEK293T cells were gene-edited to delete endogenous KIAA0196. Wild-Type (WT) or disease variants (N471D/L619F/V626F) of KIAA0196 (N-terminally FLAG tagged) were expressed in these cells and assayed by immunoblotting. f, Work-flow for Tandem Mass Tagging (TMT) approach to quantify KIAA0196-associated proteins. g, Quantitative interaction proteomics of WT and variants of KIAA0196. Average relative intensities of biological replicates of interacting proteins are shown. Error bars represent mean +/− standard deviation. Number of peptides quantified for each protein is indicated in the parenthesis. h–i, Immunoprecipitation (IP)/immunoblotting (IB) was performed on three biological replicates to examine association of WASH complex members by immunoblotting. Average relative intensities of immunoblot signals for biological triplicates are shown, with error bars representing the mean +/− standard deviation.
Supplementary Material
Acknowledgments
We thank Marc Vidal and David Hill for ORFEOME 8.1, and Nikon Imaging Center (Harvard Medical School) for imaging support. This work was supported by the NIH (U41 HG006673 to S.P.G., J.W.H. and E.L.H.) and Biogen (S.P.G., J.W.H.). J.A.P. is supported by K01DK098285, and S.S. was supported by Canadian Institutes for Health Research. S.P.G. is a consultant for Biogen.
Footnotes
Competing Financial Interest
Yes there is potential Competing Interest.
Steven Gygi is a consultant for Biogen, Inc.
Author Contributions:
The study was conceived by S.P.G. and J.W.H. E.L.H. developed CompPASS-Plus and software for data collection and integration, performed all informatic analyses, and oversaw data collection and pipeline quality. R.J.B. directed the cell culture and biochemistry pipeline and organized samples for MS analysis with L.T. J.A.P. and J.R.C. were responsible for all mass spectrometry operation. G.C., F.G., M.P.G., H.P., R.A.O., S.T., G.Z. and J.S. performed DNA and cell line production. R.J.B. and G.Z. performed all affinity purifications. L.P.-V., A.E.W., and S.S. performed validation experiments. B.K.E. and R.R. provided computational support. Data interpretation was performed by E.L.H. K.L., K.G.G., S.A.-T., S.P.G., and J.W.H. Data visualization tools were constructed by S.P.G. and D.K.S. The paper was written by E.L.H., S.P.G., and J.W.H. and was edited by all authors.
References
- 1.Havugimana PC, et al. A census of human soluble protein complexes. Cell. 2012;150:1068–1081. doi: 10.1016/j.cell.2012.08.011. [DOI] [PMC free article] [PubMed] [Google Scholar]
- 2.Wan C, et al. Panorama of ancient metazoan macromolecular complexes. Nature. 2015;525:339–344. doi: 10.1038/nature14877. [DOI] [PMC free article] [PubMed] [Google Scholar]
- 3.Menche J, et al. Disease networks. Uncovering disease-disease relationships through the incomplete interactome. Science. 2015;347:1257601. doi: 10.1126/science.1257601. [DOI] [PMC free article] [PubMed] [Google Scholar]
- 4.Huttlin EL, et al. The BioPlex Network: A Systematic Exploration of the Human Interactome. Cell. 2015;162:425–440. doi: 10.1016/j.cell.2015.06.043. [DOI] [PMC free article] [PubMed] [Google Scholar]
- 5.Enright AJ, Van Dongen S, Ouzounis CA. An efficient algorithm for large-scale detection of protein families. Nucleic Acids Res. 2002;30:1575–1584. doi: 10.1093/nar/30.7.1575. [DOI] [PMC free article] [PubMed] [Google Scholar]
- 6.Blomen VA, et al. Gene essentiality and synthetic lethality in haploid human cells. Science. 2015;350:1092–1096. doi: 10.1126/science.aac7557. [DOI] [PubMed] [Google Scholar]
- 7.Wang T, et al. Identification and characterization of essential genes in the human genome. Science. 2015;350:1096–1101. doi: 10.1126/science.aac7041. [DOI] [PMC free article] [PubMed] [Google Scholar]
- 8.Pan Q, Shai O, Lee LJ, Frey BJ, Blencowe BJ. Deep surveying of alternative splicing complexity in the human transcriptome by high-throughput sequencing. Nat Genet. 2008;40:1413–1415. doi: 10.1038/ng.259. [DOI] [PubMed] [Google Scholar]
- 9.ENCODE Project Consortium. An integrated encyclopedia of DNA elements in the human genome. Nature. 2012;489:57–74. doi: 10.1038/nature11247. [DOI] [PMC free article] [PubMed] [Google Scholar]
- 10.Stenson PD, et al. The Human Gene Mutation Database: building a comprehensive mutation repository for clinical and molecular genetics, diagnostic testing and personalized genomic medicine. Hum Genet. 2014;133:1–9. doi: 10.1007/s00439-013-1358-4. [DOI] [PMC free article] [PubMed] [Google Scholar]
- 11.Krogan NJ, et al. Global landscape of protein complexes in the yeast Saccharomyces cerevisiae. Nature. 2006;440:637–643. doi: 10.1038/nature04670. [DOI] [PubMed] [Google Scholar]
- 12.Hein MY, et al. A human interactome in three quantitative dimensions organized by stoichiometries and abundances. Cell. 2015;163:712–723. doi: 10.1016/j.cell.2015.09.053. [DOI] [PubMed] [Google Scholar]
- 13.Guruharsha KG, et al. A protein complex network of Drosophila melanogaster. Cell. 2011;147:690–703. doi: 10.1016/j.cell.2011.08.047. [DOI] [PMC free article] [PubMed] [Google Scholar]
- 14.Yang X, et al. A public genome-scale lentiviral expression library of human ORFs. Nat Methods. 2011;8:659–661. doi: 10.1038/nmeth.1638. [DOI] [PMC free article] [PubMed] [Google Scholar]
- 15.Ruepp A, et al. CORUM: the comprehensive resource of mammalian protein complexes–2009. Nucleic Acids Res. 2009;38:D497–501. doi: 10.1093/nar/gkp914. [DOI] [PMC free article] [PubMed] [Google Scholar]
- 16.Rual JF, et al. Towards a proteome-scale map of the human protein-protein interaction network. Nature. 2005;437:1173–1178. doi: 10.1038/nature04209. [DOI] [PubMed] [Google Scholar]
- 17.Rolland T, et al. A proteome-scale map of the human interactome network. Cell. 2014;159:1212–1226. doi: 10.1016/j.cell.2014.10.050. [DOI] [PMC free article] [PubMed] [Google Scholar]
- 18.Ryan CJ, et al. High-resolution network biology: connecting sequence with function. Nat Rev Genet. 2013;14:865–879. doi: 10.1038/nrg3574. [DOI] [PMC free article] [PubMed] [Google Scholar]
- 19.Dutkowski J, et al. A gene ontology inferred from molecular networks. Nat Biotechnol. 2013;31:38–45. doi: 10.1038/nbt.2463. [DOI] [PMC free article] [PubMed] [Google Scholar]
- 20.Magrane M, Consortium U UniProt Knowledgebase: a hub of integrated protein data. Database (Oxford) 2011;2011:bar009. doi: 10.1093/database/bar009. [DOI] [PMC free article] [PubMed] [Google Scholar]
- 21.Uhlen M, et al. Tissue-based map of the human proteome. Science. 2015;347:1260419. doi: 10.1126/science.1260419. [DOI] [PubMed] [Google Scholar]
- 22.Finn RD, et al. Pfam: the protein families database. Nucleic Acids Res. 2014;42:D222–230. doi: 10.1093/nar/gkt1223. [DOI] [PMC free article] [PubMed] [Google Scholar]
- 23.Zhong Y, et al. Distinct regulation of autophagic activity by Atg14L and Rubicon associated with Beclin 1-phosphatidylinositol-3-kinase complex. Nat Cell Biol. 2009;11:468–476. doi: 10.1038/ncb1854. [DOI] [PMC free article] [PubMed] [Google Scholar]
- 24.Austin-Tse C, et al. Zebrafish Ciliopathy Screen Plus Human Mutational Analysis Identifies C21orf59 and CCDC65 Defects as Causing Primary Ciliary Dyskinesia. Am J Hum Genet. 2013;93:672–686. doi: 10.1016/j.ajhg.2013.08.015. [DOI] [PMC free article] [PubMed] [Google Scholar]
- 25.Pinero J, et al. DisGeNET: a discovery platform for the dynamical exploration of human diseases and their genes. Database (Oxford) 2015;2015:bav028. doi: 10.1093/database/bav028. [DOI] [PMC free article] [PubMed] [Google Scholar]
- 26.Babu M, et al. Interaction landscape of membrane-protein complexes in Saccharomyces cerevisiae. Nature. 2012;489:585–589. doi: 10.1038/nature11354. [DOI] [PubMed] [Google Scholar]
- 27.Floyd BJ, et al. Mitochondrial Protein Interaction Mapping Identifies Regulators of Respiratory Chain Function. Mol Cell. 2016;63:621–632. doi: 10.1016/j.molcel.2016.06.033. [DOI] [PMC free article] [PubMed] [Google Scholar]
- 28.Chantranupong L, et al. The CASTOR Proteins Are Arginine Sensors for the mTORC1 Pathway. Cell. 2016;165:153–164. doi: 10.1016/j.cell.2016.02.035. [DOI] [PMC free article] [PubMed] [Google Scholar]
- 29.Dong R, et al. Endosome-ER Contacts Control Actin Nucleation and Retromer Function through VAP-Dependent Regulation of PI4P. Cell. 2016;166:408–423. doi: 10.1016/j.cell.2016.06.037. [DOI] [PMC free article] [PubMed] [Google Scholar]
- 30.Rappsilber J, Mann M, Ishihama Y. Protocol for micro-purification, enrichment, pre-fractionation and storage of peptides for proteomics using StageTips. Nat Protoc. 2007;2:1896–1906. doi: 10.1038/nprot.2007.261. [DOI] [PubMed] [Google Scholar]
- 31.Eng JK, McCormack AL, Yates JR. An approach to correlate tandem mass spectral data of peptides with amino acid sequences in a protein database. J Am Soc Mass Spectrom. 1994;5:976–989. doi: 10.1016/1044-0305(94)80016-2. [DOI] [PubMed] [Google Scholar]
- 32.Elias JE, Gygi SP. Target-decoy search strategy for increased confidence in large-scale protein identifications by mass spectrometry. Nat Methods. 2007;4:207–214. doi: 10.1038/nmeth1019. [DOI] [PubMed] [Google Scholar]
- 33.Huttlin EL, et al. A tissue-specific atlas of mouse protein phosphorylation and expression. Cell. 2010;143:1174–1189. doi: 10.1016/j.cell.2010.12.001. [DOI] [PMC free article] [PubMed] [Google Scholar]
- 34.Sowa ME, Bennett EJ, Gygi SP, Harper JW. Defining the human deubiquitinating enzyme interaction landscape. Cell. 2009;138:389–403. doi: 10.1016/j.cell.2009.04.042. [DOI] [PMC free article] [PubMed] [Google Scholar]
- 35.Behrends C, Sowa ME, Gygi SP, Harper JW. Network organization of the human autophagy system. Nature. 2010;466:68–76. doi: 10.1038/nature09204. [DOI] [PMC free article] [PubMed] [Google Scholar]
- 36.Franceschini A, et al. STRING v9.1: protein-protein interaction networks, with increased coverage and integration. Nucleic Acids Res. 2013;41:D808–815. doi: 10.1093/nar/gks1094. [DOI] [PMC free article] [PubMed] [Google Scholar]
- 37.Warde-Farley D, et al. The GeneMANIA prediction server: biological network integration for gene prioritization and predicting gene function. Nucleic Acids Res. 2010;38:W214–220. doi: 10.1093/nar/gkq537. [DOI] [PMC free article] [PubMed] [Google Scholar]
- 38.Chatr-Aryamontri A, et al. The BioGRID interaction database: 2013 update. Nucleic Acids Res. 2013;41:D816–823. doi: 10.1093/nar/gks1158. [DOI] [PMC free article] [PubMed] [Google Scholar]
- 39.Licata L, et al. MINT, the molecular interaction database: 2012 update. Nucleic Acids Res. 2012;40:D857–861. doi: 10.1093/nar/gkr930. [DOI] [PMC free article] [PubMed] [Google Scholar]
- 40.Pratt D, et al. NDEx, the Network Data Exchange. Cell Syst. 2015;1:302–305. doi: 10.1016/j.cels.2015.10.001. [DOI] [PMC free article] [PubMed] [Google Scholar]
- 41.Calvo SE, Clauser KR, Mootha VK. MitoCarta2.0: an updated inventory of mammalian mitochondrial proteins. Nucleic Acids Res. 2016;44:D1251–1257. doi: 10.1093/nar/gkv1003. [DOI] [PMC free article] [PubMed] [Google Scholar]
- 42.Vogelstein B, et al. Cancer genome landscapes. Science. 2013;339:1546–1558. doi: 10.1126/science.1235122. [DOI] [PMC free article] [PubMed] [Google Scholar]
- 43.Benjamini Y, Hochberg Y. Controlling the False Discovery Rate: a Practical and Powerful Approach to Multiple Testing. J Royal Stat Soc Series B. 1995;57:289–300. [Google Scholar]
- 44.Ashburner M, et al. Gene ontology: tool for the unification of biology. The Gene Ontology Consortium. Nat Genet. 2000;25:25–29. doi: 10.1038/75556. [DOI] [PMC free article] [PubMed] [Google Scholar]
- 45.Wilhelm M, et al. Mass-spectrometry-based draft of the human proteome. Nature. 2014;509:582–587. doi: 10.1038/nature13319. [DOI] [PubMed] [Google Scholar]
- 46.Gallegos LL, et al. A protein interaction map for cell-cell adhesion regulators identifies DUSP23 as a novel phosphatase for beta-catenin. Sci Rep. 2016;6:27114. doi: 10.1038/srep27114. [DOI] [PMC free article] [PubMed] [Google Scholar]
- 47.Wilson-Grady JT, Haas W, Gygi SP. Quantitative comparison of the fasted and re-fed mouse liver phosphoproteomes using lower pH reductive dimethylation. Methods. 2013;61:277–286. doi: 10.1016/j.ymeth.2013.03.031. [DOI] [PubMed] [Google Scholar]
- 48.Ran FA, et al. Genome engineering using the CRISPR-Cas9 system. Nat Protoc. 2013;8:2281–2308. doi: 10.1038/nprot.2013.143. [DOI] [PMC free article] [PubMed] [Google Scholar]
- 49.Tan MK, Lim HJ, Bennett EJ, Shi Y, Harper JW. Parallel SCF adaptor capture proteomics reveals a role for SCFFBXL17 in NRF2 activation via BACH1 repressor turnover. Mol Cell. 2013;52:9–24. doi: 10.1016/j.molcel.2013.08.018. [DOI] [PMC free article] [PubMed] [Google Scholar]
- 50.Meng Z, Moroishi T, Guan KL. Mechanisms of Hippo pathway regulation. Genes Dev. 2016;30:1–17. doi: 10.1101/gad.274027.115. [DOI] [PMC free article] [PubMed] [Google Scholar]
Associated Data
This section collects any data citations, data availability statements, or supplementary materials included in this article.
Supplementary Materials
Data Availability Statement
The BioPlex 2.0 network and its underlying data are available to the scientific community in several formats. First, all interactions in the BioPlex network have been deposited in the BioGRID protein interaction database. Second, we have created a website devoted to the project (http://bioplex.hms.harvard.edu) which provides tools to download i) the interactions that make up BioPlex 1.0 and 2.0; ii) a customized viewer that enables browsing of either network to examine the interactions of specific proteins; iii) an interface for download of nearly 12,000 individual RAW files containing mass spectrometry data from individual AP-MS experiments; and iv) an R package and web-based tool for performing CompPASS analyses. Third, the BioPlex 2.0 network as bait-prey pairs has been incorporated into NDEx40, a web-based platform for biological Network Data Exchange. Fourth, our RAW files have been submitted for inclusion in ProteomicsDB45. Finally, all RAW files (3Tb) from this study will be provided to investigators upon request using investigator-provided hard drives. Finally, a table in. tsv format containing all proteins and spectral count information for all 5891 AP-MS experiments reported here is available for download at the BioPlex website.


