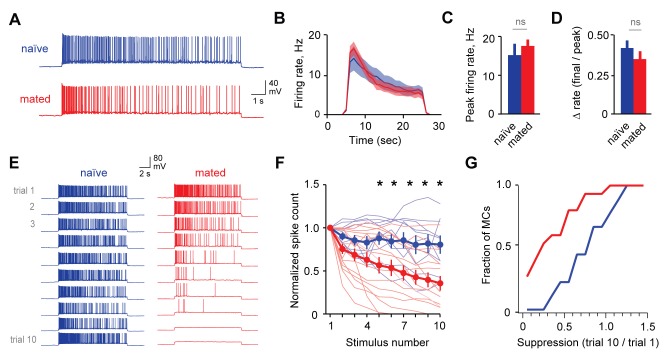
Figure 5. Mating reduces the responsiveness of MCs to repetitive inputs.
(A) MC firing to an initial current stimulus is similar for naïve and mated females. (B) Firing rate profile averaged across all MCs from naïve and mated animals. (C, D) Mating has no effect initial MC output (peak firing rate: p=0.51; change in firing rate: p=0.55; t-test; n = 10 and 15 cells from 5 and 7 mice for naïve and mated groups respectively). (E) Example MC responses to repetitive stimulation. Firing is stable over time in naïve females, but drops dramatically over time after mating. (F) Average MC output across successive stimuli for naïve (blue) and mated females (red). Firing on 10th trial is 80 ± 11% (naïve) vs. 36 ± 8% of 1st trial (mated); F = 10.01, Fc = 4.30, p=0.003; ANOVA with post-hoc Tukey test. Light colors show individual neurons; dark traces show mean ± SEM. (G) Cumulative histogram showing increased attenuation in MCs from mated animals (p=0.027; Kolmogorov-Smirnov test; n = 9 and 15 neurons from 5 and 7 mice respectively). NS, not significant. *p<0.05; **p<0.01.
DOI: http://dx.doi.org/10.7554/eLife.25421.016

