

Abstract
Recent genome analyses have identified recurrent mutations in the cohesin complex in a wide range of human cancers. Here we demonstrate that the most frequently mutated subunit of the cohesin complex, STAG2, displays a strong synthetic lethal interaction with its paralog STAG1. Mechanistically, STAG1 loss abrogates sister chromatid cohesion in STAG2 mutated but not in wild-type cells leading to mitotic catastrophe, defective cell division and apoptosis. STAG1 inactivation inhibits the proliferation of STAG2 mutated but not wild-type bladder cancer and Ewing sarcoma cell lines. Restoration of STAG2 expression in a mutated bladder cancer model alleviates the dependency on STAG1. Thus, STAG1 and STAG2 support sister chromatid cohesion to redundantly ensure cell survival. STAG1 represents a vulnerability of cancer cells carrying mutations in the major emerging tumor suppressor STAG2 across different cancer contexts. Exploiting synthetic lethal interactions to target recurrent cohesin mutations in cancer, e.g. by inhibiting STAG1, holds the promise for the development of selective therapeutics.
DOI: http://dx.doi.org/10.7554/eLife.26980.001
Research Organism: Human
eLife digest
A big challenge for cancer research is to find drugs and treatments that kill cancer cells without harming the other cells of a patient. Cancer cells contain genetic mutations that cause them to grow and divide more rapidly than healthy cells. About half a million cancer patients worldwide have tumors that feature mutations to the gene that produces a protein called STAG2, a component of a large protein ring called cohesin. These mutations are particularly common in bladder cancers and Ewing sarcoma, a childhood bone cancer.
The cohesin ring holds together duplicated chromosomes during cell division, establishing the iconic X-shape of chromosomes in dividing cells. It is not clear exactly how mutations that affect STAG2 make cancer more likely to develop. However, it is possible that these cancer-specific mutations make cancer cells vulnerable in ways that healthy cells are not.
Using a genetic screening approach, van der Lelij, Lieb et al. searched for genes whose inactivation would harm only those cells that have mutant STAG2 proteins. This search found that one such gene encodes a protein called STAG1, a close relative of STAG2. Reducing the amount of STAG1 protein in cells with mutant forms for STAG2 caused these cells to start dying, whereas healthy cells were unaffected.
Van der Lelij, Lieb et al. then conducted biochemical and cell biological experiments on bladder cancer and Ewing sarcoma cells to show that the cells need at least one of STAG1 or STAG2 to hold replicated chromosomes together. Without either protein, the X-shape of the chromosomes was lost and the cells died when they tried to divide.
Thus, human cells can survive without STAG1 or STAG2 but not without both, a concept known as synthetic lethality. More research is now needed to identify how the STAG1 protein could be prevented from working. This knowledge could ultimately be used to develop drugs that would kill off only those cancer cells that have mutations that affect STAG2.
Introduction
Cohesin is a highly conserved ring-shaped protein complex that is thought to topologically embrace chromatid fibers (Peters and Nishiyama, 2012), which is essential for sister chromatid cohesion and chromosome segregation in eukaryotes. In addition, cohesin participates in DNA repair, genome organization and gene expression (Losada, 2014). The cohesin subunits SMC1, SMC3 and RAD21 (also called SCC1) comprise the core ring of the complex. A fourth universally conserved subunit, a HEAT repeat protein of the Scc3/STAG family, peripherally associates with the core cohesin ring by binding to RAD21 (Tóth et al., 1999), and is required for the dynamic association of cohesin with chromatin (Hu et al., 2011; Murayama and Uhlmann, 2014). Human somatic cells express two paralogs of this protein, called STAG1 and STAG2 (Losada et al., 2000; Sumara et al., 2000).
Recent cancer genome studies identified recurrent mutations in cohesin subunits and regulators in approximately 7.3% of all human cancers (Lawrence et al., 2014; Leiserson et al., 2015; Solomon et al., 2011). STAG2, the most frequently mutated cohesin subunit, emerges as one of only 12 genes that are significantly mutated in four or more major human malignancies (Lawrence et al., 2014). STAG2 mutations have been reported in ~6% of acute myeloid leukemias and myelodysplastic syndromes (Kon et al., 2013; Thota et al., 2014; Walter et al., 2012), 15–22% of Ewing’s sarcomas (Brohl et al., 2014; Crompton et al., 2014; Tirode et al., 2014), and in up to 26% of bladder cancers of various stages and grades (Balbás-Martínez et al., 2013; Guo et al., 2013; Solomon et al., 2013; Taylor et al., 2014). The deleterious nature of most STAG2 mutations strongly suggests that the gene represents a new tumor suppressor (Hill et al., 2016). STAG2 mutations were initially thought to promote tumorigenesis due to defects in sister chromatid cohesin leading to genome instability (Barber et al., 2008; Solomon et al., 2011). However, the vast majority of cohesin-mutated cancers are euploid (Balbás-Martínez et al., 2013; Kon et al., 2013), indicating that cohesin mutations may promote tumorigenesis through altering different cohesin functions such as genome organization and transcriptional regulation (Galeev et al., 2016; Mazumdar et al., 2015; Mullenders et al., 2015; Viny et al., 2015). Regardless of the mechanisms driving cohesin mutant tumors, the recent success of poly(ADP-ribose) polymerase inhibitors in the treatment of BRCA-mutated ovarian and prostate cancer demonstrates that exploiting tumor suppressor loss by applying the concept of synthetic lethality in defined patient populations can impact clinical cancer care (Castro et al., 2016; Kim et al., 2015; Mirza et al., 2016; Oza et al., 2015). The estimated half a million individuals with STAG2-mutant malignancies would greatly profit from exploring specific dependencies of these cancers.
Results
We hypothesized that STAG2 loss could alter the properties and function of the cohesin complex leading to unique vulnerabilities of STAG2 mutated cells. To identify factors whose inactivation would be synthetic lethal with loss of STAG2 function, we first used CRISPR/Cas9 to inactivate STAG2 in near-diploid, chromosomally stable HCT 116 colon carcinoma cells (Figure 1A). Two clones, STAG2- 505c1 and 502c4, harboring deleterious mutations in STAG2 and lacking detectable STAG2 protein expression were selected for analyses (Figure 1—figure supplement 1 and Supplementary file 1). The isogenic parental and STAG2- HCT 116 cells were transfected with short-interfering RNA (siRNA) duplexes targeting 25 known cohesin subunits and regulators. After normalization to the non-target control siRNA (NTC), the effects of siRNA duplexes targeting individual genes were compared in parental and STAG2- cells. Depletion of the known essential cohesin regulator SGOL1 had a detrimental impact on viability of both parental and STAG2- cells. Remarkably, depletion of STAG1 strongly decreased cell viability in STAG2- cells, while being tolerated by the isogenic parental cells (Figure 1B). The pronounced selective effect of STAG1 depletion on STAG2- cells was confirmed in individual transfection experiments and colony formation assays (Figure 1C,D,E). Expression of an siRNA-resistant STAG1 transgene alleviated the anti-proliferative effect of STAG1 but not of SGOL1 siRNA duplexes in STAG2- HCT 116 cells demonstrating the specificity of the siRNA treatment (Figure 1—figure supplement 2). Double depletion of STAG1 and STAG2 by siRNA in parental cells confirmed their synthetic lethal interaction (Figure 1—figure supplement 3). Co-depletion of p53 and STAG1 indicated that the dependency of STAG2- cells on STAG1 was independent of p53 (Figure 1—figure supplement 4). In contrast to the loss of essential cohesin subunits or regulators, depletion of STAG1 had no effect on cell viability in non-transformed telomerase-immortalized human retinal pigment epithelial cells (hTERT RPE-1) (Figure 1—figure supplement 5). This result is supported by a large-scale genetic loss-of-function study that found that neither STAG1 nor STAG2 is essential for the proliferation of hTERT-RPE1 cells (Hart et al., 2015). To corroborate our genetic interaction findings using an independent strategy, we introduced Cas9 into parental and STAG2- HCT 116 cells as well as KBM-7 leukemia cells for competition assays (Figure 1F and Figure 1—figure supplement 1). Transduction of lentiviruses co-expressing mCherry and single guide RNAs (sgRNAs) targeting essential cohesin subunit genes, such as RAD21 and SMC3, resulted in the rapid loss of the infected and mCherry-positive cells from the population irrespective of STAG2 genotype (Figure 1F). In striking contrast, transduction with sgRNAs targeting STAG1 caused the depletion of STAG2- HCT 116 and KBM-7 cells but not of their parental STAG2 proficient counterparts (Figure 1F). Collectively, these experiments identify STAG1 as a vulnerability of STAG2 mutated cells in engineered solid cancer and leukemia models. STAG1 inactivation has little if any impact on the viability and proliferation of STAG2 wild-type cancer cells and non-transformed cells, but is essential for survival in the absence of STAG2.
Figure 1. Identification of STAG1 as a genetic vulnerability of STAG2 mutated cells.
(A) Engineering of an isogenic HCT 116 cell model by CRISPR/Cas9-mediated inactivation of STAG2. The position of the sgRNAs used to create deleterious insertion and deletion mutations in the STAG2 coding sequence is indicated. (B) Parental HCT 116 cells and two STAG2 mutant clones (STAG2-) were subjected to an siRNA screen. Pools of 4 siRNA duplexes targeting 25 known cohesin subunits and regulators were transfected into the three cell lines. Cell viability was measured 7 days after transfection. Following normalization to non-target control (NTC) values, the average cell viability of siRNA pools in parental HCT 116 cells and two STAG2- clones was plotted against each other (n = 2 or more independent experiments with 2 biological repeats each). (C) HCT 116 parental cells and STAG2- clones were transfected with the indicated siRNAs. Protein lysates were prepared 72 hr after transfection and analyzed by immunoblotting. (D) Cell viability was assessed 8 days after siRNA transfection using a metabolic assay (n = 4 biological repeats, error bars denote standard deviation) and (E) using crystal violet staining. (F) Cas9-GFP expressing isogenic parental and STAG2- HCT 116 and KBM-7 cells were transduced with a lentivirus encoding mCherry and sgRNAs targeting the indicated genes. The percentage of mCherry-positive cells was determined over time by flow cytometry and normalized to the fraction of mCherry-positive cells at the first measurement and sequentially to a control sgRNA (n = 1 experimental replicate).

Figure 1—figure supplement 1. Characterization of CRISPR/Cas9-generated STAG2 mutated clones used in this study.

Figure 1—figure supplement 2. Rescue of the synthetic lethal interaction between STAG1 and STAG2 by expression of an siRNA-resistant FLAG-STAG1 transgene.

Figure 1—figure supplement 3. Double depletion experiment confirms STAG1-STAG2 synthetic lethality.
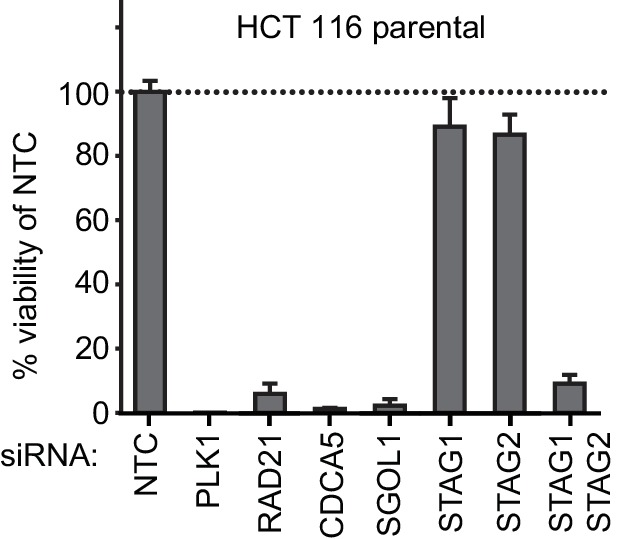
Figure 1—figure supplement 4. Double depletion experiments indicate that the STAG1-STAG2 genetic interaction is independent of p53.

Figure 1—figure supplement 5. Depletion of STAG1 does not reduce viability in hTERT RPE-1 cells.

To elucidate the mechanistic basis for this synthetic lethal interaction, we hypothesized that the combined loss of STAG1 and STAG2, in contrast to loss of either component alone, could severely impair cell division. Chromosome alignment and segregation during mitosis rely on sister chromatid cohesion, the central function of the cohesin complex (Peters and Nishiyama, 2012). Depletion of STAG1 resulted in an increase in the mitotic index and a prolongation of the duration of mitosis in STAG2- but not wild-type cells (Figure 2A and Figure 2—figure supplement 1). Immunofluorescence microscopy revealed a failure to align chromosomes at the metaphase plate upon STAG1 loss in STAG2- cells (Figure 2B). In mitotic chromosome spread analysis STAG2 inactivation caused a partial loss of centromeric cohesion in HCT 116 cells as previously reported (Canudas and Smith, 2009; Kim et al., 2016; Remeseiro et al., 2012; Solomon et al., 2011) (Figure 2C). Depletion of the essential centromeric cohesin protection factor SGOL1 resulted in a complete loss of sister chromatid cohesion in most chromosome spreads irrespective of STAG2 genotype. In striking contrast, STAG1 depletion selectively abrogated sister chromatid cohesion in STAG2- but not parental cells (Figure 2C, single chromatids). The severe mitotic defects observed upon loss of STAG1 in STAG2- cells were accompanied by the emergence of aberrantly sized and shaped interphase nuclei (Figure 2—figure supplement 2) and by a progressive increase in apoptosis (Figure 2D). These results provide a mechanistic basis for the synthetic lethal interaction between STAG1 and STAG2. STAG1 inactivation abrogates sister chromatid cohesion exclusively in STAG2- cells resulting in catastrophic mitotic failure, abnormal cell division and apoptosis. To hold sister chromatids together, cohesin can tolerate the loss of either STAG1 or STAG2 alone but not the loss of both.
Figure 2. Loss of STAG1 function causes severe mitotic defects, abrogates sister chromatid cohesion and triggers apoptosis in STAG2- but not parental HCT 116 cells.
(A) Parental and STAG2- 505c1 HCT 116 were transfected with NTC and STAG1 siRNA duplexes. Immunofluorescence analysis was performed 72 hr after transfection to determine the mitotic index by scoring the fraction of histone H3 phosphoSer10-positive (H3pS10+) cells (n ≥ 1323 cells, error bars denote standard deviation of three independent experiments), and (B) to investigate mitotic spindle geometry and chromosome alignment. Cropped and magnified examples of chromosome alignment are shown in (B). Scale bars, 20 μm. (C) Giemsa-stained mitotic chromosome spreads were prepared 48 hr after transfection of parental and STAG2- HCT 116 cells with the indicated siRNA duplexes. The status of sister chromatid cohesion of individual metaphase spreads was categorized into normal, partial loss of cohesion or single chromatid phenotypes (n = 100 spreads, error bars denote standard deviation of two independently analyzed slides). Scale bar, 10 μm. (D) Caspase activity was tracked over time using a live-cell caspase 3/7 substrate cleavage assay in parental and STAG2- 505c1 HCT 116 cells after transfection with the indicated siRNAs or after treatment with 0.3 μM doxorubicin at t = 0 hr (n = 2 independent experiments with 4 biological repeats for NTC and STAG1 siRNA each and 1 biological repeat for doxorubicin each).

Figure 2—figure supplement 1. The depletion of STAG1 prolongs mitosis in STAG2 mutated but not parental HCT 116 cells.
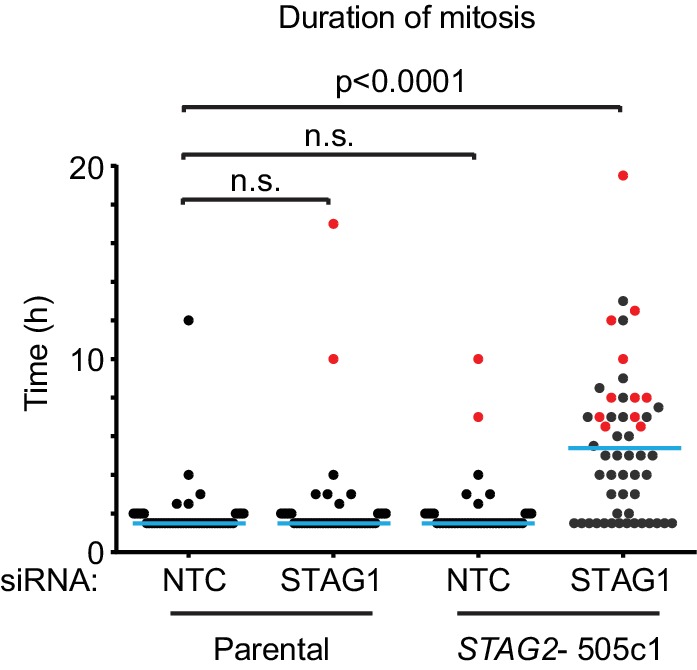
Figure 2—figure supplement 2. Aberrant nuclear morphology in STAG2-mutated but not parental HCT 116 cells upon depletion of STAG1.

We next expanded our analysis to patient-derived STAG2 mutations and STAG2-mutant cancer cell lines in order to investigate the disease relevance of the observed synthetic lethality (Figure 3). STAG1 depletion by siRNA abrogated both cell viability and sister chromatid cohesion in HCT 116 cell clones, in which three patient-derived deleterious mutations had been engineered into the STAG2 locus (Kim et al., 2016), but not in parental HCT 116 cells (Figure 3—figure supplement 1). Among solid human cancers, STAG2 mutational inactivation is most prevalent in urothelial bladder cancer and Ewing sarcoma. Therefore, we assembled a panel of 16 bladder cancer cell lines: 11 STAG2-positive, three with deleterious STAG2 mutations (UM-UC-3, UM-UC-6 and VM-CUB-3), one in which STAG2 was inactivated by CRISPR/Cas9 (UM-UC-5 STAG2- 505c6) (Figure 3—figure supplement 2), and two with no detectable STAG2 expression (LGWO1 and MGH-U3) (Supplementary file 2) (Balbás-Martínez et al., 2013; Solomon et al., 2013). The STAG2 protein expression status in the panel of bladder cancer cell lines was confirmed using immunoblotting (Figure 3A). siRNA experiments revealed that STAG2 status represented a predictive marker for the sensitivity to STAG1 depletion across the bladder cancer cell line panel. Whereas all cell lines were highly sensitive to depletion of the key mitotic kinase PLK1, STAG1 siRNA reduced cell viability in STAG2-negative bladder cancer cells but had little or no effect on STAG2-positive bladder cancer cell lines (Figure 3B). STAG1 depletion prevented colony formation and abolished sister chromatid cohesion selectively in STAG2 mutated UM-UC-3 (F983fs) but not in STAG2 wild-type UM-UC-5 bladder cancer cells (Figure 3C,D). In contrast, SGOL1 depletion abrogated cell growth and cohesion in both cell lines. Consistent with the results obtained in bladder cancer cells, STAG2 mutation status was also linked to STAG1 dependency in a panel of four Ewing sarcoma cell lines (Figure 3E,F and Supplementary file 2) (Solomon et al., 2011; Tirode et al., 2014). Lentiviral transduction of a FLAG-STAG2 transgene into STAG2 mutated UM-UC-3 bladder cancer cells resulted in the restoration of STAG2 expression, nuclear localization of the transgenic protein and its incorporation into the cohesin complex (Figure 3—figure supplement 3). Crucially, restoration of STAG2 expression alleviated the STAG1 dependency of UM-UC-3 cells providing a causal link between STAG2 loss and STAG1 dependency (Figure 3G). These results demonstrate that the synthetic lethal interaction between STAG1 and STAG2 that we discovered in isogenic cell pairs is recapitulated in disease-relevant bladder cancer and Ewing sarcoma cell models.
Figure 3. The synthetic lethal interaction between STAG1 and STAG2 is manifested in disease-relevant bladder cancer and Ewing sarcoma cell lines.
(A) The indicated bladder cancer cell lines were analyzed for STAG2 expression by immunoblotting. (B) The indicated bladder cancer cell lines were transfected with NTC, STAG1 and PLK1 siRNA duplexes. Viability was determined 7 or 10 days after transfection and normalized to the viability of NTC siRNA transfected cells (n = 2 independent experiments with 5 biological repeats each, error bars denote standard deviation). (C) STAG2 wild-type UM-UC-5 and STAG2 mutated UM-UC-3 cells were transfected with NTC, STAG1 and SGOL1 siRNA duplexes. Colony formation was analyzed 7 days after transfection by crystal violet staining. (D) 72 hr after siRNA transfection into UM-UC-5 and UM-UC-3 cells, Giemsa-stained chromosome spreads were prepared and analyzed for sister chromatid cohesion phenotypes (n = 100 spreads, error bars denote standard deviation of two independently analyzed slides). (E) The indicated Ewing sarcoma cell lines were analyzed for STAG2 protein expression by immunoblotting. (F) The indicated Ewing sarcoma cell lines were transfected with NTC, STAG1 and SGOL1 siRNA duplexes. Viability was measured 6 days after transfection and normalized to the viability of NTC siRNA transfected cells (n = 3 independent experiments with 3 biological replicates each, error bars denote standard deviation). (G) STAG2 mutated UM-UC-3 cells were transduced with a lentivirus encoding a FLAG-STAG2 transgene. Stably selected cell pools were subsequently transfected with NTC, STAG1 or SGOL1 siRNA duplexes. Viability was measured 7 days after transfection and normalized to the viability of NTC siRNA transfected cells (n = 4 biological replicates, error bars denote standard deviation).

Figure 3—figure supplement 1. Patient-derived STAG2 mutations cause STAG1 dependency in engineered isogenic HCT 116 cells.

Figure 3—figure supplement 2. Characterization of CRISPR/Cas9-generated STAG2 knockout in UM-UC-5 bladder cancer cell line.

Figure 3—figure supplement 3. Restoration of STAG2 protein expression in UM-UC-3 bladder cancer cells.

Discussion
Here we identify STAG1 as a strong genetic vulnerability of cells lacking the major emerging tumor suppressor STAG2 (Figure 4). The paralog dependency between STAG1 and STAG2 has recently also been reported in an independent study (Benedetti et al., 2017). We show that the synthetic lethal interaction between STAG1 and STAG2 is observed in isogenic HCT 116 and KBM-7 cells as well as in bladder cancer and Ewing sarcoma cell lines. Thus, the genetic interaction between STAG paralogs is conserved in three major human malignancies: carcinoma, leukemia and sarcoma. Importantly, the finding that cancer cells harboring deleterious STAG2 mutations remain exquisitely dependent on STAG1 demonstrates that this genetic vulnerability is maintained throughout the process of carcinogenesis and not bypassed by adaptive processes, such as the transcriptional activation of the germline-specific paralog STAG3 (Pezzi et al., 2000; Prieto et al., 2001). Furthermore, expression analysis did not reveal upregulation of STAG1 protein or mRNA as a major compensatory mechanism for the loss of STAG2 function in cancer cell lines or patient tumors (Figure 4—figure supplement 1).
Figure 4. Model for the synthetic lethal interaction between STAG1 and STAG2.
In wild-type cells, both cohesin-STAG1 and cohesin-STAG2 complexes redundantly contribute to sister chromatid cohesion and successful cell division. Loss of STAG1 is tolerated in these cells as cohesin-STAG2 complexes alone suffice to support sister chromatid cohesion for cell division. In cancer cells in which STAG2 is mutationally or transcriptionally inactivated, sister chromatid cohesion is now entirely dependent on cohesin-STAG1 complexes. Inactivation of STAG1 in STAG2 mutated cells therefore results in a loss of sister chromatid cohesion followed by mitotic failure and cell death.

Figure 4—figure supplement 1. Analysis of STAG1 protein or mRNA expression in cancer cell lines and patient tumors.

Figure 4—figure supplement 2. Expression levels of STAG1 and STAG2 mRNA in normal human tissues.

Our experiments strongly suggest that the loss of sister chromatid cohesion followed by aberrant cell division and cell death is the mechanistic basis underlying the synthetic lethality between STAG1 and STAG2 (Figure 4). Both paralogs associate with the cohesin complex in a mutually exclusive manner (Losada et al., 2000; Sumara et al., 2000). Although STAG1 and STAG2 may confer distinct functionalities to the cohesin complex (Canudas and Smith, 2009; Remeseiro et al., 2012), STAG1 and STAG2 containing complexes act redundantly to ensure sufficient sister chromatid cohesion to support cell division in human somatic cells. While the loss of one paralog is compatible with cell viability and proliferation, the loss of both paralogs abrogates cohesin’s ability to hold sister chromatids together, which results in lethality. These mechanistic findings are consistent with previous studies that employed double siRNA depletion experiments to indicate functional redundancy between STAG1 and STAG2 in maintaining sister chromatid cohesion (Canudas and Smith, 2009; Hara et al., 2014; Remeseiro et al., 2012).
Since STAG1 inactivation has little or no effect on the proliferation of STAG2 proficient cells, selective targeting of STAG1 could offer a large therapeutic window. The fact that STAG2 mRNA is expressed in all normal human tissues analyzed (Figure 4—figure supplement 2) supports the hypothesis that selective inhibition of STAG1 function would indeed spare most non-cancerous tissues. Potential approaches for therapeutic targeting of STAG1 include the inhibition of the interaction between STAG1 and the cohesin ring subunit RAD21 (Hara et al., 2014) and the selective degradation of STAG1 using proteolysis-targeting chimera (PROTAC) technology (Deshaies, 2015). The high degree of homology between the STAG1 and its paralog STAG2 will be a key challenge to overcome. The mechanisms by which mutations in STAG2 and other cohesin subunits drive tumorigenesis in solid and hematological tissues are not yet firmly established. Our work highlights the fact that such knowledge is not a prerequisite for the identification of selective vulnerabilities.
Both deleterious STAG2 mutations and the loss of STAG2 expression are strong predictive biomarkers for STAG1 dependence in cell models and could be utilized for patient stratification in the future. Our work demonstrates that unique genetic dependencies of cohesin mutated cancer cells exist. Such vulnerabilities hold the promise for the development of selective treatments for patients suffering from STAG2 mutated cancer.
Materials and methods
Antibodies
The following antibodies were used: C-term. pAb goat anti-STAG2 (Bethyl, Montgomery, TX, US; A300-158A and A300-159A), N-term. mAb rabbit anti-STAG2 (Cell Signaling, Danvers, MA, US; 5882), full length pAb rabbit anti-STAG2 (Cell Signaling, Danvers, MA, US; 4239), mouse anti-GAPDH (Abcam, UK; ab8245), rabbit anti-STAG1 (GeneTex, Irvine, CA, US; GTX129912), mouse anti-FLAG (Sigma-Aldrich, St. Louis, MO, US; F3165 and F1804), mouse anti-p53 (Calbiochem, San Diego, CA, US; OP43), rabbit anti-H3pS10 (Merck Millipore, Billerica, MA, US; 06570), FITC Conjugated mouse anti-Tubulin (Sigma-Aldrich, St. Louis, MO, US; F2168), rabbit anti-SGOL1 (Peters laboratory ID A975M), SMC3 (Peters laboratory ID 845), mouse anti-RAD21 (Merck Millipore, Billerica, MA, US; 05–908), rabbit anti-SMC1 (Bethyl, Montgomery, TX, US; A300-055A), and secondary rabbit (P0448), mouse (P0161) and goat (P0160) anti-IgG-HRP (all Dako, Denmark).
CRISPR/Cas9 and cDNA transgene vectors
sgRNA sequences used in this study are listed in Supplementary file 1. The following lentiviral vectors were used to introduce mutations in STAG2 in HCT 116 and UM-UC-5 cells: CRISPR STAG2 Hs0000077505_U6gRNA-Cas9-2A-GFP and CRISPR STAG2 Hs0000077502_U6gRNA-Cas9-2A-GFP (Sigma-Aldrich, St. Louis, MO, US). CRISPR sgRNA STAG2_16 and sgRNA STAG2_19 were co-expressed from U6gRNA 16-U6gRNA 19-EF1αs-Thy1.1-P2A-neo to introduce mutations in STAG2 in KBM-7 cells. HCT 116 stably expressing Cas9-GFP were obtained by lentiviral transduction with pLentiCRISPR-EF1αs-Cas9-P2A-GFP-PGK-puro. KBM-7 infected with dox-inducible Cas9 were obtained by sequential retroviral transduction with pWPXLd-EF1A-rtTA3-IRES-EcoRec-PGK-Puro and pSIN-TRE3G-Cas9-P2A-GFP PGK-Blast. pLVX-3xFLAG-STAG1r-IRES-Puro and pLVX-3xFLAG-STAG2r-IRES-Puro lentiviral vectors for siRNA-resistant transgene expression were generated by gene synthesis (GenScript, China) based on the STAG1 cDNA sequence NCBI NM_005862.2 and STAG2 cDNA sequence NCBI NM_001042749.2 followed by cloning into the parental pLVX-IRES-Puro vector (Clontech, Mountain View, CA, US). Silent nucleotide changes were introduced into the STAG1 and STAG2 coding sequences within the siRNA target sequences to render the transgenes siRNA-resistant. For competition assays, U6-sgRNA-EF1αs-mCherry-P2A-neo lentiviral vectors were used.
Cell culture and lentiviral transduction
HCT 116 cells were cultured in McCoy’s 5A w/glutamax medium supplemented with 10% fetal calf serum (FCS), KBM-7 cells were cultured in IMDM medium supplemented with 10% FCS, sodium butyrate, L-glutamine and antibiotics (all Invitrogen, Waltham, MA, US). hTERT RPE-1 cells were cultured in DMEM:F12 (ATCC: 30–2006)+10% FCS+0,01 mg/ml hygromycin B. Bladder cancer cell lines UM-UC-5, UM-UC-6, UM-UC-18, LGWO1, and MGHU-3 were cultured in DMEM +10% FCS w/NEAA, Glutamax and NaPyruvat, 5637, 639 V, 647 V, J82, JMSU-1, KU-19–19, RT4 T24, UM-UC-3 and VM-CUB-3 were cultured according to ATCC instructions (ATCC, Manassas, VA, USA). All Ewing sarcoma cell lines were cultured in RPMI +10% FCS. Lentiviral particles were produced using the Lenti-X Single Shot system (Clontech). Following lentiviral infection, stably transduced pools were generated using puromycin selection (HCT 116: 2 µg/ml, UM-UC-3: 2 µg/ml, UM-UC-5: 3 µg/ml). Sources, STAG2 status and authentication information (STR fingerprinting at Eurofins Genomics, Germany) of cell lines used in this study are provided in Supplementary file 2. All cell lines were tested negatively for mycoplasma contamination and have been authenticated by STR fingerprinting. Bladder cancer cell lines J82, RT4 and VM-CUB-3 and Ewing sarcoma cell line SK-N-MC are contained within the ICLAC list of commonly misidentified cell lines but have been STR verified for this study.
siRNA transfection, cell viability, competition assay and apoptosis assay
For knockdown experiments, cells were transfected with ON-TARGETplus SMARTpool siRNA duplexes (Dharmacon, Lafayette, CO, US) and the Lipofectamine RNAiMAX reagent according to the manufacturer’s instructions (Invitrogen, Waltham, MA, US). HCT 116 chromosome spreads, apoptosis assay, immunoblotting, immunofluorescence and live cell imaging experiments were performed using a final siRNA concentration of 20 nM. Cell viability and crystal violet staining assays were performed using 10 nM siRNA. hTERT RPE-1 cells and bladder cancer cells were transfected with 10 nM siRNA for cell viability assays, crystal violet staining and chromosome spreads. The UM-UC-3 FLAG-STAG2 cell line was transfected with 20 nM siRNA for immunoblotting. Ewing sarcoma cell lines were co-transfected with 50 nM ON-TARGETplus SMARTpool siRNAs (Dharmacon, Lafayette, CO, US) plus pRetro-Super (Brummelkamp et al., 2002) using Lipofectamin Plus reagent (Invitrogen, Waltham, MA, US). The next day cells were subjected to puromycin (1 µg/ml) selection for 72 hr (Ban et al., 2014), and cultured for two additional days. Viability was determined using CellTiter-Glo (Promega, Madison, WI, US), and by staining with crystal violet (Sigma-Aldrich, St. Louis, MO, US; HT901). For sgRNA competition assays, Cas9-GFP was expressed constitutively (HCT 116) or was induced by doxycycline addition (KBM-7). mCherry and sgRNAs were introduced by lentiviral transduction. The fraction of mCherry-positive cells was determined at the indicated time points using a Guava easycyte flow cytometer (Merck Millipore, Germany) and normalized to the first measurement and sequentially to control sgRNAs (non-targeting for HCT 116 and STAG2_19 for KBM-7). Apoptosis was analyzed using the IncuCyte Caspase-3/7 Apoptosis Assay (Essen BioScience, Ann Arbour, MI, US).
Cell extracts for immunoblotting and FLAG-immunoprecipitation
Cell pellets were resuspended in extraction buffer (50 mM Tris Cl pH 8.0, 150 mM NaCl, 1% Nonidet P-40 supplemented with Complete protease inhibitor mix (Roche, Switzerland) and Phosphatase Inhibitor cocktails (Sigma-Aldrich, St. Louis, MO, US; P5726 and P0044)); for Figure 1—figure supplement 1 (KBM-7) and Figure 3—figure supplement 1, pellets were resuspended in (25 mM Tris-HCl pH 7.5, 100 mM NaCl, 5 mM MgCl2, 0.2% NP-40, 10% glycerol, 1 mM NaF, Complete protease inhibitor mix (Roche, Switzerland), Benzonase (VWR, Radnor, PA, US)) and lysed on ice. For Figure 1—figure supplement 2B and Figure 3—figure supplement 3C, lysates were spun down for 10 min, followed by FLAG-immununoprecipitation using anti-FLAG M2-Agarose Affinity Gel (Sigma-Aldrich, St. Louis, MO, US) for two hours and washing with lysis buffer. Input lysates and immunoprecipitates were resuspended in SDS sample buffer and heated to 95°C.
Immunofluorescence, live cell imaging and chromosome spreads
For immunofluorescence, cells were fixed with 4% paraformaldehyde for 15 min, permeabilized with 0.2% Triton X-100 in PBS for 10 min and blocked with 3% BSA in PBS containing 0.01% Triton X-100. Cells were incubated with primary and secondary antibody (Alexa 594, Molecular Probes, Eugene, OR, US), DNA was counterstained with Hoechst 33342 (Molecular Probes, Eugene, OR, US; H3570) and tubulin was sequentially stained with an FITC-conjugated mouse anti-tubulin antibody (Sigma-Aldrich, St. Louis, MO, US; F2168)). Coverslips and chambers were mounted with ProLong Gold (Molecular Probes, Eugene, OR, US). Images were taken with an Axio Plan2/AxioCam microscope and processed with MrC5/Axiovision software (Zeiss, Germany). An IncuCyte (EssenBioScience, Ann Arbor, MI, US) imaging system was used to record live cells, and duration of mitosis was determined by measuring the time from mitotic cell rounding until anaphase onset. Data analysis was performed with Microsoft Excel 2013 and GraphPad Prism 7 (GraphPad Sofware, La Jolla, CA, US). Significance levels were quantified using unpaired t test. For chromosome spread analysis, nocodazole was added to the medium for 60 min at 100 ng/ml. Cells were harvested and hypotonically swollen in 40% medium/60%tap water for 5 min at room temperature. Cells were fixed with freshly made Carnoy's solution (75% methanol, 25% acetic acid), and the fixative was changed three times. For spreading, cells in Carnoy's solution were dropped onto glass slides and dried. Slides were stained with 5% Giemsa (Merck, Germany) for 4 min, washed briefly in tap water and air dried. For chromosome spread analysis two independent slides were scored blindly for each condition.
Bioinformatic analysis of STAG1 and STAG2 mRNA expression
STAG2 mRNA expression in tumors (TCGA Research Network: http://cancergenome.nih.gov/) and STAG1 and STAG2 expression in normal human tissues (The Genotype-Tissue Expression (GTEx) project, www.gtexportal.org) (GTEx Consortium, 2013) were analyzed based on the data available from UCSC Xena version 2016-04-12. Expression levels correspond to transcripts per million (TPM). The downloaded values were log2(TPM +0.001) values which were transformed to TPM values before generating the figures. STAG2 mutation data were downloaded from cBioPortal (Cerami et al., 2012; Gao et al., 2013) git repository in Sep. 2016. Samples were labeled as STAG2 mutated if they carried an alteration resulting in an amino acid change in STAG2 (i.e. missense or nonsense point mutation or small insertion or deletion). Gene deletions or amplifications were not considered.
Acknowledgements
We would like to thank Monika Kriz and Renate Schnitzer for clonal analysis. The IMP is supported by Boehringer Ingelheim. Research in the laboratory of J-MP is funded by the Austrian Science Fund (SFB-F34 and Wittgenstein award Z196-B20) and the Austrian Research Promotion Agency (Headquarter grants FFG-834223 and FFG-852936, Laura Bassi Centre for Optimized Structural Studies grant FFG-840283). Research in the laboratory of JZ was funded by a Starting Grant of the European Research Council (ERC no. 336860) and SFB grant F4710 of the Austrian Science Fund (FWF). Research on Ewing sarcoma in the laboratory of HK was funded by the Austrian Science Fund ERA-Net grant I 1225-B19. Work in the lab of FXR was funded by a grant from Fundación Científica de la Asociación Española Contra el Cáncer, Madrid, Spain. Research in the laboratory of TW is supported by National Institute of Health grant R01CA169345 and an Innovation Grant from Alex’s Lemonade Stand.
Funding Statement
The funders had no role in study design, data collection and interpretation, or the decision to submit the work for publication.
Funding Information
This paper was supported by the following grants:
Austrian Science Fund SFB-F34 to Jan-Michael Peters.
Austrian Science Fund Wittgenstein award Z196-B20 to Jan-Michael Peters.
Österreichische Forschungsförderungsgesellschaft FFG-834223 to Jan-Michael Peters.
Österreichische Forschungsförderungsgesellschaft FFG-852936 to Jan-Michael Peters.
Österreichische Forschungsförderungsgesellschaft FFG-840283 to Jan-Michael Peters.
European Research Council ERC no. 336860 to Johannes Zuber.
Austrian Science Fund SFB grant F4710 to Johannes Zuber.
Austrian Science Fund ERA-Net grant I 1225-B19 to Heinrich Kovar.
Fundación Científica Asociación Española Contra el Cáncer to Francisco X Real.
National Institutes of Health R01CA169345 to Todd Waldman.
Alex's Lemonade Stand Foundation for Childhood Cancer Innovation Grant to Todd Waldman.
Boehringer Ingelheim to Simone Lieb, Andreas Schlattl, Mark A Pearson, Norbert Kraut, Mark Petronczki.
Additional information
Competing interests
SL: Simone Lieb is a full-time employee of Boehringer Ingelheim RCV.
AS: Andreas Schlattl is a full-time employee of Boehringer Ingelheim RCV.
MAP: Mark Pearson is a full-time employee of Boehringer Ingelheim RCV.
NK: Norbert Kraut is a full-time employee of Boehringer Ingelheim RCV.
MP: Mark Petronczki is a full-time employee of Boehringer Ingelheim RCV.
The other authors declare that no competing interests exist.
Author contributions
PvdL, Conceptualization, Resources, Supervision, Funding acquisition, Visualization, Methodology, Writing—original draft, Project administration, Writing—review and editing.
SL, Conceptualization, Data curation, Formal analysis, Investigation, Visualization, Methodology, Writing—original draft, Writing—review and editing.
JJ, Formal analysis, Investigation, Visualization, Methodology, Writing—review and editing.
GW, Investigation, Methodology.
CPS, Investigation, Methodology.
KF, Investigation, Methodology.
AS, Investigation, Methodology.
JB, Formal analysis, Investigation, Visualization, Methodology.
RS, Investigation, Methodology.
TH, Investigation, Methodology.
HK, Conceptualization, Methodology.
FXR, Conceptualization, Resources, Supervision, Funding acquisition, Writing—review and editing.
TW, Funding acquisition, Writing—review and editing.
MAP, Resources, Funding acquisition, Writing—review and editing.
NK, Conceptualization, Resources, Writing—review and editing.
J-MP, Resources, Writing—review and editing.
JZ, Conceptualization, Resources, Supervision, Funding acquisition, Writing—review and editing.
MP, Conceptualization, Resources, Supervision, Funding acquisition, Methodology, Project administration, Writing—review and editing.
Additional files
Sources, STAG2 status and authentication information (STR fingerprinting) of cell lines are listed.
Major datasets
The following previously published datasets were used:
Cerami E,Gao J,Dogrusoz U,Gross BE,Sumer SO,Aksoy BA,Jacobsen A,Byrne CJ,Heuer ML,Larsson E,Antipin Y,Reva B,Goldberg AP,Sander C,Schultz N,2012,The cBio cancer genomics portal: an open platform for exploring multidimensional cancer genomics data,https://github.com/cBioPortal/datahub/tree/master/public,Publicly available via the cBioPortal GitHub (https://github.com/cBioPortal)
Vivian J,Rao AA,Nothaft FA,Ketchum C,Armstrong J,Novak A,Pfeil J,Narkizian J,Deran AD,Musselman-Brown A,Schmidt H,Amstutz P,Craft B,Goldman M,Rosenbloom K,Cline M,O'Connor B,Hanna M,Birger C,Kent WJ,Patterson DA,Joseph AD,Zhu J,Zaranek S,Getz G,Haussler D,Paten B,2017,Toil enables reproducible, open source, big biomedical data analyses,https://xenabrowser.net/datapages/?dataset=TcgaTargetGtex_rsem_gene_tpm&host=https://toil.xenahubs.net,Publicly available via the UCSC Xena data hub (http://xena.ucsc.edu/)
References
- Balbás-Martínez C, Sagrera A, Carrillo-de-Santa-Pau E, Earl J, Márquez M, Vazquez M, Lapi E, Castro-Giner F, Beltran S, Bayés M, Carrato A, Cigudosa JC, Domínguez O, Gut M, Herranz J, Juanpere N, Kogevinas M, Langa X, López-Knowles E, Lorente JA, Lloreta J, Pisano DG, Richart L, Rico D, Salgado RN, Tardón A, Chanock S, Heath S, Valencia A, Losada A, Gut I, Malats N, Real FX. Recurrent inactivation of STAG2 in bladder Cancer is not associated with aneuploidy. Nature Genetics. 2013;45:1464–1469. doi: 10.1038/ng.2799. [DOI] [PMC free article] [PubMed] [Google Scholar]
- Ban J, Aryee DN, Fourtouna A, van der Ent W, Kauer M, Niedan S, Machado I, Rodriguez-Galindo C, Tirado OM, Schwentner R, Picci P, Flanagan AM, Berg V, Strauss SJ, Scotlandi K, Lawlor ER, Snaar-Jagalska E, Llombart-Bosch A, Kovar H. Suppression of deacetylase SIRT1 mediates tumor-suppressive NOTCH response and offers a novel treatment option in metastatic Ewing sarcoma. Cancer Research. 2014;74:6578–6588. doi: 10.1158/0008-5472.CAN-14-1736. [DOI] [PubMed] [Google Scholar]
- Barber TD, McManus K, Yuen KW, Reis M, Parmigiani G, Shen D, Barrett I, Nouhi Y, Spencer F, Markowitz S, Velculescu VE, Kinzler KW, Vogelstein B, Lengauer C, Hieter P. Chromatid cohesion defects may underlie chromosome instability in human colorectal cancers. PNAS. 2008;105:3443–3448. doi: 10.1073/pnas.0712384105. [DOI] [PMC free article] [PubMed] [Google Scholar]
- Benedetti L, Cereda M, Monteverde L, Desai N, Ciccarelli FD. Synthetic lethal interaction between the tumour suppressor STAG2 and its paralog STAG1. Oncotarget. 2017;8:37619–37632. doi: 10.18632/oncotarget.16838. [DOI] [PMC free article] [PubMed] [Google Scholar]
- Brohl AS, Solomon DA, Chang W, Wang J, Song Y, Sindiri S, Patidar R, Hurd L, Chen L, Shern JF, Liao H, Wen X, Gerard J, Kim JS, Lopez Guerrero JA, Machado I, Wai DH, Picci P, Triche T, Horvai AE, Miettinen M, Wei JS, Catchpool D, Llombart-Bosch A, Waldman T, Khan J. The genomic landscape of the Ewing Sarcoma family of tumors reveals recurrent STAG2 mutation. PLoS Genetics. 2014;10:e1004475. doi: 10.1371/journal.pgen.1004475. [DOI] [PMC free article] [PubMed] [Google Scholar]
- Brummelkamp TR, Bernards R, Agami R. A system for stable expression of short interfering RNAs in mammalian cells. Science. 2002;296:550–553. doi: 10.1126/science.1068999. [DOI] [PubMed] [Google Scholar]
- Canudas S, Smith S. Differential regulation of telomere and centromere cohesion by the Scc3 homologues SA1 and SA2, Respectively, in human cells. The Journal of Cell Biology. 2009;187:165–173. doi: 10.1083/jcb.200903096. [DOI] [PMC free article] [PubMed] [Google Scholar]
- Castro E, Mateo J, Olmos D, de Bono JS. Targeting DNA repair: the role of PARP inhibition in the treatment of Castration-Resistant prostate Cancer. Cancer Journal. 2016;22:353–356. doi: 10.1097/PPO.0000000000000219. [DOI] [PubMed] [Google Scholar]
- Cerami E, Gao J, Dogrusoz U, Gross BE, Sumer SO, Aksoy BA, Jacobsen A, Byrne CJ, Heuer ML, Larsson E, Antipin Y, Reva B, Goldberg AP, Sander C, Schultz N. The cBio Cancer genomics portal: an open platform for exploring multidimensional Cancer genomics data. Cancer Discovery. 2012;2:401–404. doi: 10.1158/2159-8290.CD-12-0095. [DOI] [PMC free article] [PubMed] [Google Scholar]
- Crompton BD, Stewart C, Taylor-Weiner A, Alexe G, Kurek KC, Calicchio ML, Kiezun A, Carter SL, Shukla SA, Mehta SS, Thorner AR, de Torres C, Lavarino C, Suñol M, McKenna A, Sivachenko A, Cibulskis K, Lawrence MS, Stojanov P, Rosenberg M, Ambrogio L, Auclair D, Seepo S, Blumenstiel B, DeFelice M, Imaz-Rosshandler I, Schwarz-Cruz Y Celis A, Rivera MN, Rodriguez-Galindo C, Fleming MD, Golub TR, Getz G, Mora J, Stegmaier K. The genomic landscape of pediatric Ewing sarcoma. Cancer Discovery. 2014;4:1326–1341. doi: 10.1158/2159-8290.CD-13-1037. [DOI] [PubMed] [Google Scholar]
- Deshaies RJ. Protein degradation: prime time for PROTACs. Nature Chemical Biology. 2015;11:634–635. doi: 10.1038/nchembio.1887. [DOI] [PubMed] [Google Scholar]
- GTEx Consortium The Genotype-Tissue Expression (GTEx) project. Nature Genetics. 2013;45:580–585. doi: 10.1038/ng.2653. [DOI] [PMC free article] [PubMed] [Google Scholar]
- Galeev R, Baudet A, Kumar P, Rundberg Nilsson A, Nilsson B, Soneji S, Törngren T, Borg Å, Kvist A, Larsson J. Genome-wide RNAi Screen identifies Cohesin genes as modifiers of renewal and differentiation in human HSCs. Cell Reports. 2016;14:2988–3000. doi: 10.1016/j.celrep.2016.02.082. [DOI] [PubMed] [Google Scholar]
- Gao J, Aksoy BA, Dogrusoz U, Dresdner G, Gross B, Sumer SO, Sun Y, Jacobsen A, Sinha R, Larsson E, Cerami E, Sander C, Schultz N. Integrative analysis of complex Cancer genomics and clinical profiles using the cBioPortal. Science Signaling. 2013;6:pl1. doi: 10.1126/scisignal.2004088. [DOI] [PMC free article] [PubMed] [Google Scholar]
- Guo G, Sun X, Chen C, Wu S, Huang P, Li Z, Dean M, Huang Y, Jia W, Zhou Q, Tang A, Yang Z, Li X, Song P, Zhao X, Ye R, Zhang S, Lin Z, Qi M, Wan S, Xie L, Fan F, Nickerson ML, Zou X, Hu X, Xing L, Lv Z, Mei H, Gao S, Liang C, Gao Z, Lu J, Yu Y, Liu C, Li L, Fang X, Jiang Z, Yang J, Li C, Zhao X, Chen J, Zhang F, Lai Y, Lin Z, Zhou F, Chen H, Chan HC, Tsang S, Theodorescu D, Li Y, Zhang X, Wang J, Yang H, Gui Y, Wang J, Cai Z. Whole-genome and whole-exome sequencing of bladder Cancer identifies frequent alterations in genes involved in sister chromatid cohesion and segregation. Nature Genetics. 2013;45:1459–1463. doi: 10.1038/ng.2798. [DOI] [PMC free article] [PubMed] [Google Scholar]
- Hara K, Zheng G, Qu Q, Liu H, Ouyang Z, Chen Z, Tomchick DR, Yu H. Structure of cohesin subcomplex pinpoints direct shugoshin-Wapl antagonism in centromeric cohesion. Nature Structural & Molecular Biology. 2014;21:864–870. doi: 10.1038/nsmb.2880. [DOI] [PMC free article] [PubMed] [Google Scholar]
- Hart T, Chandrashekhar M, Aregger M, Steinhart Z, Brown KR, MacLeod G, Mis M, Zimmermann M, Fradet-Turcotte A, Sun S, Mero P, Dirks P, Sidhu S, Roth FP, Rissland OS, Durocher D, Angers S, Moffat J. High-Resolution CRISPR Screens Reveal Fitness genes and Genotype-Specific Cancer liabilities. Cell. 2015;163:1515–1526. doi: 10.1016/j.cell.2015.11.015. [DOI] [PubMed] [Google Scholar]
- Hill VK, Kim JS, Waldman T. Cohesin mutations in human Cancer. Biochimica Et Biophysica Acta (BBA) - Reviews on Cancer. 2016;1866:1–11. doi: 10.1016/j.bbcan.2016.05.002. [DOI] [PMC free article] [PubMed] [Google Scholar]
- Hu B, Itoh T, Mishra A, Katoh Y, Chan KL, Upcher W, Godlee C, Roig MB, Shirahige K, Nasmyth K. ATP hydrolysis is required for relocating cohesin from sites occupied by its Scc2/4 loading complex. Current Biology. 2011;21:12–24. doi: 10.1016/j.cub.2010.12.004. [DOI] [PMC free article] [PubMed] [Google Scholar]
- Kim G, Ison G, McKee AE, Zhang H, Tang S, Gwise T, Sridhara R, Lee E, Tzou A, Philip R, Chiu HJ, Ricks TK, Palmby T, Russell AM, Ladouceur G, Pfuma E, Li H, Zhao L, Liu Q, Venugopal R, Ibrahim A, Pazdur R. FDA Approval Summary: olaparib Monotherapy in patients with deleterious germline BRCA-Mutated Advanced ovarian Cancer treated with three or more lines of Chemotherapy. Clinical Cancer Research. 2015;21:4257–4261. doi: 10.1158/1078-0432.CCR-15-0887. [DOI] [PubMed] [Google Scholar]
- Kim JS, He X, Orr B, Wutz G, Hill V, Peters JM, Compton DA, Waldman T. Intact cohesion, Anaphase, and chromosome segregation in human cells harboring Tumor-Derived mutations in STAG2. PLOS Genetics. 2016;12:e1005865. doi: 10.1371/journal.pgen.1005865. [DOI] [PMC free article] [PubMed] [Google Scholar]
- Kon A, Shih LY, Minamino M, Sanada M, Shiraishi Y, Nagata Y, Yoshida K, Okuno Y, Bando M, Nakato R, Ishikawa S, Sato-Otsubo A, Nagae G, Nishimoto A, Haferlach C, Nowak D, Sato Y, Alpermann T, Nagasaki M, Shimamura T, Tanaka H, Chiba K, Yamamoto R, Yamaguchi T, Otsu M, Obara N, Sakata-Yanagimoto M, Nakamaki T, Ishiyama K, Nolte F, Hofmann WK, Miyawaki S, Chiba S, Mori H, Nakauchi H, Koeffler HP, Aburatani H, Haferlach T, Shirahige K, Miyano S, Ogawa S. Recurrent mutations in multiple components of the cohesin complex in myeloid neoplasms. Nature Genetics. 2013;45:1232–1237. doi: 10.1038/ng.2731. [DOI] [PubMed] [Google Scholar]
- Lawrence MS, Stojanov P, Mermel CH, Robinson JT, Garraway LA, Golub TR, Meyerson M, Gabriel SB, Lander ES, Getz G. Discovery and saturation analysis of Cancer genes across 21 tumour types. Nature. 2014;505:495–501. doi: 10.1038/nature12912. [DOI] [PMC free article] [PubMed] [Google Scholar]
- Leiserson MD, Vandin F, Wu HT, Dobson JR, Eldridge JV, Thomas JL, Papoutsaki A, Kim Y, Niu B, McLellan M, Lawrence MS, Gonzalez-Perez A, Tamborero D, Cheng Y, Ryslik GA, Lopez-Bigas N, Getz G, Ding L, Raphael BJ. Pan-cancer network analysis identifies combinations of rare somatic mutations across pathways and protein complexes. Nature Genetics. 2015;47:106–114. doi: 10.1038/ng.3168. [DOI] [PMC free article] [PubMed] [Google Scholar]
- Losada A, Yokochi T, Kobayashi R, Hirano T. Identification and characterization of SA/Scc3p subunits in the xenopus and human cohesin complexes. The Journal of Cell Biology. 2000;150:405–416. doi: 10.1083/jcb.150.3.405. [DOI] [PMC free article] [PubMed] [Google Scholar]
- Losada A. Cohesin in Cancer: chromosome segregation and beyond. Nature Reviews Cancer. 2014;14:389–393. doi: 10.1038/nrc3743. [DOI] [PubMed] [Google Scholar]
- Mazumdar C, Shen Y, Xavy S, Zhao F, Reinisch A, Li R, Corces MR, Flynn RA, Buenrostro JD, Chan SM, Thomas D, Koenig JL, Hong WJ, Chang HY, Majeti R. Leukemia-Associated Cohesin Mutants dominantly enforce stem cell programs and impair human hematopoietic progenitor differentiation. Cell Stem Cell. 2015;17:675–688. doi: 10.1016/j.stem.2015.09.017. [DOI] [PMC free article] [PubMed] [Google Scholar]
- Mirza MR, Monk BJ, Herrstedt J, Oza AM, Mahner S, Redondo A, Fabbro M, Ledermann JA, Lorusso D, Vergote I, Ben-Baruch NE, Marth C, Mądry R, Christensen RD, Berek JS, Dørum A, Tinker AV, du Bois A, González-Martín A, Follana P, Benigno B, Rosenberg P, Gilbert L, Rimel BJ, Buscema J, Balser JP, Agarwal S, Matulonis UA, ENGOT-OV16/NOVA Investigators Niraparib Maintenance therapy in Platinum-Sensitive, recurrent ovarian Cancer. New England Journal of Medicine. 2016;375:2154–2164. doi: 10.1056/NEJMoa1611310. [DOI] [PubMed] [Google Scholar]
- Mullenders J, Aranda-Orgilles B, Lhoumaud P, Keller M, Pae J, Wang K, Kayembe C, Rocha PP, Raviram R, Gong Y, Premsrirut PK, Tsirigos A, Bonneau R, Skok JA, Cimmino L, Hoehn D, Aifantis I. Cohesin loss alters adult hematopoietic stem cell homeostasis, leading to myeloproliferative neoplasms. The Journal of Experimental Medicine. 2015;212:1833–1850. doi: 10.1084/jem.20151323. [DOI] [PMC free article] [PubMed] [Google Scholar]
- Murayama Y, Uhlmann F. Biochemical reconstitution of topological DNA binding by the cohesin ring. Nature. 2014;505:367–371. doi: 10.1038/nature12867. [DOI] [PMC free article] [PubMed] [Google Scholar]
- Oza AM, Cibula D, Benzaquen AO, Poole C, Mathijssen RH, Sonke GS, Colombo N, Špaček J, Vuylsteke P, Hirte H, Mahner S, Plante M, Schmalfeldt B, Mackay H, Rowbottom J, Lowe ES, Dougherty B, Barrett JC, Friedlander M. Olaparib combined with chemotherapy for recurrent platinum-sensitive ovarian Cancer: a randomised phase 2 trial. The Lancet Oncology. 2015;16:87–97. doi: 10.1016/S1470-2045(14)71135-0. [DOI] [PubMed] [Google Scholar]
- Peters JM, Nishiyama T. Sister chromatid cohesion. Cold Spring Harbor Perspectives in Biology. 2012;4:a011130. doi: 10.1101/cshperspect.a011130. [DOI] [PMC free article] [PubMed] [Google Scholar]
- Pezzi N, Prieto I, Kremer L, Pérez Jurado LA, Valero C, Del Mazo J, Martínez-A C, Barbero JL. STAG3, a novel gene encoding a protein involved in meiotic chromosome pairing and location of STAG3-related genes flanking the Williams-Beuren syndrome deletion. FASEB Journal : Official Publication of the Federation of American Societies for Experimental Biology. 2000;14:581–592. doi: 10.1096/fasebj.14.3.581. [DOI] [PubMed] [Google Scholar]
- Prieto I, Suja JA, Pezzi N, Kremer L, Martínez-A C, Rufas JS, Barbero JL. Mammalian STAG3 is a cohesin specific to sister chromatid arms in meiosis I. Nature Cell Biology. 2001;3:761–766. doi: 10.1038/35087082. [DOI] [PubMed] [Google Scholar]
- Remeseiro S, Cuadrado A, Carretero M, Martínez P, Drosopoulos WC, Cañamero M, Schildkraut CL, Blasco MA, Losada A. Cohesin-SA1 deficiency drives aneuploidy and tumourigenesis in mice due to impaired replication of telomeres. The EMBO Journal. 2012;31:2076–2089. doi: 10.1038/emboj.2012.11. [DOI] [PMC free article] [PubMed] [Google Scholar]
- Solomon DA, Kim T, Diaz-Martinez LA, Fair J, Elkahloun AG, Harris BT, Toretsky JA, Rosenberg SA, Shukla N, Ladanyi M, Samuels Y, James CD, Yu H, Kim JS, Waldman T. Mutational inactivation of STAG2 causes aneuploidy in human Cancer. Science. 2011;333:1039–1043. doi: 10.1126/science.1203619. [DOI] [PMC free article] [PubMed] [Google Scholar]
- Solomon DA, Kim JS, Bondaruk J, Shariat SF, Wang ZF, Elkahloun AG, Ozawa T, Gerard J, Zhuang D, Zhang S, Navai N, Siefker-Radtke A, Phillips JJ, Robinson BD, Rubin MA, Volkmer B, Hautmann R, Küfer R, Hogendoorn PC, Netto G, Theodorescu D, James CD, Czerniak B, Miettinen M, Waldman T. Frequent truncating mutations of STAG2 in bladder Cancer. Nature Genetics. 2013;45:1428–1430. doi: 10.1038/ng.2800. [DOI] [PMC free article] [PubMed] [Google Scholar]
- Sumara I, Vorlaufer E, Gieffers C, Peters BH, Peters JM. Characterization of vertebrate cohesin complexes and their regulation in prophase. The Journal of Cell Biology. 2000;151:749–762. doi: 10.1083/jcb.151.4.749. [DOI] [PMC free article] [PubMed] [Google Scholar]
- Taylor CF, Platt FM, Hurst CD, Thygesen HH, Knowles MA. Frequent inactivating mutations of STAG2 in bladder Cancer are associated with low tumour grade and stage and inversely related to chromosomal copy number changes. Human Molecular Genetics. 2014;23:1964–1974. doi: 10.1093/hmg/ddt589. [DOI] [PMC free article] [PubMed] [Google Scholar]
- Thota S, Viny AD, Makishima H, Spitzer B, Radivoyevitch T, Przychodzen B, Sekeres MA, Levine RL, Maciejewski JP. Genetic alterations of the cohesin complex genes in myeloid malignancies. Blood. 2014;124:1790–1798. doi: 10.1182/blood-2014-04-567057. [DOI] [PMC free article] [PubMed] [Google Scholar]
- Tirode F, Surdez D, Ma X, Parker M, Le Deley MC, Bahrami A, Zhang Z, Lapouble E, Grossetête-Lalami S, Rusch M, Reynaud S, Rio-Frio T, Hedlund E, Wu G, Chen X, Pierron G, Oberlin O, Zaidi S, Lemmon G, Gupta P, Vadodaria B, Easton J, Gut M, Ding L, Mardis ER, Wilson RK, Shurtleff S, Laurence V, Michon J, Marec-Bérard P, Gut I, Downing J, Dyer M, Zhang J, Delattre O, St. Jude Children's Research Hospital–Washington University Pediatric Cancer Genome Project and the International Cancer Genome Consortium Genomic landscape of Ewing sarcoma defines an aggressive subtype with co-association of STAG2 and TP53 mutations. Cancer Discovery. 2014;4:1342–1353. doi: 10.1158/2159-8290.CD-14-0622. [DOI] [PMC free article] [PubMed] [Google Scholar]
- Tóth A, Ciosk R, Uhlmann F, Galova M, Schleiffer A, Nasmyth K. Yeast cohesin complex requires a conserved protein, Eco1p(Ctf7), to establish cohesion between sister chromatids during DNA replication. Genes & Development. 1999;13:320–333. doi: 10.1101/gad.13.3.320. [DOI] [PMC free article] [PubMed] [Google Scholar]
- Viny AD, Ott CJ, Spitzer B, Rivas M, Meydan C, Papalexi E, Yelin D, Shank K, Reyes J, Chiu A, Romin Y, Boyko V, Thota S, Maciejewski JP, Melnick A, Bradner JE, Levine RL. Dose-dependent role of the cohesin complex in normal and malignant hematopoiesis. The Journal of Experimental Medicine. 2015;212:1819–1832. doi: 10.1084/jem.20151317. [DOI] [PMC free article] [PubMed] [Google Scholar]
- Walter MJ, Shen D, Ding L, Shao J, Koboldt DC, Chen K, Larson DE, McLellan MD, Dooling D, Abbott R, Fulton R, Magrini V, Schmidt H, Kalicki-Veizer J, O'Laughlin M, Fan X, Grillot M, Witowski S, Heath S, Frater JL, Eades W, Tomasson M, Westervelt P, DiPersio JF, Link DC, Mardis ER, Ley TJ, Wilson RK, Graubert TA. Clonal architecture of secondary acute myeloid leukemia. New England Journal of Medicine. 2012;366:1090–1098. doi: 10.1056/NEJMoa1106968. [DOI] [PMC free article] [PubMed] [Google Scholar]