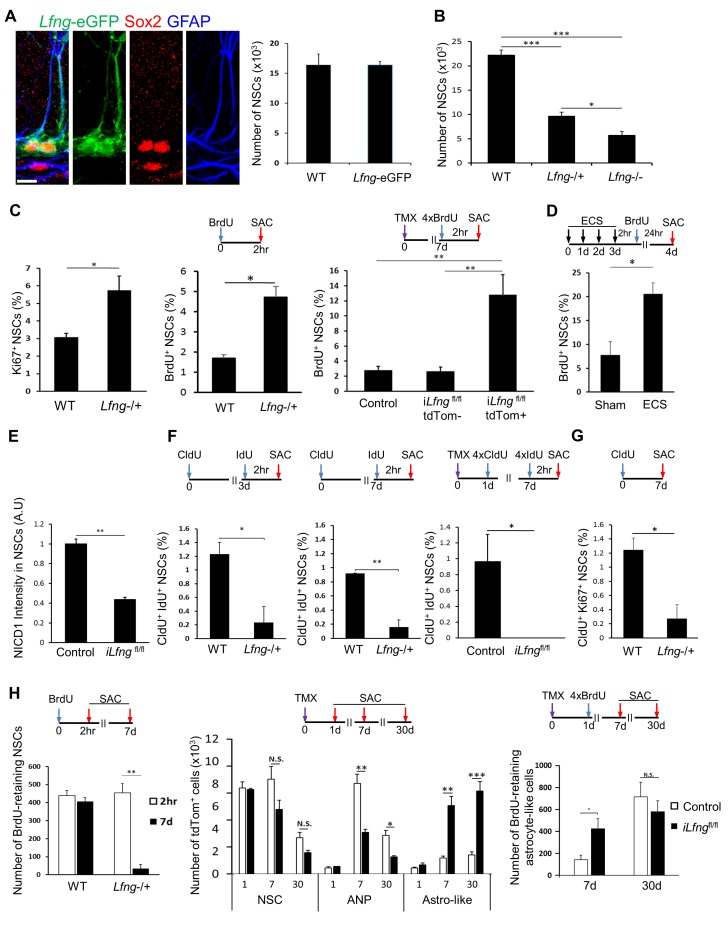
Figure 5. Lfng preserves NSCs by controlling their cell cycle.
(A) Left panel: Lfng-eGFP NSCs express GFAP+ radial processes originating from the Sox2+ cell nuclei located in the SGZ. Right panel: The total number of GFAP+ Sox2+ NSCs in 4-month-old wild-type mice does not differ from the total number of eGFP+ NSCs in 4 month-old Lfng-eGFP (N = 3 per group; Student’s t-test, p=0.99). Scale bar = 10 µm. (B) The total number of NSCs in 2-month-old wild-type, Lfng heterozygote (Lfng−/+), and homozygote (Lfng−/−) knockout mice shows Lfng dose-dependent decrease in the NSC population (N = 3–4 per group; One-way ANOVA p<0.00001, Tukey HSD post-hoc test: p<0.0001 for wild-type vs Lfng−/+ or Lfng−/−, p=0.0484 for Lfng−/+ vs Lfng−/−). (C) Lack of Lfng promotes increased division of NSCs. Left panel: NSCs lacking Lfng have a higher ratio of cycling Ki67+ NSCs compared to wild-type (N = 4 per group; Student’s t-test p=0.0221). Middle panel: NSCs lacking Lfng have a higher ratio of actively dividing, BrdU+ NSCs compared to wild-type (N = 4 per group; Student’s t-test p=0.0017). Right panel: Lfng acts cell-autonomously and in a dose-dependent manner to control the NSC division (N = 4 per group). The ratio of BrdU+ NSCs was compared between iLfngfl/fl mutant clones (tdTomato+), iLfngfl/fl wild type clones (tdTomato- GFAP+ Sox2+), and Lfng-CreERT2; RCL-tdT control mice (tdTomato+ GFAP+ Sox2+). N = 4; p=0.9978 for control vs iLfngfl/fl tdTom- clones; p=0.0049 for control vs iLfngfl/fl tdTom+ clones; p=0.0045 for iLfngfl/fl tdTom- clones vs iLfngfl/fl tdTom+ clones. (D) NSCs lacking Lfng are hyper-activated in response to ECS treatment (N = 3–4 per group; Student’s t-test, p=0.0178). (E) Lack of Lfng decreases Notch signal intensity in mutant NSCs. Relative intensities of NICD1 staining are significantly lower in iLfngfl/fl mutant NSCs compared to control (N = 4 for control; N = 3 for iLfngfl/fl; Student’s t-test, p=0.0004). (F) NSCs lacking Lfng spend less time in the active state than wild-type NSCs. Lfng absence is associated with decreased S-phase re-entry 3 (left panel) and 7 (middle panel) days following the initial division compared to the wild-type NSCs (N = 4 per group; Student’s t-test, p=0.0024 for 3d, p=0.0003 for 7d). CldU+ IdU+ cells represent NSCs that underwent first division at the time of CldU injection (day 0) and were in S-phase at the time of IdU injection (day 3 or day 7). Right panel: In iLfngfl/fl mice, no NSCs were found that re-entered S-phase 7 days after the initial division. CldU+ IdU+ cells represent NSCs that were induced at day 0, underwent first division 1 day post-induction (CldU+) and were in S-phase 7 days post-induction (IdU+; N = 3–4 per group; Student’s t-test, p=0.0014). (G) NSCs lacking Lfng mostly exit cell cycle within a week of first division. CldU+ Ki67+ NSCs represent NSCs that are actively cycling 7 days following the CldU injection (N = 4; Student’s t-test, p=0.0105). (H) NSCs lacking Lfng give rise to astrocyte-like cells. Left panel: The number of BrdU-retaining NSCs 7 days after the BrdU injection is significantly reduced in Lfng−/+ mice compared to wild-type (N = 4 per timepoint; Student’s t-test, p=0.0003). Middle panel: In iLfngfl/fl mice, significantly more tdTomato+ astrocyte-like cells accumulate 7 and 30 days following induction compared to controls, while the number of tdTomato+ ANPs significantly decreases (N = 4 per group, p=0.0003 and p<0.0001 for astrocyte-like cells, p=0.0024 and p=0.0049 for ANPs). Right panel: The number of BrdU-retaining astrocyte-like cells 7 days after the BrdU injection is significantly higher in iLfngfl/fl mice compared to controls, but the difference is lost at 30 days (N = 4 per group; Student’s t-test, p=0.0302 for 7 days, p=0.4412 for 30 days). Bars represent mean ± SEM. *p<0.05, **p<0.001, ***p<0.0001. See Figure 5—figure supplement 1 for further details.


