Abstract
Reports on the association between the PR-interval and atrial fibrillation (AF) are conflicting. We hypothesized that inconsistencies stem from that fact that the PR-interval is not a single electrocardiographic (ECG) phenotype, and it is more likely to represent a composite of several distinct components. We examined the association of the PR-interval and its components (P-wave onset to P-wave peak duration, P-wave peak to P-wave end duration, and PR-segment) with incident AF in 14,924 participants (mean age=54±5.8 years; 26% black; 55% female) from the Atherosclerosis Risk In Communities study. The PR-interval and its components were automatically measured at baseline (1987–1989) from standard 12-lead ECGs. PR-interval >200 ms was considered prolonged and values >95th percentile defined abnormal PR-interval components. AF was ascertained during follow-up through December 31, 2010. Over a median follow-up of 21.2 years, 1,985 (13%) participants developed AF. Prolonged PR-interval was associated with an increased risk of AF (HR=1.19, 95% CI=1.02, 1.40). However, PR-interval components showed varying levels of associations with AF (P-wave onset to P-wave peak duration: HR=1.57, 95%CI=1.31, 1.88; P-wave peak to P-wave end duration: HR=1.20, 95%CI=0.99, 1.46; and PR-segment: HR=1.05, 95%CI=0.85, 1.29). Additionally, the components of the PR-interval had weak to moderate correlation with each other (correlation r ranged from −0.44 to 0.06). In conclusion, our findings suggest that the PR-interval represents a composite of distinct components that are not uniformly associated with AF. Without considering the contribution of each component, inconsistent associations between the PR-interval and AF are inevitable.
Keywords: electrocardiogram, atrial fibrillation, PR-interval
INTRODUCTION
The PR-interval on the resting electrocardiogram (ECG) has been shown to predict atrial fibrillation (AF).1–3 However, inconsistencies in the association between prolonged PR-interval and AF have been reported, with some studies showing non-significant associations,4, 5 and others showing short PR-interval to be a stronger predictor of AF.6 A possible explanation for the observed inconsistencies relates to the distinct components of the PR-interval: time from P-wave onset to peak P-wave (conduction within the right atrium), time from peak P-wave to the end of P-wave (conduction within the left atrium), and the PR-segment (atrioventricular (AV) conduction).7 This suggests that abnormalities of the PR-interval are not uniform.8 Therefore, an examination of the association between each component of the PR-interval and AF is needed to improve our ability to predict AF events in the general population. Accordingly, we examined the association between each component of the PR-interval and AF in the Atherosclerosis Risk In Communities (ARIC) study. We hypothesized that the components of the PR-interval are not strongly correlated, and that the magnitude of the association with AF will vary by each component.
METHODS
A total of 15,792 community-dwelling men and women between 45 and 64 years of age enrolled in ARIC between 1987 and 1989 from four field centers across the United States (Washington County, MD; Forsyth County, NC; Jackson, MS; suburban Minneapolis, MN). Participants returned for 4 follow-up examinations (1990–1992, 1993–1995, 1996–1998, and 2011–2013), and participants have continued to be followed via annual telephone calls to ascertain study endpoints. Endpoints also are ascertained by review of hospital discharge records that include any cardiovascular diagnoses from hospitals in the study communities. The study was approved by the institutional review boards at all participating universities and all participants provided written informed consent at the time of study enrollment. For this analysis, we excluded participants with baseline AF, those with missing baseline covariates, and participants with missing follow-up data. Additionally, we excluded ARIC participants with race other than black or white, and the small number of black participants from Washington County and Minneapolis.
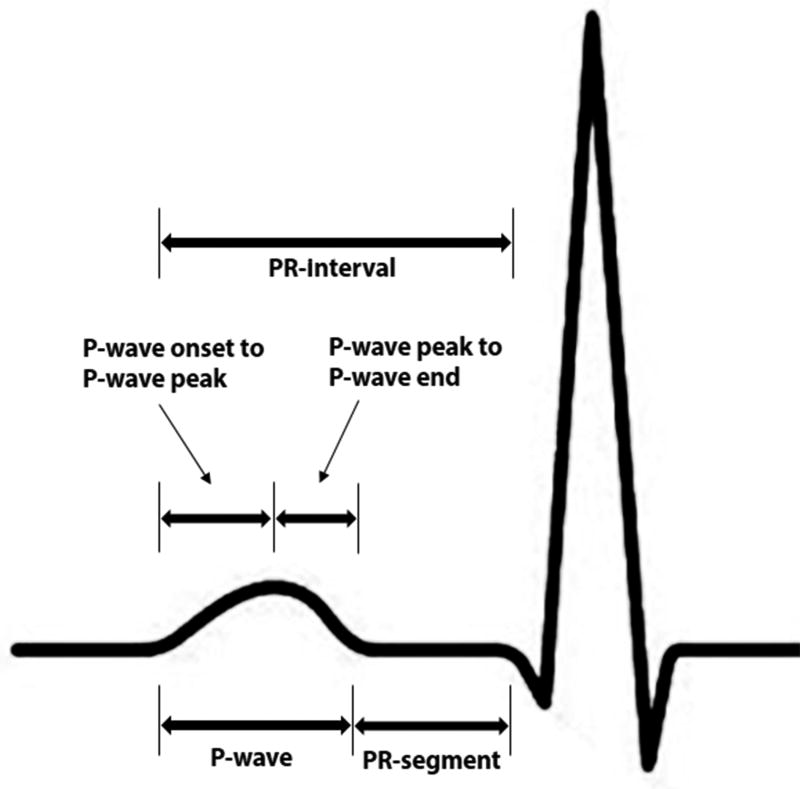
Digital 12-lead ECGs were obtained at baseline using MAC PC ECG machines (Marquette Electronics, Milwaukee, WI). All ECGs were read at the Epidemiology Coordinating and Research Centre at the University of Alberta (Edmonton, Alberta, Canada) during the initial phases of the study, and at the Epidemiological Cardiology Research Center at the Wake Forest School of Medicine (Winston-Salem, North Carolina, USA) during later phases. After visual inspection for errors and inadequate quality, ECGs were automatically processed using GE Marquette 12-SL version 2001 (GE, Milwaukee, Wisconsin). The maximum values in all 12 leads for the following were computed: P-wave duration, P-wave onset to P-wave peak duration, and PR-interval. P-wave onset to P-wave peak was defined as the time from P-wave onset to first large peak of the P-wave. P-wave peak to P-wave end duration was computed by subtracting maximum P-wave onset to P-wave peak duration from maximum P-wave duration. Similarly, PR-segment was computed by subtracting maximum P-wave duration from maximum PR-interval. The PR-interval components used in this analysis are depicted in Figure 1. To appropriately compare the magnitude of the association between PR-interval components and AF, we used the 95th percentile value of each component to define abnormality/prolongation. The common clinical cut-off point of PR-interval >200 ms also was used. In additional analysis, we used the 95th percentile as a cut-off point to define prolonged PR-interval.
Figure 1. PR-Interval Components.
Cases of AF were identified from study visit ECGs, review of hospital discharge diagnoses, and death certificates.9 A cardiologist visually confirmed all AF cases automatically detected from the study ECGs.1 Information on hospitalizations during follow-up was obtained from annual follow-up calls and surveillance of local hospitals, with hospital discharge diagnosis codes collected by trained abstractors. AF during follow-up was defined by International Classification of Diseases, 9th Revision codes 427.31 or 427.32. AF cases detected in the same hospitalization as open cardiac surgery were not included since these were considered transient.10
Age, sex, and race were self-reported. Tobacco use was defined as ever (e.g., current or former) or never smoker. Diabetes was defined as a fasting glucose level ≥126 mg/dL (or non-fasting glucose ≥200 mg/dL), a self-reported physician diagnosis of diabetes, or the use of diabetes medications. Systolic blood pressure was obtained from each participant using sphygmomanometers to measure 3 readings in the upright position after 5 minutes of rest. The average of the last 2 measurements was used as the final reading. Antihypertensive medication use was self-reported. Body mass index was defined as the weight in kilograms divided by the square of the height in meters. Resting heart rate was obtained from baseline ECG data. Low-density lipoprotein cholesterol levels were calculated indirectly using cholesterol values assayed from serum samples obtained at the baseline study visit. Prevalent heart failure was defined as present if participants reported taking heart failure medications or if participants met all 3 of the Gothenburg criteria.11 Prevalent coronary heart disease was defined by self-reported history of physician-diagnosed myocardial infarction, coronary artery bypass surgery, coronary angioplasty, or electrocardiographic evidence of myocardial infarction.
Baseline characteristics were examined by the presence of incident AF. Differences between groups were tested using the chi-square method for categorical variables and the student’s t-test for continuous variables. The correlation among the components of the PR-interval was examined and Pearson's coefficient (r) was calculated. Kaplan-Meier estimates were used to compute the cumulative incidence of AF. Follow-up time was defined as the time between the baseline visit until AF development, loss to follow-up, death, or end of the study period (December 31, 2010). Cox regression was used to compute hazard ratios (HR) and 95% confidence intervals (CI) for the associations of prolonged PR-interval (>200 ms) and prolonged components (values >95th percentile) with AF. Multivariable models were constructed with baseline characteristics as follows: Model 1 adjusted for age, sex, and race; Model 2 adjusted for Model 1 covariates plus body mass index, heart rate, systolic blood pressure, smoking, diabetes, low-density lipoprotein cholesterol, coronary heart disease, and heart failure. Subgroup analyses were performed by age (dichotomized at the median age for study participants), sex, and race. Although the focus of the analysis was prolongation of the PR-interval and its components as categorical variables, we also examined the dose–response relationship between each component of the PR-interval as continuous variables and AF using a restricted cubic spline model with incorporated knots at the 5th, 50th, and 95th percentiles.12 Due to the results of these graphs that showed non-linear associations, we conducted additional analyses to examine the associations of short (<5th percentile) and prolonged (>95th percentile) PR-interval components with AF (reference group=values between 5th and 95th percentiles). For the PR-interval, we used values <120 ms and <5th percentile, separately, to define short PR-interval and values >200 ms and >95th percentile, separately, to define prolonged PR-interval (reference group=values between 120 ms and 200 ms, and between 5th and 95th percentiles, respectively). Statistical significance, including tests for interactions, was defined as p <0.05. SAS version 9.4 (Cary, NC) was used for all analyses.
RESULTS
A total of 14,924 (mean age=54±5.8 years; 26% black; 55% female) participants were included in the final analysis. Baseline characteristics stratified by incident AF are shown in Table 1.
Table 1.
Baseline Characteristics
| Characteristics | Incident Atrial Fibrillation
|
P-value* | |
|---|---|---|---|
| Yes (n=1,985) |
No (n=12,939) |
||
| Age, mean ± SD (years) | 57 ± 5.5 | 54 ± 5.7 | <0.0001 |
| Male | 1,077 (54%) | 5,611 (43%) | <0.0001 |
| Black | 379 (19%) | 3,497 (27%) | <0.0001 |
| Ever smoker | 1,309 (66%) | 7,414 (57%) | <0.0001 |
| Diabetes mellitus | 322 (16%) | 1,345 (10%) | <0.0001 |
| LDL cholesterol, mean ± SD (mg/dl) | 139 ± 38 | 137 ± 39 | 0.036 |
| Body mass index, mean ± SD (kg/m2) | 29 ± 5.8 | 27 ± 5.2 | <0.0001 |
| Systolic blood pressure, mean ± SD (mm Hg) | 126 ± 19 | 120 ± 19 | <0.0001 |
| Antihypertensive medications | 868 (44%) | 3,599 (28%) | <0.0001 |
| Coronary heart disease | 188 (9.5%) | 510 (3.9%) | <0.0001 |
| Heart failure | 160 (8.1%) | 507 (3.9%) | <0.0001 |
| Heart rate, mean ± SD (bpm) | 66 ± 11 | 67 ± 10 | 0.012 |
| Prolonged PR-interval† | 174 (8.7%) | 875 (6.8%) | 0.0012 |
| Prolonged P-wave duration† | 166 (8.4%) | 549 (4.2%) | <0.0001 |
| Prolonged P-wave onset to P-wave peak duration† | 133 (6.7%) | 459 (3.6%) | <0.0001 |
| Prolonged P-wave peak to P-wave end duration† | 110 (5.5%) | 520 (4.0%) | 0.0017 |
| Prolonged PR-segment† | 95 (4.8%) | 581 (4.5%) | 0.56 |
Statistical significance for categorical data was tested using the chi-square procedure and continuous data was tested using the student’s t-test procedure.
PR-interval >200 ms and PR-interval component values >95th percentile of their distribution.
bpm=beats per minute; LDL=low-density lipoprotein; SD=standard deviation.
The components of the PR-interval were not strongly correlated with each other (correlation r = −0.44, 0.06 and −0.09 for the correlation between P-wave onset to P-wave peak duration with P-wave peak to P-wave end duration, P-wave onset to P-wave peak duration with PR-segment and P-wave peak to P-wave end duration with PR-segment, respectively).
Over a median follow-up of 21.2 years, a total of 1,985 (13%) participants developed AF. Prolonged PR-interval was associated with an increased risk of AF. However, its components showed varying levels of associations with AF (Table 2). Specifically, PR-segment was not associated with AF, while P-wave duration was strongly associated with an increased risk of AF. The association between P-wave duration and AF was limited to P-wave onset to P-wave peak duration rather than P-wave peak to P-wave end duration (Table 2). Similar results were observed in subgroups stratified by age, sex, and race (Table 3). A significant interaction was observed for PR-interval, with the association being stronger in females than males (Table 3).
Table 2.
Risk of Atrial Fibrillation associated with PR-Interval and Components
| PR-interval/component* | AF (n) |
Person-years | Incidence Rate per 1000 person-years (CI) |
Model 1† HR (95%CI) |
P-value | Model 2†† HR (95%CI) |
P-value |
|---|---|---|---|---|---|---|---|
| PR-interval | |||||||
| Normal | 1,811 | 2,59,893 | 7.0 (6.7, 7.3) | Ref | - | Ref | - |
| Prolonged | 174 | 18,555 | 9.4 (8.1, 10.9) | 1.28 (1.09, 1.50) | 0.0022 | 1.19 (1.02, 1.40) | 0.031 |
|
| |||||||
| P-wave | |||||||
| Normal | 1,819 | 2,66,768 | 6.8 (6.5, 7.1) | Ref | - | Ref | - |
| Prolonged | 166 | 11,682 | 14.2 (12.2, 16.5) | 1.92 (1.64, 2.26) | <0.0001 | 1.48 (1.26, 1.75) | <0.0001 |
|
| |||||||
| P-wave onset to P-wave peak | |||||||
| Normal | 1,852 | 2,68,950 | 6.9 (6.6, 7.2) | Ref | - | Ref | - |
| Prolonged | 133 | 9,450 | 14.0 (11.8, 16.6) | 2.01 (1.68, 2.40) | <0.0001 | 1.57 (1.31, 1.88) | <0.0001 |
|
| |||||||
| P-wave peak to P-wave end | |||||||
| Normal | 1,875 | 2,67,414 | 7.0 (6.7, 7.3) | Ref | - | Ref | - |
| Prolonged | 110 | 11,035 | 10.0 (8.3, 12.0) | 1.38 (1.14, 1.68) | 0.0010 | 1.20 (0.99, 1.46) | 0.061 |
|
| |||||||
| PR-segment | |||||||
| Normal | 1,890 | 2,66,021 | 7.1 (6.8, 7.4) | Ref | - | Ref | - |
| Prolonged | 95 | 12,428 | 7.6 (6.3, 9.3) | 1.04 (0.85, 1.28) | 0.71 | 1.05 (0.85, 1.29) | 0.67 |
PR-interval >200 ms and PR-interval component values >95th percentile of their distribution.
Adjusted for age, sex, and race.
Adjusted for Model 1 covariates plus body mass index, heart rate, systolic blood pressure, smoking, diabetes, low-density lipoprotein cholesterol, coronary heart disease, and heart failure.
AF=atrial fibrillation; CI=confidence interval; HR=hazard ratio.
Table 3.
Risk of Atrial Fibrillation associated with PR-Interval and Components by Age, Sex, and Race
| PR-interval/component* | Subgroup | HR (95%CI)† | P-value | P-interaction |
|---|---|---|---|---|
| Prolonged PR-interval | Age | |||
| <54 years | 1.22 (0.88, 1.69) | 0.24 | 0.85 | |
| ≥54 years | 1.23 (1.02, 1.47) | 0.027 | ||
| Sex | ||||
| Female | 1.43 (1.14, 1.80) | 0.0021 | 0.033 | |
| Male | 1.02 (0.82, 1.27) | 0.87 | ||
| Race | ||||
| Black | 1.08 (0.82, 1.44) | 0.58 | 0.31 | |
| White | 1.25 (1.03, 1.51) | 0.025 | ||
|
| ||||
| Prolonged P-wave | Age | |||
| <54 years | 1.44 (1.03, 1.99) | 0.032 | 0.67 | |
| ≥54 years | 1.59 (1.32, 1.92) | <0.0001 | ||
| Sex | ||||
| Female | 1.79 (1.39, 2.31) | <0.0001 | 0.056 | |
| Male | 1.34 (1.08, 1.65) | 0.0074 | ||
| Race | ||||
| Black | 1.67 (1.25, 2.24) | 0.0006 | 0.52 | |
| White | 1.42 (1.17, 1.73) | 0.0005 | ||
|
| ||||
| Prolonged P-wave onset to P-wave peak | Age | |||
| <54 years | 1.33 (0.92, 1.92) | 0.13 | 0.54 | |
| ≥54 years | 1.79 (1.46, 2.20) | <0.0001 | ||
| Sex | ||||
| Female | 1.50 (1.13, 1.99) | 0.0048 | 0.70 | |
| Male | 1.63 (1.29, 2.06) | <.0.0001 | ||
| Race | ||||
| Black | 1.48 (1.07, 2.05) | 0.018 | 0.45 | |
| White | 1.64 (1.32, 2.03) | <0.0001 | ||
|
| ||||
| Prolonged P-wave peak to P-wave end | Age | |||
| <54 years | 1.23 (0.87, 1.75) | 0.25 | 0.38 | |
| ≥54 years | 1.18 (0.93, 1.49) | 0.17 | ||
| Sex | ||||
| Female | 1.30 (0.96, 1.75) | 0.090 | 0.42 | |
| Male | 1.13 (0.87, 1.45) | 0.36 | ||
| Race | ||||
| Black | 1.12 (0.73, 1.74) | 0.60 | 0.78 | |
| White | 1.22 (0.98, 1.51) | 0.078 | ||
|
| ||||
| Prolonged PR-segment | Age | |||
| <54 years | 1.27 (0.84, 1.90) | 0.26 | 0.42 | |
| ≥54 years | 1.02 (0.80, 1.29) | 0.91 | ||
| Sex | ||||
| Female | 1.24 (0.93, 1.65) | 0.14 | 0.12 | |
| Male | 0.89 (0.65, 1.20) | 0.44 | ||
| Race | ||||
| Black | 0.88 (0.60, 1.30) | 0.53 | 0.21 | |
| White | 1.14 (0.89, 1.46) | 0.30 | ||
PR-interval >200 ms and PR-interval component values >95th percentile of their distribution.
HRs are presented for abnormal P-wave indices compared with those who had normal values. Model adjusted for age, sex, race, body mass index, heart rate, systolic blood pressure, smoking, diabetes, low-density lipoprotein cholesterol, coronary heart disease, and heart failure.
AF=atrial fibrillation; CI=confidence interval; HR=hazard ratio.
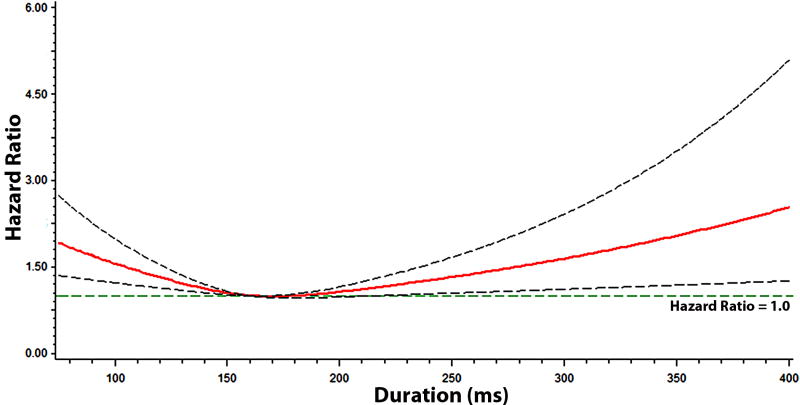
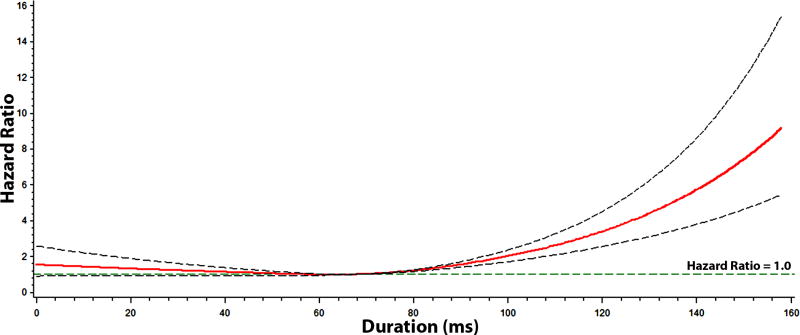
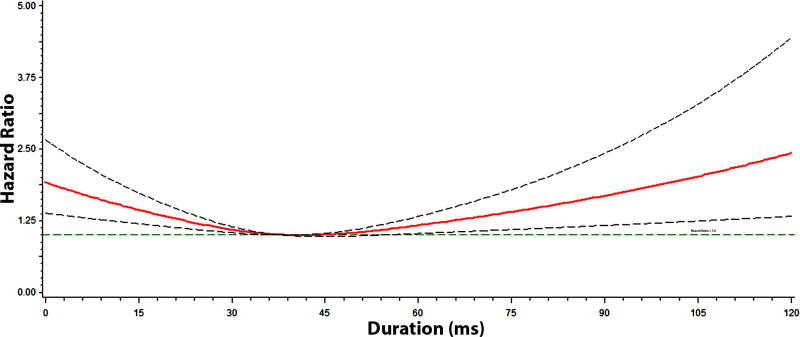
Figures 2, 3, 4, and 5 show the multivariable-adjusted dose-response relationships of the PR-interval and its components with AF. As shown, the associations of the PR-interval and its components with AF were not entirely linear. However, when PR-interval values between 120 and 200 ms, and PR-interval component values between 5th and 95th percentiles were used as the reference groups, the associations of prolonged PR-interval and its components with AF were similar to the main analysis (Supplemental Table 1). The association between prolonged PR-interval and AF did not vary with different cut-off points to define prolongation (e.g., >95th percentile and >200 ms) (Supplemental Table 2).
Figure 2. Risk of Atrial Fibrillation across PR-Interval*.
*Each hazard ratio was computed with the median PR-interval value of 160 ms as the reference, and was adjusted for age, sex, race, body mass index, heart rate, systolic blood pressure, smoking, diabetes, low-density lipoprotein cholesterol, coronary heart disease, and heart failure. Dotted-lines represent the 95% confidence interval.
Figure 3. Risk of Atrial Fibrillation across P-wave Onset to P-wave Peak Duration*.
*Each hazard ratio was computed with the median P-wave onset to P-wave peak value of 68 ms as the reference, and was adjusted for age, sex, race, body mass index, heart rate, systolic blood pressure, smoking, diabetes, low-density lipoprotein cholesterol, coronary heart disease, and heart failure. Dotted-lines represent the 95% confidence interval.
Figure 4. Risk of Atrial Fibrillation across P-wave Peak to P-wave End Duration*.
*Each hazard ratio was computed with the median P-wave peak to P-wave end value of 38 ms as the reference, and was adjusted for age, sex, race, body mass index, heart rate, systolic blood pressure, smoking, diabetes, low-density lipoprotein cholesterol, coronary heart disease, and heart failure. Dotted-lines represent the 95% confidence interval.
Figure 5. Risk of Atrial Fibrillation across PR-Segment Duration*.
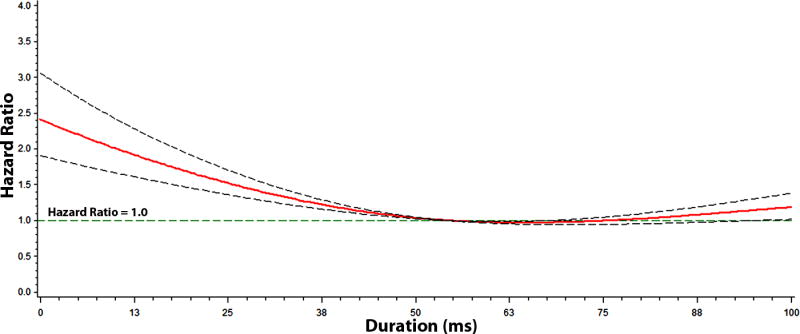
*Each hazard ratio was computed with the median PR-segment value of 52 ms as the reference, and was adjusted for age, sex, race, body mass index, heart rate, systolic blood pressure, smoking, diabetes, low-density lipoprotein cholesterol, coronary heart disease, and heart failure. Dotted-lines represent the 95% confidence interval.
DISCUSSION
The findings in this analysis demonstrate that the associations of the PR-interval components (P-wave onset to P-wave peak duration, P-wave peak to P-wave end duration, and PR-segment) with AF are not uniform. Specifically, P-wave duration was found to have the strongest association with AF, and this largely was explained by P-wave onset to P-wave peak duration. Additionally, our results show that the components of the PR-interval are not strongly correlated. Overall, our results suggest that the PR-interval is not a single ECG phenotype, but likely a composite of distinct components that are not uniformly associated with AF.
We have recently shown that the predictive ability of the PR-interval is dictated by P-wave duration, and that the relationship between the PR-interval and outcomes varies across populations.8 In combination with the current findings, recent inconsistencies regarding the association of the PR-interval with AF likely are related to differences in the predictive ability of each PR-interval component. That is to say, a prolonged PR-interval will be predictive of AF if prolongation is mainly due to P-wave duration (e.g., P-wave duration contributes more to the length of PR-interval). In contrast, a prolonged PR-interval that largely is related to the PR-segment (e.g., PR-segment duration contributes more to the length of PR-interval) will not predict AF. This also explains the observation that a short PR-segment is more predictive of AF, as the P-wave duration would contribute more to the overall PR-interval.
Our findings provide support for the concept that conduction within and between the right and left atria (e.g., P-wave duration) contribute more to AF risk than the PR-segment (e.g., AV conduction). Abnormalities detected in the P-wave are more likely to represent underlying atrial pathology. These atrial abnormalities include inter-atrial block, a delayed depolarization across the Bachman bundle resulting in P-wave duration prolongation.13 Inter-atrial block disrupts normal electrical activation and predisposes to arrhythmias by modifying atrial refractory periods.14 These abnormal properties often are observed among persons with risk factors for myocardial fibrosis and abnormal cardiac remodeling (e.g., advanced age, hypertension).15
Interestingly, AF was associated with P-wave onset to P-wave peak rather than P-wave peak to P-wave end. Inter-atrial block has been shown to result in prolonged P-wave duration due to conduction abnormalities in the left atrium without affecting conduction through the proximal Bachmann bundle.13 This will manifest on the 12-lead ECG without concomitant left atrial enlargement. Therefore, myocardial fibrosis would slow conduction into the left atrium and explain the increased risk of AF in the first half of the P-wave. Overall, this finding supports the hypothesis that conduction abnormalities between the right and left atria are more likely to detect the abnormal substrate to maintain AF than the entire PR-interval, which includes the PR-segment.
The current study should be interpreted in the context of several limitations. In addition to study ECGs, incident AF cases were ascertained from hospitalization discharge records and death certificates, which possibly resulted in misclassification. However, these codes have adequate positive predictive value for the identification of AF events in ARIC.9 Additionally, paroxysmal AF cases potentially were missed due to the time-dependent nature of such events. Furthermore, although we included several covariates in our multivariable models that likely influenced the development of AF, we acknowledge that residual confounding remains a possibility.
Supplementary Material
Acknowledgments
The authors thank the staff and participants of the ARIC study for their important contributions.
FUNDING
The Atherosclerosis Risk In Communities study is carried out as a collaborative study supported by National Heart, Lung, and Blood Institute contracts (HHSN268201100005C, HHSN268201100006C, HHSN268201100007C, HHSN268201100008C, HHSN268201100009C, HHSN268201100010C, HHSN268201100011C, and HHSN268201100012C). WTO is supported by the National Heart, Lung, And Blood Institute of the National Institutes of Health under Award Number F32HL134290.
Footnotes
CONFLICTS OF INTEREST
The authors declare no conflicts of interest.
References
- 1.Soliman EZ, Prineas RJ, Case LD, Zhang ZM, Goff DC., Jr Ethnic distribution of ECG predictors of atrial fibrillation and its impact on understanding the ethnic distribution of ischemic stroke in the Atherosclerosis Risk in Communities (ARIC) study. Stroke. 2009;40:1204–1211. doi: 10.1161/STROKEAHA.108.534735. [DOI] [PMC free article] [PubMed] [Google Scholar]
- 2.Schnabel RB, Sullivan LM, Levy D, Pencina MJ, Massaro JM, D'Agostino RB, Sr, Newton-Cheh C, Yamamoto JF, Magnani JW, Tadros TM, Kannel WB, Wang TJ, Ellinor PT, Wolf PA, Vasan RS, Benjamin EJ. Development of a risk score for atrial fibrillation (Framingham Heart Study): a community-based cohort study. Lancet. 2009;373:739–745. doi: 10.1016/S0140-6736(09)60443-8. [DOI] [PMC free article] [PubMed] [Google Scholar]
- 3.Schnabel RB, Aspelund T, Li G, Sullivan LM, Suchy-Dicey A, Harris TB, Pencina MJ, D'Agostino RB, Sr, Levy D, Kannel WB, Wang TJ, Kronmal RA, Wolf PA, Burke GL, Launer LJ, Vasan RS, Psaty BM, Benjamin EJ, Gudnason V, Heckbert SR. Validation of an atrial fibrillation risk algorithm in whites and African Americans. Arch Intern Med. 2010;170:1909–1917. doi: 10.1001/archinternmed.2010.434. [DOI] [PMC free article] [PubMed] [Google Scholar]
- 4.Aro AL, Anttonen O, Kerola T, Junttila MJ, Tikkanen JT, Rissanen HA, Reunanen A, Huikuri HV. Prognostic significance of prolonged PR interval in the general population. Eur Heart J. 2014;35:123–129. doi: 10.1093/eurheartj/eht176. [DOI] [PubMed] [Google Scholar]
- 5.Knuiman M, Briffa T, Divitini M, Chew D, Eikelboom J, McQuillan B, Hung J. A cohort study examination of established and emerging risk factors for atrial fibrillation: the Busselton Health Study. Eur J Epidemiol. 2014;29:181–190. doi: 10.1007/s10654-013-9875-y. [DOI] [PubMed] [Google Scholar]
- 6.Alonso A, Krijthe BP, Aspelund T, Stepas KA, Pencina MJ, Moser CB, Sinner MF, Sotoodehnia N, Fontes JD, Janssens AC, Kronmal RA, Magnani JW, Witteman JC, Chamberlain AM, Lubitz SA, Schnabel RB, Agarwal SK, McManus DD, Ellinor PT, Larson MG, Burke GL, Launer LJ, Hofman A, Levy D, Gottdiener JS, Kaab S, Couper D, Harris TB, Soliman EZ, Stricker BH, Gudnason V, Heckbert SR, Benjamin EJ. Simple risk model predicts incidence of atrial fibrillation in a racially and geographically diverse population: the CHARGE-AF consortium. J Am Heart Assoc. 2013;2:e000102. doi: 10.1161/JAHA.112.000102. [DOI] [PMC free article] [PubMed] [Google Scholar]
- 7.Human GP, Snyman HW. The value of the Macruz index in the diagnosis of atrial enlargement. Circulation. 1963;27:935–938. doi: 10.1161/01.cir.27.5.935. [DOI] [PubMed] [Google Scholar]
- 8.Soliman EZ, Cammarata M, Li Y. Explaining the inconsistent associations of PR interval with mortality: the role of P-duration contribution to the length of PR interval. Heart Rhythm. 2014;11:93–98. doi: 10.1016/j.hrthm.2013.10.003. [DOI] [PubMed] [Google Scholar]
- 9.Alonso A, Agarwal SK, Soliman EZ, Ambrose M, Chamberlain AM, Prineas RJ, Folsom AR. Incidence of atrial fibrillation in whites and African-Americans: the Atherosclerosis Risk in Communities (ARIC) study. Am Heart J. 2009;158:111–117. doi: 10.1016/j.ahj.2009.05.010. [DOI] [PMC free article] [PubMed] [Google Scholar]
- 10.Epstein AE, Alexander JC, Gutterman DD, Maisel W, Wharton JM. Anticoagulation: American College of Chest Physicians guidelines for the prevention and management of postoperative atrial fibrillation after cardiac surgery. Chest. 2005;128:24S–27S. doi: 10.1378/chest.128.2_suppl.24s. [DOI] [PubMed] [Google Scholar]
- 11.Loehr LR, Rosamond WD, Chang PP, Folsom AR, Chambless LE. Heart failure incidence and survival (from the Atherosclerosis Risk in Communities study) Am J Cardiol. 2008;101:1016–1022. doi: 10.1016/j.amjcard.2007.11.061. [DOI] [PubMed] [Google Scholar]
- 12.Marrie RA, Dawson NV, Garland A. Quantile regression and restricted cubic splines are useful for exploring relationships between continuous variables. J Clin Epidemiol. 2009;62:511–517. doi: 10.1016/j.jclinepi.2008.05.015. [DOI] [PubMed] [Google Scholar]
- 13.Bayes de Luna A, Platonov P, Cosio FG, Cygankiewicz I, Pastore C, Baranowski R, Bayes-Genis A, Guindo J, Vinolas X, Garcia-Niebla J, Barbosa R, Stern S, Spodick D. Interatrial blocks. A separate entity from left atrial enlargement: a consensus report. J Electrocardiol. 2012;45:445–451. doi: 10.1016/j.jelectrocard.2012.06.029. [DOI] [PubMed] [Google Scholar]
- 14.Daubert JC, Pavin D, Jauvert G, Mabo P. Intra- and interatrial conduction delay: implications for cardiac pacing. Pacing Clin Electrophysiol. 2004;27:507–525. doi: 10.1111/j.1540-8159.2004.00473.x. [DOI] [PubMed] [Google Scholar]
- 15.O'Neal WT, Zhang ZM, Loehr LR, Chen LY, Alonso A, Soliman EZ. Electrocardiographic Advanced Interatrial Block and Atrial Fibrillation Risk in the General Population. Am J Cardiol. 2016;117:1755–1759. doi: 10.1016/j.amjcard.2016.03.013. [DOI] [PMC free article] [PubMed] [Google Scholar]
Associated Data
This section collects any data citations, data availability statements, or supplementary materials included in this article.


