

Summary
Cross experiment comparisons in public data compendia are challenged by unmatched conditions and technical noise. The ADAGE method, which performs unsupervised integration with denoising autoencoder neural networks, can identify biological patterns, but because ADAGE models, like many neural networks, are over-parameterized, different ADAGE models perform equally well. To enhance model robustness and better build signatures consistent with biological pathways, we developed an ensemble ADAGE (eADAGE) that integrated stable signatures across models. We applied eADAGE to a compendium of Pseudomonas aeruginosa gene expression profiling experiments performed in 78 media. eADAGE revealed a phosphate starvation response controlled by PhoB in media with moderate phosphate and predicted that a second stimulus provided by the sensor kinase, KinB, is required for this PhoB activation. We validated this relationship using both targeted and unbiased genetic approaches. eADAGE, which captures stable biological patterns, enables cross-experiment comparisons that can highlight measured but undiscovered relationships.
eTOC Blurb
Tan and Doing et al. developed an ensemble neural network model called eADAGE that can directly extract pathway signatures from public gene expression data with improved coverage, precision, and robustness. The model aids the rapid discovery of a measured but unexplored mechanism of PhoB activation in Pseudomonas aeruginosa by integrating public datasets from diverse experiments.
Introduction
Available gene expression data are outstripping our knowledge about the organisms that we’re measuring. Ideally each organism’s data reveals the principles underlying gene regulation and consequent pathway activity changes in every condition in which gene expression is measured. Extracting this information requires new algorithms, but many commonly used algorithms are supervised. These algorithms require curated pathway knowledge to work effectively, and in many species such resources are biased in various ways (Gillis and Pavlidis, 2013; Greene and Troyanskaya, 2012; Schnoes et al., 2013). Annotation transfer can help, but such function assignments remain challenging for many biological processes (Jiang et al., 2016). An unsupervised method that doesn’t rely on annotation transfer would bypass the challenges of both annotation transfer and biased knowledge.
Along with our wealth of data, abundant computational resources can power deep unsupervised applications of neural networks, which are powerful methods for unsupervised feature learning (Bengio et al., 2013). In a neural network, input variables are provided to one or more layers of “neurons” (also called node) which turns on in accordance with an activation function. The network is trained, the edge weights between nodes are adjusted, by grading the quality of the output. Denoising autoencoders (DAs), a type of unsupervised neural networks, are trained to remove noise that is intentionally added to the input data (Vincent et al., 2008). Masking noise, in which a fraction of the inputs are set to zero, is commonly used (Vincent et al., 2010) and successful denoising autoencoders must learn the dependency structure between the input variables. Adding noise helps a DA to learn features that are robust to partial corruption of input data. This approach is particularly suitable for gene expression data (Tan et al., 2015). The sigmoid activation function produces features that tend to be on or off, which helps to describe biological processes, e.g. transcription factor activation, with threshold effects. Also, the algorithm is robust to noise. We previously observed that a one-layer DA-based method, ADAGE, was more robust than linear approaches such as ICA or PCA in the context of public data, which employ heterogeneous experimental designs, lack shared controls, and provide limited metadata (Tan et al., 2016).
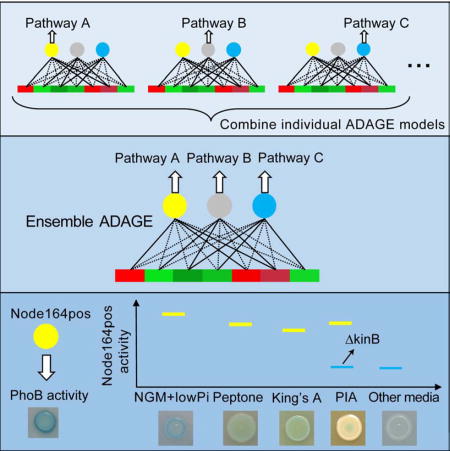
Neural networks have many edge weights that must be fit during training. Different DAs could reconstruct given gene expression datasets equally well. The objective functions of neural networks are non-convex and trained through stochastic gradient descent. Each trained model represents a local minimum. Yu recently emphasized the importance of patterns that are stable across statistical models in the process of discovery (Yu, 2013). While run-to-run variability obscures some biological features within individual models, stable patterns across neural networks may resolve biological pathways. To directly target stability, we introduce an unsupervised modeling procedure inspired by consensus clustering (Monti et al., 2003). Consensus clustering has become a standard part of clustering applications for biological datasets. Our approach builds an ensemble neural network that captures stable features and improves model robustness.
To apply the neural network approach to compendium-wide analyses, we sought to create a comprehensive model in which biological pathways were learned from gene expression data. We adapted ADAGE (Tan et al., 2016) to capture pathways more specifically by increasing the number of nodes (model size) that reflect potential pathways from 50 to 300, a size that our analyses indicate the current public data compendium can support. We then built its ensemble version (eADAGE) and compared it with ADAGE, PCA, and ICA. While it is impossible to specify a priori the number of true biological pathways that exhibit gene expression signatures, we observed that eADAGE models produced gene expression signatures that corresponded to more biological pathways, indicating that this method more effectively identifies biological signatures from noisy data. While ADAGE models reveal biological features perturbed within an experiment, the more robust eADAGE models also enable analyses that cut across an organism’s gene expression compendium.
To assess the utility of the eADAGE model, we applied it to the analysis of the P. aerguinosa gene expression compendium which included 1051 samples grown in 78 distinct medium conditions, 128 distinct strains and isolates, and dozens of different environmental parameters. After grouping samples by medium type, we searched for eADAGE-defined signatures that differed between medium types. This cross-compendium analysis identified five media that elicited a response to low-phosphate mediated by the transcriptional regulator PhoB. While PhoB is known to respond to low phosphate through its interaction with PhoR in low concentrations (Wanner and Chang, 1987), our analyses indicated that PhoB is also active at moderate phosphate concentrations in a KinB-dependent manner, and molecular analyses of P. aeruginosa confirmed this prediction. Analysis of a collection of P. aeruginosa mutants defective in kinases validated the specificity of the KinB-PhoB relationship.
In summary, eADAGE more precisely and robustly captures biological processes and pathways from gene expression data than other unsupervised approaches. The signatures learned by eADAGE support functional gene set analyses without manual pathway annotation. The signatures are robust enough to enable biologists to identify not only differentially active signatures within one experiment, but also cross-compendium patterns that reveal undiscovered regulatory mechanisms captured within existing public data.
Results
eADAGE: ensemble modeling improves the model breadth, depth, and robustness
ADAGE is a neural network model. Each gene is connected to each node through a weighted edge (Figure 1A). We define a gene signature learned by an ADAGE model as a set of genes that contribute the highest positive or highest negative weights to a specific node (Figure 1B, see methods for detail). Therefore, one node results in two gene signatures, one on each high weight side. The positive and negative signatures derived from the same node do not necessarily compose inversely regulated processes (Figure S1), so we use them independently.
Figure 1. ADAGE model and signature definition. See also Figure S1.

A In ADAGE, every gene contributes a weight value to every node reflected by the edge strength. Orange edge: high positive weight; blue: high negative weight; dotted edges: low positive or negative weights.
B The distribution of a node’s weights is roughly normal and centered at zero. Genes with weights higher than the positive high-weight (HW) cutoff (GeneE and GeneA) form the gene signature Node1pos. Genes with weights lower than the negative HW cutoff (GeneC) form the gene signature Node1neg.
ADAGE models of the same size capture different pathways because their training processes are sensitive to weight initialization. eADAGE, in which we built an ensemble version of individual ADAGE models, took advantage of this variation to enhance model robustness. Each eADAGE model integrated nodes from 100 individual ADAGE models (Figure 2A). To unite nodes, we applied consensus clustering on nodes’ weight vectors because the weight vector captures both the genes that contribute to a node and their magnitude. Our previous ADAGE analyses showed that genes contributing high weights characterized each node’s biological significance, so we designed a weighted Pearson correlation to incorporate gene weights in building eADAGE models. We compared eADAGE to two baseline methods: ADAGE models and corADAGE, which combined nodes with an unweighted Pearson correlation. For direct comparison, the model sizes of ADAGE, eADAGE, and corADAGE were all fixed to 300 nodes, which we found to be appropriate for the current P. aeruginosa expression compendium through both data-driven and knowledge-driven heuristics (see STAR method, Figure S2).
Figure 2. The construction and performance of eADAGE. See also Figure S3.

A eADAGE construction workflow. 100 individual ADAGE models were built on the input dataset. Nodes from all models were extracted and clustered based on the similarities in their weight vectors. Nodes from different models were rearranged by their clustering assignments. Weight vectors from nodes in the same cluster were averaged and thus becoming the final weight vector of a newly constructed node in an eADAGE model.
B KEGG pathway coverage comparison between ADAGE, corADAGE and eADAGE.
C The enrichment significance of three example KEGG pathways in ADAGE models with different sizes and eADAGE models. Grey dotted line indicates FDR q-value of 0.05.
D The distribution of KEGG pathway coverage rate of ADAGE and eADAGE models.
E Comparison among PCA, ICA, and eADAGE in KEGG pathway coverage at different significance levels.
While ADAGE models are constructed without the use of curated information such as KEGG (Kanehisa and Goto, 2000) and GO (Ashburner et al., 2000), we evaluate models by the extent to which they cover the pathways and processes defined in these resources to see how they capture existing biology. For each method, we determined the number of KEGG pathways significantly associated with at least one gene signature in a model, referred to as KEGG coverage. eADAGE exhibited greater KEGG coverage than other methods (Figure 2B). Both corADAGE and eADAGE covered significantly more KEGG pathways than ADAGE (t-test p-value of 1.04e-6 between corADAGE (n=10) and ADAGE (n=1000) and t-test p-value of 1.41e-6 between eADAGE (n=10) and ADAGE (n=1000)). Moreover, eADAGE models covered, on average, 10 more pathways than corADAGE (t-test p-value of 1.99e-3, n=10 for both groups). Genes that participate in multiple pathways can influence pathway enrichment analysis, a factor termed pathway crosstalk (Donato et al., 2013). To control for this, we performed crosstalk correction (Donato et al., 2013). After correction, the number of covered pathways dropped by approximately half (Figure S3A), but eADAGE still covered significantly more pathways than corADAGE (t-test p-value of 0.02) and ADAGE (t-test p-value of 1.29e-05). We subsequently evaluated each method’s coverage of GO biological processes (GO-BP) and found consistent results (Figure S3B). eADAGE integrated multiple models to more broadly capture pathway signals embedded in diverse gene expression compendia.
We next evaluated how specifically and completely signatures learned by the models capture known biology. We use each gene signature’s FDR corrected p-value for enrichment of a KEGG/GO term as a combined measure for both the sensitivity and specificity. If a pathway was significantly associated with multiple gene signatures in a model, we only considered its most significant association. We found that 71% of KEGG and 79% of GO-BP terms were more significantly enriched (had lower median p-values) in corADAGE models when compared to individual ADAGE models. This increased to 87% for KEGG and 81% for GO-BP terms in eADAGE models. We also compared eADAGE and corADAGE by this measure and observed that 74% of KEGG and 61% of GO-BP terms were more significantly enriched in eADAGE. We have found that different pathways were best captured at different model sizes (Figure 2C). We next compared the 300-node eADAGE model to ADAGE models with different number of nodes. Although the 300-node eADAGE models were constructed only from 300-node ADAGE models, we found that 69% of KEGG and 69% of GO-BP terms were more significantly enriched (i.e. lower median p-values) in eADAGE models than ADAGE models of any size. Three example pathways that are best captured either when model size is small, large, or in the middle are all well captured in the 300-node eADAGE model (Figure 2C). These results demonstrate that eADAGE’s ensemble modeling procedure captures consistent signals across models and filtering out noise.
We designed eADAGE to provide a more robust analysis framework than ADAGE. To assess this, we examined the percentage of models that covered each pathway (coverage rate) between ADAGE and eADAGE. Most KEGG pathways were covered by less than half of ADAGE models but more than half of eADAGE models (Figure 2D), suggesting that eADAGE models were more robust than ADAGE models. Subsequent evaluations of GO-BP were consistent with this finding (Figure S3C). We excluded KEGG/GO terms always covered by both ADAGE and eADAGE models and observed that 69% of the remaining KEGG and 71% of the remaining GO terms were covered more frequently by eADAGE than ADAGE. This suggests that their associations are stabilized via ensemble construction.
Principal component analysis (PCA) and independent component analysis (ICA) have been used to extract biological features and build functional gene sets (Alter et al., 2000; Chen et al., 2008; Engreitz et al., 2010; Frigyesi et al., 2006; Gong et al., 2007; Lutter et al., 2009; Ma and Kosorok, 2009; Raychaudhuri et al., 2000, 2000; Roden et al., 2006). We performed PCA and generated multiple ICA models from the same P. aeruginosa expression compendium and evaluated their KEGG/GO term coverage using the same procedures for eADAGE. eADAGE substantially and significantly outperforms PCA (Figure 2E). Between eADAGE and ICA, we observed that eADAGE represented KEGG/GO terms more precisely. Specifically, among terms significantly enriched in either approach, 68% KEGG and 71% GO terms exhibited more significant enrichment in eADAGE. Increasing the significance threshold for pathway coverage demonstrates the advantage of eADAGE (Figure 2E and Figure S3D).
Pathway databases provide a means to compare unsupervised methods for signature discovery. Not all pathways will be regulated at the transcriptional level, but those that are may be extracted from gene expression data. The unsupervised eADAGE method revealed signatures that corresponded to P. aeruginosa KEGG/GO terms better than PCA, ICA, ADAGE, and corADAGE. It had higher pathway coverage (breadth), covered pathways more specifically (depth), and more consistently (robustness) than existing methods.
Elucidating functional signatures that are indicative of growth medium
For biological evaluation, we built a 300-node eADAGE model. We calculated signature activities in each sample. A high activity indicates that most genes in the signature are highly expressed in the sample.
Analysis of differentially expressed genes is widely used to analyze single experiments, but crosscutting signatures are required to reveal general response patterns from large-scale compendia. Signature-based analyses can suggest mechanisms such as crosstalk and novel regulatory networks, but these signatures must be robust and comprehensive. By capturing biological pathways more completely and robustly, eADAGE enables the analysis of signatures, including those that don’t correspond to any existing pathway, across the entire compendium of P. aeruginosa.
Gene expression experiments have been used to investigate diverse questions about P. aeruginosa biology, and these experiments have used different media to emphasize different phenotypes. Manual annotation showed that 78 base media were used across the gene expression compendium (Table S1). While the compendium contains 125 different experiments, in only two of them did investigators use multiple base media. Other than LB, which is used in 43.6% (458/1051) of the samples, each medium is only represented by a handful of samples.
To provide an example of cross-experiment analysis, we examined signature activity across the six experiments in M9 minimal medium (Miller, 1972), with six different carbon sources. Node147pos was highly active in phosphatidylcholine (Figure 3A). This node was significantly enriched for the GO terms choline catabolic process (FDR q-value of 2.9E-11) and glycine betaine catabolic process (FDR q-value of 4.6E-20). Of all signatures, it had the largest overlap with the regulon of GbdR, the choline-responsive transcription factor (Hampel et al., 2014) (FDR q-value of 2.5E-47), suggesting that choline catabolism is active in this medium. Consistent with this, phosphatidylcholine, but not palmitate, citrate, or glucose, is a choline source for P. aeruginosa (Wargo et al., 2011, 2009). Importantly, while Node147pos was differentially active within a single experiment containing samples in phosphatidylcholine and palmitate (E-GEOD-7704), it was also identifiable in comparisons of samples grown in M9 medium with different carbon sources in different experiments. This illustrates how medium-specific signatures can be identified without experiments designed to directly test the hypothesis that a specific medium component affects gene expression.
Figure 3. eADAGE signatures with medium-specific patterns. See also Figure S4 and Table S3.

A Activity of Node147pos in M9-based media.
B Activity of Node164pos in all media.
C Expression heatmaps of genes in Node164pos across samples in NGM+<0.1phosphate, peptone, King’s A, and PIA media. Heatmap color range is determined by the Z-scored gene expression of all samples in the compendium.
Distinct aspects of the response to low phosphate are captured among the most active signatures
To broadly examine signatures across all media, we calculated a medium activation score for each signature-medium combination. This score reflected how a signature’s activity in a medium differed from its activity in all other samples (Figure S4, see methods for details). Table S2 lists signatures with activation scores in a specific medium above a stringent threshold. A signature could be active in multiple media (Figure S4), so we averaged their activation scores when this occurred. Table S3 lists signatures that are active in a group of media with detailed annotation for the top 5 signatures.
The two signatures with the highest pan-media activation scores were Node164pos and Node108neg (Table S3). We examined their underlying activities across all media (Node164pos is shown Figure 3B), and found that both were highly active in King’s A, Peptone, and NGM+<0.1mM phosphate (NGMlowP), but not in NGM+25mM phosphate (NGMhighP). The activity differences between NGMlowP and NGMhighP suggested that these signatures respond to phosphate levels. The other two media (Peptone and King’s A) in which Node164pos had high activity had low phosphate concentrations (0.4 mM) relative to commonly used LB (~4.5 mM) (Bertani, 2004).
KEGG pathway enrichment analysis of Node164pos genes showed enrichment in phosphate acquisition related pathways (Table S3). One Node164pos gene encodes PhoB, a transcription factor in the PhoR-PhoB two-component system that responds to low environmental phosphate in P. aeruginosa (Bielecki et al., 2015; Blus-Kadosh et al., 2013; Santos-Beneit, 2015). Further, Node164pos is the signature most enriched for a previously defined PhoB regulon (FDR q-value of 8.1e-29 in hypergeometric test).
Expression levels of genes in Node164pos are higher in Peptone, King’s A, and NGMlowP than in NGMhighP (Figure 3C), including phoA which encodes alkaline phosphatase, an enzyme whose activity can be monitored using a colorimetric assay. As expected, PhoA was activated in low phosphate concentrations (Figure 4A). PhoA activity was dependent on PhoB and the PhoB-activating histidine kinase PhoR, consistent with published work (Bielecki et al., 2015). Notably, PhoA activity was evident on King’s A and Peptone (Figure 4B). Although King’s A and Peptone are not considered to be phosphate-limited media, these results provide evidence that they induced PhoB activity as predicted by Node164pos’s signature-medium relationship.
Figure 4. PhoA activity, as seen by the colorimetric BCIP assay in various media.

A PhoA activity, as seen by the blue-colored product of BCIP cleavage, is dependent on low phosphate concentrations, phoB, phoR and, in NGM, kinB.
B PhoA is active in King’s A, Peptone and PIA and is dependent on phoB and phoR and on PIA, kinB at 16 hours.
C PhoA is active in King’s A, Peptone and PIA and is dependent on phoB and, on PIA, kinB after 32 hours.
D PhoA activity is dependent on phosphate concentrations < 0.6 mM, phoB, phoR and, at 0.5 mM phosphate, kinB on MOPS. Not shown, 0.2 mM mimics 0.1mM and 0.7mM – 0.9mM mimic 1.0 mM.
While Node108neg is not significantly associated with phosphate acquisition-related KEGG pathways, it is enriched for the PhoB regulon (FDR q-value of 5.2e-9 in hypergeometric test, Table S3) and shares over half of its thirty-two genes with Node164pos. Six of the seven PhoB-regulated genes present in Node108neg are also regulated by TctD, a transcriptional repressor (Bielecki et al., 2015). Node108neg primarily represents genes that are both PhoB-activated and TctD-repressed. Subsequent analyses found that Node108neg was the most differentially active signature between a ΔtctD strain and the wild type in an RNAseq experiment (E-GEOD-64056). Importantly, eADAGE learned this TctD regulon even though the expression compendium did not contain any samples of tctD mutants, demonstrating the utility of eADAGE in learning regulatory programs uncharacterized by KEGG.
We evaluated whether the PhoB and TctD signals were also extracted by PCA, ICA, or ADAGE. ICA and ADAGE captured signatures enriched of the PhoB regulon less than those of eADAGE (Table S4). PCA captured a strong PhoB signal in its 19th principal component. However, it did not learn the subtler TctD signal. In summary, the other methods were able to capture some of this signature but in a manner that was less complete or failed to separate TctD.
Cross-compendium analysis of Node164pos activity reveals a role for the histidine kinase KinB in the regulation of PhoB
Interestingly, Node164pos activity exhibited a wide spread in PIA medium with six samples having high activities and the other six having low activities (Figure 3B). All of the samples with low Node164pos activity were from a study that used a PAO1 kinB::GmR mutant background (Damron et al., 2012). The PIA-grown samples with high Node164pos activity used a PAO1 strain with kinB intact (Damron et al., 2013) leading us to propose that KinB may be a regulator of PhoB on PIA. We confirmed that PhoA activity dependents on PhoB, PhoR, KinB on PIA medium (Figure 4B) as illustrated by the fact that a screen of 63 histidine kinase in-frame deletion mutants (STAR Methods) found only ΔphoR and ΔkinB had no PhoA activity on PIA, like the phoB mutant. These kinases appear to regulate PhoB non-redundantly and to different extents in PIA, as the ΔphoR mutant regained PhoA activity at later time points but the ΔkinB mutant did not (Figure 4C).
Although the phosphate concentration of PIA (0.8mM) is lower than that of rich media such as LB (~4.5mM), it is higher than that of Peptone and King’s A (0.4mM). Therefore, we tested whether a moderately low level of phosphate provokes KinB regulation of PhoA. We found that PhoA activity was evident at concentrations up to 0.5 mM phosphate in MOPS medium in the wild type, but only at lower concentrations in the ΔkinB strain suggesting that KinB plays a role at intermediate concentrations (Figure 4D). To our knowledge, KinB has not been previously implicated in the activation of PhoB.
In summary, eADAGE effectively extracted biologically meaningful features, accurately indicated their activity in multiple media spanning numerous independent experiments, and revealed a novel regulatory mechanism. By summarizing gene-based expression information into biologically relevant signatures, eADAGE greatly simplifies analyses that cut across large gene expression compendia.
Discussion
Our eADAGE algorithm uses an ensemble of ADAGE models to address model variability due to stochasticity and local minima. Comparable approaches have also been applied for ICA, where researchers have used the centrotypes in clustering multiple models as the final model (Himberg et al., 2004). The ICA centrotype approach for ADAGE corresponds to corADAGE, and our comparison of eADAGE and corADAGE shows that eADAGE not only covers more biological pathways, but also results in cleaner representations of biological pathways. This direct comparison suggests that placing particular emphasis on the genes most associated with a particular feature may be a useful property for other unsupervised feature construction algorithms. While our results demonstrate that this ensemble process can help improve the biological interpretability of neural networks, we do not expect it to increase prediction accuracies in supervised learning problems.
eADAGE revealed patterns that were detectable from a data compendium containing experiments performed in 78 different media but that were not necessarily evident in individual experiments. For example, one eADAGE signature revealed media in which P. aeruginosa had high PhoB activity. PhoB is a global regulator, and understanding its state can provide insight into medium-specific phenotypes. King’s A and PIA, on which the PhoB signature was active, are known to stimulate robust production of colorful secondary metabolites (King et al., 1954) called phenazines. PhoB can also influence phenazine levels (Jensen et al., 2006). Future studies will reveal whether the low phosphate levels in these media contribute to this characteristic phenotype. We expect that other signatures extracted from the compendium by eADAGE will serve as the basis for additional work in which the patterns are not only examined but also validated.
We uncovered a subtle aspect of the phosphate starvation response that depends on KinB, a histidine kinase not previously associated with PhoB. Bacterial two-component systems are often insulated from each other (Podgornaia and Laub, 2013). Though sensor kinase/response regulator cross-talk has been hypothesized as a mechanism of explaining the complexity of signaling networks (Fisher et al., 1995), it is challenging to find conditions where two kinases are needed for full response regulator activation (Verhamme et al., 2002). We propose that moderate levels of phosphate, like those in PIA, provide a niche for crosstalk: the activity of PhoR is low enough that the interaction with KinB is needed for full PhoB activity. Alternatively, KinB may influence PhoB activity indirectly by regulating activities that affect PhoB levels, phosphorylation state, or protein-protein interactions. Since experiments designed to perturb this process use only high and very low phosphate concentrations, eADAGE analysis of P. aeruginosa transcriptomic measurements across experiments in different media was required to reveal this relationship.
Existing public gene expression data compendia for more than one hundred organisms are of sufficient size to support eADAGE models (Greene et al., 2016). Cross-compendium analyses provide the opportunity to use existing data to identify regulatory patterns that are evident across multiple experiments, datasets, and labs. To tap this potential, we will require algorithms like eADAGE that robustly integrate these diverse datasets in a manner that is not limited to well-understood aspects of biology. Furthermore, while public compendia tend to be dominated by expression data, autoencoders have also been successfully applied to datasets based on large collections of electronic health records where they are particularly effective at dealing with missing data (Beaulieu-Jones et al., 2016; Miotto et al., 2016, Beaulieu-Jones and Moore, 2017). These features, along with their unsupervised nature, make DAs a promising approach for the integration of heterogeneous data types. Ultimately, we expect unsupervised algorithms to be most helpful when they lead users to discover new underlying mechanisms, which require models that are accurate, robust, and interpretable.
STAR METHODS
CONTACT FOR REAGENT AND RESOURCE SHARING
Please contact Casey Greene (csgreene@mail.med.upenn.edu) for any computational resource related to eADAGE and the P. aeruginosa gene expression compendium. Please contact Deborah Hogan (Deborah.A.Hogan@dartmouth.edu) for experimental related resource such reagent, strains, and media.
EXPERIMENTAL MODEL AND SUBJECT DETAILS
Pseudomonas aeruginosa
The Pseudomonas aeruginosa strain PA14 was used as the wild-type strain as well as the background for all deletion mutants. All strains were maintained on LB with 1.5% agar and grown at 37°C.
METHOD DETAILS
Data processing
We followed the same procedures for data collection, processing, and normalization as (Tan et al., 2016) and updated the P. aeruginosa gene expression compendium to include all datasets on GPL84 platform from the ArrayExpress database (Rustici et al., 2013) as of 31 July 2015. This P. aeruginosa compendium contains 125 datasets with 1051 individual genome-wide assays. Processed expression values of the ΔtctD RNAseq dataset were downloaded from ArrayExpress (E-GEOD-64056) and normalized to the range of the compendium using TDM (Thompson et al., 2016).
Construction of ADAGE models
We constructed ADAGE models as described in (Tan et al., 2016). To summarize the process and outputs, we constructed a denoising autoencoder for the gene expression compendium. Denoising autoencoders model the data in a lower dimension than the input space, and the models are trained with random gene expression measurements set to zero. Thus an ADAGE model must learn gene-gene dependencies to fill in this missing information. Once the ADAGE model is trained, each node in the hidden layer contains a weight vector. These positive and negative weights represent the strength of each gene’s connection to that node.
Gene signatures as sign-specific high-weight gene sets
In previous work (Tan et al., 2016) we defined high-weight (HW) genes as those in the extremes of the weight distribution on the positive or negative side of a node. Here, we use a more granular definition that accounts for sign specificity. Each node’s gene weights are approximately normal and centered at zero in ADAGE models (Tan et al., 2016, 2015). We defined positive HW genes as those that were more than 2.5 standard deviations from the mean on the positive side, and negative HW genes as those that were more than 2.5 standard deviations from the mean on the negative side. After this split, a model with n nodes provides 2n gene signatures. Because a node is simply named by the order that it occurs in a model, we named two gene signatures derived from one node as “NodeXXpos” and “NodeXXneg”.
KEGG pathway and GO-BP term enrichment analysis
To evaluate the biological relevance of gene signatures extracted by an ADAGE model, we tested how they related to known KEGG pathways (Kanehisa and Goto, 2000). We tested a signature’s association with each KEGG pathway using hypergeometric test and corrected the p-value by the number of KEGG pathways we tested following the Benjamini–Hochberg procedure. We used a false discovery rate of 0.05 as the significance cutoff. The same procedure was repeated using GO-BP terms. We downloaded biological process GO terms from pseudomonas.com and only used manually curated terms. For KEGG and GO terms, we only considered terms with more than 5 genes and less than 100 genes as meaningful pathways or processes.
Genes can be annotated to multiple pathways. To control for this effect in our analysis, we also performed a parallel analysis after applying crosstalk correction as described in (Donato et al., 2013). This approach uses expectation maximization to map each gene to the pathway in which it has the greatest predicted impact. A gene-to-pathway membership matrix, defined using KEGG pathway annotations, initially makes the assumption that each gene’s role in all of its assigned pathways remains constant independent of context. We then applied pathway crosstalk correction using genes’ weights for each node in the ADAGE model. We used the expectation maximization algorithm to maximize the log-likelihood of observing the membership matrix given each node’s weight vector. This process inferred an underlying gene-to-pathway impact matrix and iteratively estimated the probability that a particular gene g contributed the greatest fraction of its impact to some pathway P. Upon convergence, we assigned each gene to the pathway in which it had the maximum impact. The resulting pathway definitions do not share genes. We then used these corrected definitions for an analysis parallel to the KEGG process described above.
Reconstruction error calculation
The training objective of ADAGE is to, given a sample with added noise, return the originally measured expression values. The error between the reconstructed data and the initial data is the ‘reconstruction error.’ To summarize the difference over all genes we used cross-entropy between the original sample and the reconstruction, which has been widely used with these methods and in this domain (Tan et al., 2016; Vincent et al., 2008). This matches the statistic used during training of the model. To calculate reconstruction error for a model, we use the mean reconstruction error across samples.
Model size heuristics
One important parameter of a denoising autoencoder model is the number of nodes in the hidden layer, which we refer to as the model size. To evaluate the impact of model size and choose the most appropriate size, we built 100 ADAGE models at each model size of 10, 50, 100, 200, 300, 500, 750, and 1000, using different random seeds. The random seed determines the initialization values in the weight matrix and bias vectors in ADAGE construction, so different random seeds will result in models that reach different local minima. Other training parameters were set to the values previously identified as suitable for a gene expression compendium (Tan et al., 2015). In total, 800 ADAGE models, i.e. 100 at each model size, were generated in the model size evaluation experiment.
Determining the optimal structure of a neural network is challenging. We evaluated the model size through both a data-driven heuristic and a knowledge-driven heuristic. Importantly, the data-driven heuristic requires no curated pathway information and can be applied even when such resources are unavailable for an organism. During ADAGE training, neural networks are trained to reconstruct the input from data with noise added. The reconstruction error can be used to estimate model sizes that can be supported by the available P. aeruginosa gene expression data. The reconstruction error quickly decreases as model size increases and reaches a floor at model size of approximately 300 (Figure S2A). Further increasing model size does not improve reconstruction, suggesting that the available data are insufficient to support larger models.
While ADAGE models are constructed without the use of any curated information such as KEGG and GO, we can compare models by the extent to which they cover the pathways and process defined in these resources to determine how different parameters affect models. For models of different sizes (10–1000 nodes), we determined the number of KEGG pathways significantly associated with at least one gene signature in a model, referred to as KEGG pathway coverage for that model, and found that KEGG pathway coverage increased as model size increased until a model size of approximately 300 (Figure S2B). The number of pathways per node (including pathways associated with both the positive and negative signatures in a node) for all nodes with at least one associated KEGG pathway decreased as model size increased (Figure S2C), suggesting that multiple pathways were grouped in small models and were separated into more discrete features in large models with more nodes. We also repeated pathway coverage evaluation using manually curated Gene Ontology Biological Process (GO-BP) terms and obtained similar results as using KEGG pathways (Figure S2DE). Though the ADAGE method was unsupervised and had no access to KEGG or GO information during model training, we inferred that models that extracted signatures corresponding to known pathways better captured biological signals in the compendium. Therefore, considering the data-driven and knowledge-driven heuristics together, we identified a 300-node neural network model as most appropriate for the existing P. aeruginosa gene expression compendium.
Sample size heuristics
To evaluate the impact of sample size on the performance of ADAGE models, we randomly generated subsets of the P. aeruginosa expression compendium with sample size of 100, 200, 500, and 800. We then trained 100 ADAGE models at each sample size, each with a different combination of 10 different random subsets and 10 different random training initializations. To evaluate each model, we randomly selected 200 samples not used during training as its testing set. We performed this subsampling analysis at model size 50 and 300. In total, 800 ADAGE models were built in the sample size evaluation experiment.
We aimed to identify the amount of data required to saturate the method’s ability to discover biologically supported signatures and to identify how far the compendium could be reduced before performance dropped precipitously. We examined the number of KEGG pathways associated with at least one gene signature (pathway coverage) as a function of the size of the training set (Figure S2F). In the 50-node models, the size used in (Tan et al., 2016), the average KEGG pathway coverage at each training size increased significantly up to 500 samples (Tukey’s HSD adjusted p-values < 0.05 between models trained with 100, 200, and 500 samples), but differences beyond 500 training samples were not significant (Tukey’s HSD adjusted p values > 0.05 between models trained with 500, 800, and 1051 samples). For 300-node models, pathway coverage showed significant increases (Figure S2F) between the models constructed with 100, 200, 500, and 800 samples (Tukey’s HSD adjusted p-values < 0.05) but not between 800 and 1051 (Tukey’s HSD adjusted p-value > 0.05). The slower increase in pathway coverage when sample size is relatively large suggests redundancy in the compendium, potentially due to biological replicates or experiments probing similar processes. This highlights the importance of data that capture diverse processes.
Using the subsampling strategy, we also evaluated the reconstruction error of each model on its training set and a randomly chosen held out test set of 200 samples. As sample size increased, training reconstruction errors increased slightly while testing reconstruction errors dropped dramatically (Figure S2G). We fitted exponential models between sample size and the differences of training and testing errors (R2= 0.78 for 50-node models and R2= 0.83 for 300-node models). We extrapolated from these models to predict that testing errors would approximately match training errors when sample size was 782 for 50-node models and 1076 for 300-node models. These results suggested that smaller models were less sensitive to sample size, likely because they have fewer parameters to fit and also that our 1051 sample compendium was sufficient to train a 300-node model.
Construction of eADAGE models
We constructed ensemble ADAGE (eADAGE) models by combining many individual ADAGE models in to a single model. For each eADAGE model we combined 100 individual ADAGE models. The 100 models were trained with identical parameters but distinct random seeds. For an eADAGE model of size 300, we trained 100 individual models with 300 nodes each, which provided 30000 total nodes. Each node has a weight vector. We have previously observed that high-weight genes provided the most information to each node (Tan et al., 2016), so we calculated a weighted Pearson correlation between each node’s weight vectors. Our weighted Pearson correlation used (|node1 weight| + |node2 weight|)/2 as the weight function for each gene. We compared this to an unweighted Pearson correlation (corADAGE) as well a baseline ADAGE model.
After calculating correlation (weighted for eADAGE and unweighted for corADAGE), we converted the correlation to distance by calculating (1 − correlation)/2. This provided a 30000*30000 distance matrix storing distances between every two nodes. We clustered this distance matrix using the Partition Around Medoids (PAM) clustering algorithm (Park and Jun, 2009).We implemented clustering in R using the ConsensusClusterPlus package (Wilkerson and Hayes, 2010) from Bioconductor with the ppam function from Sprint package to perform parallel PAM (Piotrowski et al., 2011). We set the number of clusters to match the individual ADAGE model (e.g. 300) allowing for direct comparison between the eADAGE and ADAGE methods.
Clustering assigned each node to a cluster ranging from 1 to 300. We combined nodes assigned to the same cluster by calculating the average of their weight vectors. These 300 averaged vectors formed the weight matrix of the eADAGE model. Because the ensemble model is built from the weight matrices of individual models, it does not have the parameters that form the bias vectors. We built 10 eADAGE and 10 corADAGE models from 1000 ADAGE models with each ensemble model built upon 100 different individual models. The individual eADAGE model used for biological analysis in this work was constructed with random seed 123, which was arbitrarily chosen before model construction and evaluation.
PCA and ICA model construction
We constructed PCA and ICA models and defined each model’s weight matrix following the same procedures in (Tan et al., 2016). To compare with the 300-node eADAGE, we generated models of matching size (300 components). For ICA, we evaluated 10 replicates. PCA provides a single model. PCA and ICA models were evaluated through the KEGG pathway enrichment analysis described above.
Activity calculation for a gene signature
We calculated a signature’s activity for a specific sample as A = W · E/N, in which W is a vector of genes’ absolute weights in that signature, E is a vector of genes’ expression values after zero-one normalization in that sample, and N is the number of genes. It can be viewed as an averaged weighted sum of genes’ expression levels for genes in the signature. We normalized a signature’s activity by the number of genes (N) in that signature, because different signatures have different number of genes. We use gene’s absolute weight value in activity calculation to keep activity positive. In this way, a high activity indicates that majority of genes in the signature are highly expressed in the sample and a low activity indicates that majority of genes in the signature are lowly expressed in the sample.
Media annotation of the P. aeruginosa compendium
A team of P. aeruginosa biologists annotated the media for all samples in the compendium by referring to information associated with each sample in the ArrayExpress (Rustici et al., 2013) and/or GEO (Edgar, 2002) databases and along with the original publication, if reported. Each sample was annotated by two curators separately. Conflicting annotations, if they occurred, were resolved by a third curator. The media annotation for all samples in the compendium were provided in Table S1.
Identification of signatures activated across media
We calculated an activation score to identify gene signatures with dramatically elevated or reduced activity in a specific medium. We grouped samples by their medium annotation. For each gene signature and medium combination, we calculated the absolute difference between the mean activity of the signature for samples in that medium as well as the mean activity across the remainder of samples in the compendium. We divided this difference in the means by the range of activity for all samples across the compendium. This score captures the proportion by which the mean activity in a medium differs relative to the total difference across the compendium. We termed this ratio the activation score.
To identify the most specifically active signatures for each medium, we constructed a table for all pairs with an activation score greater than or equal to 0.4 (Table S2). This was highly stringent: it captured only the top 2.4% of the potential signature-medium pairs (Figure S4A). To identify pan-media signatures, we limited signatures to those that were active in multiple media (greater or equal to 0.4) and averaged their activation scores (Table S3). These signatures exhibit parallel patterns for multiple media across multiple distinct experiments.
Definition of the PhoB regulon
A PhoB regulon for the PAO1 genome was adapted from the PhoB regulon of PA14 in (Bielecki et al., 2015) in order to be comparable to models built with PAO1 genome. Of the 187 genes in the PA14 regulon, 160 were in the PAO1 reference genome (www.pseudomonas.com).
BCIP assay
King’s A (King et al., 1954), LB (Bertani, 2004), MOPS Medium (Neidhardt et al., 1974), NGM (Zaborin et al., 2009), Peptone (Lundgren et al., 2013) and PIA (BioWorld) were supplemented with 5-bromo-4-chloro-3-indolyl phosphate (BCIP) DMF solution to a final concentration of 60 µg/mL. BCIP assay plates were inoculated with 5 µl of overnight P. aeruginosa culture in LB broth. Colonies were grown for 16 hours at 37 °C then matured at room temperature until imaging. Images were collected 16 and 32 hours post inoculation.
Screen of a histidine kinase mutant collection
Molecular techniques to construct the histidine kinase (HK) knock out collection were carried out as described below. To construct deletion plasmids, flanking sequences of target genes were amplified by PCR (for primers see Table S1) and fused together by overlap extension PCR. Primers contained overlap with both the P. aeruginosa sequence and that of the pMQ30 (GenBank: DQ230317.1) for use in yeast cloning. The deletion sequences and plasmids were transformed into S. cerevisiae InvSc1 and, after overnight growth, isolated as deletion constructs. Constructs were transformed by electroporation into E. coli S17 λpir which was mated with P. aeruginosa and deletion mutants were resolved with selection by 50 µg mg−1 gentamicin and counter selection with 5% sucrose. Mutants were confirmed by DNA sequencing using primers that flanked the deletion site.
For each strain in the HK collection, a BCIP assay was performed on PIA. Plates were struck with an overnight P. aeruginosa culture concentrated two-fold by centrifugation. Plates were incubated at 37 °C 12–16 hours and matured at room temperature for an additional 12–16 hours alkaline phosphatase activity was determined qualitatively, based on blue color.
QUANTIFICATION AND STATISTICAL ANALYSIS
All the quantification and statistical analyses were performed in R. Details of each analysis are specified in the main text and methods where each analysis is discussed.
Supplementary Material
Table S1: Medium annotation for each sample in the compendium and primers used for mutant construction, related to STAR Methods. Some medium names are abbreviated and their actual ingredients are provided in a separate sheet in the excel file. The primer name indicates the PA14 gene targeted with the primers. Each knockout was constructed using four primers (1–4).
Table S2: A complete list of signatures activated in one medium with activation scores higher than or equal to 0.4, related to STAR Methods.
Table S3: A complete list of eADAGE signatures activated in a group of media, related to Figure 3 and STAR Methods. The top 5 signatures that were most active in a group of media were annotated by its percentage of uncharacterized genes, its associated KEGG pathways, and a manual inspection of genes in the signature.
Table S4: Comparison of the extraction of the PhoB regulon signal by PCA, ICA, ADAGE, and eADAGE models, related to Figure 3 and STAR Methods.
Highlights.
-
-
eADAGE is an unsupervised algorithm that learns pathway-like signatures
-
-
The ensemble step makes neural network derived signatures more precise and robust
-
-
Gene signatures built by eADAGE can be used to analyze a compendium of public data
-
-
Compendium analysis of medium and genotype revealed novel regulation of PhoB
Acknowledgments
This work was supported in part by a grant from the Gordon and Betty Moore Foundation (GBMF 4552) to CSG. This work was supported by National Institutes of Health (NIH) grant RO1-AI091702 to DAH. MTL is an investigator of the Howard Hughes Medical Institute. This work was supported by a pilot grant from the Cystic Fibrosis Foundation (STANTO15R0) to CSG and DAH. The authors would like to thank Gregory Way and René Zelaya for helpful code review. The authors also would like to thank Anastasia Baryshnikova for providing critical feedback on a preprint of this work.
Footnotes
Publisher's Disclaimer: This is a PDF file of an unedited manuscript that has been accepted for publication. As a service to our customers we are providing this early version of the manuscript. The manuscript will undergo copyediting, typesetting, and review of the resulting proof before it is published in its final citable form. Please note that during the production process errors may be discovered which could affect the content, and all legal disclaimers that apply to the journal pertain.
Author contributions
JT, DAH and CSG conceived and designed the research. JT, GD and KMC performed computational analyses. GD, KAL and CEP performed molecular experiments. KC, BP and MTL constructed and contributed the histidine kinase knock out collection. JT, GD, KMC, DAH and CSG wrote the manuscript, and KAL, CEP, KMC, KD, BP and MTL provided critical feedback.
DATA AND SOFTWARE AVAILABILITY
We provide the P. aeruginosa expression compendium along with all the code used in this paper on Zenodo (Tan et al., 2017). We also provide the eADAGE model used in the cross-compendium medium analysis, including the model’s weight matrix and gene signatures. The eADAGE repository is also tracked under version control at https://bitbucket.org/greenelab/eadage.
References
- Alter O, Brown PO, Botstein D. Singular value decomposition for genome-wide expression data processing and modeling. Proc. Natl. Acad. Sci. 2000;97:10101–6. doi: 10.1073/pnas.97.18.10101. [DOI] [PMC free article] [PubMed] [Google Scholar]
- Ashburner M, Ball CA, Blake JA, Botstein D, Butler H, Cherry JM, Davis AP, Dolinski K, Dwight SS, Eppig JT, et al. Gene Ontology: tool for the unification of biology. Nat. Genet. 2000;25:25–29. doi: 10.1038/75556. [DOI] [PMC free article] [PubMed] [Google Scholar]
- Beaulieu-Jones BK, Greene CS Pooled Resource Open-Access ALS Clinical Trials Consortium. Semi-supervised learning of the electronic health record for phenotype stratification. J. Biomed. Inform. 2016;64:168–178. doi: 10.1016/j.jbi.2016.10.007. [DOI] [PubMed] [Google Scholar]
- Beaulieu-Jones BK, Moore JH. Missing data imputation in the electronic health record using deeply learned autoencoders. Pac Sym Biocomput. 2017:207–218. doi: 10.1142/9789813207813_0021. [DOI] [PMC free article] [PubMed] [Google Scholar]
- Bengio Y, Courville A, Vincent P. Representation Learning: A Review and New Perspectives. TPAMI. 2013;35:1798–1828. doi: 10.1109/TPAMI.2013.50. [DOI] [PubMed] [Google Scholar]
- Bertani G. Lysogeny at mid-twentieth century: P1, P2, and other experimental systems. J. Bacteriol. 2004;186:595–600. doi: 10.1128/JB.186.3.595-600.2004. [DOI] [PMC free article] [PubMed] [Google Scholar]
- Bielecki P, Jensen V, Schulze W, Gödeke J, Strehmel J, Eckweiler D, Nicolai T, Bielecka A, Wille T, Gerlach RG, et al. Cross talk between the response regulators PhoB and TctD allows for the integration of diverse environmental signals in Pseudomonas aeruginosa. Nucleic Acids Res. 2015;43:6413–25. doi: 10.1093/nar/gkv599. [DOI] [PMC free article] [PubMed] [Google Scholar]
- Blus-Kadosh I, Zilka A, Yerushalmi G, Banin E. The effect of pstS and phoB on quorum sensing and swarming motility in Pseudomonas aeruginosa. PLoS One. 2013;8:e74444. doi: 10.1371/journal.pone.0074444. [DOI] [PMC free article] [PubMed] [Google Scholar]
- Chen L, Xuan J, Wang C, Shih I-M, Wang Y, Zhang Z, Hoffman E, Clarke R, Devore J, Peck R, et al. Knowledge-guided multi-scale independent component analysis for biomarker identification. BMC Bioinformatics. 2008;9:416. doi: 10.1186/1471-2105-9-416. [DOI] [PMC free article] [PubMed] [Google Scholar]
- Damron FH, Barbier M, McKenney ES, Schurr MJ, Goldberg JB. Genes required for and effects of alginate overproduction induced by growth of Pseudomonas aeruginosa on Pseudomonas isolation agar supplemented with ammonium metavanadate. J. Bacteriol. 2013;195:4020–36. doi: 10.1128/JB.00534-13. [DOI] [PMC free article] [PubMed] [Google Scholar]
- Damron FH, Owings JP, Okkotsu Y, Varga JJ, Schurr JR, Goldberg JB, Schurr MJ, Yu HD. Analysis of the Pseudomonas aeruginosa regulon controlled by the sensor kinase KinB and sigma factor RpoN. J. Bacteriol. 2012;194:1317–30. doi: 10.1128/JB.06105-11. [DOI] [PMC free article] [PubMed] [Google Scholar]
- Donato M, Xu Z, Tomoiaga A, Granneman JG, Mackenzie RG, Bao R, Than NG, Westfall PH, Romero R, Draghici S. Analysis and correction of crosstalk effects in pathway analysis. Genome Res. 2013;23:1885–93. doi: 10.1101/gr.153551.112. [DOI] [PMC free article] [PubMed] [Google Scholar]
- Edgar R. Gene Expression Omnibus: NCBI gene expression and hybridization array data repository. Nucleic Acids Res. 2002;30:207–210. doi: 10.1093/nar/30.1.207. [DOI] [PMC free article] [PubMed] [Google Scholar]
- Engreitz JM, Daigle BJ, Marshall JJ, Altman RB. Independent component analysis: mining microarray data for fundamental human gene expression modules. J. Biomed. Inform. 2010;43:932–44. doi: 10.1016/j.jbi.2010.07.001. [DOI] [PMC free article] [PubMed] [Google Scholar]
- Fisher SL, Jiang W, Wanner BL, Walsh CT. Cross-talk between the histidine protein kinase VanS and the response regulator PhoB. Characterization and identification of a VanS domain that inhibits activation of PhoB. J. Biol. Chem. 1995;270:23143–9. doi: 10.1074/jbc.270.39.23143. [DOI] [PubMed] [Google Scholar]
- Frigyesi A, Veerla S, Lindgren D, Höglund M, Quackenbush J, Jutten C, Herault J, Chiappetta P, Roubaud M, Torrésani B, et al. Independent component analysis reveals new and biologically significant structures in microarray data. BMC Bioinformatics. 2006;7:290. doi: 10.1186/1471-2105-7-290. [DOI] [PMC free article] [PubMed] [Google Scholar]
- Gillis J, Pavlidis P. Assessing identity, redundancy and confounds in Gene Ontology annotations over time. Bioinformatics. 2013;29:476–82. doi: 10.1093/bioinformatics/bts727. [DOI] [PMC free article] [PubMed] [Google Scholar]
- Gong T, Xuan J, Wang C, Li H, Hoffman E, Clarke R, Wang Y. Gene module identification from microarray data using nonnegative independent component analysis. Gene Regul. Syst. Bio. 2007;1:349–63. [PMC free article] [PubMed] [Google Scholar]
- Greene CS, Foster JA, Stanton BA, Hogan DA, Bromberg Y. Computational Approaches to Study Microbes and Microbiomes. Pac Sym Biocomput. 2016:557–567. [PMC free article] [PubMed] [Google Scholar]
- Greene CS, Troyanskaya OG. Accurate evaluation and analysis of functional genomics data and methods. Ann. N. Y. Acad. Sci. 2012;1260:95–100. doi: 10.1111/j.1749-6632.2011.06383.x. [DOI] [PMC free article] [PubMed] [Google Scholar]
- Hampel KJ, LaBauve AE, Meadows JA, Fitzsimmons LF, Nock AM, Wargo MJ. Characterization of the GbdR regulon in Pseudomonas aeruginosa. J. Bacteriol. 2014;196:7–15. doi: 10.1128/JB.01055-13. [DOI] [PMC free article] [PubMed] [Google Scholar]
- Himberg J, Hyvärinen A, Esposito F. Validating the independent components of neuroimaging time series via clustering and visualization. Neuroimage. 2004;22:1214–1222. doi: 10.1016/j.neuroimage.2004.03.027. [DOI] [PubMed] [Google Scholar]
- Jensen V, Lons D, Zaoui C, Bredenbruch F, Meissner A, Dieterich G, Munch R, Haussler S. RhlR Expression in Pseudomonas aeruginosa Is Modulated by the Pseudomonas Quinolone Signal via PhoB-Dependent and -Independent Pathways. J. Bacteriol. 2006;188:8601–8606. doi: 10.1128/JB.01378-06. [DOI] [PMC free article] [PubMed] [Google Scholar]
- Jiang Y, Oron TR, Clark WT, Bankapur AR, D’Andrea D, Lepore R, Funk CS, Kahanda I, Verspoor KM, Ben-Hur A, et al. An expanded evaluation of protein function prediction methods shows an improvement in accuracy. Genome Biol. 2016;17:184. doi: 10.1186/s13059-016-1037-6. [DOI] [PMC free article] [PubMed] [Google Scholar]
- Kanehisa M, Goto S. KEGG: kyoto encyclopedia of genes and genomes. Nucleic Acids Res. 2000;28:27–30. doi: 10.1093/nar/28.1.27. [DOI] [PMC free article] [PubMed] [Google Scholar]
- King EO, Ward MK, Raney DE. Two simple media for the demonstration of pyocyanin and fluorescin. J. Lab. Clin. Med. 1954;44:301–7. [PubMed] [Google Scholar]
- Lundgren BR, Thornton W, Dornan MH, Villegas-Peñaranda LR, Boddy CN, Nomura CT. Gene PA2449 is essential for glycine metabolism and pyocyanin biosynthesis in Pseudomonas aeruginosa PAO1. J. Bacteriol. 2013;195:2087–100. doi: 10.1128/JB.02205-12. [DOI] [PMC free article] [PubMed] [Google Scholar]
- Lutter D, Langmann T, Ugocsai P, Moehle C, Seibold E, Splettstoesser WD, Gruber P, Lang EW, Schmitz G. Analyzing time-dependent microarray data using independent component analysis derived expression modes from human macrophages infected with F. tularensis holartica. J. Biomed. Inform. 2009;42:605–611. doi: 10.1016/j.jbi.2009.01.002. [DOI] [PubMed] [Google Scholar]
- Ma S, Kosorok MR. Identification of differential gene pathways with principal component analysis. Bioinformatics. 2009;25:882–9. doi: 10.1093/bioinformatics/btp085. [DOI] [PMC free article] [PubMed] [Google Scholar]
- Miller JH. Experiments in molecular genetics. Cold Spring Harbor Laboratory 1972 [Google Scholar]
- Miotto R, Li L, Kidd BA, Dudley JT. Deep Patient: An Unsupervised Representation to Predict the Future of Patients from the Electronic Health Records. Sci. Rep. 2016;6:26094. doi: 10.1038/srep26094. [DOI] [PMC free article] [PubMed] [Google Scholar]
- Monti S, Tamayo P, Mesirov J, Golub T. Consensus clustering: a resampling-based method for class discovery and visualization of gene expression microarray data. Mach. Learn. 2003;52:91–118. [Google Scholar]
- Neidhardt FC, Bloch PL, Smith DF. Culture medium for enterobacteria. J. Bacteriol. 1974;119:736–47. doi: 10.1128/jb.119.3.736-747.1974. [DOI] [PMC free article] [PubMed] [Google Scholar]
- Park H-S, Jun C-H. A simple and fast algorithm for K-medoids clustering. Expert Syst. Appl. 2009;36:3336–3341. [Google Scholar]
- Piotrowski M, Forster T, Dobrezelecki B, Sloan TM, Mitchell L, Ghazal P, Mewsissen M, Petrou S, Trew A, Hill J. 2011 HPCS. IEEE; 2011. Optimisation and parallelisation of the partitioning around medoids function in R; pp. 707–713. [Google Scholar]
- Podgornaia AI, Laub MT. Determinants of specificity in two-component signal transduction. Curr. Opin. Microbiol. 2013;16:156–62. doi: 10.1016/j.mib.2013.01.004. [DOI] [PubMed] [Google Scholar]
- Rahme LG, Stevens EJ, Wolfort SF, Shao J, Tompkins RG, Ausubel FM. Common virulence factors for bacterial pathogenicity in plants and animals. Science. 1995;268:1899–1902. doi: 10.1126/science.7604262. [DOI] [PubMed] [Google Scholar]
- Raychaudhuri S, Stuart JM, Altman RB. Principal components analysis to summarize microarray experiments: application to sporulation time series. Pac. Symp. Biocomput. 2000:455–66. doi: 10.1142/9789814447331_0043. [DOI] [PMC free article] [PubMed] [Google Scholar]
- Roden JC, King BW, Trout D, Mortazavi A, Wold BJ, Hart CE, Tavazoie S, Hughes J, Campbell M, Cho R, et al. Mining gene expression data by interpreting principal components. BMC Bioinformatics. 2006;7:194. doi: 10.1186/1471-2105-7-194. [DOI] [PMC free article] [PubMed] [Google Scholar]
- Rustici G, Kolesnikov N, Brandizi M, Burdett T, Dylag M, Emam I, Farne A, Hastings E, Ison J, Keays M, et al. ArrayExpress update--trends in database growth and links to data analysis tools. Nucleic Acids Res. 2013;41:D987–90. doi: 10.1093/nar/gks1174. [DOI] [PMC free article] [PubMed] [Google Scholar]
- Santos-Beneit F. The Pho regulon: a huge regulatory network in bacteria. Front. Microbiol. 2015;6:402. doi: 10.3389/fmicb.2015.00402. [DOI] [PMC free article] [PubMed] [Google Scholar]
- Schnoes AM, Ream DC, Thorman AW, Babbitt PC, Friedberg I. Biases in the experimental annotations of protein function and their effect on our understanding of protein function space. PLoS Comput. Biol. 2013;9:e1003063. doi: 10.1371/journal.pcbi.1003063. [DOI] [PMC free article] [PubMed] [Google Scholar]
- Tan J, Doing G, Lewis KA, Price CE, Chen KM, Cady KC, Perchuk B, Laub MT, Hogan DA, Greene CS. eADAGE-1.0.0. Zenodo. 2017 doi: 10.1016/j.cels.2017.06.003. [DOI] [PMC free article] [PubMed] [Google Scholar]
- Tan J, Hammond JH, Hogan DA, Greene CS. ADAGE-Based Integration of Publicly Available Pseudomonas aeruginosa Gene Expression Data with Denoising Autoencoders Illuminates Microbe-Host Interactions. mSystems. 2016;1:e00025–15. doi: 10.1128/mSystems.00025-15. [DOI] [PMC free article] [PubMed] [Google Scholar]
- Tan J, Ung M, Cheng C, Greene CS. Unsupervised feature construction and knowledge extraction from genome-wide assays of breast cancer with denoising autoencoders. Pac. Symp. Biocomput. 2015;20:132–43. [PMC free article] [PubMed] [Google Scholar]
- Thompson JA, Tan J, Greene CS. Cross-platform normalization of microarray and RNA-seq data for machine learning applications. PeerJ. 2016;4:e1621. doi: 10.7717/peerj.1621. [DOI] [PMC free article] [PubMed] [Google Scholar]
- Verhamme DT, Arents JC, Postma PW, Crielaard W, Hellingwerf KJ. Investigation of in vivo cross-talk between key two-component systems of Escherichia coli. Microbiology. 2002;148:69–78. doi: 10.1099/00221287-148-1-69. [DOI] [PubMed] [Google Scholar]
- Vincent P, Larochelle H, Bengio Y, Manzagol P-A. ICML ’08. ACM Press; New York, New York, USA: 2008. Extracting and composing robust features with denoising autoencoders; pp. 1096–1103. [Google Scholar]
- Vincent P, Larochelle H, Lajoie I, Bengio Y, Manzagol P-A. Stacked denoising autoencoders: Learning useful representations in a deep network with a local denoising criterion. J. Mach. Learn. Res. 2010;11:3371–3408. [Google Scholar]
- Wanner BL, Chang BD. The phoBR operon in Escherichia coli K-12. J. Bacteriol. 1987;169:5569–74. doi: 10.1128/jb.169.12.5569-5574.1987. [DOI] [PMC free article] [PubMed] [Google Scholar]
- Wargo MJ, Gross MJ, Rajamani S, Allard JL, Lundblad LKA, Allen GB, Vasil ML, Leclair LW, Hogan DA. Hemolytic phospholipase C inhibition protects lung function during Pseudomonas aeruginosa infection. Am. J. Respir. Crit. Care Med. 2011;184:345–354. doi: 10.1164/rccm.201103-0374OC. [DOI] [PMC free article] [PubMed] [Google Scholar]
- Wargo MJ, Ho TC, Gross MJ, Whittaker LA, Hogan DA. GbdR regulates Pseudomonas aeruginosa plcH and pchP transcription in response to choline catabolites. Infect. Immun. 2009;77:1103–11. doi: 10.1128/IAI.01008-08. [DOI] [PMC free article] [PubMed] [Google Scholar]
- Wilkerson MD, Hayes DN. ConsensusClusterPlus: a class discovery tool with confidence assessments and item tracking. Bioinformatics. 2010;26:1572–3. doi: 10.1093/bioinformatics/btq170. [DOI] [PMC free article] [PubMed] [Google Scholar]
- Yu B. Stability. Bernoulli. 2013;19:1484–1500. [Google Scholar]
- Zaborin A, Romanowski K, Gerdes S, Holbrook C, Lepine F, Long J, Poroyko V, Diggle SP, Wilke A, Righetti K, et al. Red death in Caenorhabditis elegans caused by Pseudomonas aeruginosa PAO1. Proc. Natl. Acad. Sci. 2009;106:6327–32. doi: 10.1073/pnas.0813199106. [DOI] [PMC free article] [PubMed] [Google Scholar]
Associated Data
This section collects any data citations, data availability statements, or supplementary materials included in this article.
Supplementary Materials
Table S1: Medium annotation for each sample in the compendium and primers used for mutant construction, related to STAR Methods. Some medium names are abbreviated and their actual ingredients are provided in a separate sheet in the excel file. The primer name indicates the PA14 gene targeted with the primers. Each knockout was constructed using four primers (1–4).
Table S2: A complete list of signatures activated in one medium with activation scores higher than or equal to 0.4, related to STAR Methods.
Table S3: A complete list of eADAGE signatures activated in a group of media, related to Figure 3 and STAR Methods. The top 5 signatures that were most active in a group of media were annotated by its percentage of uncharacterized genes, its associated KEGG pathways, and a manual inspection of genes in the signature.
Table S4: Comparison of the extraction of the PhoB regulon signal by PCA, ICA, ADAGE, and eADAGE models, related to Figure 3 and STAR Methods.