Abstract
Otitis media is the leading cause of hearing loss in children. It is commonly associated with fluid in the ear, which can result in up to 45 dB of hearing loss for extended periods of time during a child’s most important developmental years. Accurate assessment of middle ear effusions is an important part of understanding otitis media. Current technologies used to diagnose otitis media with effusion are pneumatic otoscopy, tympanometry, and acoustic reflectometry. While all of these techniques can reasonably diagnose the presence of an effusion, they provide limited information about the infection present behind the tympanic membrane.
We have developed a technique based on low-coherence interferometry—a non-invasive optical ranging technique capable of sensing depth-resolved microscopic scattering features through the eardrum—to quantify eardrum thickness and integrity, as well as detect any effusion, purulence, or biofilm behind the tympanic membrane. In this manuscript, the technique is coupled with a pneumatic otoscope to measure minute deflections of the tympanic membrane from insufflation pressure stimuli. This results in quantitative measurements of tympanic membrane mobility, which may be used to gain a better understanding of the impact of infection on the membrane dynamics. A small pilot study of 15 subjects demonstrates the ability of pneumatic low-coherence interferometry to quantitatively differentiate normal ears from ears with effusions present. Analysis of the strengths and weaknesses of the technique, as well as focus areas of future research, is also discussed.
Keywords: otitis media, biomechanics, imaging, middle ear effusion, optical coherence tomography
INTRODUCTION
Otitis media (OM) is the leading cause of hearing loss in children (ASHA 2015). OM is often accompanied by varying degrees of fluid within the middle ear (otitis media with effusion, OME), which may result in hearing impairment. In cases of serous middle ear effusion (MEE), average hearing loss is ~24 dB. However, in cases of purulent MEE or glue ear, average hearing loss increases to ~45 dB, representing a significant impediment to normal hearing. In cases of chronic OME, this hearing loss can persist for months and can be difficult to diagnose and treat efficiently (Lieberthal et al. 2013, Linsk et al. 2013, New York Times 2012, Shekelle et al. 2003).
Current technologies used to diagnose and study OME include otoscopy, pneumatic otoscopy, tympanometry, and acoustic reflectometry. While otoscopy alone has shown to have inconsistent predictive value (Linsk et al. 2013, New York Times 2012), the sensitivity and specificity increase dramatically when pneumatic otoscopy is used (Jones and Kaleida 2003). Sensitivity and specificity for both pneumatic otoscopy and tympanometry range from 80–90 %, which is quite good (Muderris et al. 2013, Takata et al. 2003), but the predictive value is highly dependent upon the experience of the practitioner. Spectral gradient acoustic reflectometry (SGAR) is another method used less commonly to diagnose MEE; however, the sensitivity and specificity of SGAR has been shown to fall below those obtained using the aforementioned techniques (Muderris et al. 2013).
Limitations of these techniques include an inability to determine fluid type (serous, purulent, glue ear) and a lack of any spatial information about tympanic membrane (TM) movement. In rare cases where the TM is still translucent, otoscopy can be used to roughly identify the type of fluid. However, it is more common that the TM is erythematous and rather opaque, preventing accurate typing of fluid. Additionally, since all of these techniques measure the bulk response of the TM, local aberrations such as monolayer regions of the TM, tympanic membrane sclerosis, fluid loculations, and air bubbles may change the mobility of the TM in a spatially confined region, confounding the clinician’s impression of the disease.
Optical coherence tomography (OCT), which is based on low-coherence interferometry (LCI), is a technique first introduced for noninvasive imaging of the retina (Cense et al. 2004, Costa et al. 2006, Huang et al. 1991). Its use has since been expanded to applications in cardiology (Lim et al. 2006), oncology (Armstrong et al. 2006, Erickson-Bhatt et al. 2015), dermatology (Neerken et al. 2004), otolaryngology (Djalilian et al. 2010, Gao et al. 2011, Pitris et al. 2001, Subhash et al. 2012), and others. We have previously introduced handheld LCI and OCT as techniques that use near-infrared light to look through the TM and into the middle ear (Nguyen et al. 2010, Nguyen et al. 2012, Shelton et al. 2014). LCI provides 1-D depth-resolved profiles through the TM, and OCT provides 2-D and 3-D images and volumes of the TM and middle ear. These techniques provide access to new information, such as TM thickness, presence, purulence (turbidity), and viscosity of MEEs (Monroy et al. 2016), and presence and thickness of biofilm structures found in the middle ear (Hubler et al. 2015, Monroy et al. 2015). OCT provides real-time imaging through the TM and up to 3–5 mm into the middle ear space with spatial resolution of 2–15 μm.
In this manuscript, we report on a modified LCI system interfaced with a pneumatic otoscope. This allows for pneumatic insufflation of a subject’s ear, but rather than a subjective examination of TM mobility using a standard otoscopy view, LCI is used to provide quantitative assessment of displacement and motion. Due to the exquisite axial spatial resolution afforded by this technique, movements as small as tens of microns are easily measured and compared with the stimulus induced by the pneumatic otoscope. A pressure control module was constructed in order to provide repeatable and measurable pressure stimuli. Simultaneous measurement of the pressure stimulus and resulting TM displacement resulted in identification of quantitative metrics that could be used to compare results from normal patients and patients with OME.
METHODS
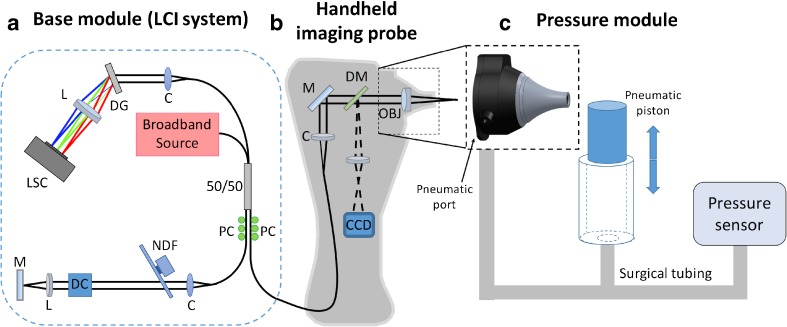
A combination pneumatic otoscope and spectral-domain LCI ranging system was built in order to quantitatively evaluate the motion of the TM. As mentioned in the Introduction, LCI is a well-established optical ranging technique that uses near-infrared light to accurately measure distance between optical scatterers. By measuring the position of the surface of the eardrum over time, its movement can be recorded with micron-scale resolution. As shown in Figure 1, this device was composed of three modules: a base module, a handheld imaging probe, and a pressure control module.
FIG. 1.
Schematic drawing of the quantitative pneumatic otoscope. a Standard spectral-domain low-coherence interferometry system comprised of a broadband source, spectrometer, and Michelson interferometer. b Handheld imaging probe providing simultaneous surface otoscopy images and depth-resolved LCI scans. c Pressure module, featuring a pneumatic piston and pressure sensor, which interfaces with the handheld imaging probe through a pneumatic port in the nosecone of the probe. LSC line scan camera, L lens, DG diffraction grating, C collimator, 50/50 fiber-coupled beam splitter, PC polarization controller, NDF neutral density filter, DC dispersion compensation, M mirror, DM dichroic mirror, OBJ objective lens, CCD charge-coupled device camera.
Base Module
The base module (Fig. 1a) housed the LCI system, which included an optics unit, spectrometer, light source, and computer. The optics unit contained a fiber-based Michelson interferometer, with polarization paddles on the reference and sample ports of the 2 × 2 fiber coupler. The optics unit also contained a free-space reference arm with a mirror for reflecting light back into the interferometer. The spectrometer (COBRA, Wasatch Photonics, USA) had a spectral range of 940 nm ± 40 nm, and was capable of up to 40 kHz line rate. The light source (Broadlighter S930, Superlum, Ireland) was a superluminescent diode (SLD) with a center wavelength of 940 nm and a spectral bandwidth of 70 nm, providing an axial resolution of 5.6 μm. The computer used in this system was a small form-factor desktop computer (Alienware X51, Dell, USA) with a CameraLink data acquisition card (PCIe-1427R, National Instruments, USA).
Handheld Imaging Probe
The handheld imaging probe (Fig. 1b) was designed with the form factor of a conventional otoscope in mind. The probe housed the sample arm of the interferometer, as well as focusing optics to deliver the light into the ear and collect light reflected from the ear. The probe also housed all components necessary for video otoscopic imaging. The nosecone from a commercial pneumatic otoscope (R.A. Bock Diagnostics, USA) was modified to include a focusing lens. Leveraging this commercial nosecone for the design left the pneumatic port fully operational. White light for surface illumination of the TM was delivered from an LED in the probe housing to the sample via a fiber bundle concentrically arranged at the distal end of the probe nosecone. Surface images of the TM were collected and imaged onto a miniature camera located in the handle of the probe. Light corresponding to the video path (visible) and LCI path (near-infrared) was separated using a dichroic mirror after being reflected from the TM.
Pressure Control Module
In order to perform quantitative pneumatic measurements and analysis, a pressure control module (Fig. 1c) was built to control and monitor pressure in the ear canal. This module was composed of a pneumatic piston chamber and a calibrated pressure sensor. The chamber was connected to a T-adapter. One arm of the T-adapter was connected to the pneumatic port of the probe via surgical tubing. The second arm of the T-adapter was connected to a calibrated pressure sensor (SM5852, Silicon Microstructures, Inc., USA). The result was a simple module that allowed real-time modulation of the ear canal pressure using the pneumatic piston, and simultaneous real-time calibrated measurements of that pressure modulation.
Data Collection and Analysis
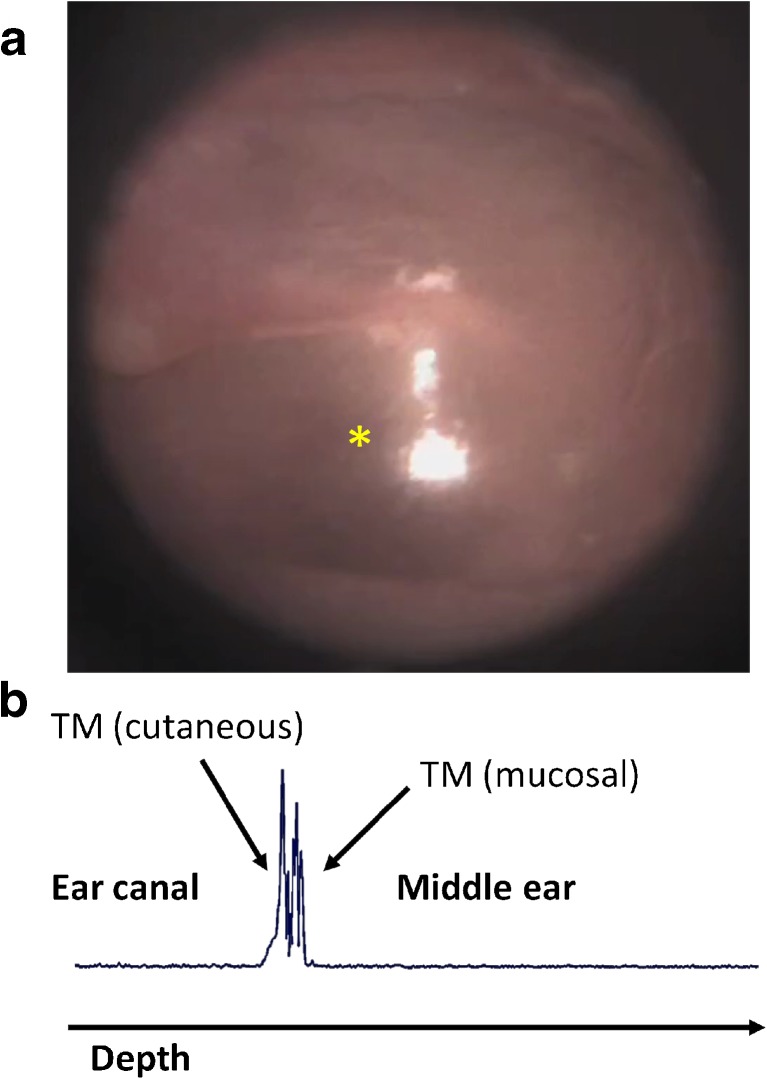
LCI A-scans (1-D depth profiles) and standard otoscopy images were collected simultaneously from the TM of subjects enrolled in the study. Figure 2 shows examples of an otoscopy image (Fig. 2a) and co-registered LCI depth scan (Fig. 2b) in a normal human ear. It is important to note the new information being provided. The orientation of an LCI scan is orthogonal to the otoscopy image, as the collected data is plotted against depth into the middle ear. The resulting plot has boundaries representing both the cutaneous and mucosal surfaces of the eardrum, as noted in Figure 2. This technique enables quantitative and highly precise measurements of thickness and motion of the eardrum.
FIG. 2.
Depth ranging in the ear. a Standard otoscopy image of a normal eardrum. b Depth scan plot through the eardrum at the location noted by the yellow asterisk in (a), acquired using low-coherence interferometry. The structural features of the tissue are shown in the trace, which shows light scattered back from the full thickness of the eardrum. By tracking repeated LCI scans in the same location, tympanic membrane displacements on the order of tens of microns can be tracked in real time.
For each subject, A-scans were collected in real-time at a rate of 1 kHz over a duration of 2 s (total of 2000 A-scans). During the 2-s acquisition window, a pressure impulse was delivered to the ear canal, and the displacement of the TM was measured using the consecutive A-scans. The resulting data consisted of (1) an LCI M-scan (an image representing consecutive A-scans over time), (2) a plot of the pressure in the ear canal over the acquisition window, and (3) a standard otoscopy image at the time of acquisition. All data was taken from the pars tensa region of the TM. When visible, the location of the depth scans was taken at the light reflex for consistency. The display of the otoscopy image includes a cross-hair indicator to let the user know where the LCI is being taken. The pars flaccida, malleus, and annulus were avoided. While these areas could be used as well, they generally are not expected to move much even in a healthy ear, so emphasis was placed on the pars tensa for this pilot study.
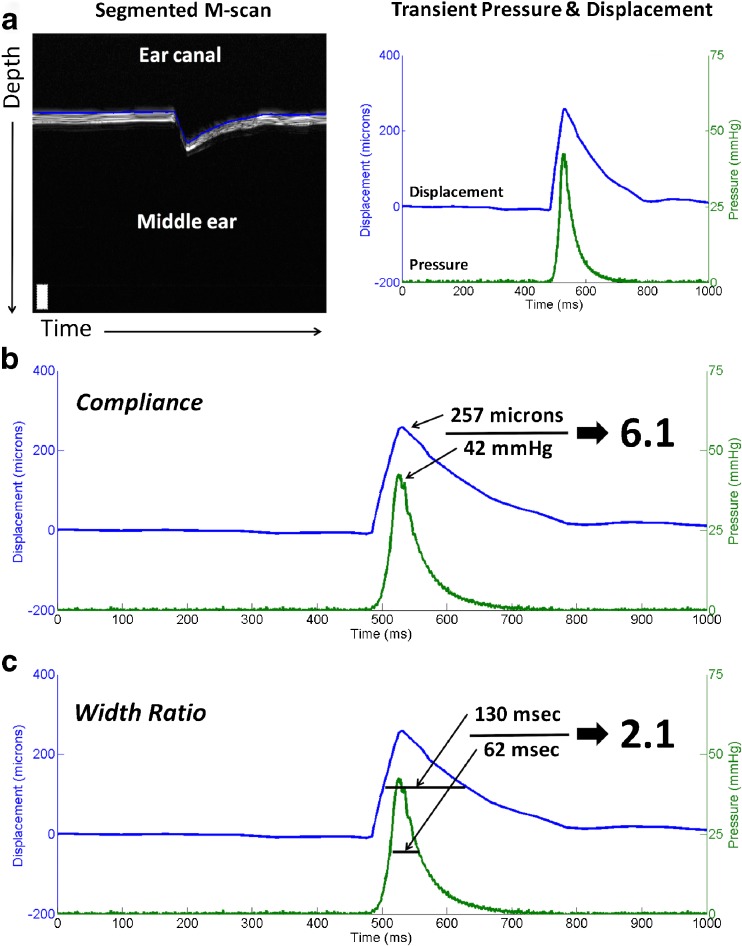
In order to extract meaningful information from the collected data, the M-scans were manually segmented, resulting in a plot of displacement over time. The displacement was then plotted alongside ear canal pressure over time. These plots represent the dynamics that are subjectively observed during standard pneumatic otoscopy: pressure input to the ear canal and resulting TM displacement. Figure 3a shows an example of a segmented M-scan and resulting displacement plot.
FIG. 3.
Data processing. a Segmented M-scan showing a typical impulse response of a normal TM to a pressure stimulus (left). Once the TM surface has been segmented, a plot showing displacement and pressure over time can be generated (right). From this plot, quantitative metrics can be computed. b “Compliance” can be computed as the peak displacement divided by the peak pressure. This metric is directly representative of TM mobility. c “Width ratio” can be computed by taking the FWHM of the displacement peak divided by the FWHM of the pressure peak. This metric is representative of the temporal response of the TM. Together, these metrics can be used to characterize and compare TMs between subjects.
From these data, metrics for comparison can be derived. For instance, one relevant metric can be obtained by computing the quotient of the peak displacement and peak pressure. The resulting metric, termed “compliance” for the purposes of this study and illustrated in Figure 3b, is a representation of distance traveled as a function of pressure applied. In this way, the compliance may be used to provide a quantitative metric to what is traditionally a qualitative and subjective exam. Another metric found to be useful is obtained by computing the quotient of the full width at half-maximum (FWHM) value of the displacement curve and the FWHM value of the pressure curve. The resulting metric, termed “width ratio” for the purposes of this study and illustrated in Figure 3c, is a representation of the temporal response of the eardrum to a pressure stimulus. These metrics will be used throughout the rest of the paper in various analyses.
Subject Recruitment and Enrollment
Subjects for this study were recruited and enrolled under a protocol approved by the Institutional Review Boards (IRB) of the University of Illinois at Urbana-Champaign and Carle Foundation Hospital in Urbana, IL. Subjects were recruited and imaged in the otolaryngology clinic at Carle Foundation Hospital, Urbana, Illinois. Inclusion criteria included complaint of ear pain or abnormal audiogram. Subjects that could not tolerate a standard otoscopic exam due to pain were excluded from this study. No identified subject, however, met this exclusion criterion. Eligible patients were consented and imaged by the provider immediately after their standard ear exam, which was performed per standard of care. This preliminary study focused on an adult population.
RESULTS
Phantom Studies
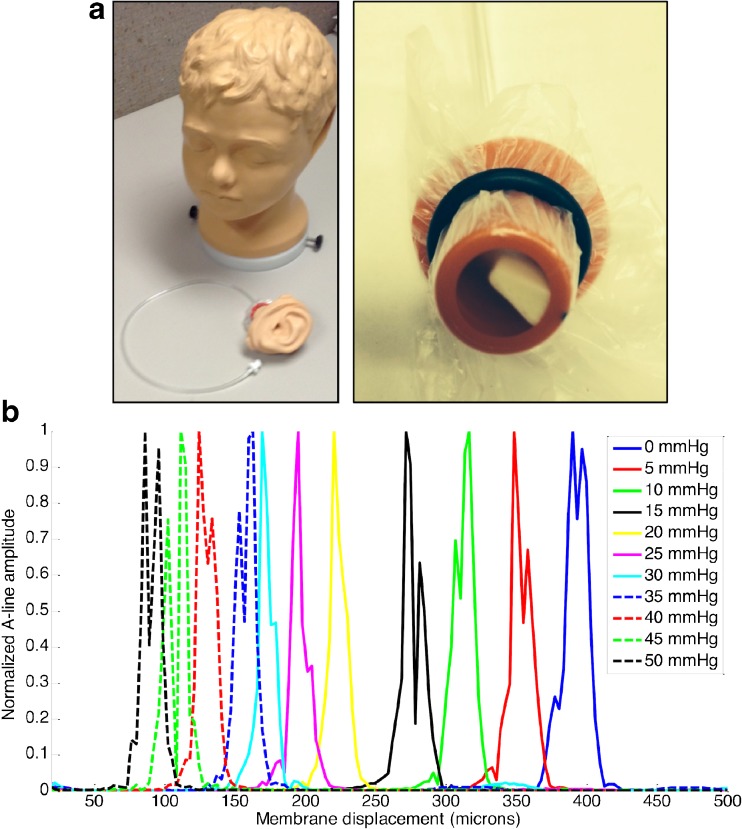
The first experiment performed was a phantom study to ensure that the system was capable of measuring small changes in TM displacement. For this study, a commercial ear model (Life/form, Nasco, USA) with a synthetic TM and pressure-controlled middle ear chamber was used. Figure 4a shows photos of the ear model (left) and removable middle ear compartment (right). Changing the pressure in the middle ear space of this model could simulate disease states, such as OME, which is usually accompanied by increased middle ear pressure.
FIG. 4.
Phantom characterization using LCI. a Photos of the Life/form model used for characterization of the imaging system. The model has anatomically accurate and removable ears, complete with a synthetic tympanic membrane and middle ear compartment. The middle ear compartment can be pressure-controlled to simulate disease states. b Plot showing A-line depth profiles of the phantom at 10 varying middle ear pressures. Membrane displacement trends as expected, changing approximately linearly with respect to pressure from 0–25 mmHg. Note: membrane position has been defined relative to the optical axis along which light is delivered, thus increases in middle ear pressure result in a decrease in membrane position.
In order to validate the ability of pneumatic LCI to measure small displacements in position of the TM, A-lines were recorded from the ear phantom at varying middle ear pressures. As shown in Figure 4b, the TM position changes as middle ear pressure is increased. In this plot, membrane position has been defined relative to the optical axis along which light is delivered, thus, increases in middle ear pressure result in a decrease in membrane position. It is important to note that the displacement between adjacent measurements decreases as the pressure increases above 25 mmHg. This is expected as the distention of the membrane begins to saturate. Note that since these synthetic membranes are less elastic than a human TM, it is not possible to extrapolate the pressures used in this experiment to in vivo cases. The purpose of this experiment was to show that small changes in displacement in a model TM could be accurately measured using pneumatic LCI.
Human Studies
After the system was validated in phantom studies, it was brought into the clinic to take measurements in healthy and diseased patients. A total of 16 ears from 12 subjects were imaged for this study. Subject age ranged from 26 to 68. Two of the 12 subjects were female. After the otolaryngologist examined a subject, the physician imaged them using the pneumatic LCI device. The clinical opinion of the physician and the quantitative data obtained from the LCI device were then analyzed and compared.
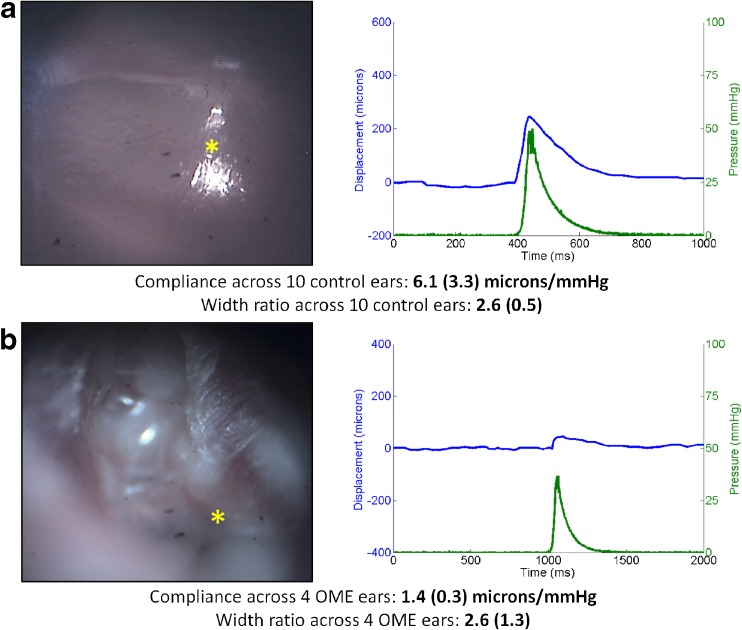
Figure 5 shows representative results from healthy control (5a) and OME (5b) subjects. The mean compliance across 10 healthy control ears was 6.1 μm/mmHg (SD = 3.3). The mean width ratio across 10 healthy ears was 2.6 (dimensionless, SD = 0.47). Conversely, the mean compliance across 4 patients clinically diagnosed with OME was 1.4 μm/mmHg (SD = 0.3), and the mean width ratio was 2.6 (SD = 1.3). A bubble indicative of middle ear fluid can be seen in the top-left quadrant of the OME surface image. Importantly, and as expected, the compliance in the subjects with OME was 4.4× smaller than that of healthy control subjects. This shows that given the same stimulus, the TM of subjects with OME is much less mobile than those of healthy subjects. The width ratio in subjects with OME was not significantly different than healthy controls. This is an interesting result, but not counter-intuitive. It is not unreasonable to assume that the relative temporal response of the TM does not change significantly under a pressurized middle ear. This topic is explored further in the Discussion section below.
FIG. 5.
Normal and OME ear results. a Otoscopy image (left) and pressure/displacement curves (right) of a representative normal ear. The mean compliance across 10 normal control ears was 6.1 μm/mmHg, and the mean width ratio was 2.6. b Otoscopy image (left) and pressure/displacement curves (right) of a representative case of OME. The mean compliance across 4 OME ears was 1.4 μm/mmHg, a factor of 4.4× lower than the normal value. The mean width ratio was 2.6, showing no difference from the healthy case.
The Valsalva maneuver is commonly used to equalize pressure across the eardrum. Most notably, this maneuver is utilized when experiencing changes in ambient external pressure, such as when flying or scuba diving. The maneuver causes the Eustachian tube to open, allowing pressure in the middle ear to equalize with that of the oral cavity. Since this results in a change in pressure as well as a change in position of the TM, we chose to characterize it using the pneumatic LCI device. Since the Valsalva maneuver produces a known physical response in the middle ear and eardrum, it provides a repeatable method for validating that these metrics are measuring real physical parameters. This Valsalva data was used to validate the technique, but does not carry clinical significance alone, as it simply shows the patient can push air into the middle ear space.
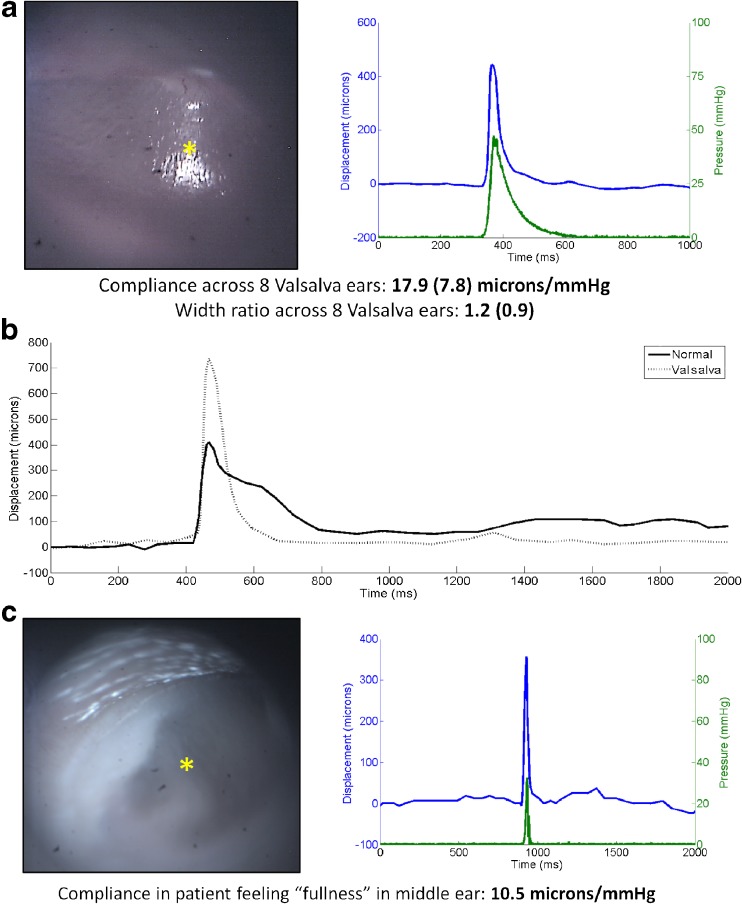
Figure 6 shows representative pressure and displacement results from subjects performing the Valsalva maneuver. Figure 6a shows an otoscopy image (left) and pressure and displacement curves (right) from a subject imaged immediately after performing the Valsalva maneuver. The subject performed the maneuver until they felt the Eustachian tube open, then held at that pressure. Figure 6b displays a comparison of displacement data from a healthy subject at rest (solid line) and the same subject immediately after performing the Valsalva maneuver (dashed line) at the same location under identical pressure stimuli. Two distinct changes are observed when comparing a normal displacement curve with a Valsalva displacement curve: (1) the total displacement is much larger than in the normal case; and (2) the temporal response back to the baseline TM position is much faster than in the normal case. Each of these changes can be quantified using the compliance and width ratio previously defined. For healthy eardrums in a resting state, the compliance and width ratio are 6.1 μm/mmHg and 2.6, respectively. In the case of healthy subjects performing the Valsalva maneuver, these numbers change to 17.9 μm/mmHg and 1.2, respectively. These changes match what is seen visually in the plots: the displacement increases by 3×, and the temporal response is much faster in the Valsalva case, decreasing by 2.2×.
FIG. 6.
Valsalva maneuver. a Otoscopy image (left) and pressure/displacement curves (right) of a representative normal ear while performing the Valsalva maneuver. The mean compliance across 8 Valsalva ears was nearly 18 μm/mmHg. This is 3 times larger than that seen in normal ears. b Displacement of a healthy TM while under normal conditions (solid line) and while under the Valsalva maneuver (dotted line). Stimulus in each case was identical. Larger displacements and faster response times can be seen while under Valsalva. c Otoscopy image (left) and pressure/displacement curves (right) of a subject that complained of “fullness” in their ear. The compliance for this subject was repeatedly measured at ~10 μm/mmHg, much higher than normal and very close to the expected response of an ear under the Valsalva maneuver.
Over the course of this study, an interesting case presented in the clinic where a patient had repeatedly complained of pressure or “fullness” in the middle ear space of both ears. The patient had normal appearing tympanic membranes on otoscopy, normal tympanograms, and a normal audiogram but kept returning and complaining of this feeling of aural fullness. When imaged with pneumatic LCI, the results looked closer to those of someone performing the Valsalva maneuver, even though this subject was at rest. Figure 6c shows the otoscopy image (left) and pressure and displacement curves (right) for this subject. The compliance and width ratio were 10.2 μm/mmHg and 1.4, respectively. Perhaps this subject was experiencing a slight increase in middle ear pressure that was unable to be detected using current clinical techniques. The ratios measured using pneumatic LCI suggested this subject fell somewhere between a healthy subject at rest and a healthy subject performing the Valsalva maneuver.
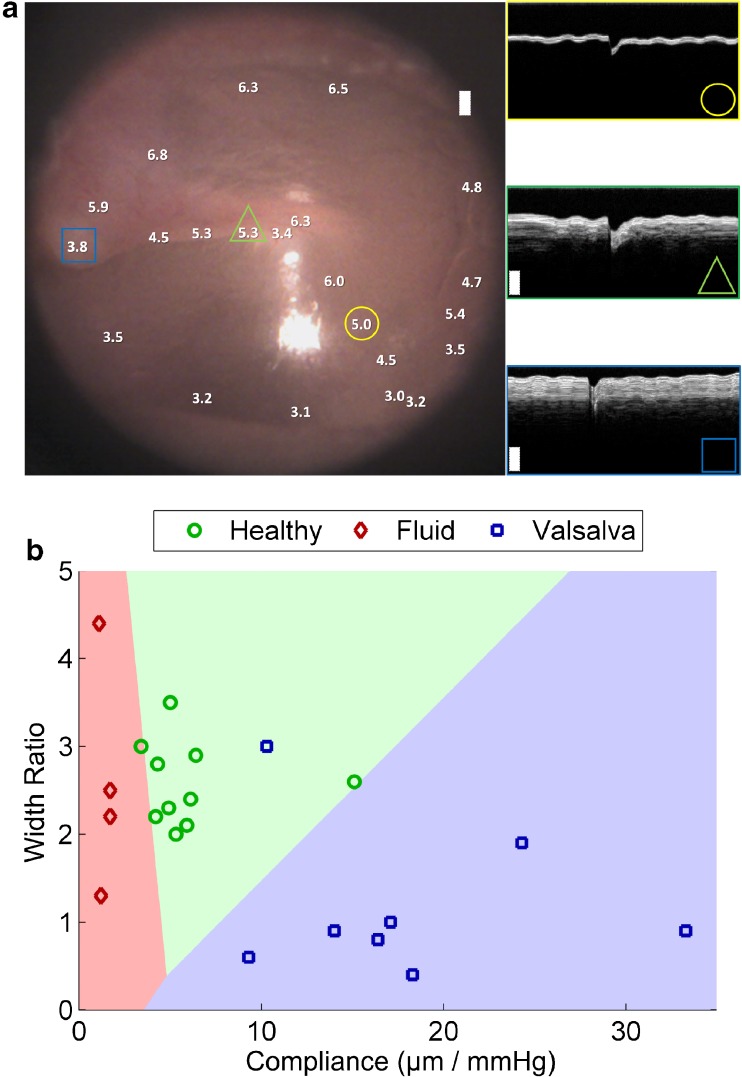
Additional analyses were performed in order to demonstrate the utility of the quantitative metrics that can be garnered using pneumatic LCI. Figure 7a shows an otoscopy image of the TM of a healthy volunteer. Overlaid on the image are values corresponding to the compliance at various locations across the TM. As seen on the image, the compliance values range from 3.0–6.5 μm/mmHg, depending on the location. The values trend as would be expected, with the smallest values (least displacement) near the annulus, umbo, and mallear prominence. The largest values are in the pars flaccida region and the central area of the pars tensa. The insets show M-scans from the locations marked with a circle, triangle, and square. The circle shows a location in the center of the pars tensa near the light reflex, which is where the previous measurements from healthy, OME, and Valsalva subjects were taken. As indicated in the M-scan, in the pars tensa region a thin TM is observed and reasonable compliance of ~5.0–6.0 μm/mmHg can be expected. The triangle shows a location on the handle of the malleus. In the M-scan, the TM can be seen as a bright white superficial band, and beneath this band the malleus can be seen as a darker shaded band, thicker than the TM. While it might be intuitive to assume a thicker section of the TM should have lower compliance, this is not necessarily the case, because the drum and malleus move as one piece upon stimulus. Lower compliance is consistently seen near the annulus, where the motion of the drum is restricted, and near the mallear prominence, as shown by the square, where the lateral process of the malleus produces a protrusion on the TM surface. At this location, the TM is very thin and the underlying bone is much thicker than in the case of the handle of the malleus. It is important to note that since the compliance of a normal eardrum varies depending on location, we have made an effort to take all data for this manuscript from the light reflex. In the future, a mapped, normative database will be developed that enables measurements from different locations to be normalized, based on the quadrant in which the measurement was taken.
FIG. 7.
Additional analyses of ratios. a Compliance in a healthy left ear as a function of location on the TM (left). The white numbers indicate compliance and their placement on the otoscopy image shows where the measurements were taken. M-scans at three representative locations are shown (right), denoted by the yellow circle, green triangle, and blue square. In two of the M-scans, two layers can be seen in the depth profile, corresponding to the soft tissue of the TM (superficial bright layer) and the underlying bone of the malleus beneath. b Scatter plot of healthy subjects under healthy (green circles) and Valsalva (blue squares) conditions, as well as subjects diagnosed with fluid in their ear (red diamonds). Data plots compliance vs. width ratio. Linear discriminant analysis was used to classify the three groups with a re-substitution error rate of 9.1 %.
The compliance and width ratio investigated in these studies can be useful in determining the health of the middle ear. In these studies, the compliance changed significantly between normal, OME, and Valsalva groups. The width ratio changed significantly between normal and Valsalva groups, but no significant change could be observed between normal and OME groups. In order to demonstrate the potential use of these ratios, the data from 14 ears (the two ears from the subject complaining of “fullness” above were omitted) were classified using linear discriminant analysis. Figure 7b shows the classification results, where the three classes healthy, fluid, and Valsalva, are shown in red, green, and blue, respectively. The classification results are well-separated, with a re-substitution error rate of 9.1 %. Table 1 summarizes the data used in this study.
TABLE 1.
Quantitative metric data from 14 ears
| Compliance (μm/mmHg) | Width ratio | ||||
|---|---|---|---|---|---|
| Healthy | Fluid | Valsalva | Healthy | Fluid | Valsalva |
| 4.9 | 1.7 | 9.3 | 2.3 | 2.2 | 0.6 |
| 5.9 | 1.1 | 16.4 | 2.1 | 4.4 | 0.8 |
| 5.3 | 1.2 | 17.1 | 2.0 | 1.3 | 1.0 |
| 5.0 | 1.7 | 10.3 | 3.5 | 2.5 | 3.0 |
| 3.4 | 14.0 | 3.0 | 0.9 | ||
| 6.4 | 33.3 | 2.9 | 0.9 | ||
| 15.1 | 18.3 | 2.6 | 0.4 | ||
| 4.2 | 24.3 | 2.2 | 1.9 | ||
| 6.1 | 2.4 | ||||
| 4.3 | 2.8 | ||||
In this analysis, a Kruskal-Wallis H test was used to determine whether statistical differences existed between healthy, fluid, and Valsalva groups. The Kruskal-Wallis H test is used when neither of the variables in the test are interval, which is the case in this comparison. In the case of both compliance (H(3,22) = 16.71, p < 0.05) and width ratio (H(3,22) = 8.90, p < 0.05), the null hypothesis was rejected, suggesting that a significant difference existed between at least two groups. In order to identify differences between the groups, a two-tailed Mann-Whitney’s U test was performed as a post-hoc test. In order to compensate for inflation in type I error, the Bonferroni method was used to estimate critical values of the U statistic, reported at α = 0.01. Based on results of the post-hoc test, a statistically significant difference in the compliance was found between all groups, and a statistically significant difference in the width ratio was found only between healthy and Valsalva groups. Table 2 summarizes the results of these comparison tests.
TABLE 2.
Group comparison statistics
| Compliance (μm/mmHg) | Width ratio | ||||
|---|---|---|---|---|---|
| H-statistic = 16.71 | H-critical = 5.74 | H-statistic = 8.90 | H-critical = 5.74 | ||
| Group comparison | U-statistic | U-critical | Group comparison | U-statistic | U-critical |
| Healthy fluid | 0 | 2 | Healthy fluid | 17.5 | 2 |
| Fluid Valsalva | 0 | 1 | Fluid Valsalva | 8.5 | 1 |
| Healthy Valsalva | 3 | 11 | Healthy Valsalva | 4 | 11 |
DISCUSSION
In this manuscript, we have introduced a new technique for assessing biomechanical compliance of the TM. By integrating LCI with a standard pneumatic otoscope, we were able to quantify the displacements and motion of the TM due to a pneumatic stimulus. This advance leads to objective metrics that may be standardized for more robust analysis and better understanding of the effects of otitis media on the TM. It is important to recognize and discuss salient topics surrounding the technique, as well as potential limitations of the technique.
Discussion of Presented Results
Quantification of metrics such as the compliance and width ratio has shown in this study to be a good method for differentiating cases of normal and fluid-filled ears. Additionally, the technique has provided interesting results when comparing normal ears with ears experiencing the Valsalva maneuver.
The compliance is a quantitative metric for parameters that are already evaluated (subjectively) in pneumatic otoscopy: displacements and motion of the TM after pressure modulation. This is a simple metric of TM displacement measured per unit pressure. As expected, cases with fluid had a much smaller compliance than in normal cases. This is due to the immobility of the TM in these pathological cases. Future studies will build a database to leverage the quantitative nature of the compliance to classify ears scanned with this technique.
The width ratio is a new quantitative metric that measures how quickly the TM responds to an impulse pressure stimulus. This metric has shown to differ greatly between normal ears and ears undergoing the Valsalva maneuver. However, no statistical difference was found between normal ears and fluid-filled ears. This is not surprising, as the temporal response of the TM to a pressure stimulus may not vary much between a normal and fluid-filled ear. It is intuitive that the compliance would change as a result of middle ear fluid, but it is not obvious that the width ratio should be affected as well.
The results from the Valsalva maneuver study are interesting, as performing the Valsalva maneuver results in significant changes in both the compliance and the width ratio when compared to normal ears at rest. We hypothesize that when the Valsalva maneuver is performed—opening the Eustachian tube—the TM is moved into a location that changes its natural response characteristics. The measured displacement of the TM when the Valsalva maneuver is performed (absent of any additional pressure stimulus) is around 200–400 μm from the rest position. This movement effectively “biases” the TM to a location lateral to its resting position. This bias provides a larger travel range in the medial direction, which results in a greater displacement. Additionally, since the Valsalva maneuver was held, the constant pressure applied from the middle ear due to the Valsalva maneuver results in a constant outward force due to slight increased pressure in the middle ear. This constant force results in a faster response after a positive pressure stimulus is applied from the ear canal.
It should also be noted that due to the natural pitch of the eardrum with respect to the ear canal, displacement of the drum results in a lateral shift of the LCI beam on the drum. This shift can range between 0 to ~500 μm, depending on angle of the drum in the canal and magnitude of the pneumatic displacement. In most cases, it is not expected that these shifts would change the displacement values measured by the technique. Certainly in the area of the light reflex, where this study was focused, a shift of this small magnitude would not affect the results. In future studies, displacements will be kept low to minimize this effect to less than 50 μm.
Advantage of Quantifiable Metrics
In this study, an emphasis was placed on quantifiable information. Quantification enables objective measurements and standardization, which provides more robust data. It is expected that by quantifying the information commonly assessed using pneumatic otoscopy, a better understanding of the effects of otitis media on the membrane may be achieved. While standard pneumatic otoscopy is considered the gold standard for determining pressure in the middle ear, it is still a highly subjective exam. As such, its repeatability and interpretation across multiple users is limited.
Future studies will seek to build a database of quantifiable metrics, such as the compliance and width ratio alongside current techniques, including pneumatic otoscopy, tympanometry, and acoustic reflectometry. A database of such values will provide an important reference by which to evaluate the new data provided by this technique, and other techniques. Of particular interest will be a better understanding of the local variances in biomechanical properties of the TM in pathological cases. The technique proposed in this manuscript is the only technique thus far (to the authors’ knowledge) that is capable of in vivo assessment of biomechanical properties of the TM as a function of location on the membrane. This may enable a new understanding of the pathological mechanisms in otitis media and its effect on the mechanical properties of the TM. It is important to note that an effort was made to keep all pressure stimuli similar between subjects in these experiments. Since the pressure stimulus still had a manual component, it was difficult to keep a tight tolerance. Average pressure for healthy cases was 30.6 ± 10.0 mmHg. Average pressure for Valsalva cases was 25.4 ± 8.2 mmHg. Average pressure for fluid cases was 37.5 ± 10.7 mmHg. While it is expected that these values are approaching the pressure at which non-linearity in the TM response is expected, this effect would not account for the 4× decrease in compliance we see in fluid cases, when compared to normal cases. In future work, stimuli will be automated to ensure tighter tolerance and increased repeatability. Additionally, a pressure feedback system could be implemented to ensure the stimulus remains in a prescribed region.
Alternative Techniques
While pneumatic otoscopy is the most commonly used technique for assessing the presence of middle ear fluid, other techniques are also employed. As mentioned previously, tympanometry and acoustic reflectometry both provide quantitative metrics that correspond to a probability of middle ear fluid. It will be important in future work to compare the results of pneumatic LCI with the corresponding results from these techniques. One limitation of this study is that the authors could find no peer-reviewed study measuring displacement of the eardrum in standard pneumatic otoscopy, in vivo. The displacements we have measured in this study range from 10–500 μm, which are consistent with previous literature measuring displacement of the umbo (Murakami, et al. 1997) and TM (Dirckx and Decraemer 1991) at static pressures in cadaver ears. Additionally, while there are many studies using vibrometry to measure displacements due to sound stimuli, these displacements are on the order of 10–10,000 nm and less relevant for comparison.
Current alternative techniques, such as tympanometry and pneumatic otoscopy, do not directly measure fluid. Instead, they measure the sound and pressure response of the eardrum, which is believed to be correlated to fluid presence. Pneumatic LCI aims to provide more comprehensive information about middle ear disease. In this study, pneumatic LCI was also relying on a correlation between the pressure response of the eardrum and the presence of fluid. However, in future studies, combining quantitative pneumatic metrics such as the compliance and the width ratio with other structural metrics such as TM thickness and characteristics of effusions and biofilms may prove to provide significant benefit for a better understanding of middle ear disease. Additionally, as indicated above, pneumatic LCI has the unique benefit of generating spatially resolved information. The TM displacements were collected from a single point on the TM, restricted to an area of ~400 μm2. This will enable identification of localized weak spots (high compliance) in the TM, such as monolayers from previous perforations or tympanostomy tubes, or localized stiff spots (low compliance), such as from regions of fibrosis or scarring. Future studies will investigate the additional benefit of this spatial localization.
Motion Artifact
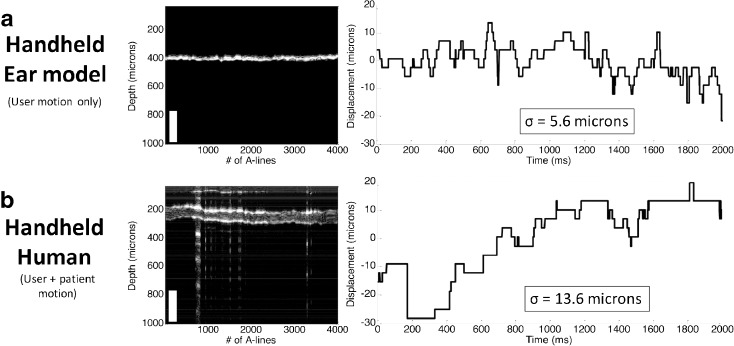
Since the pneumatic LCI technique is capable of measuring displacements on the order of ~10 μm, a discussion on motion artifact is warranted. While motion (either patient or user motion) could affect the collected displacement data, we have made significant efforts to mitigate this issue. The most important factor in mitigating motion artifact is reducing the time of data acquisition. Currently, the duration of peak displacement used to calculate the compliance is collected within 50 ms of the application of pressure. This is fast enough to negate the effects of any motion from the user or patient. For the width ratio, the collection time is typically longer, in the range of 150–400 ms. Over this duration it becomes more important for the patient and user to remain still. Experiments were performed to characterize the amount of motion expected from a user holding the handheld device, as well as from a cooperative patient old enough to comply with a request to be still. Figure 8 shows the results of the experiments, where the displacement of the TM resulting from the undesirable motion is plotted against the acquisition time of 4 s. Figure 8a shows the motion artifact from user motion only. For this experiment, the user imaged the eardrum of the Life/form ear model and the standard deviation of the motion over 4 s was 5.6 μm, which corresponds to the axial resolution of the system. Figure 8b shows the motion artifact from use of the device on a compliant subject. Unwanted motion in this case is larger than the ear model case, at 13.6 μm. However, even with additional movement from this live subject, the motion artifact is still small enough to ensure that the motion will not affect the measurements from the pneumatic LCI device. This pilot study was conducted in adults to prove the concept before moving on to the pediatric population. We realize that very young patients who cannot comply with a request to be still will introduce more motion, which may be problematic for measurement of the width ratio. However, it is worth noting that the entire data capture time for this technique is less than 300 ms, so it is not particularly sensitive to motion artifact. Future studies will investigate this issue in the pediatric population, as well as new algorithms that can assist in the correction and removal of any patient-induced motion artifacts from the acquired data. Additionally, in future work, more robust studies will be done on user and patient motion to validate whether the results of this initial motion study hold true for a larger user and patient pool.
FIG. 8.
Stability assessment. a Motion stability analysis for LCI measurements from an ear model phantom over 2 s, illustrating the effect of user motion. An M-scan (left) and resulting displacement plot (right) are shown, with a measured standard deviation of displacement of 5.6 μm. b Similar analysis for LCI measurements from a human adult in vivo, showing a measured displacement of 13.6 μm. This measurement accounts for both user and patient motion in the case of a cooperative adult.
We believe this technique has provided some interesting scientific findings that raise additional questions to be pursued in future studies. For instance, we hypothesize that a held Valsalva maneuver places the drum in a position more capable of rapid displacement. This is supported by the drastic changes in both compliance and width ratio when comparing normal and Valsalva cases. Future studies will investigate the use of this technique to gain a better understanding of the biomechanics of different parts of the eardrum, such as the pars tensa vs. the pars flaccida, where differences in biomechanics would be expected. The noninvasive and highly sensitive nature of this technique provides a unique opportunity to explore these biomechanics in both in vivo models and human subjects for the first time.
Acknowledgements
The authors thank Darold Spillman from the Beckman Institute for the helpful discussions, Deveine Toney from the Carle Research office for the study coordination, nursing staff from the otolaryngology department at Carle Foundation Hospital for the clinical support, and Eric Chaney from the Beckman Institute for the IRB support. This work was supported by a Bioengineering Research Partnership grant (R01 EB013723) from the NIH/NIBIB, the National Science Foundation (CBET 14-45111), as well as a grant from the University of Illinois Proof-of-Concept Fund.
Compliance with Ethical Standards
Conflict of Interest
R.L.S., R.M.N, and S.A.B. have a financial interest in PhotoniCare, Inc., a company commercializing technology related to this manuscript. PhotoniCare did not, however, sponsor this research.
Subjects for this study were recruited and enrolled under a protocol approved by the Institutional Review Boards (IRB) of the University of Illinois at Urbana-Champaign and Carle Foundation Hospital in Urbana, IL. Patients were recruited and imaged in the otolaryngology clinic at Carle Foundation Hospital, Urbana, Illinois.
Contributor Information
Ryan L . Shelton, Email: shelton8r@gmail.com
Ryan M. Nolan, Email: ryan.m.nolan30@gmail.com
Guillermo L. Monroy, Email: gmonroy2@illinois.edu
Paritosh Pande, Email: pande@illinois.edu.
Michael A. Novak, Email: Michael.novak@carle.com
Ryan G. Porter, Email: Ryan.porter@carle.com
Stephen A. Boppart, Phone: (217) 244-7479, Email: boppart@illinois.edu
References
- American Speech-Language-Hearing Association, Causes of Hearing Loss in Children. American Speech-Language-Hearing Association, http://www.asha.org/public/hearing/Causes-of-Hearing-Loss-in-Children/. Accessed 16 September 2015
- Armstrong WB, Ridgway JM, Vokes DE, Guo S, Perez J, Jackson RP, Gu M, Su J, Crumley RL, Shibuya TY, Mahmood U, Chen Z, Wong BJ. Optical coherence tomography of laryngeal cancer. Laryngoscope. 2006;116:1107–1113. doi: 10.1097/01.mlg.0000217539.27432.5a. [DOI] [PubMed] [Google Scholar]
- Cense B, Nassif NA, Chen TC, Pierce MC, Yun SH, Park BH, Bouma BE, Tearney GJ, de Boer JF. Ultrahigh-resolution high-speed retinal imaging using spectral-domain optical coherence tomography. Opt Express. 2004;12:2435–2447. doi: 10.1364/OPEX.12.002435. [DOI] [PubMed] [Google Scholar]
- Costa RA, Skaf M, Melo LAS, Calucci D, Cardillo JA, Castro JC, Huang D, Wojtkowski M (2006) Retinal assessment using optical coherence tomography. Prof Retinal Eye Res 25:325–353 [DOI] [PubMed]
- Dirckx JJ, Decraemer WF (1991) Human tympanic membrane deformation under static pressure. Hear Res 51:93–106 [DOI] [PubMed]
- Djalilian HR, Rubinstein M, Wu EC, Naemi K, Zardouz S, Karimi K, Wong BJ. Optical coherence tomography of cholesteatoma. Otol Neurotol. 2010;31:932–935. doi: 10.1097/MAO.0b013e3181e711b8. [DOI] [PMC free article] [PubMed] [Google Scholar]
- Erickson-Bhatt SJ, Nolan RM, Shemonski ND, Adie SG, Putney J et al (2015) Real-time imaging of the resection bed using a handheld probe to reduce incidence of microscopic positive margins in cancer surgery. Cancer Res 75(18):3706–3712 [DOI] [PMC free article] [PubMed]
- Gao SS, Xia A, Yuan T, Raphael PD, Shelton RL, Applegate BE, Oghalai JS. Quantitative imaging of cochlear soft tissues in wild-type and hearing-impaired transgenic mice by spectral domain optical coherence tomography. Opt Express. 2011;19:15415–15428. doi: 10.1364/OE.19.015415. [DOI] [PMC free article] [PubMed] [Google Scholar]
- Huang D, Swanson EA, Lin CP, Schuman JS, Stinson WG, Chang W, Hee MR, Flotte T, Gregory K, Puliafito CA, Fujimoto JG. Optical coherence tomography. Science. 1991;254:1178–1181. doi: 10.1126/science.1957169. [DOI] [PMC free article] [PubMed] [Google Scholar]
- Hubler Z, Shemonski ND, Shelton RL, Monroy GL, Nolan RM, Boppart SA (2015) Real-time automated thickness measurement of the in vivo human tympanic membrane using optical coherence tomography. Quant Imag Med Surg 5(1):69–77. doi:10.3978/j.issn.2223-4292 [DOI] [PMC free article] [PubMed]
- Jones WS, Kaleida PH. How helpful is pneumatic otoscopy in improving diagnostic accuracy? Pediatrics. 2003;112(3):510–513. doi: 10.1542/peds.112.3.510. [DOI] [PubMed] [Google Scholar]
- Lieberthal AS, Carroll AE, Chonmaitree T, Ganiats TG, Hoberman A, Jackson MA, et al. The diagnosis and management of acute otitis media. Pediatrics. 2013;131:964–999. doi: 10.1542/peds.2012-3488. [DOI] [PubMed] [Google Scholar]
- Lim VY, Buellesfeld L, Grube E. Images in cardiology. Optical coherence tomography imaging of thrombus protrusion through stent struts after stenting in acute coronary syndrome. Heart. 2006;92:409. doi: 10.1136/hrt.2005.069252. [DOI] [PMC free article] [PubMed] [Google Scholar]
- Linsk R, Blackwood A, Cooke J, Harrison V, Lesperance M, Hildebrandt HM (2013) University of Michigan Health System Otitis Media Guideline for Clinical Care. UMHS Otitis Media Guideline, http://www.med.umich.edu/1info/FHP/practiceguides/om/OM.pdf. Accessed 16 September 2015
- Monroy GL, Shelton RL, Nolan RM, Nguyen CT, Novak MA, McCormick DT, Boppart SA. Noninvasive depth-resolved optical measurements of the tympanic membrane and middle ear for differentiating otitis media. Laryngoscope. 2015;125(8):E276–E282. doi: 10.1002/lary.25141. [DOI] [PMC free article] [PubMed] [Google Scholar]
- Monroy GL, Pande P, Shelton RL, Nolan RM, Spillman DR, Porter RG, Novak MA, Boppart SA (2016) Non-invasive optical assessment of viscosity of middle ear effusions in otitis media. J Biophotonics 10:394–403. doi: 10.1002/jbio.201500313. [DOI] [PMC free article] [PubMed]
- Muderris T, Yazici A, Bercin S, Yalciner G, Sevil E, Kiris M. Consumer acoustic reflectometry: accuracy in diagnosis of otitis media with effusion in children. Int J Pediatric Otorhinolaryngology. 2013;77(10):1771–1774. doi: 10.1016/j.ijporl.2013.08.019. [DOI] [PubMed] [Google Scholar]
- Murakami S, Gyo K, Goode RL. Effect of middle ear pressure change on middle ear mechanics. Acta Otolaryngol. 1997;117(3):390–395. doi: 10.3109/00016489709113411. [DOI] [PubMed] [Google Scholar]
- Neerken S, Lucassen GW, Bisschop MA, Lenderink E, Nuijs TA (2004) Characterization of age-related effects in human skin: a comparative study that applies confocal laser scanning microscopy and optical coherence tomography. J Biomed Opt 9:274–281 [DOI] [PubMed]
- New York Times. (2012) Otitis Media With Effusion In-Depth Report. http://www.nytimes.com/health/guides/disease/otitis-media-with-effusion/print.html Accessed 16 September 2015
- Nguyen CT, Tu H, Chaney EJ, Stewart CN, Boppart SA (2010) Non-invasive optical interferometry for the assessment of biofilm growth in the middle ear. Biomed Opt Express 1:1104–1116 [DOI] [PMC free article] [PubMed]
- Nguyen CT, Jung W, Kim J, Chaney EJ, Novak M, Stewart CN, Boppart SA (2012) Noninvasive in vivo optical detection of biofilm in the human middle ear. Proc Natl Acad Sci USA 109:9529–9534 [DOI] [PMC free article] [PubMed]
- Pitris C, Saunders KT, Fujimoto JG, Brezinski ME. High-resolution imaging of the middle ear with optical coherence tomography: a feasibility study. Arch Otolaryngol Head Neck Surg. 2001;127:637–642. doi: 10.1001/archotol.127.6.637. [DOI] [PubMed] [Google Scholar]
- Shekelle P, Takata G, Chan LS, Mangione-Smith R, Corley PM, Morphew T, Morton S. (2003) Diagnosis, Natural History, and Late Effects of Otitis Media with Effusion: Summary. Evidence Report/Technology Assessment No. 55, AHRQ Publication No. 03-E023. [DOI] [PMC free article] [PubMed]
- Shelton RL, Jung W, Sayegh SI, McCormick DT, Kim J, Boppart SA. Optical coherence tomography for advanced screening in the primary care office. J Biophotonics. 2014;7:525–533. doi: 10.1002/jbio.201200243. [DOI] [PMC free article] [PubMed] [Google Scholar]
- Subhash HM, Nguyen-Huynh A, Wang RK, Jacques SL, Choudhury N, Nuttall AL (2012) Feasibility of spectral-domain phase-sensitive optical coherence tomography for middle ear vibrometry. J Biomed Opt 17:060505 [DOI] [PMC free article] [PubMed]
- Takata GS, Chan LS, Morphew T, Mangione-Smith R, Morton SC, Shekelle P. Evidence assessment of the accuracy of methods of diagnosing middle ear effusion in children with otitis media with effusion. Pediatrics. 2003;112(6 Pt 1):1379–1387. doi: 10.1542/peds.112.6.1379. [DOI] [PubMed] [Google Scholar]


