

Abstract
Purpose
To use features extracted from magnetic resonance (MR) images and a machine-learning method to assist in differentiating breast cancer molecular subtypes.
Materials and Methods
This retrospective Health Insurance Portability and Accountability Act (HIPAA)-compliant study received Institutional Review Board (IRB) approval. We identified 178 breast cancer patients between 2006–2011 with: 1) ERPR + (n = 95, 53.4%), ERPR−/HER2 + (n = 35, 19.6%), or triple negative (TN, n = 48, 27.0%) invasive ductal carcinoma (IDC), and 2) preoperative breast MRI at 1.5T or 3.0T. Shape, texture, and histogram-based features were extracted from each tumor contoured on pre- and three postcontrast MR images using in-house software. Clinical and pathologic features were also collected. Machine-learning-based (support vector machines) models were used to identify significant imaging features and to build models that predict IDC subtype. Leave-one-out cross-validation (LOOCV) was used to avoid model overfitting. Statistical significance was determined using the Kruskal–Wallis test.
Results
Each support vector machine fit in the LOOCV process generated a model with varying features. Eleven out of the top 20 ranked features were significantly different between IDC subtypes with P < 0.05. When the top nine pathologic and imaging features were incorporated, the predictive model distinguished IDC subtypes with an overall accuracy on LOOCV of 83.4%. The combined pathologic and imaging model's accuracy for each subtype was 89.2% (ERPR+), 63.6% (ERPR−/HER2+), and 82.5% (TN). When only the top nine imaging features were incorporated, the predictive model distinguished IDC subtypes with an overall accuracy on LOOCV of 71.2%. The combined pathologic and imaging model's accuracy for each subtype was 69.9% (ERPR+), 62.9% (ERPR−/HER2+), and 81.0% (TN).
Conclusion
We developed a machine-learning-based predictive model using features extracted from MRI that can distinguish IDC subtypes with significant predictive power.
Breast cancer molecular subtypes, based on genotype variation, are indicators of disease-free and overall survival.1 Full breast cancer genetic analysis is currently not routinely done due to cost. Estrogen receptor (ER), progesterone receptor (PR), and HER2/neu receptor (HER2) status are immunohistochemical surrogate biomarkers of these subtypes, which are prognostic and may guide targeted therapy.2 Radiomics, the extraction and analysis of quantitative imaging features, enables imaging phenotypes to be correlated with genetic information.3 This mineable data can be used to build models, which could potentially classify breast cancer subtypes on magnetic resonance imaging (MRI).
MRI is the most sensitive imaging modality for breast cancer detection and is indicated preoperatively to define extent of disease. Besides a size measurement, clinical radiologists report only qualitative and semiquantitative characteristics of breast cancers based on the American College of Radiology Breast Imaging Reporting and Data System (BI-RADS) descriptors.4,5 Breast cancer subtypes have been described on MRI using the BI-RADS lexicon. For example, Uematsu et al6 described triple-negative breast cancer on MRI and Youk et al compared triple-negative cancers to both ER+HER2- and HER2+.7 Quantitative data often employ the average intensity from a region of interest (ROI), but fail to account for heterogeneity within this region which may provide useful clinical information.
Computer software can perform quantitative image feature analysis, which characterizes such things as tumor morphology, texture, and enhancement kinetics.8 Radiomic phenotypes extracted from breast MRI are being investigated as possible biomarkers. Previous breast cancer computer applications include the differentiation of: benign from malignant masses; ductal carcinoma in situ from invasive cancer; and ductal from lobular breast cancer.9–12 Radiomic phenotypes of breast cancer, extracted from The Cancer Genome Atlas and The Cancer Image Archive, have been shown to be associated with tumor T stage, overall stage, status of progesterone and estrogen receptors, and pathological stages. Several recent reports have focused on breast cancer subtype. Agner et al used quantitative feature extraction to characterize triple-negative cancers.13 Mazurowski et al correlated imaging features and molecular subtype and found enhancement characteristics associated with the luminal B subtype.14 Studies to date have found unique imaging features for certain breast cancer molecular subtypes but, to our knowledge, no predictive models have differentiated them within a given cohort. The purpose of our study was to use features extracted from MRI and a machine-learning method to determine if imaging characteristics could assist in differentiating breast cancer molecular subtypes.
Materials and Methods
Our Institutional Review Board approved this Health Insurance Portability and Accountability Act-compliant retrospective study and the need for informed patient consent was waived.
Patient Cohort
Between 2006–2011, we retrospectively identified breast cancer patients with: 1) pathologically proven invasive ductal carcinoma (IDC) with known ER, PR, and HER2/neu receptor status; 2) preoperative bilateral breast MRI; 3) no prior history of cancer; 4) no known BRCA mutation; and 5) no current use of hormonal therapy. MRI examinations were ordered for either: i) BRCA negative high-risk (>20% lifetime risk) breast cancer screening or ii) preoperative evaluation to define extent of disease in newly diagnosed breast cancer. In all, 178 women met the inclusion criteria with each providing imaging data for a single tumor.
MR Image Acquisition
All images were acquired with a 1.5T (n = 127; 71.3%) or 3.0T (n = 51; 28.7%) MRI system (Signa or Signa HDX; GE Medical Systems, Waukesha, WI). In all patients, a dedicated eight surface breast coil was used. Sagittal T1-weighted fat-suppressed 2D multi-slice acquisitions were acquired before and continuously three times after the intravenous administration of 0.1 mmol gadopentetate dimeglumine per kilogram body weight (Magnevist; Berlex Laboratories/Bayer Health Care Pharmaceuticals, Montville, NJ) at a rate of 2 ml/sec with an automatic injector (Medrad, Warrendale, PA) and a 20-second scan delay using the following parameters at 1.5T: repetition time (TR, msec) / echo time (TE, msec), 7.4/4.2; flip angle, 10°; acquisition matrix, 256 × 192; slice thickness, 3 mm; and temporal resolution, ∼90 seconds. The parameters at 3.0Twere the same except for the TR/TE, 5.9/2.2.
Computer-Based Image Analysis
The tumors were identified and contoured by a radiologist on a single central slice from the first postcontrast fat-suppressed T1-weighted MR image sequence. Next, image features were extracted from the contoured central tumor single slice on the pre- and three postcontrast sagittal fat-suppressed T1-weighted MR sequences. Thus, information was extracted from a single slice of the tumor as contoured on the fat-suppressed T1-weighted pre- and three postcontrast images.
Two radiologists (E.J.S. with 3 years and E.A.M. with 19 years experience reading breast MRI) interpreted the breast MRI data in consensus blinded to all protected health information including breast cancer subtype. The dataset was interpreted in random order. One radiologist (E.J.S.) contoured the tumor boundary on a single central slice of the first fat-suppressed T1-weighted postcontrast scan that was used as the region of interest (ROI) and mask for extracting the various image-based features on all sequences. Tumors were contoured on the fat-suppressed T1-weighted pre- and three postcontrast images. The second radiologist (E.A.M.) reviewed all tumor ROIs prior to feature extraction. We integrated routines to derive image features into our in-house, open-source software system (Computational Environment for Radiotherapy Research) including morphological, histogram-based first-order, and gray level co-occurrence matrix (GLCM) based second-order texture features. Morphological features included: 1: eccentricity; 2: Euler number; 3: solidity; and 4: extent. Histogram-based first-order texture features computed using voxel intensities inside the segmented tumor included: 1: kurtosis; 2: skewness; 3: variance; 4: standard deviation; 5: minimum; and 6: maximum. GLCM features, also referred to as Harlick or second-order texture features, included: 1: energy (or coherence); 2: entropy; 3: contrast; and 4: homogeneity. For more information about image feature extraction, see El Naqa et al15 and for method see Sutton et al.16
In summary, our MRI analysis included four morphologic, six histogram, and four GLCM based features. Morphologic features do not change between MRI sequences and therefore were only calculated once for each tumor, giving a total of four different image features. The 10 histogram-based and GLCM features were computed for each tumor on the four MRI sequences (pre- and three postcontrast images), giving a total of 40 different image features. Combined, there were 44 image features per tumor. Six clinical and pathologic features per tumor were also included: 1: age; 2: menopausal status; 3: pathologic tumor size; 4: histologic grade; 5: nuclear grade; and 6: axillary lymph node status (positive or negative for malignant cells). In total, 50 features were included in the analysis.
Reference Standard
Clinical data collected included age at diagnosis and menopausal status. Pathologic data collected included tumor size, histologic grade, nuclear grade, and axillary lymph node status.
Statistical Modeling
Descriptive statistics were used to summarize clinical, imaging, and pathologic parameters. Frequencies and corresponding percentages were used for categorical variables and means, and ranges and standard deviations were used for continuous variables. Age was calculated at the time of breast cancer diagnosis.
Support Vector Machines
Support vector machines (SVM) are supervised learning models that analyze actual data points and recognize patterns, which are used for classification analysis. We favored multiclass SVM for this analysis because this method's aim is to flexibly perform multiclass classification by casting it into a single problem.17
To ensure an unbiased assessment of the SVM performance, we utilized a leave-one-out cross-validation (LOOCV) approach. Specifically, at each iteration of the LOOCV process, which is performed over the entire dataset, one sample is reserved for testing and all other samples are used to provide an estimate of the performance of the SVM classifier/model. In the fitting process of the LOOCV approach, for feature selection and optimization of model parameters, the ratio of between-group to within-group sums of squares (BW-ratio) test was used with the following formula:
| (1) |
where I(·) is the indicator function, and x̄·j and x̄cj are the average values of feature j across all samples and across samples in class c, respectively. A greater BW-ratio indicates that the feature is more relevant to the class separation and hence classification model. Therefore, the BW-ratio determined the ranking of the top 20 features. At each iteration of the LOOCV process, using the rank-order based on the BW-ratios, SVM classifiers were constructed with a varying number of top-ranked features (top 1, 2, 3, and so forth up to 20). After each LOOCV loop over all patients, we computed the accuracy, which indicates the fraction of samples that were correctly classified.
Statistical Analysis of Features Selected
Each SVM fit in the LOOCV process generated a model with varying features. The Kruskal–Wallis test was used to test the statistical significance, defined as P < 0.05, of features selected, for the three breast cancer molecular subtypes. The Wilcoxon rank-sum test was used to compare the following two related samples: 1) ERPR + versus triple negative (TN), 2) ERPR + versus ERPR−/HER2+, and 3) TN versus ERPR−/HER2 + subtypes. All analyses were performed using MatLab software (v. 7.14., MathWorks, Natick, MA).
Results
In all, 178 patients with IDC and preoperative breast MRI were included in the study sample with a mean age of 50.8 years (range: 28–76 years) (Table 1). Immunochemical surrogates defined breast cancer molecular subtypes, and the distribution was: 1) 95 (53.4%) ERPR + (luminal-like); 2) 35 (19.6%) ERPR−/HER2 + (HER2 overexpressing); and 3) 48 (27.0%) TN (basal-like). Figure 1 demonstrates representative images of each IDC molecular subtype. Multicentric disease was identified in: 17/95 (17.9%) ERPR + cancers; 23/35; (65.7%) ERPR−/HER2 + cancers; and 4/48 (8.3%) TN cancers. Tumors were imaged on either a 1.5T (n = 127, 71.3%) or 3.0T (n = 51, 28.7%) MRI.
Table 1. Patient, Invasive Ductal Breast Cancer Subtype, and MRI Characteristics.
| Characteristics | ERPR+ | ERPR-/HER2+ | Triple negative |
|---|---|---|---|
| N = 95 (53.4) | N = 35 (19.6) | N = 48 (27.0) | |
| Mean agea | 50.9 (28-76) | 49.6 (33-75) | 51.9 (33-71) |
| Diameter (cm)b | 1.39 (SD 0.59) | 2.33 (SD 1.92) | 1.80 (SD 0.91) |
| Menopausal | |||
| Pre | 62 (65.3) | 24 (68.6) | 17 (35.4) |
| Post | 33 (34.7) | 11 (31.4) | 31 (64.6) |
| Lymph Node Status | |||
| Negative | 87 (91.6) | 19 (54.3) | 35 (72.9) |
| Positive | 8 (8.4) | 16 (45.7) | 13 (27.1) |
| MRI | |||
| 1.5-T | 47 (49.5) | 32 (91.4) | 48 (100.0) |
| 3.0-T | 48 (50.5) | 3 (8.6) | 0 (0.0) |
Numbers in parentheses represent percent for categorical variables unless otherwise indicated.
Numbers in parentheses represent range.
Numbers in parentheses represent the standard deviation (SD).
Figure 1.
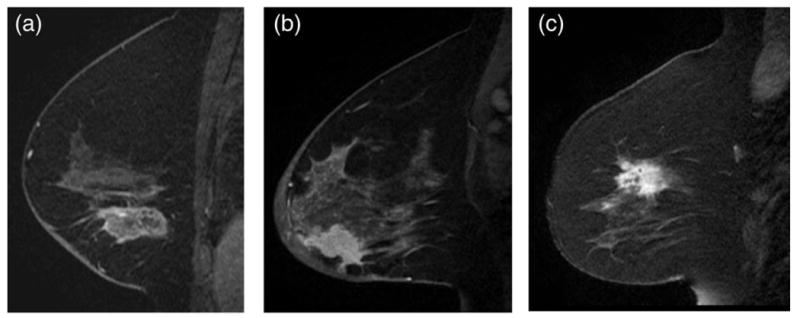
Our machine-learning-based predictive model using image features extracted from MRI can distinguish IDC subtypes based on some image features that are imperceptible to the eye. A: Sagittal T1-weighted fat-suppressed postcontrast MRI of an ERPR+invasive ductal carcinoma. B: Sagittal T1-weighted fat-suppressed postcontrast MRI of an ERPR−/HER2 + invasive ductal carcinoma. C: Sagittal T1-weighted fat-suppressed postcontrast MRI of a triple negative invasive ductal carcinoma.
We assessed the importance of each feature by determining how many times it belonged to the SVM classifiers achieving the highest accuracy with a varying number of top-ranked features (top 1, 2, 3, and so forth up to 20). Based on the frequency of occurrence, we obtained a final ranking of features as shown in Table 2. We assumed that feature importance was captured by its frequency of appearing in the best models during the LOOCV process. The top 20 ranked features comprised a combination of imaging (n = 17) and pathologic (n = 3) features. The top three ranked features were: 1: nuclear grade; 2: skewness in the second postcontrast image (postcontrast 2); and 3: skewness in the first postcontrast image (postcontrast 1). Nuclear grade varied by IDC subtype. For example, IDC with nuclear grade 3 was identified in: 20/95 (21.1%) ERPR + cancers; 31/35 (88.6%) ERPR−/HER2 + cancers; and 43/48 (89.6%) TN cancers. Statistical analysis was performed using the Kruskal–Wallis test to investigate if features were significantly different among the three IDC subtypes, as shown in Table 2. For 11 out of the top 20 ranked features, there was a statistically significant difference between IDC subtypes for the Kruskal–Wallis test with Bonferroni-corrected P < 0.05. Histogram-based features and shape-based features were ranked higher than texture features. The Wilcoxon rank sum test was performed between two subtypes (ERPR + vs. ERPR−/HER2+; ERPR + vs. TN; and ERPR−/HER2+ vs. TN), as shown in Table 2. The Bonferroni correction test was applied for all P-values obtained. No feature showed a statistically significant difference on the Wilcoxon rank sum test in all three, two-way comparisons of IDC subtypes with Bonferroni correction.
Table 2. Statistical Tests For Ranked Features.
| Ranking | Variable | Bonferroni-corrected P | Bonferroni-corrected P ERPR + vs. ERPR−/Her2+ | Bonferroni-corrected P ERPR + vs. TN | Bonferroni-corrected P ERPR−/HER2+ vs. TN |
|---|---|---|---|---|---|
| 1 | Nuclear grade | < 0.0001 | < 0.0001 | < 0.0001 | 1.0000 |
| 2 | Skewness in postcontrast 2 | 0.0004 | 0.0013 | 0.0036 | 1.0000 |
| 3 | Skewness in postcontrast 1 | 0.0001 | 0.0007 | 0.0010 | 1.0000 |
| 4 | Skewness in postcontrast 3 | 0.0004 | 0.0019 | 0.0036 | 1.0000 |
| 5 | Multicentric disease | < 0.0001 | 0.0076 | 1.0000 | < 0.0001 |
| 6 | Solidity | 0.0005 | 0.0006 | 1.0000 | 0.0032 |
| 7 | Histologic grade | 0.0006 | 0.0863 | 0.0023 | 1.0000 |
| 8 | Skewness in precontrast | 0.0653 | 0.1048 | 0.0787 | 1.0000 |
| 9 | Volume | 0.0005 | 0.0002 | 1.0000 | 0.0611 |
| 10 | Kurtosis in postcontrast 1 | 0.4741 | 0.4530 | 0.5841 | 1.0000 |
| 11 | Energy in precontrast | 0.2301 | 0.1278 | 1.0000 | 1.0000 |
| 12 | Menopausal status | 0.0413 | 1.0000 | 0.0995 | 0.0489 |
| 13 | Extent | 0.1173 | 0.1604 | 1.0000 | 0.0657 |
| 14 | Axillary nodes | 0.0495 | 0.0099 | 1.0000 | 1.0000 |
| 15 | Kurtosis in postcontrast 2 | 1.0000 | 1.0000 | 1.0000 | 1.0000 |
| 16 | Entropy in precontrast | 0.6460 | 0.3679 | 1.0000 | 1.0000 |
| 17 | Homogeneity in precontrast | 0.0328 | 0.0162 | 1.0000 | 0.4863 |
| 18 | Kurtosis in postcontrast 3 | 1.0000 | 1.0000 | 1.0000 | 1.0000 |
| 19 | Energy in postcontrast 2 | 1.0000 | 1.0000 | 1.0000 | 0.5650 |
| 20 | Entropy in postcontrast 2 | 1.0000 | 1.0000 | 1.0000 | 1.0000 |
The third column indicates P-values with Kruskal-Wallis test for three subtypes. The fourth through sixth columns indicate P-values with Wilcoxon rank sum test for two subtypes. All P-values were Bonferroni-corrected.
Using all tumors (n = 178) imaged on either 1.5T (n = 127, 71.3%) or 3.0T (n = 51, 28.7%) MRI systems, the best accuracy on LOOCV was obtained using nine features. The predictive model distinguished IDC subtypes with an overall accuracy of 83.4%. The model's accuracy for each subtype was 89.2% (ERPR1), 63.6% (ERPR−/HER2+), and 82.5% (TN), as shown in Fig. 2. The nine features were: nuclear grade, skewness in postcontrast 2, skewness in postcontrast 1, skewness in postcontrast 3, presence of multicentric disease, solidity, histologic grade, skewness in precontrast, and volume. For all nine features there was a statistically significant difference between IDC subtypes for the Kruskal–Wallis test with Bonferroni-corrected P < 0.05. Using only tumors (n = 127) imaged on a 1.5T MRI system, the results were very similar to those obtained when all tumors imaged on either 1.5T or 3T MRI systems were used, but the best accuracy on LOOCV was obtained using 16 features instead of nine. The predictive model distinguished IDC subtypes with an overall accuracy of 81.4%. The model's accuracy for each subtype was 90.5% (ERPR+), 60.0% (ERPR−/HER2+), and 82.5% (TN), as shown in Fig. 3.
Figure 2.
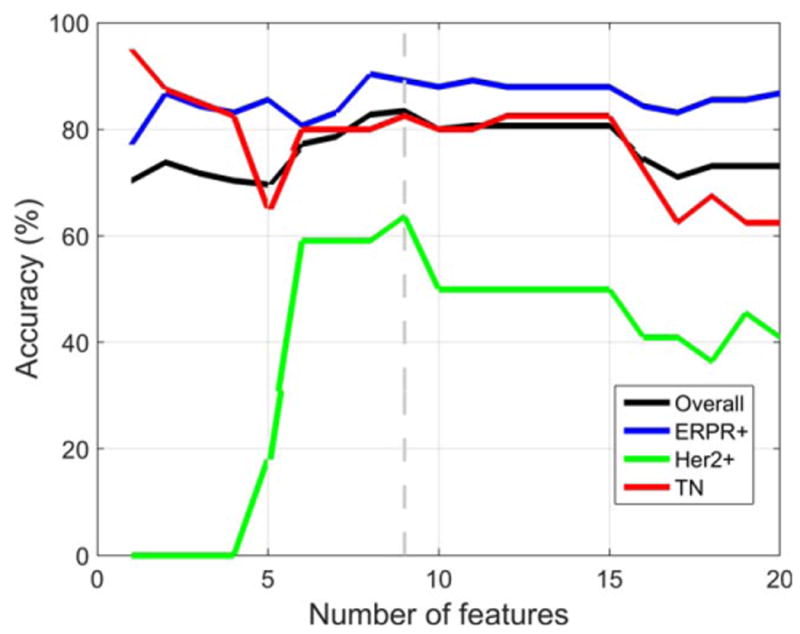
Using MR images performed with 1.5T or 3.0T scanners, classification accuracy when the first top-ranked feature, then the top two features, and so forth up to the top 20 features were used with LOOCV. The best accuracy on LOOCV was obtained using nine pathologic and imaging features. The predictive model distinguished IDC molecular subtypes with an overall accuracy of 83.4%.
Figure 3.
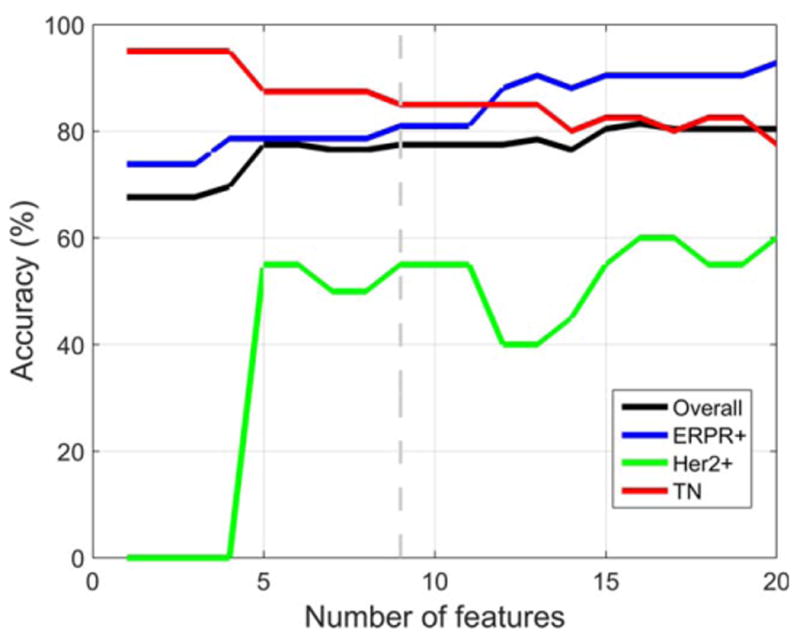
Using only tumors imaged on a 1.5T MRI system, the results were very similar but the best accuracy on LOOCV was obtained using 16 pathologic and imaging features instead of nine. The predictive model distinguished IDC subtypes with an overall accuracy of 81.4%.
We then performed a similar assessment but this time eliminated the pathologic features and exclusively used the top 20 ranked MR imaging features. The top three ranked imaging features were skewness in postcontrast 2, skewness in postcontrast 1, and skewness in postcontrast 3. For seven of the top 20 ranked image features, there was a statistically significant difference between IDC subtypes for the Kruskal– Wallis test with Bonferroni-corrected P < 0.05.
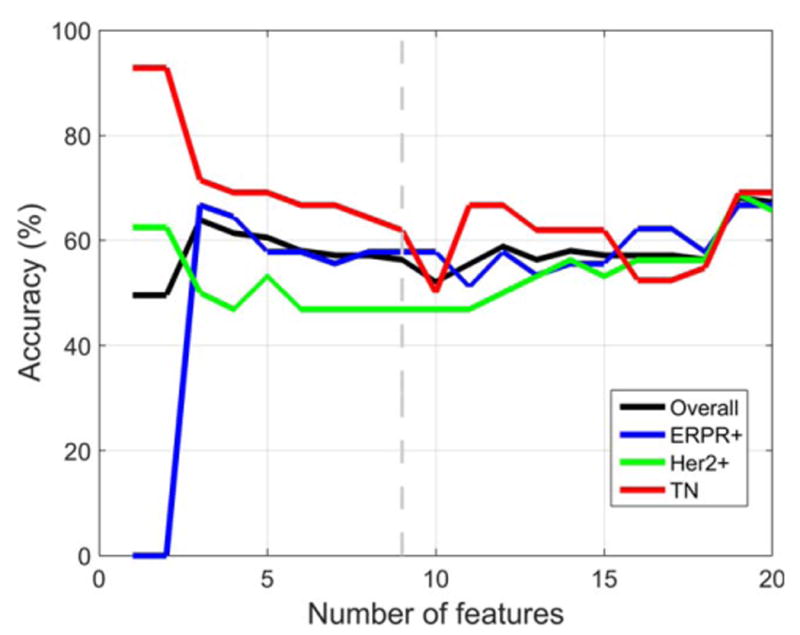
Using all tumors (n = 178) imaged on either 1.5T or 3.0T MRI systems, the best accuracy on LOOCV was obtained using nine image features. The predictive model distinguished IDC subtypes with an overall accuracy of 71.2%. The model's accuracy for each subtype was 69.9% (ERPR+), 62.9% (ERPR−/HER2+), and 81.0% (TN), as shown in Fig. 4. The nine image features were: skewness in postcontrast 2, skewness in postcontrast 1, skewness in postcontrast 3, presence of multicentric disease, solidity, skewness in precontrast volume, kurtosis in postcontrast one, and energy in precontrast. For six of the nine features there was a statistically significant difference between IDC subtypes for the Kruskal–Wallis test with Bonferroni-corrected P < 0.05. Using only tumors (n = 127) imaged on a 1.5T MRI system, the results were very similar to those obtained when all tumors imaged on either 1.5T or 3T MRI systems were used, but the best accuracy on LOOCV was obtained using 19 features instead of nine. The predictive model distinguished IDC subtypes with an overall accuracy of 68.1%. The model's accuracy for each subtype was 66.7% (ERPR+), 68.8% (ERPR−/HER2+), and 69.0% (TN), as shown in Fig. 5.
Figure 4.
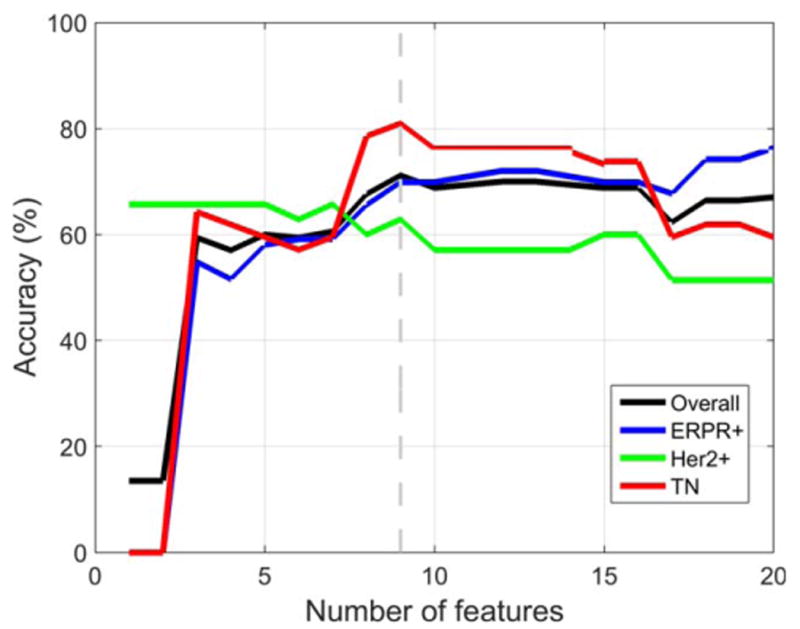
Using only image features obtained at 1.5T or 3.0T, the best accuracy on LOOCV was obtained using nine features. The predictive model distinguished IDC subtypes with an overall accuracy of 71.2%.
Figure 5.
Using only image features obtained at 1.5T, the best accuracy on LOOCV was obtained using 19 image features. The predictive model distinguished IDC subtypes with an overall accuracy of 68.1%.
Discussion
In this study we extracted MR image features of ERPR+, ERPR−/HER2+, and TN breast cancers to determine if they could assist in differentiating the molecular subtype. Our results demonstrate that a machine-learning-based predictive model that incorporated image features extracted from MRI could distinguish IDC subtypes with significant predictive power with an overall accuracy of 71.2%. In brief, an optimal machine-learning-based (SVM) model used nine imaging features, of which six showed a statistically significant difference between the three subtypes. The predictive power of our model increased when nuclear and histologic grades were incorporated as features with an overall accuracy of 83.4%. Skewness was the top-ranked image feature in the SVM classifier during the LOOCV process. Skewness is a measure of heterogeneity, which implicates it as a biomarker of the three IDC subtypes. Since skewness at all three timepoints on postcontrast MR images was significant, this implicates contrast enhancement and pharmacokinetics as a key component in differentiating the subtype. To our knowledge, this is one of the first studies to report quantitative imaging features being combined to predict and classify different breast cancer IDC subtypes. Our classifier relates to immunohistochemical receptor subtypes: ERPR + (luminal type), ERPR−/HER2 + (HER2 overexpressing), and TN (basal type) that are used as surrogate markers of breast cancer genetic subtypes known to be predictive, prognostic, as well as used to guide targeted therapy.
Related studies include the study by Waugh et al,18 who evaluated 220 texture features derived from co-occurrence matrix (COM) of 144 breast cancers (92 IDC, 45 invasive lobular cancers, and seven ductal carcinomas in situ). They found that entropy features were significantly different between histologic subtypes, with a model classification accuracy of 75%. Molecular subtypes were only available in 72 of 144 invasive cancers and although entropy was significantly different, their model classification accuracy was 57.0%.18 Our results are in line with their study in that entropy was the 16 top-ranked feature in our model. In their study, they did not segment and analyze the entire breast cancer, which could explain the difference in our top features. In addition, our study was limited to only invasive ductal subtype. Mazurowski et al evaluated 48 patients from the Cancer Genome Atlas and the Cancer Imaging Archive.14 Computer vision algorithms were applied to extract 23 imaging features, and molecular subtype was determined by genomic analysis. They found an association between luminal B-like subtype and dynamic contrast enhancement features, whereby lesions with a higher ratio of lesion enhancement rate to background parenchymal enhancement rate were more likely to be luminal B subtype (using only eight luminal B-like subtype breast cancers, however). In their study HER2 status was not available for 2/48 patients and equivocal in 15/48 patients. Yamamoto et al reported a preliminary study of radiogenomic analysis of 10 breast cancers on MRI, which identified 21 imaging traits that globally correlated with 71% of the total genes measured in patients with breast cancer. This study demonstrated a novel approach and establishes feasibility, but was statistically underpowered.19 Ashraf et al extracted multiparametric MR imaging phenotypes from 56 women with estrogen receptor-positive breast cancer and correlated features with risk and identified four dominant imaging phenotypes.20 Agner et al13 used computerized image analysis for identifying and differentiating TN breast cancers from other molecular subtypes. They extracted features from 76 breast lesions, of which 21 were TN, and used the most discriminatory features with an SVM classifier to conclude that TN cancers possessed certain characteristic features that could be quantified with CAD. Analyses by Schrading and Kuhl and Noh et al compared BRCA-positive and -negative breast cancers on MRI, but did not find a direct association on imaging with the BRCA mutations.21,22
Multiple other studies have correlated qualitative and semiquantitative MRI features with pathology type. However, there are only a few publications that specifically look at the imaging characteristics of luminal A/B, HER2 + enriched, and basal-like/TN breast cancers in the clinical setting. Uematsu et al, Constantini et al, and Sung et al qualitatively described MRI features of triple-negative breast cancers (TNBCs).6,23,24 Koo et al correlated the perfusion parameters of 70 invasive ductal carcinomas on dynamic contrast-enhanced MRI and concluded that higher K(trans) and K(ep), or lower v(e), had poor prognostic factors and were often of the TN subtype. They did not look at the texture features of the IDC.25 Mukhtar et al evaluated 174 breast cancers and found tumor diameter on MRI postneoadjuvant chemotherapy correlated with surgical pathology most significantly in HER2 + and TNBC.26
Histogram-based first-order textures, GLCM-based second-order textures, and morphology-based features were selected to assess both the internal and external (shape) characteristics of each tumor. The fact that histologic features improved the model's predictive power may be due to our image feature selection, lack of multiparametric parameters, or limited quantification of the tumor surface, given our use of a single central tumor slice. Other works have studied the utility of a variety of texture features including edge-based features, fractals, and variations of GLCM features.
Systematic review and meta-analysis have demonstrated that clinical CAD systems do not influence the sensitivity or specificity of an experienced radiologist.27,28 However, our results suggest that features extracted by the computer, imperceptible to the radiologists eye, may further our understanding of breast cancer molecular subtypes. Technology has allowed MRI to move beyond diagnosis, as shown by ours and other reports of extraction of histogram based features and use of fractal-based methods and/or multiparametric analysis that may offer further insight into a complex heterogeneous disease on a pixel-by-pixel level.29,30 We believe that the radiomic approach may offer further insights into the hypothesis, first raised by the cancer genome atlas network evaluation of molecular portraits of human breast tumors.31
The study had several limitations. The major limitation was that we only evaluated tumor features from a single representative slice and did not perform full 3D volumetric analysis. Single-slice analysis may miss important features because of intratumor heterogeneity and the model's predictive power may be improved by volumetric analysis, a research path we are currently exploring. This dataset only represents the SVM classifier training dataset and the performance power of the proposed model needs to be evaluated with more data in a separate study. This was a retrospective analysis of patients at a single institution. We used immunohistochemical surrogates for breast cancer subtypes instead of performing full genetic sequencing. Finally, it is uncertain if this MRI feature-based predictive model is applicable to variations in machines and imaging protocols at other institutions without further testing. Of note, predictive power would most likely be improved by using the entire lesion shape in 3D, a research path we are currently exploring.
In summary, we have developed a machine-learning-based predictive model using image features extracted from MRI that can distinguish IDC subtypes with significant predictive power. The model's accuracy was increased when pathologic data were incorporated. Computer-derived imaging features of ERPR1(luminal like), ERPR−/HER2 + (HER2 overexpressing), and TN (basal-like) were also significantly different, suggesting that image-based biomarkers may define behavior and determine treatment. Further investigation on larger datasets is necessary to validate this observation.
Acknowledgments
This research was funded in part through the NIH/NCI Cancer Center Support Grant P30 CA008748
References
- 1.Nguyen PL, Taghian AG, Katz MS, Niemierko A, et al. Breast cancer subtype approximated by estrogen receptor, progesterone receptor, and HER-2 is associated with local and distant recurrence after breast-conserving therapy. J Clin Oncol. 2008;26:2373–2378. doi: 10.1200/JCO.2007.14.4287. [DOI] [PubMed] [Google Scholar]
- 2.Natrajan R, Wilkerson P. From integrative genomics to therapeutic targets. Cancer Res. 2013;73:3483–3488. doi: 10.1158/0008-5472.CAN-12-4717. [DOI] [PMC free article] [PubMed] [Google Scholar]
- 3.Boisserie-Lacroix M, Hurtevent-Labrot G, Ferron S, Lippa N, Bonnefoi H, Mac Grogan G. Correlation between imaging and molecular classification of breast cancers. Diagn Interv Imaging. 2013;94:1069–1080. doi: 10.1016/j.diii.2013.04.010. [DOI] [PubMed] [Google Scholar]
- 4.Morris EA. Diagnostic breast MR imaging: current status and future directions. Magn Reson Imaging Clin N Am. 2010;18:57–74. doi: 10.1016/j.mric.2009.09.005. [DOI] [PubMed] [Google Scholar]
- 5.Dromain C, Boyer B, Ferre R, Canale S, Delaloge S, Balleyguier C. Computed-aided diagnosis (CAD) in the detection of breast cancer. Eur J Radiol. 2013;82:417–423. doi: 10.1016/j.ejrad.2012.03.005. [DOI] [PubMed] [Google Scholar]
- 6.Uematsu T, Kasami M, Yuen S. Triple-negative breast cancer: correlation between MR imaging and pathologic findings. Radiology. 2009;250:638–647. doi: 10.1148/radiol.2503081054. [DOI] [PubMed] [Google Scholar]
- 7.Youk JH, Son EJ, Chung J, Kim JA, Kim EK. Triple-negative invasive breast cancer on dynamic contrast-enhanced and diffusion-weighted MR imaging: comparison with other breast cancer subtypes. Eur Radiol. 2012;22:1724–1734. doi: 10.1007/s00330-012-2425-2. [DOI] [PubMed] [Google Scholar]
- 8.Bhooshan N, Giger ML, Jansen SA, Li H, Lan L, Newstead GM. Cancerous breast lesions on dynamic contrast-enhanced MR images: computerized characterization for image-based prognostic markers. Radiology. 2010;254:680–690. doi: 10.1148/radiol.09090838. [DOI] [PMC free article] [PubMed] [Google Scholar]
- 9.Chen W, Giger ML, Li H, Bick U, Newstead GM. Volumetric texture analysis of breast lesions on contrast-enhanced magnetic resonance images. Magn Reson Med. 2007;58:562–571. doi: 10.1002/mrm.21347. [DOI] [PubMed] [Google Scholar]
- 10.Huang YH, Chang YC, Huang CS, Wu TJ, Chen JH, Chang RF. Computer-aided diagnosis of mass-like lesion in breast MRI: differential analysis of the 3-D morphology between benign and malignant tumors. Comput Methods Prog Biomed. 2013;112:508–517. doi: 10.1016/j.cmpb.2013.08.016. [DOI] [PubMed] [Google Scholar]
- 11.Holli K, Laaperi AL, Harrison L, et al. Characterization of breast cancer types by texture analysis of magnetic resonance images. Acad Radiol. 2010;17:135–141. doi: 10.1016/j.acra.2009.08.012. [DOI] [PubMed] [Google Scholar]
- 12.McLaren CE, Chen WP, Nie K, Su MY. Prediction of malignant breast lesions from MRI features: a comparison of artificial neural network and logistic regression techniques. Acad Radiol. 2009;16:842. doi: 10.1016/j.acra.2009.01.029. [DOI] [PMC free article] [PubMed] [Google Scholar]
- 13.Agner SC, Rosen MA, Englander S, et al. Computerized image analysis for identifying triple-negative breast cancers and differentiating them from other molecular subtypes of breast cancer on dynamic contrast-enhanced MR images: a feasibility study. Radiology. 2014;272:91–99. doi: 10.1148/radiol.14121031. [DOI] [PMC free article] [PubMed] [Google Scholar]
- 14.Mazurowski MA, Zhang J, Grimm LJ, Yoon SC, Silber JI. Radiogenomic analysis of breast cancer: luminal B molecular subtype is associated with enhancement dynamics at MR imaging. Radiology. 2014:132641. doi: 10.1148/radiol.14132641. [DOI] [PubMed] [Google Scholar]
- 15.El Naqa I, Grigsby P, Apte A, et al. Exploring feature-based approaches in PET images for predicting cancer treatment outcomes. Pattern Recogn. 2009;42:1162–1171. doi: 10.1016/j.patcog.2008.08.011. [DOI] [PMC free article] [PubMed] [Google Scholar]
- 16.Sutton EJ, Oh JH, Dashevsky BZ, et al. Breast cancer subtype intertumor heterogeneity: MRI-based features predict results of a genomic assay. J Magn Reson Imaging. 2015;42:1398–1406. doi: 10.1002/jmri.24890. [DOI] [PMC free article] [PubMed] [Google Scholar]
- 17.Oh JH, Gurnani P, Schorge J, Rosenblatt KP, Gao JX. An extended Markov blanket approach to proteomic biomarker detection from high-resolution mass spectrometry data. IEEE Trans Inform Technol Biomed. 2009;13:195–206. doi: 10.1109/TITB.2008.2007909. [DOI] [PubMed] [Google Scholar]
- 18.Waugh SA, Purdie CA, Jordan LB, et al. Magnetic resonance imaging texture analysis classification of primary breast cancer. Eur Radiol. 2015 doi: 10.1007/s00330-015-3845-6. [Epub ahead of print] [DOI] [PubMed] [Google Scholar]
- 19.Yamamoto S, Maki DD, Korn RL, Kuo MD. Radiogenomic analysis of breast cancer using MRI: a preliminary study to define the landscape. AJR Am J Roentgenol. 2012;199:654–663. doi: 10.2214/AJR.11.7824. [DOI] [PubMed] [Google Scholar]
- 20.Ashraf AB, Daye D, Gavenonis S, et al. Identification of intrinsic imaging phenotypes for breast cancer tumors: preliminary associations with gene expression profiles. Radiology. 2014;272:374–384. doi: 10.1148/radiol.14131375. [DOI] [PMC free article] [PubMed] [Google Scholar]
- 21.Schrading S, Kuhl CK. Mammographic, US, and MR imaging phenotypes of familial breast cancer. Radiology. 2008;246:58–70. doi: 10.1148/radiol.2461062173. [DOI] [PubMed] [Google Scholar]
- 22.Noh JM, Han BK, Choi DH, et al. Association between BRCA mutation status, pathological findings, and magnetic resonance imaging features in patients with breast cancer at risk for the mutation. J Breast Cancer. 2013;16:308–314. doi: 10.4048/jbc.2013.16.3.308. [DOI] [PMC free article] [PubMed] [Google Scholar]
- 23.Costantini M, Belli P, Distefano D, et al. Magnetic resonance imaging features in triple-negative breast cancer: comparison with luminal and HER2-overexpressing tumors. Clin Breast Cancer. 2012;12:331–339. doi: 10.1016/j.clbc.2012.07.002. [DOI] [PubMed] [Google Scholar]
- 24.Sung JS, Jochelson MS, Brennan S, et al. MR imaging features of triple-negative breast cancers. Breast J. 2013;19:643–649. doi: 10.1111/tbj.12182. [DOI] [PubMed] [Google Scholar]
- 25.Koo HR, Cho N, Song IC, et al. Correlation of perfusion parameters on dynamic contrast-enhanced MRI with prognostic factors and subtypes of breast cancers. J Magn Reson Imaging. 2012;36:145–151. doi: 10.1002/jmri.23635. [DOI] [PubMed] [Google Scholar]
- 26.Mukhtar RA, Yau C, Rosen M, et al. Clinically meaningful tumor reduction rates vary by prechemotherapy MRI phenotype and tumor subtype in the I-SPY 1 TRIAL (CALGB 150007/150012; ACRIN 6657) Ann Surg Oncol. 2013;20:3823–3830. doi: 10.1245/s10434-013-3038-y. [DOI] [PMC free article] [PubMed] [Google Scholar]
- 27.Dorrius MD, Jansen-van der Weide MC, van Ooijen PM, Pijnappel RM, Oudkerk M. Computer-aided detection in breast MRI: a systematic review and meta-analysis. Eur Radiol. 2011;21:1600–1608. doi: 10.1007/s00330-011-2091-9. [DOI] [PMC free article] [PubMed] [Google Scholar]
- 28.Lehman CD, Blume JD, DeMartini WB, Hylton NM, Herman B, Schnall MD. Accuracy and interpretation time of computer-aided detection among novice and experienced breast MRI readers. AJR Am J Roentgenol. 2013;200:W683–689. doi: 10.2214/AJR.11.8394. [DOI] [PMC free article] [PubMed] [Google Scholar]
- 29.Soares F, Janela F, Pereira M, Seabra J, Freire MM. 3D lacunarity in multifractal analysis of breast tumor lesions in dynamic contrast-enhanced magnetic resonance imaging. IEEE Trans Image Process. 2013;22:4422–4435. doi: 10.1109/TIP.2013.2273669. [DOI] [PubMed] [Google Scholar]
- 30.Jacobs MA. Multiparametric magnetic resonance imaging of breast cancer. J Am Coll Radiol. 2009;6:523–526. doi: 10.1016/j.jacr.2009.04.006. [DOI] [PubMed] [Google Scholar]
- 31.Cancer Genome Atlas N. Comprehensive molecular portraits of human breast tumours. Nature. 2012;490:61–70. doi: 10.1038/nature11412. [DOI] [PMC free article] [PubMed] [Google Scholar]