Abstract
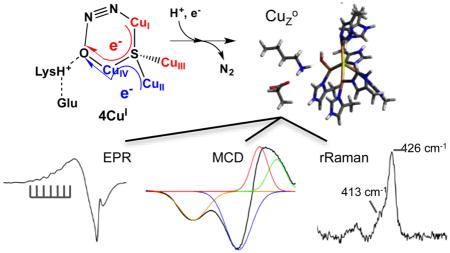
Spectroscopic methods and density functional theory (DFT) calculations are used to determine the geometric and electronic structure of CuZ°, an intermediate form of the Cu4S active site of nitrous oxide reductase (N2OR) that is observed in single turnover of fully reduced N2OR with N2O. Electron paramagnetic resonance (EPR), absorption, and magnetic circular dichroism (MCD) spectroscopies show that CuZ° is a 1-hole (i.e., 3CuICuII) state with spin density delocalized evenly over CuI and CuIV. Resonance Raman spectroscopy shows two Cu–S vibrations at 425 and 413 cm−1, the latter with a −3 cm−1 O18 solvent isotope shift. DFT calculations correlated to these spectral features show that CuZ° has a terminal hydroxide ligand coordinated to CuIV, stabilized by a hydrogen bond to a nearby lysine residue. CuZ° can be reduced via electron transfer from CuA using a physiologically relevant reductant. We obtain a lower limit on the rate of this intramolecular electron transfer (IET) that is >104 faster than the unobserved IET in the resting state, showing that CuZ° is the catalytically relevant oxidized form of N2OR. Terminal hydroxide coordination to CuIV in the CuZ° intermediate yields insight into the nature of N2O binding and reduction, specifying a molecular mechanism in which N2O coordinates in a μ-1,3 fashion to the fully reduced state, with hydrogen bonding from Lys397, and two electrons are transferred from the fully reduced μ4S2− bridged tetranuclear copper cluster to N2O via a single Cu atom to accomplish N–O bond cleavage.
Graphical Abstract
1. INTRODUCTION
The mitigation of man-made pollution of the global atmosphere is one of the most important scientific challenges of the 21st century. Nitrous oxide (N2O) emissions from anthropogenic sources are important contributors to global warming, as N2O has 300 times the global warming potential of CO21 and also contributes to the depletion of the ozone layer.2 Two-thirds of anthropogenic N2O emissions arise from agricultural soils,3,4 where N2O is formed as part of the bacterial denitrification pathway, in which soil and marine bacteria use oxidized nitrogen compounds as terminal electron acceptors for anaerobic respiration.5 Many bacterial denitrifiers contain the enzyme nitrous oxide reductase (N2OR), which catalyzes the two electron and two proton reduction of N2O to N2 and H2O, as the terminal step of denitrification, thus preventing the environmental release of N2O.6,7 This reaction is exergonic by 81 kcal/mol but kinetically hindered by a high barrier for N–O bond cleavage (+59 kcal/mol in the gas phase), thus requiring enzymatic catalysis.8 Understanding the molecular mechanism by which N2OR catalyzes this reaction in vivo could contribute to efforts to mitigate the environmental release of N2O.3
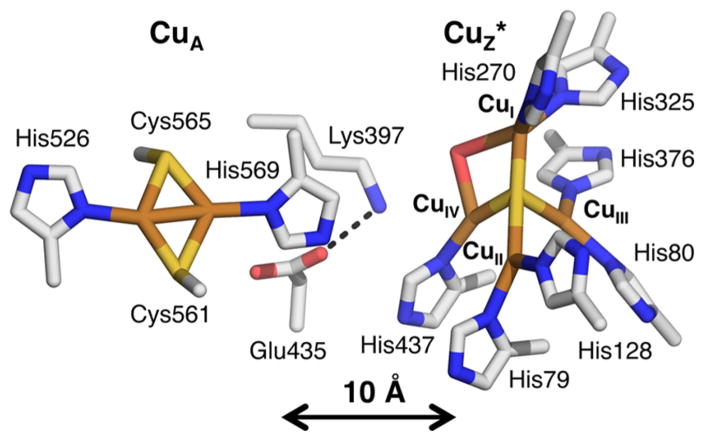
N2OR is a homodimeric metalloenzyme that contains two copper sites: a binuclear copper site known as CuA, which receives an electron from cytochrome c or cupredoxin and transfers it to a unique tetranuclear copper monosulfide (Cu4S) active site, where N2O binds and is reduced (Figure 1).9–13 The two copper sites are separated by a distance of 10 Å across the dimer interface and a solvent-filled cavity lies between them.
Figure 1.
X-ray crystallographic structure of the copper sites of nitrous oxide reductase from Paracoccus denitrificans (1FWX, resolution 1.7 Å),12 identifying important ligating and second sphere residues.
CuA is ligated equatorially by two bridging Cys and two His residues and is structurally and electronically similar to an equivalent electron transfer site in the enzyme cytochrome c oxidase.14,15 The Cu4S active site is ligated by 7 His residues and contains three copper atoms (designated CuI, CuII, and CuIV) that share a plane with the μ4 sulfide ligand and with a solvent-derived ligand that bridges the CuI–CuIV edge, while the fourth copper (CuIII) bound to the μ4S2− is oriented out of this plane. The resting state of the Cu4S cluster, known as CuZ*, has been extensively characterized by spectroscopic methods and has a mixed valent 3CuICuII (1-hole) electronic structure, where the hole is delocalized in a ~5:2 ratio over two coppers in the cluster, CuI and CuIV, respectively.16–19 Studies of the pH dependence of the resting 1-hole CuZ* state show that in this state the solvent-exchangeable CuI–CuIV edge ligand is a hydroxide, which changes position depending on the protonation state of the second sphere residue, Lys397 (Figure 1).20 An alternative two sulfur (Cu4S2) form of the N2OR active site has been observed when N2ORs from Pseudomonas stutzeri and Marinobacter hydrocarbonoclasticus (MhN2OR, used in this study) are isolated under low dioxygen conditions.21,22 However, single turnover studies have shown that none of the accessible redox states of the Cu4S2 cluster react rapidly with N2O,23 while the fully reduced (4CuI) state of the Cu4S cluster does react with N2O at a sufficiently rapid rate to be catalytically relevant.24 The 4CuI state of the Cu4S cluster is also responsible for turnover in the standard steady-state assay for N2OR activity, which uses the electron donor methyl viologen.23,25
Despite the evidence that the 4CuI state of the Cu4S cluster is the only form of the N2OR active site that can reduce N2O at a rate that is catalytically competent for turnover,23 important questions remain. Specifically, the putative reactive 4CuI state can only be accessed in vitro from the resting 1-hole CuZ* state via a slow reductive activation using dithionite-reduced viologen reductants (methyl or benzyl viologen) and not with physiologically relevant reductants, such as cytochrome c552, the physiological electron donor of MhN2OR, or sodium ascorbate.25,26 This calls into question whether the reactive 4CuI state of the Cu4S cluster can be accessed in vivo; indeed, the reduction of resting 1-hole CuZ* to the 4CuI state is too slow to be part of the catalytic cycle. However, an alternative oxidized state of the Cu4S cluster, known as CuZ°, has been observed as a transient intermediate in the single turnover reaction of fully reduced N2OR with N2O.27 In contrast to resting 1-hole CuZ*, CuZ° is reduced rapidly in steady-state experiments with methyl viologen. The CuZ° intermediate shows an S = 1/2 EPR signal, indicating that it is a 1-hole state of the Cu4S cluster, and an absorption maximum at 680 nm, red-shifted from the absorption maximum of resting 1-hole CuZ*, which is at 640 nm.27 Characterization of the CuZ° intermediate to determine its geometric and electronic structure and reactivity with physiologically relevant reductants is essential to elucidate how it differs from the resting 1-hole form of CuZ* and understand its role in the mechanism of N2O reduction.
In this study, EPR, absorption, MCD, and resonance Raman spectroscopies are performed on freeze-trapped samples of the CuZ° intermediate to characterize its electronic structure. We then use DFT calculations to develop a structural model for this intermediate that is consistent with this electronic structure and with the differences in spectral features of CuZ° relative to resting 1-hole CuZ*. We further determine that the CuZ° intermediate can be rapidly reduced to the reactive 4CuI state via electron transfer from CuA using a physiologically relevant reductant, sodium ascorbate, and use our computational model to elucidate the structural and energetic basis for the rapid reduction of CuZ° but not of the resting 1-hole CuZ* by CuA in turnover. This establishes that the CuZ° intermediate is the relevant 1-hole oxidized form of the Cu4S cluster in the turnover and reduction of N2O, bypassing the inactive resting 1-hole CuZ* state. We further extend the structural insight gained from the CuZ° intermediate to examine the nature of the two electron reduction of N2O performed by the Cu4S cluster, the key catalytic role of the N2OR active site.
2. METHODOLOGY
2.1. Materials
All reagents were of the highest grade commercially available and used without further purification. Buffers and reductants were purchased from Sigma-Aldrich. N2O, 10% in argon, was obtained from Praxair. D2O (99.9% D), deuterated glycerol (98% D), and H2O18 (97% O18) were purchased from Cambridge Isotopes.
2.2. Isolation of Nitrous Oxide Reductase
Nitrous oxide reductase was purified from Marinobacter hydrocarbonoclasticus 617 (previously named Pseudomonas nautica) according to previously published procedures.22 The cells were grown anaerobically in the presence of nitrate, and MhN2OR was purified under aerobic conditions without added reductant, using a three step column procedure that has been shown to result in MhN2OR that contains dominantly the monosulfide Cu4S, resting 1-hole CuZ*, cluster, with the presence of a minimal amount of the disulfide Cu4S2 form.22,23 The amount of the Cu4S cluster present in the purified MhN2OR used for this study was determined by EPR spin quantitation before and after methyl viologen reduction (which results in reduction of all copper sites except the 1-hole state of the Cu4S2 cluster); 90% ± 10% or 80% ± 10% of the total tetranuclear cluster concentration was determined to be the Cu4S form and 10% ± 10% or 20% ± 10% was determined to be the Cu4S2 form of the cluster. The purified enzyme was stored in 100 mM Tris-HCl at a pH 7.6 in liquid nitrogen until further use. The two enzyme preparations used in this study have specific activities of 180 ± 17 and 190 ± 20 μmol N2O min−1 mg−1 for the 80% and 90% Cu4S MhN2OR, respectively, at pH 7.6.
2.3. Spectroscopic Sample Preparation and Instrumentation
Fully reduced Cu4S-containing MhN2OR samples were prepared in a glovebox under N2 atmosphere. MhN2OR in 100 mM pH 7.6 phosphate buffer was reduced by incubation with a 100-fold excess of sodium dithionite-reduced methyl viologen. After 1–2 h of reduction, the excess reductant was removed by PD-10 Sephadex G-25 desalting column, and the protein-containing fractions were concentrated by centrifugation. Fully reduced samples were transferred out of the glovebox in tightly capped absorption cuvettes, conical vials, or EPR tubes and immediately used for spectroscopic sample preparation.
The reaction of fully reduced MhN2OR with N2O was initiated by adding a stoichiometric amount of N2O from a solution of 2.5 mM N2O in 100 mM pH 7.6 phosphate buffer, obtained by saturation of the buffer with 10% N2O in argon at room temperature. Ten to fifteen microliters of the 2.5 mM N2O solution was typically added to ~250 μL of fully reduced MhN2OR for 0.10–0.30 mM concentrations of CuZ°. Complete mixing was obtained by vigorously shaking or vortexing the reaction mixture for 15–30 s. Absorption spectra of CuZ° were obtained by performing the N2O reaction in a quartz cuvette at room temperature. The reaction progress was monitored with an Agilent 8453 UV–vis spectrophotometer with deuterium and tungsten sources. The first absorption spectrum of CuZ° was obtained at 30 s after the initial addition of N2O.
Samples for electron paramagnetic resonance (EPR) and resonance Raman spectroscopy of CuZ° were prepared by carrying out the N2O reaction with 0.1–0.5 mM fully reduced N2OR in a quartz EPR tube, which was vortexed for 15–30 s and immediately frozen in an acetone/dry ice bath. After freezing, samples were transferred to liquid nitrogen for storage and data collection. X band EPR spectra were collected using a Bruker EMX spectrometer with an ER 041 XG microwave bridge and an ER4102ST sample cavity. X-band samples were run at 77 K using a liquid nitrogen finger dewar. EPR spectra were baseline corrected using the WinEPR program (Bruker) and simulated using the XSophe program (Bruker). Resonance Raman spectra were collected using a series of lines from a Kr+ ion laser (Coherent 190CK), a Ti-sapphire laser (M-squared SolsTice, pumped by a 12 W Lighthouse Photonics Sprout diode pumped solid state laser), and a dye laser (rhodamine 6G, Coherent 699) with incident power of 20–30 mW arranged in a 130° backscattering configuration. The scattered light was dispersed through a triple monochromator (Spex 1877 CP, with 1200, 1800, and 2400 grooves mm−1 gratings) and detected with a back-illuminated CCD camera (Andor iDus model). Samples prepared in EPR tubes were immersed in a liquid nitrogen finger dewar at 77 K for resonance Raman experiments. The intensity of the ice peak at ~229 cm−1 was used to normalize the intensities of vibrations to obtain resonance Raman excitation profiles. The spectrum of carbon black in an identical quartz EPR tube was subtracted to remove the spectral contribution from quartz scattering.
Samples for magnetic circular dichroism (MCD) spectroscopy were prepared by premixing 0.1–0.3 mM fully reduced MhN2OR with 50% deuterated glycerol and preparing a 2.5 mM N2O solution in 1:1 deuterated glycerol to 100 mM phosphate buffer at pD 7.6. Upon addition of a stoichiometric amount of the N2O solution to fully reduced MhN2OR in 50% glycerol, the reaction was mixed with a syringe for ~30 s, then transferred to an MCD cell and frozen in an acetone/dry ice bath at −80 °C. Parallel MCD samples of fully reduced MhN2OR were prepared by adding glycerol-buffer solutions that did not contain N2O. These were used to determine the spectral contribution of the residual unreduced 1-hole Cu4S2 cluster. MCD spectra were collected on CD spectropolarimeters (Jasco J810 with an S20 PMT detector for the 300–900 nm region and a Jasco J730 with an InSb detector for the 600–2000 nm region) with sample compartments modified to insert a magnetocryostat (Oxford Instruments SM4-7T).
2.4. Reactivity and Steady-State Kinetics
Fully reduced N2OR was prepared by incubation with 100 equiv of reduced methyl viologen in 100 mM Tris-HCl, pH 7.6, for 3 h. Reductants were removed in a NAP-5 column equilibrated with 100 mM pH 7.6 phosphate buffer, and the protein concentration was determined by the Pierce Method. To study the reduction of CuZ° by sodium ascorbate, typically 20 μM fully reduced N2OR was reacted with 36 μM N2O to form CuZ° in a stirred absorption cell. After 37 s of reaction with N2O, a solution containing sodium ascorbate was added (final concentration of 7.29 mM, 366-fold molar excess) to the cuvette under agitation. The reduction was followed by absorption spectroscopy, using a TIDAS diode-array spectrophotometer, and spectra were collected for at least 1 h inside a Mbraun anaerobic box. A parallel experiment using sodium ascorbate to reduce MhN2OR containing resting 1-hole CuZ* and oxidized CuA was performed as above with 16.5 μM N2OR and 7.5 mM sodium ascorbate. An additional experiment was performed in which fully reduced N2OR was added to a stirred cell containing sodium ascorbate and N2O (final concentrations, 20 μM N2OR, 10 mM ascorbate, and 0.2 mM N2O). Control experiments to monitor changes in fully reduced N2OR in the absence and presence of sodium ascorbate were also performed (no absorbance changes was observed over time, data not shown). All these experiments were performed with a sample of MhN2OR containing 80% of the Cu4S and 20% of the Cu4S2 cluster.
The dependence of the steady-state activity of MhN2OR on pH, pD, and temperature was determined. Steady-state activity measurements were performed by monitoring the oxidation of reduced methyl viologen, following published procedures.9 MhN2OR (~0.2 mM) was activated in a glovebox under nitrogen atmosphere by incubation for 1.5 h with 500 equiv of dithionite-reduced methyl viologen at pH 8.0. A solution of 1 mL of dithionite-reduced methyl viologen (2.8 mM) was prepared in an anaerobic cuvette at the appropriate pH, pD, or temperature, and an aliquot of the reduced MhN2OR solution was added to the cuvette under stirring. Twenty microliters of N2O saturated water (25 mM) was immediately added to initiate the steady-state turnover reaction (final concentrations, [N2OR] ≈ 4 μM (dimer), [N2O] ≈ 500 μM, [MV] ≈ 2.8 mM). There is a 10% error in activity measurements obtained by this method. The buffers used for the pH/pD profile were MES (pH 5.5–6.5), phosphate (pH 7–8), CHES (pH 8.5–9.5), and CAPS (pH 10–10.5). Typically three replicates were performed at each pH and pD, while six replicates were performed at each temperature. pH and pD activity values reported are the average of multiple replicates with the appropriate propagation of errors. The log of the initial rate of oxidation of reduced methyl viologen (k or k/T) was plotted relative to 1/T to obtain thermodynamic parameters for the rate-determining step of steady-state turnover in MhN2OR.
2.5. Computational Methods
A computational model of the Cu4S active site was built from the atomic coordinates of the crystal structure of PdN2OR (PDB ID 1FWX, residue numbers from MhN2OR), as it is the highest resolution structure available of N2OR (resolution 1.6 Å). The model included the active site core (Cu4S), the edge hydroxide, seven ligating histidines, and the second sphere residues Lys397 and Glu435 (Figure 1). All protein residues were included up to the α carbons, which were constrained at their crystallographic positions. The distal nitrogen of each His ligand, which is typically involved in a hydrogen bond to a second sphere residue or the protein backbone, was also fixed in place. Additionally, the distant oxygen of Glu435 was constrained in its crystallographic position. (In optimizations including an unconstrained Glu435, this residue moves significantly from its crystallographic position to form a hydrogen bond to His437, a CuIV ligand.) Calculations were performed using Gaussian 09 (version d01).28 Molecular structures and frequencies were visualized using Avogadro, an open source molecular builder and visualization tool (version 1.1.1).29 LUMO version 1.0.330 and VMD 1.9.131 were used to visualize molecular orbitals, and QMForge was used to obtain Mulliken spin populations of different orbitals.32 Geometry optimizations were performed using B3LYP and BP86 with 10% Hartree–Fock exchange, the TZVP basis set on all core atoms (Cu4S), the ligating His nitrogens, the edge ligand, and atoms involved in the Lys397–Glu435 hydrogen bonding network (NH3+ or NH2 of Lys397 and CO2 of Glu435), and the SV basis set on all remaining atoms. Optimizations were performed in a PCM of 10 to ensure that the proton involved in the Lys397–Glu435 hydrogen bond remains on Lys397 (PCM values less than 8 yield a neutral Lys397 Glu435-H as the lowest energy structure). Optimized structures were then used for frequency calculations. In the analysis of vibrational frequencies of the CuI–OH2–CuIV and CuIV–OH models of CuZ°, significant mixing was observed between high energy Cu–S stretching modes and His methylene bending modes. To remove this computational artifact, the α carbons of His residues involved in this mix were increased in mass until pure Cu–S vibrations were obtained.33
The decay process of the CuIV–OH model of CuZ° to resting 1-hole CuZ*, with an OH bridged edge, was calculated by performing a 1D potential energy scan with a constrained CuI–OH and CuI–CuIV distance of 3.6 Å (to reflect the larger CuI–CuIV distance observed crystallographically for resting CuZ*), and a transition state was obtained for this process. The process is close to barrierless when the CuI–CuIV distance is not constrained.
To obtain a starting structure for the N–O bond cleavage coordinate, N2O was positioned near an optimized fully reduced model of the cluster.8,34 Initial geometries investigated included μ-1,3 coordination of N2O (with the O on both CuI and CuIV), μ-1,1-O coordination, and terminal coordination of a linear N2O molecule to CuI or CuIV through either the N or O. Stationary points were only found for end-on N coordination to CuI and for μ-1,3 bent coordination with the O coordinated to CuIV (using BP86 with 10% Hartree–Fock; B3LYP has no stationary point for this structure). In the N–O bond elongation coordinate for the terminal CuI–N2O structure, the N2O molecule undergoes an early rearrangement with no barrier to form a μ-1,3 coordinated bent N2O that proceeds in N–O bond cleavage as found for the μ-1,3 structure obtained with BP86 and 10% Hartree–Fock. The μ-1,3 bound N2O structure obtained with BP86 and 10% Hartree–Fock exchange was used as the starting point for a 1D potential energy scan of N–O bond elongation, leading to a transition state for this process. The μ-1,3 N2O structure was also used to generate 2D and 3D potential energy surfaces for N–O bond cleavage, proton transfer from Lys397 to O, and CuI–N bond cleavage.
3. RESULTS AND ANALYSIS
3.1. Spectroscopy of CuZ°
The reaction of fully reduced MhN2OR with stoichiometric N2O (in the absence of additional reductant) results in the rapid formation of the intermediate CuZ°, concomitant with oxidation of CuA.27 The kinetics of formation (kf = 200 s−1)23 and decay (kdecay = 0.005 s−1),27 previously reported for the CuZ° intermediate, indicate that samples trapped in less than 2 min will contain mainly CuZ° (Figure S1). Accounting for all the species in the reaction mixture, spectra of samples trapped in 50–60 s (Figure S2, black) contain contributions from three species: the CuZ° intermediate (68%), oxidized CuA (68%), and residual 1-hole Cu4S2 CuZ (~10% present for the N2OR preparation used here). The spectral features of CuZ° were cleanly distinguished from the mixtures by removing the spectral contributions of 1-hole CuZ and oxidized CuA. The spectral contribution of residual 1-hole Cu4S2 CuZ was determined from samples of the methyl viologen reduced protein (shown in ref 23 to reduce all copper sites except the 1-hole Cu4S2 CuZ cluster) that were prepared in parallel with the intermediate samples (Figure S2, blue). The spectral contribution of oxidized CuA was determined by subtracting the spectrum of oxidized resting MhN2OR from that of ascorbate-reduced MhN2OR (which from ref 23 reduces only CuA) and scaling the resulting CuA spectrum to the appropriate concentration (Figure S2, red). For the EPR and MCD spectra, fit versions of the CuA spectra were used for these subtractions.
3.1.1. EPR
The X band EPR spectrum of CuZ° obtained using this approach is axial with g|| > g⊥ > 2.0023, indicating a dx2−y2 ground state. Six hyperfine features can be discerned, showing that the unpaired spin is delocalized over more than one Cu (Figure 2, black, with simulation shown in red).
Figure 2.
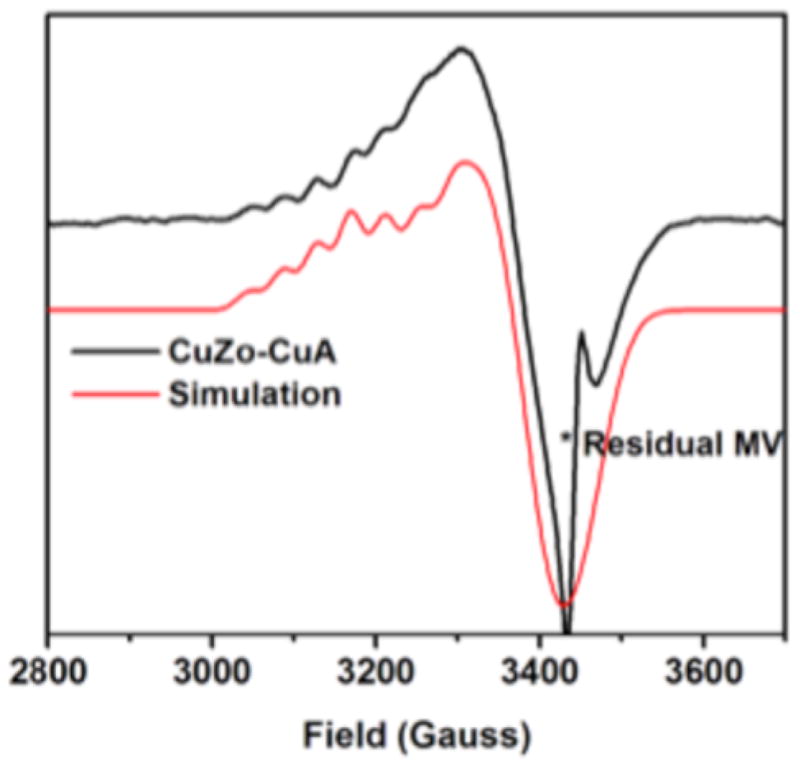
EPR spectrum of CuZ° at 77 K (black) after subtraction of 1-hole CuZ and an equal spin integration of oxidized CuA, with fit (red). MV, reduced methyl viologen.
The EPR spectrum of CuZ° was fit with similar g values to those previously obtained for resting 1-hole CuZ* (Table 1), consistent with the results obtained by Dell’Acqua et al.27 However, we are additionally able to resolve the A|| hyperfine features of CuZ°. Two equal A|| values are required to fit the hyperfine pattern, reflecting an equal distribution of spin over two coppers, while in resting CuZ* two unequal A|| values are required, reflecting a spin distribution over two coppers of ~5:2 in the resting state.35 This indicates that the unpaired spin in the CuZ° intermediate has shifted from being mostly localized on CuI, as in resting 1-hole CuZ*, to being more equally delocalized over two different coppers.
Table 1.
g and A Values Obtained from Fitting the X Band EPR Spectra of CuZ° and Resting 1-Hole CuZ* Values from Ref 35 with g⊥ Estimated from the Crossover Point
| CuZ° | CuZ* | |
|---|---|---|
| g|| | 2.177 | 2.160 |
| A|| | 42 × 10−4 cm−1 | 61 × 10−4 cm−1 |
| 42 × 10−4 cm−1 | 23 × 10−4 cm−1 | |
| g⊥ | ~2.05 | 2.042 |
3.1.2. Absorption and MCD
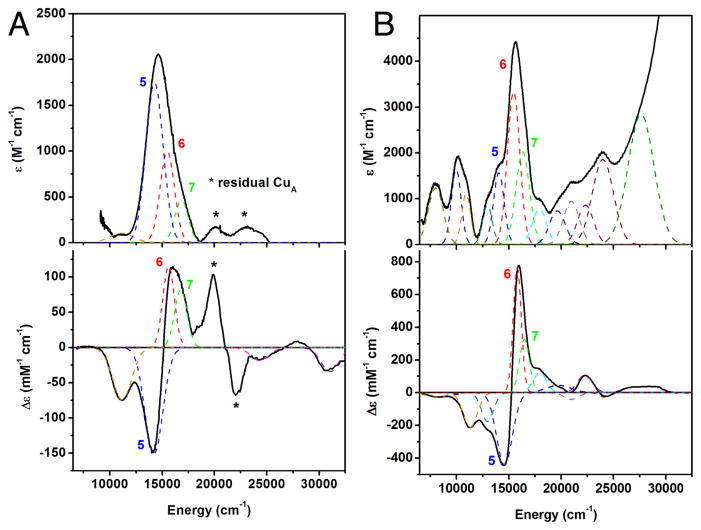
The absorption spectrum of CuZ°, obtained after the subtraction of the contributions of oxidized CuA and 1-hole CuZ, shows an asymmetrically shaped intense peak maximum at ~14 900 cm−1 (ε ≈ 2000 M−1 cm−1, Figure 3A) with a shoulder to higher energy. This absorption maximum is lower in energy by ~700 cm−1 than that of resting 1-hole CuZ* (shown for comparison in Figure 3B). The absorption maximum correlates to a derivative shaped pseudo-A feature in the MCD spectrum of CuZ° comprised of a negative band at 14 200 cm−1 and a positive band at 15 900 cm−1 (Figure 3A, bands 5 and 6, respectively; band numbers taken from the fit of resting 1-hole CuZ* in ref 20). Simultaneous fitting of the absorption and MCD spectra of CuZ° yields 6 transitions that can be clearly identified, which are assigned as d–d (band 3), μ4S2− to Cu charge transfer (CT, bands 5, 6, and 7), and His to Cu CT transitions (bands 9 and 10) based on their energies and C0/D0 ratios following ref 20 (Table S1). The transitions that contribute to the absorption maximum and pseudo-A feature are μ4S2− to Cu CT transitions that occur at very similar energies to the equivalent transitions (5 and 6) in resting 1-hole CuZ* (Table S1). Thus, while the absorption maximum of CuZ° appears to be at lower energy than in resting 1-hole CuZ*, this is due to a change in the relative intensities of the μ4S2− to Cu CT transitions, not a shift in their energies. A recent study of the intensities of the μ4S2− to Cu CT transitions in resting 1-hole CuZ* and 1-hole Cu4S2 CuZ has shown that these intensities reflect the overlap of the three perpendicular S p orbitals with the β LUMO of the cluster (Figure S3), such that a higher intensity for band 5 reflects more spin delocalization onto CuIV in the β LUMO while band 6 reflects the spin on CuI.36 Thus, the change in relative intensities of the μ4S2− to Cu CT transitions in CuZ° relative to resting 1-hole CuZ*, where band 6 decreases in intensity while band 5 increases, indicates that there is less spin on CuI and more spin on CuIV in the CuZ° intermediate. This confirms and provides insight into the observation from the EPR A|| values that the spin density of the CuZ° intermediate cluster has shifted from being distributed ~5:2 on CuI and CuIV in resting 1-hole CuZ* to being more delocalized to a second Cu (from MCD, CuIV) in CuZ°. A direct way to accomplish this shift in spin density is to change the nature or position of the CuI–CuIV edge ligand in the CuZ° relative to the μOH ligand in resting 1-hole CuZ*, such that the ligand field on CuI is decreased and the ligand field on CuIV is increased, leading to a shift of some of the spin density from CuI onto CuIV.
Figure 3.
Absorption and MCD spectra of (A) CuZ°, absorption at 273 K and MCD at 5 K and 7 T, and (B) resting CuZ*, absorption at 5 K and MCD at 5 K and 7 T, showing the Gaussian bands obtained from a simultaneous fit, following the fit for CuZ* from ref 17.
3.1.3. Resonance Raman
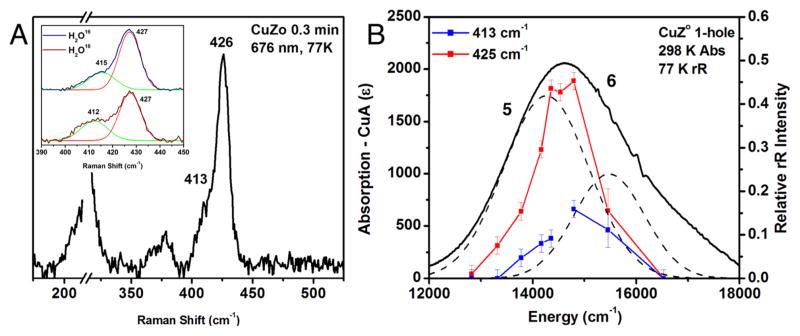
Upon laser excitation into the absorption maximum of CuZ°, two features are resonance enhanced in the Raman spectrum, an intense vibration at 426 cm−1 and a weaker shoulder at 413 cm−1 (Figure 4A). These vibrations profile in the most intense μ4S2− to Cu CT transition (band 5), indicating that they are Cu–S stretching vibrations (Figure 4B). These Cu–S stretching vibrations occur at higher energy than those observed for resting 1-hole CuZ*, which has an intense Cu–S stretch at 378 cm−1 and a weaker Cu–S stretch at 362 cm−1 that profile similarly to the vibrations of CuZ° (in band 6, the most intense S to Cu CT transition in CuZ*, Figure S4). This indicates that some of the Cu–S bonds are stronger in the CuZ° intermediate relative to resting 1-hole CuZ*. Resting 1-hole CuZ* shows an additional Cu–S stretch at 412 cm−1 that profiles differently (in the third sulfide to Cu CT transition, band 7), which is not observed in CuZ° due to the low intensity of band 7 in CuZ°. When the CuZ° intermediate is formed in H2O18 buffer, the 413 cm−1 vibration shifts down in energy by 3 cm−1 and increases in intensity by ~36%, while the 426 cm−1 vibration remains unperturbed (Figure 4A, inset). Resting 1-hole CuZ* also shows some H2O18 isotope sensitivity in the Cu–S stretch at 412 cm−1 (−9 cm−1) but only at high pH. This H2O18 sensitivity in resting 1-hole CuZ* has been previously assigned as coupling between a Cu–S core stretch and the Cu–O stretch of a hydroxide ligand that bridges the CuI–CuIV edge.20 The position of the edge hydroxide ligand is perturbed by the protonation state of Lys397, such that the edge ligand stretch only shows kinematic coupling to the core stretch at high pH (the hydroxide ligand is present in resting 1-hole CuZ* at both high and low pH).20 The presence of a similar H2O18 isotope shift in the 413 cm−1 Cu–S stretch of the CuZ° intermediate at neutral pH indicates that a solvent-exchangeable hydroxide edge ligand is also present in CuZ°, since only the Cu–O stretches of a hydroxide will be high enough in energy to mix with the core Cu–S stretches of the cluster. The possibility of either a water or a hydroxide solvent-derived edge ligand is computationally evaluated below, and only a hydroxide ligand predicts H2O18 isotope sensitivity in a high energy Cu–S vibration. Thus, the presence of H2O18 sensitivity in the 413 cm−1 Cu–S core vibration indicates that the CuZ° intermediate has a hydroxide ligand on the CuI–CuIV edge, similar to resting 1-hole CuZ* but differing in the position of the edge ligand (from the change in spin density by EPR and MCD).
Figure 4.
Resonance Raman spectrum and profile of CuZ°, obtained after 15 s of reaction with N2O. (A) Spectrum at 77 K, excitation energy 676 nm. Inset, O16/O18 isotope perturbation observed after formation of CuZ° in H2O16 or H2O18 100 mM phosphate at pH 7.6. The O16/O18 isotope data were fit with two bands of identical width, where in the O18 spectrum green band decreases in energy by 3 cm−1 and has 36% more intensity. (B) Left scale, room temperature absorption of CuZ° at 30 s (after subtraction of oxidized CuA and 1-hole CuZ contributions; right scale, dependence of the normalized intensity of the vibrations of CuZ° on excitation energy.
3.2. Kinetics
3.2.1. Reduction of CuZ° versus 1-Hole CuZ*
It has been reported previously that CuZ° is competent to be involved in rapid turnover, since the steady-state activity of MhN2OR decays at the same rate as the decay of the CuZ° intermediate to resting 1-hole CuZ*.27 This suggests that the reduction of CuZ° under steady-state turnover conditions occurs with a rate equal to or faster than kcat (320 ± 20 s−1 for MhN2OR, used in this study).26 However, the reductant used in these assays, dithionite-reduced methyl viologen, is not physiologically relevant. To resolve this issue, we investigated whether CuZ° can be reduced by the milder, physiologically relevant reductant sodium ascorbate. The reduction of CuZ° upon addition of sodium ascorbate could be confirmed by resonance Raman spectroscopy, which shows that several minutes after addition of sodium ascorbate the vibrations at 426 and 413 cm−1 associated with CuZ° disappear (Figure S5) indicating that, unlike resting 1-hole CuZ*, the CuZ° intermediate can be reduced by sodium ascorbate.
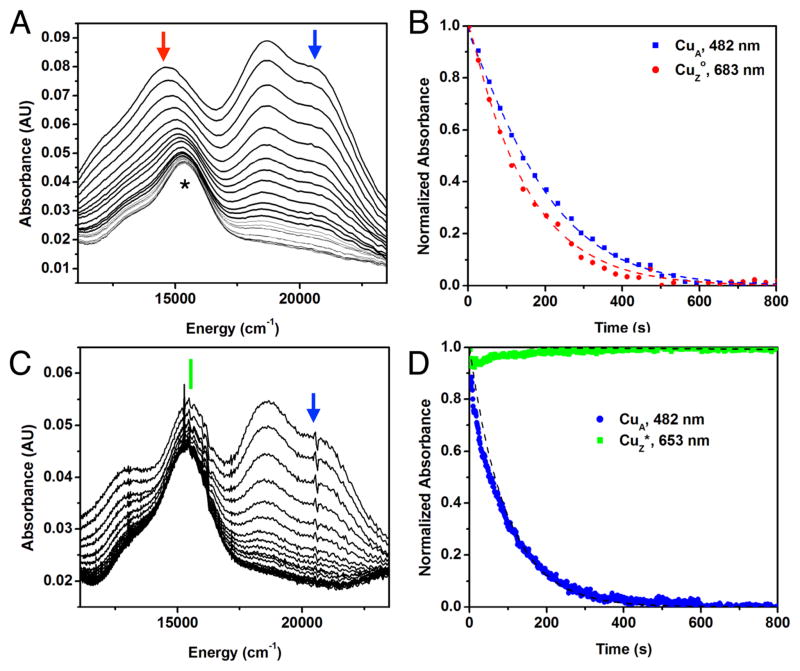
For kinetic studies using absorption spectroscopy on a faster time scale, CuZ° was formed in situ through the reaction of fully reduced N2OR with close to stoichiometric N2O, and a ~400-fold excess of sodium ascorbate was subsequently added (e.g., 7.3 mM sodium ascorbate, 20 μM MhN2OR). Addition of sodium ascorbate to CuZ° leads to rapid decay of both the absorption maximum of CuZ° at 14,900 cm−1 (Figure 5A,B, red) and the characteristic absorption features of oxidized CuA (20 800, 18 800, and 12 200 cm−1, Figure 5A,B, blue) in the first 800 s, with slightly faster reduction of CuZ° relative to CuA (Figure 5B). This behavior is qualitatively consistent with either the rapid reduction of CuZ° via electron transfer from CuA or the direct reduction of CuZ° by sodium ascorbate at a very similar rate to the sodium ascorbate reduction of CuA. To determine whether CuZ° is reduced via intramolecular electron transfer from CuA or by direct reduction by sodium ascorbate, kinetic models for both potential pathways were developed (Schemes S1 and S2, respectively, and Supporting Discussion). Both models contain seven steps: the bimolecular reduction of CuA by ascorbate (in the presence of CuZ°, CuZ*, or the fully reduced cluster), reduction of CuZ° (either reversibly by CuA in Scheme S1 or irreversibly by ascorbate in Scheme S2), and decay of CuZ° to CuZ* (independent of the redox state of CuA). The bimolecular rate of reduction of CuA by sodium ascorbate can be experimentally determined in the presence of CuZ* to be 1.4 M−1 s−1 (Figure 5D and Scheme S3). The rate of CuZ° decay can also be experimentally determined, in the absence of sodium ascorbate, to be 1.8 × 10⁻³ s−1 (Figure S6). As discussed in the Supporting Information, the reductions of CuZ° and CuA by sodium ascorbate were fit with both models, starting from these experimental values. Using the experimental bimolecular rate of reduction of CuA, the IET model provides a better fit for the experimental data (R2 = 0.9829, Figure S7A) while the direct reduction model provides a poor fit (R2 = 0.8752, Figure S7B). The fit obtained using both models can be improved by allowing the bimolecular rate of reduction of CuA in the presence of CuZ° to vary from the rate in the presence of CuZ*. The model that includes IET provides a good fit for the data with minimal (~35%) perturbation of the experimentally determined bimolecular rate of CuA reduction by sodium ascorbate (R2 = 0.9970, dashed lines in Figure 5B), while to obtain a similar fit with the direct reduction model, the bimolecular rate of reduction of CuA by sodium ascorbate in the presence of CuZ° must be reduced by an order of magnitude (R2 = 0.9960, dashed lines in Figure S8B). This large perturbation in the rate of reduction of CuA in the presence -of CuZ° versus resting 1-hole CuZ* is not chemically reasonable, since the two sites differ only in the position of the edge hydroxide ligand (vida infra), which is ~7 Å away from CuA. Thus, these data support that reduction of CuZ° occurs via intramolecular electron transfer from CuA. Using the IET kinetic model (Scheme S1), we obtain a lower limit of 0.1 s−1 for electron transfer from CuA to CuZ°. The fit requires that the electron transfer step be reversible with a KIET of 2.5, indicating that CuZ° and CuA have similar redox potentials. Reversible electron transfer is also observed in other enzymes with multiple copper sites, for example, the multicopper oxidases.37 This contrasts with the sodium ascorbate reduction of CuA in the presence of resting 1-hole CuZ*, where the absorption features of oxidized CuA (Figure 5C,D, blue) immediately decay but those of resting 1-hole CuZ* remain (Figure 5C,D, green). A kinetic model allowing for the possibility of electron transfer from CuA to CuZ* (Scheme S3) yields an upper limit for kIET of 1 × 10⁻⁵ s−1 for the unobserved reduction of 1-hole CuZ* by CuA (Figure 5D, dashed lines). This shows that the rate of CuA reduction of CuZ° is at least 104 faster than the reduction of 1-hole CuZ* by CuA. The origin of this difference in electron transfer rates will be considered below. The reduction of CuZ° by CuA using a physiologically relevant reductant establishes that CuZ° can be the oxidized form of the enzyme that participates in turnover in vivo, while resting 1-hole CuZ*, which cannot be reduced by CuA, is an inactive state that does not participate in reactivity.
Figure 5.
Sodium ascorbate reduction of CuZ° and resting 1-hole CuZ*. (A) Absorption spectra of the reduction of CuZ° (red arrow) and oxidized CuA (blue arrow) by 7.3 mM (~400 equiv) sodium ascorbate, added 37 s after the initial N2O addition to form CuZ° in situ at 297 K. Spectra recorded every 0.5 min. *Indicates resting 1-hole CuZ*, formed by CuZ° decay during the first 37 s before ascorbate addition. (B) Normalized time dependence of the reduction of CuZ° at 683 nm (red) and oxidized CuA at 482 nm (blue). Kinetic fit using Scheme S1 given by dashed lines (R2 = 0.9970). (C) Absorption spectra of the reduction of resting CuZ* (green line) and oxidized CuA (blue arrow) by 7.5 mM (~400 equiv) sodium ascorbate at 297 K, spectra reported every 1 min. (D) Normalized time dependence of the reduction of oxidized CuA at 482 nm (blue) and lack of reduction of resting 1-hole CuZ* at 653 nm (green). Kinetic fit using Scheme S3 given by dashed lines (R2 = 0.9129).
Note that the above analysis of reduction of CuA and CuZ° by sodium ascorbate reflects experimental results up to 800 s, at which point complete reduction of CuA and CuZ° is observed. After 800 s, a second phase of reactivity is observed, in which there is slow growth of an absorption feature at 16 000 cm−1 (Figure S9A). This is consistent with a slow one electron oxidation of the fully reduced Cu4S cluster to resting 1-hole CuZ*. No comparable growth at 16 000 cm−1 (i.e., oxidation to form resting 1-hole CuZ*) is observed during turnover of MhN2OR with sodium ascorbate, performed by premixing fully reduced MhN2OR and sodium ascorbate before addition of N2O (Figure S9B). This indicates that the slow one electron oxidation of the Cu4S cluster observed after reduction of CuZ° and CuA by sodium ascorbate (Figure S9A), possibly due to excess N2O, is a side reaction that is not relevant to turnover.
3.2.2. Steady-State Kinetics
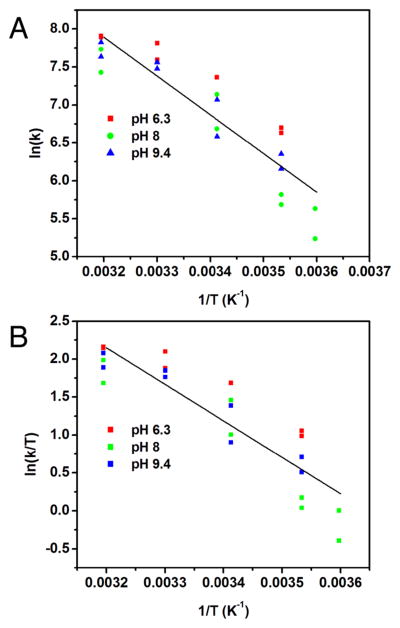
The steady-state turnover of MhN2OR was studied at different temperatures to obtain thermodynamic parameters for the rate-determining step. The initial rate of oxidation of methyl viologen was used to obtain a plot of ln(k) vs 1/T (Figure 6A) that was fit to the Arrhenius equation using a linear regression analysis to obtain a ΔEA of 10 ± 2 kcal/mol (see Table S2). Similarly, ln(k/T) vs 1/T was plotted (Figure 6B) and fit to the Eyring equation to obtain a ΔH‡ of 10 ± 1 kcal/mol and ΔS‡ of −13 ± 1 cal mol−1 K−1 (see Table S2). This yields a ΔG‡ at room temperature of 13 ± 2 kcal/mol (see Supporting Information), consistent with the ΔG‡ predicted based on the kcat of MhN2OR (kcat = 320 s−1 at 293 K, corresponding to a ΔG‡ of 13 kcal/mol). The small value obtained for ΔS‡ indicates that the rate-limiting step of turnover does not involve either binding of N2O or loss of N2.
Figure 6.
Temperature dependence of the initial rate of methyl viologen consumption during steady-state turnover of N2OR. (A) Arrhenius plot, with linear regression fit (R2 = 0.8298). (B) Eyring plot, with linear regression fit (R2 = 0.8119). Colors indicate temperature dependence data at different pH values: pH 6.3 (red), pH 8.0 (green), and pH 9.4 (blue).
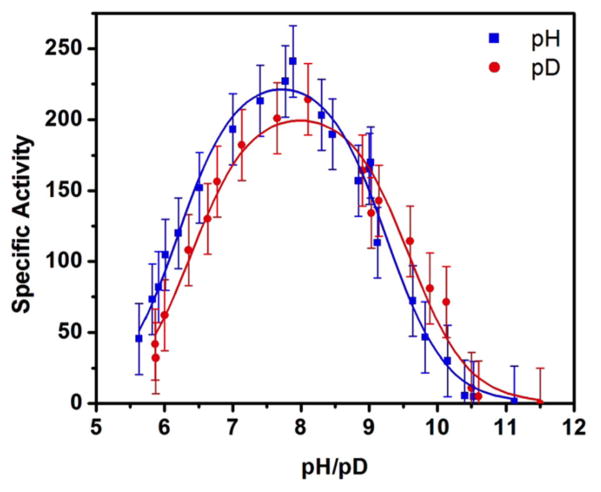
The specific activity of MhN2OR shows a bell-shaped dependence on pH and pD (Figure 7). The enzyme attains optimum activity at pH ≈ 8 and loses activity at lower and higher pH with pKa values of 6.19 ± 0.05 and 9.15 ± 0.05. The lower value is consistent with the pKa determined in a previous study of the intermolecular rate constant between MhN2OR and reduced methyl viologen.26 The pKa values are shifted by 0.2 and 0.3 log units, respectively, when the steady-state turnover experiments are performed in deuterated buffer. A small solvent kinetic isotope effect (SKIE) of 1.12 ± 0.06 is observed at optimum pH, indicating that a solvent exchangeable proton contributes to the transition state in the rate-determining step but is not significantly transferred. The temperature dependence of the initial rate of N2O reduction shows no significant variation outside of error when performed at three different pH values (Figure 6), indicating that the same species is responsible for activity at all pH values. Thus, the bell-shaped pH profile of activity reflects protonation equilibria among three species, where only the species present at intermediate pH is active. The inactive high pH species can be assigned as having Lys397 deprotonated, since the pKa of 9.15 determined for loss of activity at high pH is identical to that determined for Lys397 based on the pH dependence of the spectral features of resting 1-hole CuZ* and its reduction.20 The pKa value of 6.19 corresponds to that expected for the second protonation of a His side chain, but no changes in the absorption features of oxidized CuA or resting 1-hole CuZ* are observed between pH 7.6 and pH 5.5 (Figure S10), indicating that the protonation does not occur at one of the copper sites in the resting state. It is possible that the residue being protonated affects the conformation of the protein or that the pKa is associated with a His in some reduced state in turnover (e.g., reduced CuA or the fully reduced Cu4S cluster).
Figure 7.
pH and pD profiles of steady-state activity of MhN2OR at 297 K in μmol N2O min−1 mg−1, fit with a speciation curve generated by pKa(H) values of 6.19 ± 0.05 and 9.15 ± 0.05 (blue) and pKa(D) values of 6.4 ± 0.1 and 9.5 ± 0.1, with a solvent deuterium isotope effect of 1.12 ± 0.06 (red).
3.3. Calculations
3.3.1. Model of CuZ° Relative to CuZ*: Spectral Assignments
DFT calculations were performed to assess possible structural models for the CuZ° intermediate and evaluate their correlation to the spectroscopic features observed experimentally. A viable model for CuZ° must reproduce the observed shift of the unpaired spin density from dominantly on CuI in resting 1-hole CuZ* to more on CuIV, the shift in the Cu–S vibrations of the cluster to higher energy, and the presence of a solvent O18 isotope effect on a Cu–S vibration (indicating the presence of a solvent derived edge ligand). Possible models for CuZ° were obtained by evaluating chemically reasonable perturbations to a spectroscopically calibrated model of resting 1-hole CuZ* (with protonated Lys397). Resting 1-hole CuZ* was modeled well with a hydroxide ligand asymmetrically bridging the CuI–CuIV edge, closer to CuI than CuIV (2.00 and 2.09 Å, Figure 8A). The model includes two second sphere residues, Lys397 and Glu435, that are hydrogen-bonded to each other and near to CuIV, such that Lys397 is 4.02 Å from the μOH. This is extended from our previous computational model, which only included Lys397.20 When Lys397 in the previous model was protonated, it moves significantly from its crystallographic position to hydrogen bond to the edge hydroxide, which then coordinates directly to CuI instead of bridging CuI and CuIV.20 The present model reproduces the previously observed spectroscopic data for resting 1-hole CuZ*, including the minimal perturbation at high pH when Lys397 is deprotonated,20 without requiring Lys397 to move from its crystallographically defined position (see Supporting Information).
Figure 8.
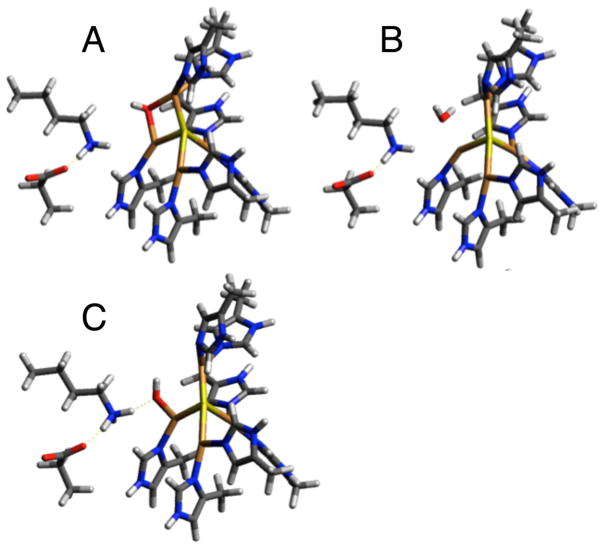
Optimized structures of 1-hole Cu4S models with different edge ligation. Hydroxide bridged model for (A) resting 1-hole CuZ*, (B) water edge ligand, and (C) hydroxide coordinated terminally to CuIV and hydrogen bonded to Lys397. Panels B and C are assessed as possible models for the CuZ° intermediate. (B3LYP, tzvp on Cu4SON7, NH3+, and CO2−, sv on remainder, PCM = 10).
First, possible models of CuZ° resulting from protonation or deprotonation of the edge hydroxide in resting 1-hole CuZ* were considered. Protonation results in a model with a water ligand on the CuI–CuIV edge, closer to CuIV than CuI (Figure 8B), while deprotonation to form a bridging oxo leads to proton transfer from Lys397 and results in a μOH and deprotonated Lys. The latter is the same model as was developed in ref 20 for the high pH form of resting 1-hole CuZ*, which is not active in turnover and is excluded as a model for CuZ°. In the protonated model, the water binds weakly on the CuI–CuIV edge, 2.26 Å from CuIV and 3.39 Å from CuI. Lys397 remains close to its crystallographic position and does not interact with the water edge ligand (Table S4). An additional model was evaluated resulting from a perturbation of the position of the hydroxide ligand on the CuI–CuIV edge. By positioning the hydroxide ligand near CuIV and protonated Lys397, a structure was obtained with a terminal hydroxide ligand coordinated to CuIV (Cu–O bond length of 1.93 Å) and directly hydrogen bonded to Lys397, which remains in its crystallographic position and hydrogen bonded to Glu435 (Figure 8C). The effects of these perturbations on the calculated spin distribution and vibrations were used to determine which of these models is consistent with the spectral features of CuZ° relative to those of resting 1-hole CuZ*. The calculated Mulliken atomic spin density for the OH2 model and the CuIV–OH model, relative to our OH− bridged model for resting 1-hole CuZ*, are given in Table 2. In the OH2 model, the spin density decreases on CuI (from 26% to 8%) and increases on CuII (12% to 26%), while the spin on CuIV remains constant. The CuIV–OH model shows a similar decrease in spin density on CuI (26% to 7%) and a 3-fold increase in spin density on CuIV (12% to 32%), with no significant change on CuII. Thus, only the CuIV–OH model reproduced the shift in spin density from CuI to CuIV observed in the absorption and MCD spectra. In this model, the unpaired spin is delocalized ~2:1 over CuIV and CuII. This is more localized than is observed for the CuZ° intermediate experimentally based on the EPR hyperfine values, which indicate a 1:1 distribution of spin over two coppers. This suggests that the CuIV–OH model, while reproducing the spin density shift, overestimates the strength of the ligand field on CuIV. This effect could arise from the hydrogen bond from Lys397 to the hydroxide being weaker in the model than in the protein, leading to a stronger hydroxide–CuIV interaction. This would result from an overly strong interaction between the negatively charged Glu435 and the Lys, since there are other hydrogen bonding interactions with Glu435 present in the crystal structure (from a backbone amide and a localized water molecule) that are not included in the computational model.
Table 2.
Mulliken Atomic Spin Density Distribution for Computational 1-Hole Cu4S Models with Different CuI–CuIV Edge Ligation, Given in Figure 8a
| edge ligand | CuI | CuII | CuIII | CuIV | S2− | O |
|---|---|---|---|---|---|---|
| OH− bridge | 0.26 | 0.12 | 0.07 | 0.12 | 0.26 | 0.08 |
| OH2 | 0.08 | 0.26 | 0.13 | 0.12 | 0.24 | 0.00 |
| CuIV–OH | 0.07 | 0.15 | 0.03 | 0.32 | 0.21 | 0.10 |
B3LYP, tzvp on Cu4SON7, NH3+, and CO2−, sv on remainder, PCM = 10.
Experimentally, the CuZ° intermediate is characterized by two vibrations at 426 and 413 cm−1 (split by 13 cm−1) where the lower energy vibration shows a −3 cm−1 solvent O18 isotope shift. The highest energy Cu–S stretch in CuZ° is shifted up in energy by 47 cm−1 relative to resting 1-hole CuZ*. The energies of the predicted Cu–S and Cu–OH/OH2 vibrations for the possible models of CuZ° compared to the resting 1-hole CuZ* model are given in Table S5. In the resting 1-hole CuZ* model, the highest energy core Cu–S vibration occurs at 340 cm−1 (378 cm−1 experimentally) and has dominant CuII–μ4S and CuIV–μ4S stretching character. In both possible models for CuZ°, this vibration shifts up in energy due to a significant decrease in the CuIV–μ4S bond length (from 2.25 to 2.19 Å in both models). For the OH2 model, a localized CuIV–S stretch is predicted at 392 cm−1, while in the CuIV–OH model this vibration occurs at 386 cm−1 (52 and 44 cm−1 higher in energy than the CuIV–S vibration of resting 1-hole CuZ*, respectively). While both models predict the increased energy of Cu–S vibrations with CuIV–S stretching character, only the CuIV–OH model is consistent with the solvent O18 isotope shift present in the CuZ° intermediate. In the OH2 model, the CuIV–S stretch shows no predicted shift with O18, while a −2 cm−1 shift is predicted in the CuIV–OH model. This difference results from greater mixing between the CuIV–S and CuIV–OH modes in the CuIV–OH model because the CuIV–OH stretch is higher in energy and thus closer in energy to the CuIV–S stretch (CuIV–O of 467 cm−1 in the CuIV–OH model and 202 cm−1 in the OH2 model, both with O18 shifts of −16 cm−1). This reflects the shorter CuIV–OH bond relative to the CuIV–OH2 bond (1.93 Å versus 2.26 Å).
Thus, the correlations of the predicted spin density distribution and vibrations of OH2 and CuIV–OH models with the spectral features of CuZ° support modeling CuZ° as an intermediate with a terminal hydroxide ligand coordinated to CuIV and hydrogen bonding to a protonated Lys397. This is consistent with the experimental pKa of Lys397 in resting 1-hole CuZ* of 9.2, which would only be increased by an additional hydrogen bond to the hydroxide in the CuIV–OH model, indicating that at the pH of 7.6, used for the spectroscopy of CuZ°, Lys397 will be protonated. While the CuIV–OH structure is at a local minimum with all real vibrational frequencies (aside from those resulting from the fixed atoms that model the connections to the protein backbone), this CuZ° model is 6.4 kcal/mol higher in free energy than the OH bridged model of resting 1-hole CuZ*. Thus, the CuZ° intermediate is a metastable 1-hole form of the cluster formed as the kinetic product of turnover, which decays to the thermodynamically favored resting 1-hole form of CuZ*. The rate of decay of CuZ° to resting 1-hole CuZ* observed experimentally is ~5 × 10⁻³ s−1,27 which gives a ΔG‡ of ~20 kcal/mol. We calculate a transition state with a ΔG‡ of 6 kcal/mol (Figure S13) for breaking the hydrogen bond between Lys397 and the CuIV–OH to form the hydroxide bridge interacting with CuI (with a constrained CuI–CuIV distance). We expect this to be a lower limit as the hydrogen bond in this model appears to be weak relative to experiment, due to an overly strong interaction between Lys397 and Glu435 (see above).
3.3.2. Rapid Reduction of CuZ° for Catalysis
The sodium ascorbate reduction kinetic results presented above demonstrate that CuZ° is rapidly reduced by intramolecular electron transfer from CuA, while resting 1-hole CuZ* is not, with at least a 104-fold greater kIET to CuZ° relative to resting 1-hole CuZ*. Using the spectroscopically calibrated models for the CuZ° intermediate and resting CuZ* in Figures 8C,A, respectively, it is possible to explore the origin of this difference in intramolecular electron transfer rates, which is the basis for the functional role of CuZ° in turnover. Three parameters in Marcus Theory38 determine the rate of electron transfer: the free energy difference, which provides the driving force for the electron transfer (ΔG°); the reorganization energy, λ (the sum of inner sphere, λi (i.e., bond changes), and outer sphere, λo (i.e., solvation changes)); and the electronic coupling between the donor and acceptor sites in the electron transfer process, given by the matrix element HDA. Our computational results indicate that resting 1-hole CuZ° is metastable and +6.4 kcal/mol higher in energy than resting 1-hole CuZ*, resulting in an increased driving force for the IET, compared to resting 1-hole CuZ*. To evaluate whether a ΔΔG° of +6.4 kcal/mol is sufficient to account for the >104-fold faster electron transfer rate observed experimentally, we determined a value for λi using our computational models of CuZ° and resting CuZ* (see Supporting Information). The difference between the values obtained for CuZ° and resting 1-hole CuZ* is small, so λi for these sites can be treated as equal. Based on these computational λi values, values for λo obtained by comparison to the CuA and blue copper sites, and the experimentally determined λtotal for CuA, a chemically reasonable λtotal range of 0.5–1 eV for electron transfer from CuA to CuZ° or resting 1-hole CuZ* is obtained (see Supporting Information). Since there is no experimental value for HDA for electron transfer from CuA to CuZ° or resting 1-hole CuZ*, a wide range of possible values (0.001–0.5 cm−1) was considered based on estimates for related sites (see Supporting Information). Using these values, we calculate a range of ΔΔG° values in the limit where HDA and λ for ET from CuA to CuZ° and from CuA to resting 1-hole CuZ* are equal. This analysis indicates that a ΔΔG° of 5–10 kcal/mol is sufficient to produce a 104-fold faster electron transfer rate from CuA to CuZ°, which is consistent with the calculated ΔG of +6.4 kcal/mol of CuZ° relative to resting 1-hole CuZ*. Thus, the origin of the >104-fold increase in the rate of electron transfer from CuA to CuZ° relative to resting 1-hole CuZ* is thermodynamic, and the role of the hydrogen-bonded second sphere Lys397 is to stabilize the metastable CuZ° intermediate to provide the driving force required for rapid reduction of the 1-hole oxidized state during catalysis.
3.3.3. Reaction Coordinate for N–O Bond Cleavage
Having determined from spectroscopy and DFT calculations that the CuZ° intermediate is terminal-hydroxide coordinated to CuIV and stabilized by a hydrogen bond from Lys397, we extended our computational model to evaluate the insight this intermediate gives into the nature of the two electron transfer from the Cu4S cluster required to break the N–O bond. Previous computational studies of the reaction mechanism of N2OR have predicted that the product of N–O bond cleavage is a 2-hole intermediate with a μ-oxo or hydroxo ligand bridging the CuI–CuIV edge, with one electron transferred from CuIV to N2O at the transition state and the other from CuI upon the formation of the CuI–O bond of the bridged product.8,34 However, upon subsequent protonation and reduction, these species would yield inactive resting 1-hole CuZ* (i.e., a 1-hole scluster with a μ-hydroxo edge ligand), rather than the reactive 1-hole CuIV–OH CuZ° intermediate identified above. Using the experimentally validated computational models of 1-hole CuZ° and resting 1-hole CuZ* from section 3.3.1, we have explored the reaction coordinate for N–O bond cleavage, and subsequent protonation and reduction, to determine how the CuZ° intermediate arises from N–O bond cleavage.
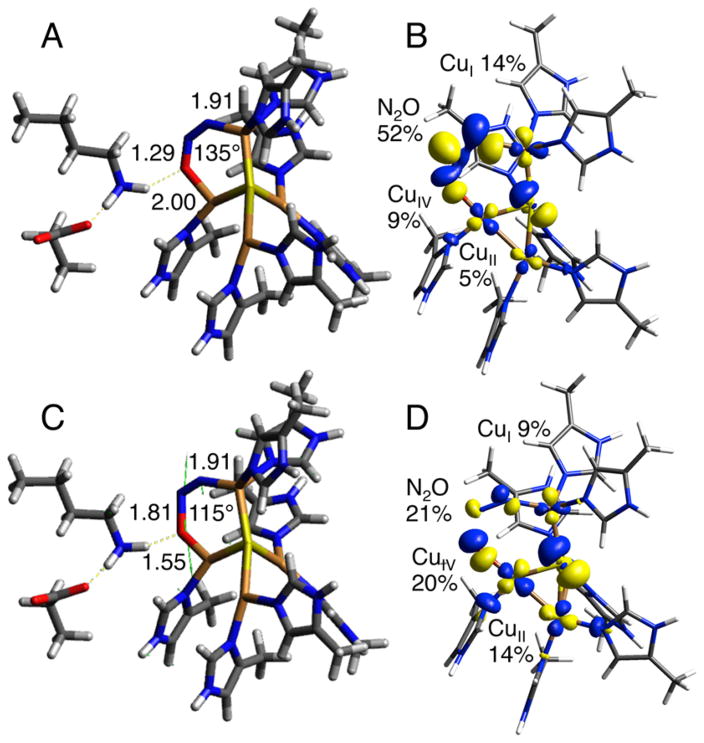
N2O coordination to the fully reduced cluster results in a linear N2O molecule terminally N-coordinated to CuI. However, upon N–O bond elongation by 0.1–0.2 Å to start the N–O bond cleavage reaction, the structure rearranges to form a μ-1,3 coordination geometry (Figure 9A), with the O of N2O coordinating to CuIV and hydrogen-bonded to Lys397. This suggests that the N–O bond cleavage reaction proceeds via the μ-1,3 isomer, consistent with the formation of a terminal CuIV–OH intermediate as the product. Using B3LYP, there is no stable structure for the μ-1,3 isomer (see Supporting Information). To investigate N–O bond cleavage from a stable μ-1,3 isomer, we performed additional calculations on the same structural model with the functional BP86 with 10% Hartree–Fock exchange (hereafter called B10HFP86, see Supporting Information). In the μ-1,3 isomer, backbonding is evident from CuI and CuIV into the N2O π* orbital that is in the CuI/CuIV/S/CuII plane (ip), at a lower energy due to the bent N–N–O angle of 135° (Figure 9B, Table S5). This lowers the energy of the N2O π* orbital that will receive the two electrons involved in N–O bond cleavage.
Figure 9.
Structures for fully reduced cluster with μ-1,3 N2O (A) and μ-1,3 TS for N–O bond cleavage (C), giving N–O, O–H, and CuI–N bond lengths in Å and the N–N–O angle. Contours for the LUMO of the fully reduced cluster with μ-1,3 N2O (B) and α LUMO of the μ-1,3 TS (D), with percentage on N2O, CuI, CuII, and CuIV. BP86 with 10% Hartree–Fock exchange and PCM of 10.
Upon N–O bond elongation (B10HFP86), a transition state (TS) for N–O bond cleavage is obtained at an N–O bond length of 1.81 Å (Figure 9C, 1.68 Å for B3LYP). This TS occurs at a ΔG‡ of 17.7 kcal/mol and a ΔE‡ of 6.1 kcal/mol (relative to fully reduced and free N2O; 17.3 and 10.3 kcal/mol, respectively, for B3LYP). These values are in the range of the experimental values of ΔG‡ = 13 ± 2 kcal/mol and ΔH‡ = 10 ± 1 kcal/mol determined for the rate-determining step of N2O reduction. At the TS, the distance between the N of Lys397 and the O of N2O has decreased from 2.92 to 2.63 Å, indicating that the strength of the Lys397–O hydrogen bond has increased, stabilizing the TS. However, the Lys N–H bond length is still short (1.10 Å at the TS relative to 1.03 Å for the reactants), indicating that the TS is early on the proton transfer coordinate, consistent with the small positive SKIE observed experimentally. We additionally considered the possibility of a transition state formed by μ-1,1-O or terminal CuI–O coordination of N2O, as has been proposed in a previous study.34 A terminal TS can be found using our model (Figure S16), but it is ~9 kcal/mol higher in energy compared to the μ-1,3 TS, with a ΔG‡ of 26.4 kcal/mol and a ΔE‡ of 19.7 kcal/mol (for B3LYP, see Supporting Information). Additionally, a terminal CuI–O or μ-1,1-O-bridged structure would give a bridging oxo or hydroxo product after N–O cleavage, which would result in resting 1-hole CuZ* rather than 1-hole CuZ°, where only the latter is capable of turnover. Thus, our model and the experimental identification of the CuZ° intermediate as a terminal CuIV–OH hydrogen bonded to Lys397 indicate that N–O bond cleavage in nitrous oxide reductase proceeds via the μ-1,3 TS.
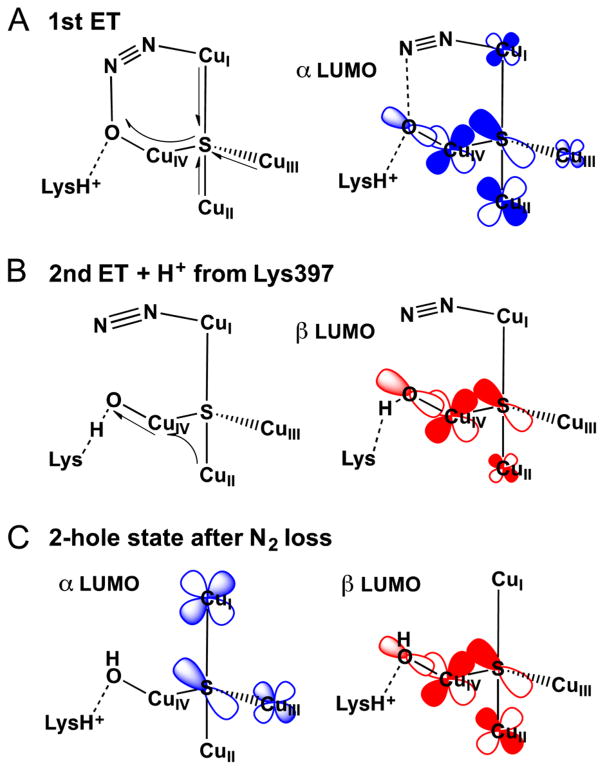
The μ-1,3 TS is a broken symmetry singlet, where the α LUMO, which for the reactant is dominantly ip N2O π* in character (52% N2O, with 30% Cu from backbonding, Figure 9B and Table S6), is now dominantly Cu and S based (48% Cu character, mostly delocalized over CuIV, 20%, and CuII, 16%, via the μ4S2, Figure 9D and Table S6). This indicates that an α electron has been transferred from the fully reduced cluster to N2O at the TS. This is supported by an increase in the Mulliken charge on N2O from −0.28 in the bound reactant to −0.5 at the transition state (Table S8). The electron has been donated via CuIV, which has the best overlap with the N2O ip π* orbital at the TS, as elongation of the N–O bond in bent N2O causes polarization of the ip π* orbital toward O relative to the reactants (the dominantly O based N2O σ* orbital has come down in energy and mixes with the ip π* orbital). Upon further N–O bond elongation past the TS, the α hole becomes delocalized over all four coppers in the cluster and the μ4S2− (Table S6), lowering the energy of the first electron transfer.
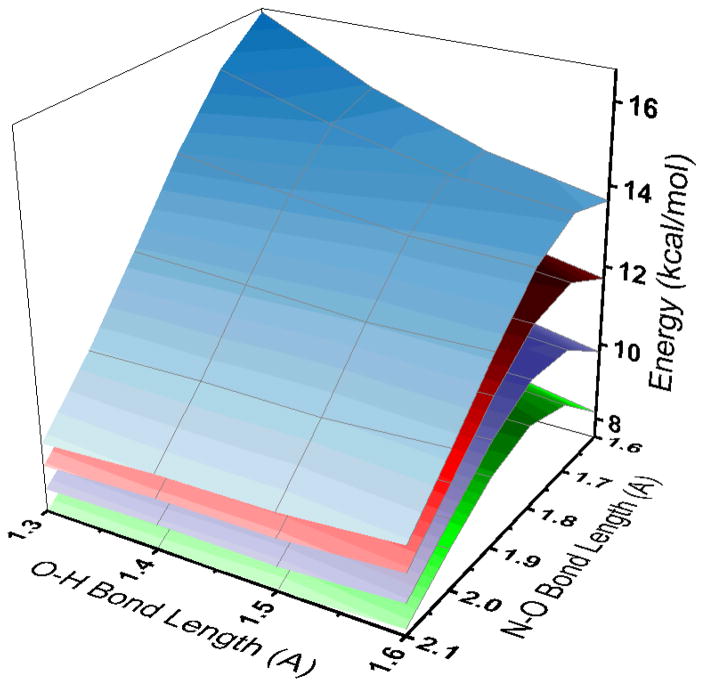
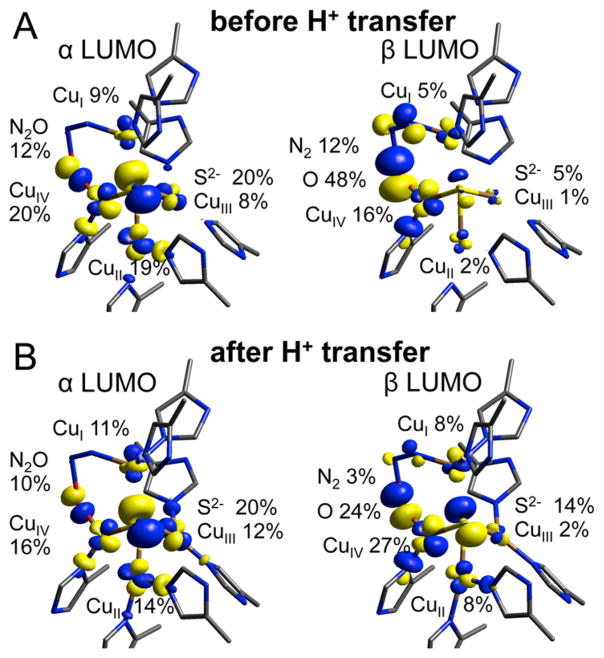
At the TS, the β LUMO remains dominantly N2O ip π* in character (Table S6), indicating that, as in previous studies, only one electron is required to transfer at the TS to break the N–O bond. The transfer of the second (β) electron to N2O occurs after the TS, as part of a concerted process involving three bond cleavage and formation steps: N–O cleavage, proton transfer from Lys397 to form an OH ligand at CuIV, and cleavage of the CuI–N bond to release N2. To determine the factors leading to transfer of the β electron, we performed 3D potential energy surface scans starting from the TS and scanning the N–O, O–H, and CuI–N distances in 0.1 Å steps (Figure 10, where the different surfaces correspond to different CuI–N distances). These surfaces show that transfer of the β electron from CuIV to N2O occurs together with proton transfer from Lys397 to N2O, which becomes favorable at an N–O bond distance of 2.1 Å (i.e., 0.3 Å after the TS). The transfer of the β electron is given by the changes in the β LUMO, which reflects uncompensated occupied orbital changes (Figure 11 at right, from top to bottom). At the start of the proton transfer (at N–O 2.1 Å, O–H 1.6 Å, and CuI-N 2.0 Å), the β LUMO is mainly oxyl in character (48% O), while the α LUMO is delocalized over CuIV (20%) and CuII (19%) (Figure 11A, Table S6, rows 4–5). As the proton transfers from Lys397 and N2 is released, the β LUMO shifts from the oxyl to CuIV to form a highly covalent CuIV(II)–OH (24% O and 27% CuIV, Figure 11B, Table S6, rows 6–7). After this proton transfer, the total Mulliken spin density reflects a broken symmetry singlet with one hole (α) delocalized over CuI and CuIII and the second hole (β) over CuIV and CuII (Table S7, row 3). Thus, the proton transfer drives the second electron transfer from CuIV to N2O during N–O bond cleavage. This emphasizes the importance of the hydrogen bond from Lys397 to N2O, which provides the proton necessary to trigger the second electron transfer from CuIV, required to complete the reaction and release N2.
Figure 10.
Three-dimensional potential energy surfaces for N–O bond cleavage, proton transfer from Lys397 (O–H coordinate), and CuI–N bond elongation (BP86 with 10% Hartree–Fock, PCM = 10). Each surface represents a different fixed CuI–N distance (2.0 Å green, 2.1 Å purple, 2.2 Å red, 2.3 Å blue). The N–O bond cleavage TS can be seen as a maximum on all surfaces at N–O ≈ 1.7 Å and O–H > 1.6 Å. Note that O–H transfer only decreases the energy at N–O distances after 2.0 Å.
Figure 11.
α and β LUMOs before (A) and after (B) proton transfer from Lys397, N–O 2.1 Å, CuI–N 2.0 Å.
Subsequent loss of N2, uptake of a proton from solvent to reprotonate Lys397, and rapid electron transfer from CuA are required to stabilize the CuZ° intermediate with a terminally coordinated hydroxide at CuIV (see Supporting Information). Without this additional proton or electron, loss of N2 would lead to formation of a μ-hydroxo bridged 2-hole or 1-hole cluster (i.e., CuZ*) that would be inactive. This is consistent with the importance of the hydrogen bond from Lys397 in stabilizing the higher energy metastable CuIV–OH product of N–O cleavage, which is required for rapid reduction of the catalytic site in turnover.
4. DISCUSSION
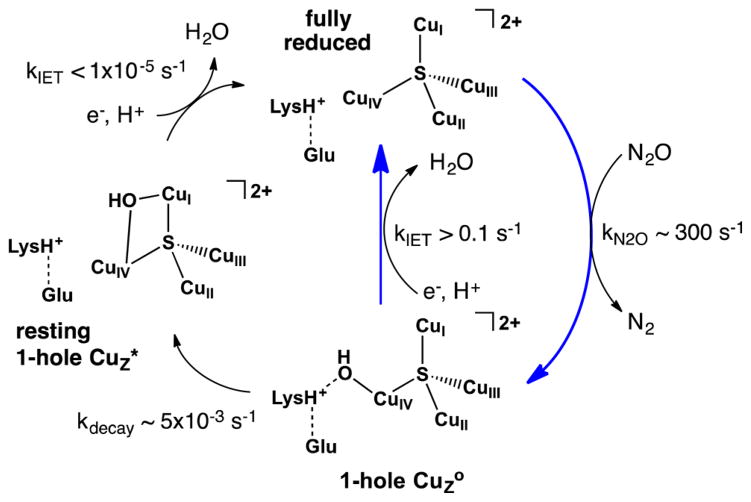
In this study, we have shown that the transient 1-hole CuZ° intermediate that initially forms (kobs ≈ 200 s−1)23 upon N2O reduction by fully reduced Cu4S-containing MhN2OR can be rapidly reduced by the physiologically relevant electron donor sodium ascorbate. The reduction of CuZ° via electron transfer from CuA in turnover with cytrochrome c552 is faster than the decay of CuZ° to the inactive resting 1-hole CuZ* state of the Cu4S cluster (Scheme 1).26 This indicates that N2O reduction by the Cu4S active site of N2OR bypasses the resting 1-hole CuZ* state, which is not reduced by physiologically relevant reductants; instead, the 1-hole CuZ° intermediate is the relevant 1-hole oxidized state of the Cu4S cluster during turnover. Here, we have defined the nature of this 1-hole CuZ° intermediate and elucidated how it differs from the resting 1-hole CuZ* state and thus determined the origin of its rapid reduction via CuA. Further, the nature of CuZ° produces an important insight into the mechanism of N2O reduction by the Cu4S active site of N2OR and the role of the tetranuclear μ4S2− bridged cluster in this process.
Scheme 1.
Pathways of CuZ° Formation, Reduction, and Decay to Resting 1-Hole CuZ* with Relevant Rates, with Blue Arrows Showing Steps Involved in Catalytic Turnover
4.1. Identification of 1-Hole CuZ° and Differences with Resting 1-Hole CuZ*
EPR, absorption, MCD, and resonance Raman spectroscopies correlated to DFT calculations have been used to develop a model for the 1-hole CuZ° intermediate. The EPR A|| values for CuZ° show that the spin is delocalized over two coppers, differing from the ~5:2 distribution of spin over CuI and CuIV observed in resting 1-hole CuZ*.35 Differences in the relative intensities of the μ4S2− to Cu CT transitions between CuZ° and resting 1-hole CuZ* indicate (from the pseudo-A term MCD analysis) that this spin redistribution is due to a decrease in spin density on CuI and an increase in spin density on CuIV. The resonance Raman spectrum of the CuZ° intermediate shows two Cu–S stretching vibrations, an intense mode at 426 cm−1 and a weak mode at 413 cm−1, which exhibits a −3 cm−1 shift when CuZ° is formed in O18 labeled water. H2O18 isotope sensitivity in a Cu–S stretching mode indicates that there is a solvent-exchangeable hydroxide ligand on the CuI–CuIV edge, as this leads to Cu–O stretches that are high enough in energy to mix with the Cu–S vibrations of the Cu4S core. Chemically reasonable models for the CuZ° intermediate were investigated with DFT calculations, and from correlation to the spectral features of CuZ°, only a CuIV–OH model stabilized by hydrogen bonding to a protonated second sphere Lys397 reproduces the shift of the spin density from CuI to CuIV and the H2O18 isotope shift in a high energy Cu–S vibration. We thus identify the 1-hole CuZ° intermediate as having a hydroxide ligand bound terminally to CuIV and hydrogen bonded to Lys397 (Figure 8C and Scheme 1).
This model elucidates the nature of the differences between 1-hole CuZ° (the transient intermediate formed from N2O reduction) and 1-hole CuZ* (the stable resting form that results from CuZ° decay). Both of these 1-hole states of the Cu4S cluster have a hydroxide edge ligand, but in CuZ° the hydroxide is terminally coordinated to CuIV (calculated CuIV–OH of 1.93 Å) while in resting 1-hole CuZ* the hydroxide asymmetrically bridges the CuI–CuIV edge, with a stronger interaction with CuI than with CuIV (CuI–OH of 2.00 Å, CuIV–OH of 2.09 Å). The barrier for decay of 1-hole CuZ° to the μOH bridged resting 1-hole CuZ* (Scheme 1, bottom) thus arises from breaking the hydrogen bond to Lys397 before the bond with CuI is formed. This is consistent with the pH dependence observed for steady-state turnover, which indicates that Lys397 must be protonated for catalytic activity. It also provides an explanation for the reported pH dependence of the turnover-dependent inactivation of MhN2OR, which suggests that the decay of the CuZ° intermediate is more rapid at higher pH,27 as deprotonation of Lys397 will lower the barrier for decay of CuZ° to resting 1-hole CuZ*.
The key difference in reactivity between the 1-hole CuZ° intermediate and resting 1-hole CuZ* is that CuZ° is rapidly reduced in turnover while resting 1-hole CuZ* is not. Reduction studies with sodium ascorbate as the electron donor show that 1-hole CuZ° is rapidly reduced via intramolecular electron transfer from CuA (with a lower limit on the kIET of 0.1 s−1; to be consistent with the steady-state activity of MhN2OR, this intramolecular ET rate must be greater than kcat = 320 s−1),26 while resting 1-hole CuZ* is not reduced by electron transfer from CuA (with an upper limit on kIET of 1 × 10⁻⁵ s−1). The greater than 104-fold faster rate of reduction of CuZ° compared to resting 1-hole CuZ* reflects the higher energy (calculated at +6.4 kcal/mol) of the metastable CuZ° intermediate, which provides a greater driving force for electron transfer from CuA to CuZ° relative to resting 1-hole CuZ*. Thus, in turnover the second sphere of the Cu4S cluster is tuned to stabilize the higher energy CuZ° intermediate, a kinetic product of turnover, so that it has a long enough lifetime that reduction by CuA can occur faster than the decay of CuZ° to inactive resting 1-hole CuZ*. Importantly, second-sphere stabilization of CuZ° reflects the effect of the Lys397 hydrogen bond to the terminal hydroxide coordinated at CuIV.
4.2. Mechanistic Insight into N2O Reduction
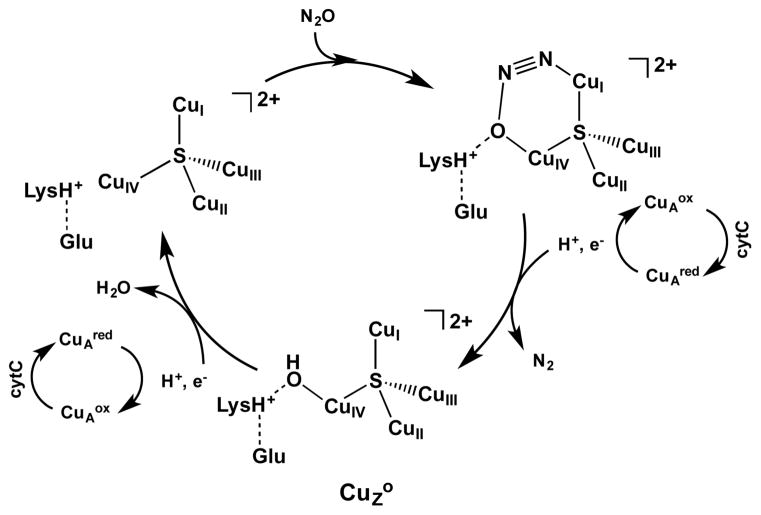
The identification of 1-hole CuZ° as a CuIV–OH intermediate formed from N–O bond cleavage, which can be rapidly reduced by CuA, produces further insight into the mechanism of N2O reduction by the Cu4S cluster in N2OR. First, it emphasizes the importance of a key asymmetry in the N2OR active site. The second sphere residue Lys397 is positioned to provide a hydrogen bond only to a ligand coordinated to the CuIV of the open CuI–CuIV edge. This stabilizes the CuZ° intermediate by creating a barrier to the decay of its terminal CuIV–OH to form the μOH bridged resting state. The presence of protonated Lys397 near CuIV also influences the mechanism of N2O reduction at the CuI–CuIV edge to lead to a nonbridging product. Previous computational descriptions of the reaction coordinate for N–O bond cleavage by the 4CuI state of the Cu4S cluster included either no hydrogen bond donation or hydrogen bond donation by a flexible donor molecule (water or formate).8,34 These studies proposed several possible modes for N2O coordination at the CuI–CuIV edge, including terminal O–CuI, μ-1,1-O bridging CuI and CuIV, and μ-1,3 bridging (CuIV–O and CuI–N). However, in these reaction coordinate calculations, the product of N–O bond cleavage was either a bridging oxo or hydroxo 2-hole intermediate. Upon subsequent protonation and reduction by CuA, these would produce the inactive resting 1-hole CuZ* state. In the present study, the reaction coordinate developed in section 3.3.3 includes the presence of protonated Lys397 and starts with μ-1,3 coordination of N2O to the fully reduced (CuI4S) cluster. In this binding mode, the CuIV–O interaction and the Lys397 hydrogen bond is already formed before N–O bond cleavage, precluding the interaction between the O of N2O and CuI. Upon N–O bond cleavage, proton transfer from Lys397, and proton coupled electron transfer from CuA, the 1-hole CuZ° intermediate is formed with a terminal hydroxide coordinated to CuIV. The transition state obtained for this N–O bond cleavage process is consistent with the experimental temperature dependence of the reduction of N2O by N2OR under steady-state turnover conditions, which gives the kinetic parameters ΔEA = 10 ± 2 kcal/mol and ΔG‡ = 13 ± 2 kcal/mol and a small normal solvent kinetic isotope effect of 1.1 for the rate limiting step. This mechanism is summarized in Scheme 2.
Scheme 2.
Mechanism of N2O Reduction by the Cu4S Active Site of N2OR
4.3. Role of the Cu4S Cluster in N2O Reduction
The formation of a terminal CuIV–OH intermediate after N–O bond cleavage indicates that the two electron transfer from the 4CuI cluster required for N2O reduction proceeds by a significantly different mechanism than previously proposed. Computational studies of N–O bond cleavage with N2O coordinated between CuI and CuIV indicated that one electron is transferred from CuIV at the transition state and the other transfers from CuI upon formation of the CuI–O2− bond later in the reaction coordinate.8,34 However, the experimentally observed CuZ° intermediate has a terminal hydroxide bound to CuIV and lacks a CuI–O interaction, so in N–O bond cleavage both electrons must be transferred to N2O via CuIV.
Examination of the electronic structure changes during N–O bond cleavage (Figures 10 and 11) indicates that this two electron transfer process involves all four coppers in the cluster. The first electron is transferred via CuIV to break the N–O bond at the transition state. The involvement of CuIV is due to the increased O character in the N2O LUMO upon N–O bond elongation. The resulting first electron is delocalized over the other three coppers in the Cu4S cluster via the μ4S2− bridge, which provides a good superexchange pathway, lowering the energy of the first electron transfer (Scheme 3A). Subsequently, proton transfer from Lys397 to form the terminal hydroxide ligand at CuIV results in the transfer of a second electron, again via CuIV, which occurs after the N–O bond is broken (Scheme 3B). Proton uptake from solvent and loss of N2 leads to a 2-hole intermediate where one hole is delocalized over CuI and CuIII and the other is delocalized over CuII and CuIV (Scheme 3C).
Scheme 3.
MO Depictions of the First and Second Electron Transfer from the Fully Reduced (4CuI) Cu4S Cluster to μ-1,3 N2O: (A) First Electron Transfer via CuIV; (B) Second Electron Transfer via CuIV with Concerted Protonation of Lys397; (C) α and β LUMOs of the Product 2-Hole CuIV–OH State
This mechanism for two electron transfer via a single Cu center elucidates the role of a tetranuclear copper cluster as the active site for N2OR. In other systems, for example, the zeolite Cu-ZSM-5, N2O is reduced by a binuclear copper site with no bridging ligands to provide a superexchange pathway between the copper centers.39 In the zeolite system, N2O must coordinate in a μ-1,1-O mode, so that one electron can transfer from one Cu at the TS and the second electron from the other, leading to an oxo bridged product that is active in the zeolite but would be inactive in the N2OR enzymatic system. To avoid this, the Cu4S cluster stabilizes the O at CuIV using second sphere hydrogen bonding and thus has a very covalent μ4-bridging sulfide ligand, which provides sufficiently good superexchange that both electrons can be transferred to N2O via one copper center (CuIV). While this could potentially be accomplished by a binuclear copper site with a bridging sulfide, our previous computational study of the Cu4S cluster suggests that the sulfide in a Cu2S cluster would be highly susceptible to protonation and the resulting μSH would not be an effective superexchange pathway.8 The presence of two additional coppers in the tetranuclear cluster protects the μ4S2− from protonation, maintaining the good superexchange that is necessary for two electron transfer via a single copper center.
Thus, the Cu4S active site of N2OR is optimized to reduce N2O asymmetrically, generating a 1-hole intermediate, CuZ°, that has a hydroxide ligand terminally coordinated to CuIV. CuZ° can be rapidly reduced in turnover via electron transfer from CuA, providing a mechanism by which the Cu4S cluster can reduce N2O using physiologically relevant electron donors. This excludes the inactive resting 1-hole CuZ* state from the catalytic cycle and shows that the Cu4S form of the N2OR active site is competent for nitrous oxide reduction in vivo.
5. CONCLUSIONS
EPR, absorption, MCD, and resonance Raman spectroscopies coupled to DFT calculations have defined the nature of the CuZ° intermediate observed in the single turnover reaction of fully reduced N2OR with N2O. The CuZ° intermediate has a hydroxide ligand terminally coordinated to CuIV, stabilized by a second sphere hydrogen bond to the protonated Lys397. The decay of this intermediate, which leads to inactivation of N2OR, involves breaking the hydrogen bond between Lys397 and the hydroxide to form the μOH bridged resting 1-hole CuZ* state. Unlike resting 1-hole CuZ*, the 1-hole CuZ° intermediate can be rapidly reduced, via electron transfer from CuA, by physiologically relevant reductants. The higher energy of metastable CuZ° relative to resting 1-hole CuZ* provides the additional driving force necessary for the rapid reduction of CuZ° in turnover. The terminal hydroxide coordination in CuZ° suggests a mechanism for N2O reduction by the fully reduced Cu4S cluster, in which N2O bridges in a μ-1,3 CuIV–ON2–CuI structure and the two electrons required for N–O bond cleavage are both transferred through the μ 4S2− bridge via the CuIV center.
Supplementary Material
Acknowledgments
This research was supported by the NIH Grant DK-31450 (E.I.S.), a Stanford Graduate Fellowship (E.M.J.), and financial support from the Fundação para a Ciência e Tecnologia to I.M. (PTDC/QUI-BIQ/116481/2010 and PTDC/BBB-BQB/0129/2014) and to C.C. (SFRH/BD/87898/2012). This work was also supported by the Unidade de Ciências Biomoleculares Aplicadas-UCIBIO, which is financed by national funds from FCT/MEC (UID/Multi/04378/2013) and cofinanced by the ERDF under the PT2020 Partnership Agreement (POCI-01-0145-FEDER-007728). S.R.P. is an IF fellow supported by FCT. The content is solely the responsibility of the authors and does not necessarily represent the official views of the National Institutes of Health.
Footnotes
The authors declare no competing financial interest.
The Supporting Information is available free of charge on the ACS Publications website at DOI: 10.1021/jacs.6b13225.
CuZ° spectra with details of CuA subtraction, table of bands and assignments for CuZ° and CuZ* absorption and MCD spectra, resonance Raman spectrum and profile for resting 1-hole CuZ*, kinetic schemes, description of kinetics fitting, and supplemental experiments for CuZ° reduction by sodium ascorbate, description of computational modeling of resting 1-hole CuZ*, details of DFT calculations including Cu4S models for CuZ° and their vibrational assignments, calculated transition state for CuZ° decay, estimates of λtotal, HDA, and ΔΔG° for Marcus Theory analysis, additional discussion of the computational reaction coordinate of N–O bond cleavage with 2D PES and tables of Mulliken atomic spin density and Mulliken charges during 2 electron transfer from CuI4S to N2O, μ-1,1-O TS for N–O cleavage, and coordinates for key structures used for DFT calculations (PDF)
References
- 1.Bates BC, Kundzewicz ZW, Wu S, Palutikof JP, editors. Climate Change and Water. Technical Paper of the Intergovernmental Panel on Climate Change. IPCC Secretariat; Geneva: 2008. [Google Scholar]
- 2.Ravishankara AR, Daniel JS, Portmann RW. Science. 2009;326:123. doi: 10.1126/science.1176985. [DOI] [PubMed] [Google Scholar]
- 3.Richardson D, Felgate H, Watmough N, Thomson A, Baggs E. Trends Biotechnol. 2009;27:388. doi: 10.1016/j.tibtech.2009.03.009. [DOI] [PubMed] [Google Scholar]
- 4.Thomson AJ, Giannopoulos G, Pretty J, Baggs EM, Richardson DJ. Philos Trans R Soc, B. 2012;367:1157. doi: 10.1098/rstb.2011.0415. [DOI] [PMC free article] [PubMed] [Google Scholar]
- 5.Tavares P, Pereira AS, Moura JJG, Moura I. J Inorg Biochem. 2006;100:2087. doi: 10.1016/j.jinorgbio.2006.09.003. [DOI] [PubMed] [Google Scholar]
- 6.Zumft WG, Kroneck PMH. Adv Microb Physiol. 2006;52:107. doi: 10.1016/S0065-2911(06)52003-X. [DOI] [PubMed] [Google Scholar]
- 7.Pauleta SR, Dell’Acqua S, Moura I. Coord Chem Rev. 2013;257:332. [Google Scholar]
- 8.Gorelsky SI, Ghosh S, Solomon EI. J Am Chem Soc. 2006;128:278. doi: 10.1021/ja055856o. [DOI] [PubMed] [Google Scholar]
- 9.Prudencio M, Pereira AS, Tavares P, Besson S, Cabrito I, Brown K, Samyn B, Devreese B, Van Beeumen J, Rusnak F, Fauque G, Moura JJG, Tegoni M, Cambillau C, Moura I. Biochemistry. 2000;39:3899. doi: 10.1021/bi9926328. [DOI] [PubMed] [Google Scholar]
- 10.Brown K, Tegoni M, Prudencio M, Pereira AS, Besson S, Moura JJ, Moura I, Cambillau C. Nat Struct Biol. 2000;7:191. doi: 10.1038/73288. [DOI] [PubMed] [Google Scholar]
- 11.Rasmussen T, Berks BC, Sanders-Loehr J, Dooley DM, Zumft WG, Thomson AJ. Biochemistry. 2000;39:12753. doi: 10.1021/bi001811i. [DOI] [PubMed] [Google Scholar]
- 12.Brown K, Djinovic-Carugo K, Haltia T, Cabrito I, Saraste M, Moura JJG, Moura I, Tegoni M, Cambillau C. J Biol Chem. 2000;275:41133. doi: 10.1074/jbc.M008617200. [DOI] [PubMed] [Google Scholar]
- 13.Alvarez ML, Ai JY, Zumft W, Sanders-Loehr J, Dooley DM. J Am Chem Soc. 2001;123:576. doi: 10.1021/ja994322i. [DOI] [PubMed] [Google Scholar]
- 14.Farrar JA, Neese F, Lappalainen P, Kroneck PMH, Saraste M, Zumft WG, Thomson AJ. J Am Chem Soc. 1996;118:11501. [Google Scholar]
- 15.Kroneck PMH, Kastrau DHW, Antholine WE. J Inorg Biochem. 1992;47:19. [Google Scholar]
- 16.Psomas G, Kessissoglou DP. Dalton Trans. 2013;42:6252. doi: 10.1039/c3dt50268f. [DOI] [PubMed] [Google Scholar]
- 17.Chen P, Cabrito I, Moura JJG, Moura I, Solomon EI. J Am Chem Soc. 2002;124:10497. doi: 10.1021/ja0205028. [DOI] [PubMed] [Google Scholar]
- 18.Rasmussen T, Berks BC, Butt JN, Thomson AJ. Biochem J. 2002;364:807. doi: 10.1042/BJ20020055. [DOI] [PMC free article] [PubMed] [Google Scholar]
- 19.Oganesyan VS, Rasmussen T, Fairhurst S, Thomson AJ. Dalton Trans. 2004:996. doi: 10.1039/b313913a. [DOI] [PubMed] [Google Scholar]
- 20.Ghosh S, Gorelsky SI, DeBeer George SD, Chan JM, Cabrito I, Dooley DM, Moura JJG, Moura I, Solomon EI. J Am Chem Soc. 2007;129:3955. doi: 10.1021/ja068059e. [DOI] [PMC free article] [PubMed] [Google Scholar]
- 21.Pomowski A, Zumft WG, Kroneck PMH, Einsle O. Nature. 2011;477:234. doi: 10.1038/nature10332. [DOI] [PubMed] [Google Scholar]
- 22.Dell’Acqua S, Pauleta SR, Moura JJG, Moura I. Philos Trans R Soc, B. 2012;367:1204. doi: 10.1098/rstb.2011.0311. [DOI] [PMC free article] [PubMed] [Google Scholar]
- 23.Johnston EM, Dell’Acqua S, Ramos S, Pauleta SR, Moura I, Solomon EI. J Am Chem Soc. 2014;136:614. doi: 10.1021/ja411500p. [DOI] [PMC free article] [PubMed] [Google Scholar]
- 24.Chan JM, Bollinger JA, Grewell CL, Dooley DM. J Am Chem Soc. 2004;126:3030. doi: 10.1021/ja0398868. [DOI] [PubMed] [Google Scholar]
- 25.Ghosh S, Gorelsky SI, Chen P, Cabrito I, Moura JJG, Moura I, Solomon EI. J Am Chem Soc. 2003;125:15708. doi: 10.1021/ja038344n. [DOI] [PubMed] [Google Scholar]
- 26.Dell’Acqua S, Pauleta SR, Monzani E, Pereira AS, Casella L, Moura JJG, Moura I. Biochemistry. 2008;47:10852. doi: 10.1021/bi801375q. [DOI] [PubMed] [Google Scholar]
- 27.Dell’Acqua S, Pauleta SR, Paes de Sousa PM, Monzani E, Casella L, Moura JJG, Moura I. JBIC, J Biol Inorg Chem. 2010;15:967. doi: 10.1007/s00775-010-0658-6. [DOI] [PubMed] [Google Scholar]
- 28.Frisch MJ, Trucks GW, Schlegel HB, Scuseria GE, Robb MA, Cheeseman JR, Scalmani G, Barone V, Mennucci B, Petersson GA, Nakatsuji H, Caricato M, Li X, Hratchian HP, Izmaylov AF, Bloino J, Zheng G, Sonnenberg JL, Hada M, Ehara M, Toyota K, Fukuda R, Hasegawa J, Ishida M, Nakajima T, Honda Y, Kitao O, Nakai H, Vreven T, Montgomery JA, Jr, Peralta JE, Ogliaro F, Bearpark M, Heyd JJ, Brothers E, Kudin KN, Staroverov VN, Kobayashi R, Normand J, Raghavachari K, Rendell A, Burant JC, Iyengar SS, Tomasi J, Cossi M, Rega N, Millam JM, Klene M, Knox JE, Cross JB, Bakken V, Adamo C, Jaramillo J, Gomperts R, Stratmann RE, Yazyev O, Austin AJ, Cammi R, Pomelli C, Ochterski JW, Martin RL, Morokuma K, Zakrzewski VG, Voth GA, Salvador P, Dannenberg JJ, Dapprich S, Daniels AD, Farkas O, Foresman JB, Ortiz JV, Cioslowski J, Fox DJ. Gaussian 09, revision D.01. Gaussian, Inc; Wallingford, CT: 2009. [Google Scholar]
- 29.Hanwell MD, Curtis DE, Lonie DC, Vandermeersch T, Zurek E, Hutchison GR. J Cheminf. 2012;4:17. doi: 10.1186/1758-2946-4-17. [DOI] [PMC free article] [PubMed] [Google Scholar]
- 30.Li Y, Cirino PC. Biotechnol Bioeng. 2014;111:1273. doi: 10.1002/bit.25240. [DOI] [PubMed] [Google Scholar]
- 31.Humphrey W, Dalke A, Schulten K. J Mol Graphics. 1996;14:33. doi: 10.1016/0263-7855(96)00018-5. [DOI] [PubMed] [Google Scholar]
- 32.Tenderholt AL. QMForge: A Program to Analyze Quantum Chemistry Calculations, version 2.3.2. http://qmforge.sourceforge.net.
- 33.Park K, Solomon EI. Can J Chem. 2014;92:975. doi: 10.1139/cjc-2014-0067. [DOI] [PMC free article] [PubMed] [Google Scholar]
- 34.Ertem MZ, Cramer CJ, Himo F, Siegbahn PEM. JBIC, J Biol Inorg Chem. 2012;17:687. doi: 10.1007/s00775-012-0888-x. [DOI] [PubMed] [Google Scholar]
- 35.Chen P, DeBeer George SD, Cabrito I, Antholine WE, Moura JJG, Moura I, Hedman B, Hodgson KO, Solomon EI. J Am Chem Soc. 2002;124:744. doi: 10.1021/ja0169623. [DOI] [PubMed] [Google Scholar]
- 36.Johnston EM, Dell’Acqua S, Pauleta SR, Moura I, Solomon EI. Chem Sci. 2015;6:5670. doi: 10.1039/c5sc02102b. [DOI] [PMC free article] [PubMed] [Google Scholar]
- 37.Heppner DE, Kjaergaard CH, Solomon EI. J Am Chem Soc. 2014;136:17788. doi: 10.1021/ja509150j. [DOI] [PMC free article] [PubMed] [Google Scholar]
- 38.Marcus RA, Sutin N. Biochim Biophys Acta, Rev Bioenerg. 1985;811:265. [Google Scholar]
- 39.Bhattacharyya S, Sarkar A, Dey SK, Jose GP, Mukherjee A, Sengupta TK. Dalton Trans. 2013;42:11709. doi: 10.1039/c3dt51296g. [DOI] [PubMed] [Google Scholar]
Associated Data
This section collects any data citations, data availability statements, or supplementary materials included in this article.


