Abstract
Flavonolignans constitute an important class of plant secondary metabolites formed by oxidative coupling of one flavonoid and one phenylpropanoid moiety. The standardized flavonolignan-rich extract prepared from the fruits of Silybum marianum is known as silymarin and has long been used medicinally, prominently as an antihepatotoxic and as a chemopreventive agent. Principal component analysis of the variation in flavonolignan content in S. marianum samples collected from different locations in Egypt revealed biosynthetic relationships between the flavonolignans. Silybin A, silybin B, and silychristin are positively correlated as are silydianin, isosilychristin, and isosilybin B. The detection of silyamandin in the extracts of S. marianum correlates with isosilychristin and silydianin content. The positive correlation between silydianin, isosilychristin, and silyamandin was demonstrated using quantitative 1H nuclear magnetic resonance spectroscopy (qHNMR). These correlations can be interpreted as evidence for the involvement of a flavonoid radical in the biosynthesis of the flavonolignans in S. marianum. The predominance of silybins A & B over isosilybin A & B in the silybin-rich samples is discussed in light of the relative stabilities of their respective radical flavonoid biosynthetic intermediates.
Keywords: Silybum marianum, Flavonolignans, Biosynthesis, Principal component analysis, qHNMR
1. Introduction
Flavonolignans are an important class of plant natural products. These compounds are a special class of lignans which are basically defined as dimers of substituted cinnamic alcohols. Biosynthetically flavonolignans result from oxidative coupling between a flavonoid moiety and a phenylpropanoid part. The flavonoid moiety can be taxifolin, eriodictyol, naringenin, chrysoeriol, tricin, luteolin, apigenin, or quercetin. Coniferyl alcohol, a monolignol, constitutes the phenyl-propanoid part in most flavonolignans [1]. The direct precursors of the flavonolignans, the flavonoids and monolignols, are synthesized via the phenylpropanoid pathway transforming phenylalanine into 4-coumaroyl-CoA [2]. Cloning and characterization of a full-length chalcone synthase cDNA and one partial gene from S. marianum that is probably involved in flavonolignan biosynthesis have been reported recently [3].
The silybins A & B, isosilybins A & B, silychristin A, isosilychristin, and silydianin are the major flavonolignans produced by the fruits of Silybum marianum (L.) Gaertn. var. purple (Asteraceae). They are formed by oxidative coupling of a taxifolin flavanonol precursor and a coniferyl alcohol [4–5]. The standardized extract of S. marianum fruits is known as silymarin and has long been used for the treatment of chronic inflammatory liver diseases [6] and more recently for prostate cancer chemoprevention [7]. Silandrin, isosilandrin, silyhermin, and silymonin have been isolated from the fruits of white-flowered S. marianum, var. albiflorum, growing in Hungary [8–10] and identified as 3-deoxy-isosilybin, 3-deoxy-silybin, 3-deoxy-silychristin and 3-deoxy-silydianin, respectively. Accordingly, eriodictyol constitutes the flavonoid moiety of these 3-deoxy flavonolignans.
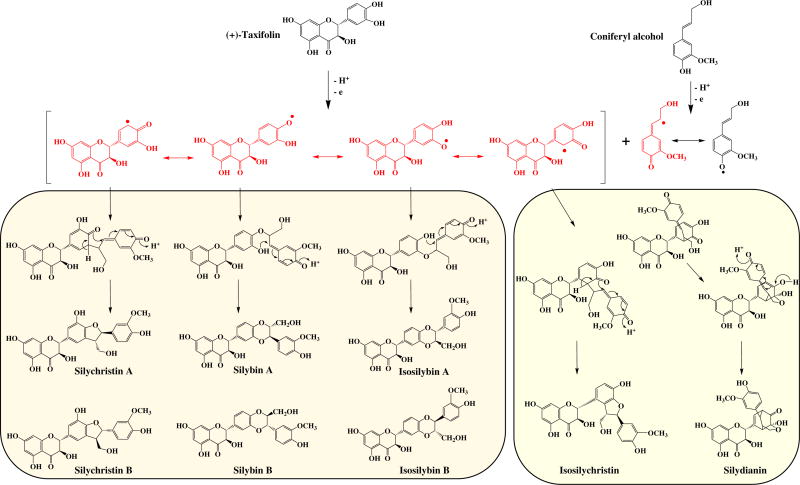
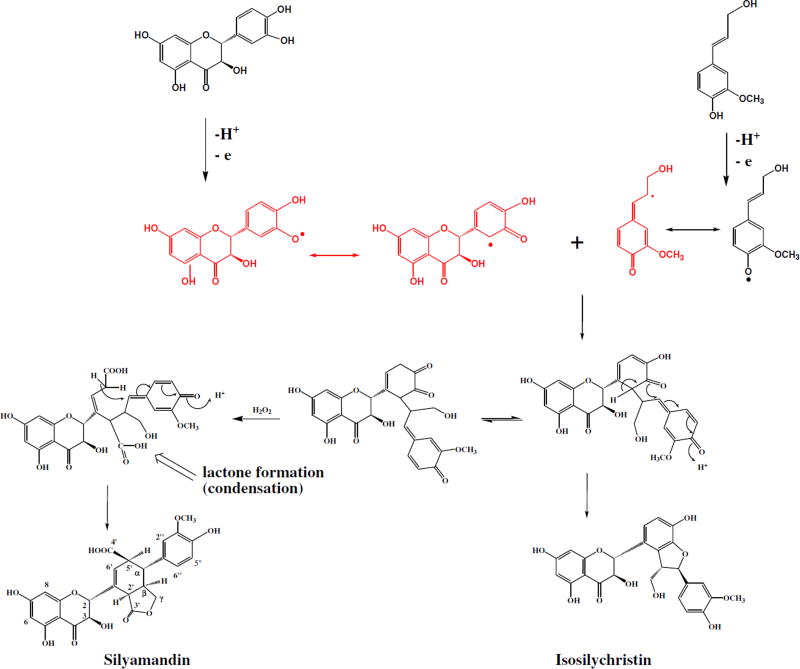
The oxidative coupling reaction between the flavonoid precursor and coniferyl alcohol is probably catalyzed by a peroxidase enzyme. These enzymes are known to be radical generators. According to the most accepted hypothesis, flavonolignans are likely biosynthesized by oxidative radicalization of their flavonoid precursors and coniferyl alcohol, followed by coupling of the two radicals. The enzyme catalyzing the oxidative coupling of flavonolignans has not yet been characterized. However, in vitro synthesis of flavonolignans (silybinins) was achieved by peroxidase (EC 1.11.1.7) of S. marianum cell suspension culture [11]. This reaction is initiated by one-electron oxidation of (+)-taxifolin to a phenoxy radical that couples with a quinone methide radical, generated from coniferyl alcohol. Subsequent intramolecular nucleophilic attack of the hydroxyl group of ring B of the flavonoid part on the quinone methide ring produces the silybins and isosilybins. Silychristin A, isosilychristin, and silydianin are derived from mesomeric forms of the taxifolin-derived free radical (Fig. 1). This reaction pathway is neither regionor enantiospecific [12], which would explain the large structural diversity of isomers produced and points to simple radical thermodynamics as being the determining factor of their relative distribution.
Fig. 1.
Biosynthetic pathways for Silybum marianum flavonolignans.
We reported previously on the principal component analysis (PCA) of the variation of the flavonolignan content in S. marianum fruits collected from different locations in Egypt [13]. The focus of the current report is the analysis of correlations between variables from the previous PCA analysis and variables related to the contents of all major flavonolignans detectable by HPLC. This data is subsequently used to establish potential biosynthetic links between the flavonolignan as indicators of biosynthetic pathways.
2. Materials and methods
2.1. Plant material
S. marianum fruits were collected from wild populations growing in nine different locations in Egypt including Assiut, Beni-Suef, Qaliubiya, Menofia, El-Beheira, Alexandria, and the Cairo-Alexandria desert road. The exact latitudes and longitudes of the locations were previously reported [13]. This work analyzed most, but not all, of the extracts from these samples.
2.2. Extraction and analysis
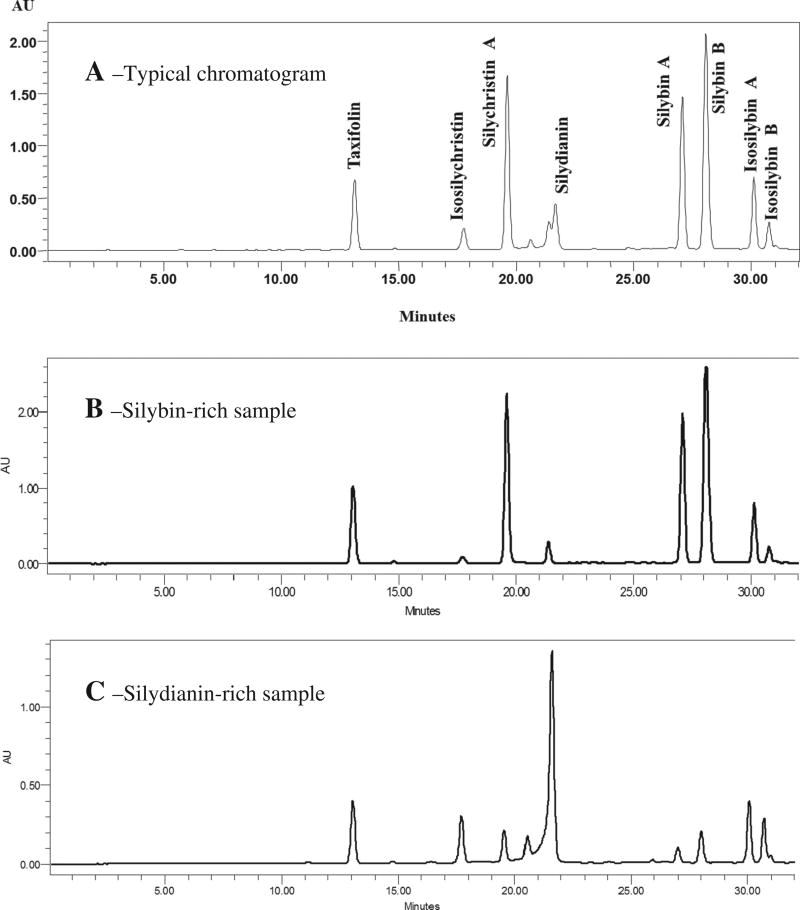
Flavonolignans were extracted from S. marianum fruits collected from different locations using Accelerated Solvent Extraction on a Dionex ASE350 instrument (Dionex Corporation, Sunnyvale, CA, USA) as previously described [13]. A validated HPLC method carried out on a Waters Alliance 2695 equipped with a PDA and an Agilent ZORBAX SB-C18 column were used to determine the content of flavonolignans as previously described [13]. A gradient of MeOH and H2O/0.1% formic acid was used as mobile phase, starting at 30:70 and increasing linearly to 60:40 over 32 min. The flow rate was 1.0 ml/min, and ambient temperature was used. The extracts were reconstituted in 5 ml methanol, 10 µl were injected and quantified at 288 nm. The method yielded the following retention times (minutes) for the major silymarin compounds (Fig. 2A): taxifolin (Rt = 13.2), isosilychristin (Rt = 17.8), silychristin A (Rt = 19.7), silydianin (Rt = 21.5), silybin A (Rt = 27.1), silybin B (Rt = 28.1), isosilybin A (Rt = 30.2), and isosilybin B (Rt = 30.8).
Fig. 2.
HPLC chromatograms for analysis of flavonolignans in Silybum marianum samples collected in Egypt. A: typical chromatogram, B: chromatogram for silybin-rich sample, and C: chromatogram for silydianin-rich sample.
2.3. qHNMR analysis of S. marianum samples
An absolute qHNMR method was used to quantify silydianin and isosilychristin content in the extracts prepared from S. marianum samples. A Bruker Avance NMR spectrophotometer AV400 (9.4 T/400 MHz, Oxford magnets) equipped with a 5 mm Z-gradient probe BBO (broadband observe) and a computer with XWIN-NMR for acquisition and processing of the spectra was used for acquiring the 1H NMR spectra (400 MHz). Samples are weighed to 0.01 mg accuracy, dissolved in 600 µl of DMSO-d6 (Dimethylsulfoxide-d6, Lot no. 10E-645, Cambridge Isotope Laboratories, Inc., Andover, MA, USA) using a Pressure-Lok gas syringe (VICI Precision Sampling Inc., Baton Rouge, LA, USA), and transferred into 5 mm standard NMR tubes (NORELL Inc., Landisville, NJ, USA). The qHNMR spectrum was measured using quantitative acquisition and processing parameters as follows: single 90° 1H excitation pulse with GARP carbon decoupling; relaxation delay 60 s, acquisition time 4 s, number of scans 64, non-spinning mode, sample temperature 25 °C, data points 64 K, dummy scans 4, and preacquisition delay 59.57 µs. Probe tuning and matching were performed on each sample. 1HNMR data was analyzed by ACD NMR Manager Version 12.01. Interactive Fourier Transform allowed finding the most suitable FT parameters and spectrum phase adjusted correctly. Basic spectral manipulations such as zero filling, Fourier transform, phase correction, baseline correction, calibration, integration, and peak assignment were carried out. Zero filling was carried out to 262,144 (256 k) data points for digital resolution enhancement.
2.4. Silyamandin isolation
Silyamandin was isolated from pericarp that was separated from the fruits of S. marianum as previously reported [14]. The isolation scheme included a two-step column chromatography using silica gel and Sephadex LH20 as stationary phases. The 1H NMR spectra of silyamandin, isosilychristin, and silydianin were compared using ACD NMR manager version 12.01. The latter two flavonolignans were isolated in a previous study [13] and analyzed using the quantitative, acquisition and processing parameters mentioned earlier. The 1H NMR spectrum was measured on a Bruker Avance III 400 MHz for 1H (Bruker AG, Switzerland) equipped with a BBFO Smart Probe on a Bruker 400 AEON Nitrogen-Free Magnet NMR spectrometer. The following conditions were used: 30° pulse experiment; 4.1 second acquisition time; 1.0 second relaxation delay; 15.1 ppm (8012 Hz) sweep width; 2997.5464 Hz spectrum Offset; 65,536 data points and 2 dummy scans. The data were processed using line broadening 0.1 Hz. For each sample, 16 scans were acquired.
2.5. Statistical analysis
Multivariate data analysis was carried out using XLSTAT2016. PCA was used to visualize the correlations between the content of the major flavonolignans produced by the fruits of S. marianum. The Pearson test was used to calculate the linear correlation coefficients between the variables.
3. Results and discussion
3.1. PCA analysis of S. marianum samples
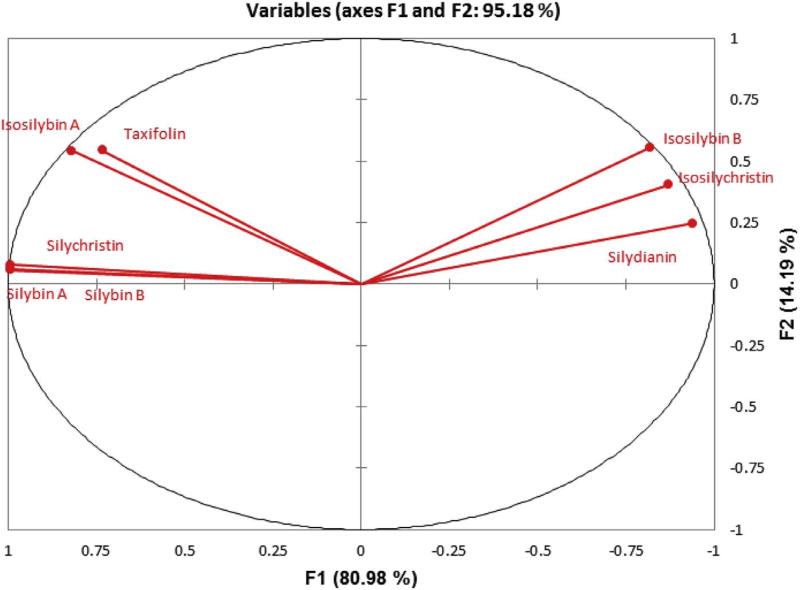
We previously reported the PCA of S. marianum samples collected from different locations in Egypt [13]. The samples (observations) were grouped into three categories (samples with an average silymarin content of < 18.8 mg/g, samples enriched in silymarin (> 18.8 mg/g), and silydianin-rich samples) and visualized into 2-D space according to the content of the major flavonolignans (variables). In the first two categories, silybin A, silybin B, and silychristin A were the predominant flavonolignans. Silydianin, isosilychristin, and the isosilybins were predominant in the third category. Fig. 2 shows HPLC chromatograms for samples of these categories, the silybin-rich (Fig. 2B) vs. the silydianin-rich (Fig. 2C) samples. The current report studies the correlations between the flavonolignans content (variables) and how these correlations can be explained according to their biosynthetic pathways. In the PCA analysis, the cumulative variability showed eight factors (F1–F8), with F1 (80.98%) and F2 (14.19%) representing 95.18% of the total variability.
PCA, as a method of exploratory data analysis, allowed formulating a number of hypotheses based on the correlations between variables. For example, in the current study, silybin A, silybin B, and silychristin showed a correlation in their relative abundance among the analyzed samples. This is evident from the acute angle between the vectors representing these variables/flavonolignans content in Fig. 3. Silydianin, isosilychristin, and isosilybin B are correlated to a lesser extent. Taxifolin had a positive correlation to silybins A and B, isosilybins A, and silychristin A. At the same time, taxifolin exhibited negative correlations to silydianin and isosilychristin. It can be seen that vectors representing the variables measured in this study are almost reaching the circumference of the circle in Fig. 3. This indicates that these variables are highly represented in the F1 and F2 space. The hypotheses extracted from the PCA variable analysis were statistically tested to either validate or reject the null hypothesis. A correlation test based on Pearson coefficient was undertaken. The alpha risk threshold was set at 0.05. The p-values resulting from the statistical test are shown in Table 1.
Fig. 3.
Correlation map showing the variables (flavonolignan contents) in the space of F1 and F2 representing 95.18% of variation among the analyzed Silybum marianum samples.
Table 1.
Correlation matrix and p-value tables showing the correlations between the variables (flavonolignan content). Values in bold are different from 0 with a significance level alpha = 0.05. Red > 0.99, orange > 0.82, yellow > 0.71.
| Variables | Silydianin | Isosilychristin | Isosilybin B | Taxifolin | Isosilybin A | Silybin B | Silychristin A | Silybin A |
|---|---|---|---|---|---|---|---|---|
| Correlation matrix | ||||||||
| Silydianin | 1 | |||||||
| Isosilychristin | 0.868 | 1 | ||||||
| Isosilybin B | 0.887 | 0.945 | 1 | |||||
| Taxifolin | –0.489 | –0.516 | –0.334 | 1 | ||||
| Isosilybin A | –0.666 | –0.451 | –0.354 | 0.821 | 1 | |||
| Silybin B | –0.932 | –0.811 | –0.772 | 0.718 | 0.865 | 1 | ||
| Silychristin A | –0.921 | –0.815 | –0.768 | 0.742 | 0.868 | 0.999 | 1 | |
| Silybin A | –0.933 | –0.817 | –0.776 | 0.721 | 0.862 | 1.000 | 0.999 | 1 |
| p–Values | ||||||||
| Silydianin | 0 | 0.000 | 0.000 | 0.064 | 0.007 | 0.000 | 0.000 | 0.000 |
| Isosilychristin | <0.0001 | 0 | <0.0001 | 0.049 | 0.092 | 0.000 | 0.000 | 0.000 |
| Isosilybin B | <0.0001 | <0.0001 | 0 | 0.224 | 0.196 | 0.001 | 0.001 | 0.001 |
| Taxifolin | 0.064 | 0.049 | 0.224 | 0 | 0.000 | 0.003 | 0.002 | 0.002 |
| Isosilybin A | 0.007 | 0.092 | 0.196 | 0.000 | 0 | <0.0001 | <0.0001 | <0.0001 |
| Silybin B | <0.0001 | 0.000 | 0.001 | 0.003 | <0.0001 | 0 | <0.0001 | <0.0001 |
| Silychristin A | <0.0001 | 0.000 | 0.001 | 0.002 | <0.0001 | <0.0001 | 0 | <0.0001 |
| Silybin A | <0.0001 | 0.000 | 0.001 | 0.002 | <0.0001 | <0.0001 | <0.0001 | 0 |
The Pearson correlation coefficient (ranging from −1 to +1) was used to measure the degree of linear correlation between the variations in content for each pair of flavonolignans. The correlation matrix (Table 1) confirmed the observed correlations with numerical values. For example, the Pearson coefficient for silybin A and silybin B was 1. This can be at least partially explained by the fact that the two diastereomers are formed from the same flavonoid radical and share the same biosynthetic pathway, except for the final non-stereoselective step (Fig. 1). However, a common observation in all of the analyzed samples was that the content of silybin B was higher than that of silybin A, and that the abundance of isosilybin A was elevated relative to that of isosilybin B.
A near unity positive correlation (0.999) was also found between silychristin A and silybins A and B. This can also be explained by the conception that silychristin A is formed from a mesomer of the 4′-O-taxifolin radical, which is considered to be responsible for formation of the silybins A & B. On the other hand, silydianin showed a strong positive correlation with isosilychristin and isosilybin B (Table 1, Fig. 3), with correlation coefficients of 0.868 and 0.887, respectively. Fig. 1 shows that silydianin and isosilychristin are formed from the same flavonoid radical, whereas isosilybin B can be formed from the mesomeric 3′-O-taxifolin radical.
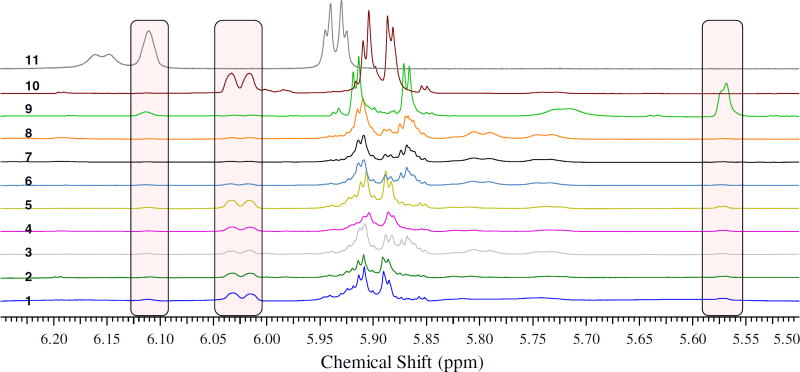
The positive correlation between silydianin and isosilychristin can also demonstrated using quantitative 1H nuclear magnetic resonance spectroscopy (qHNMR). Quantitative comparison between these two flavonolignans may be made by careful analysis of the spectra of crude extracts of eight S. marianum samples collected from different locations in Egypt. In these eight samples, silydianin and isosilychristin can be quantified using resonances corresponding to H-6′ of silydianin and H-α of isosilychristin. The 1H NMR spectra of extracts of the eight populations are shown in Fig. 4. The doublet at 6.01 ppm corresponds to the H-6′ of silydianin, and the multiplet at 5.57 ppm corresponds to the H-α of isosilychristin [13,15]. These two resonances are well isolated from others in the spectra of S. marianum extracts. The integral values of the two resonances were compared after correcting for the weights of the extract samples (Table 2). The residual protonated solvent signal (DMSO-d5) was set to an arbitrary value of 100. The correlation between the integral values corresponding to the content of the two flavonolignans was tested using the Spearman correlation test, a non-parametric statistical test used to measure correlation between quantitative variables of independent samples. The correlation coefficient between the two flavonolignans was 0.905 with a p-value equal to 0.005 at alpha risk threshold equal to 0.05.
Fig. 4.
Expanded regions of the spectra (5.50–6.20 ppm) measured for extracts prepared from eight samples of Silybum marianum collected from seven locations in Egypt. Numbers above each spectrum represent location from which the plant was collected; 1 = Qaliubiya, 2 = Cairo Alexandria desert road – white flowered variety, 3 = Alexandria, 4 = Beni-Suef, 5 & 6 = Cairo Alexandria desert road – purple flowered variety – black and brown fruit, respectively, 7 = Assiut, 8 = Cairo Alexandria desert road – purple flowered variety – creamy white fruits, 9 = isosilychristin, 10 = silydianin, and 11 = silyamandin. The residual protonated solvent signal (DMSO-d5) was used as a calibrant to compare the quantities of individual flavonolignans in the extracts.
Table 2.
qHNMR integrals corresponding to silydianin, isosilychristin, and silyamandin in extracts prepared from eight different samples of Silybum marianum growing in Egypt.
| Sample | Silydianin | Isosilychristin | Silyamandin |
|---|---|---|---|
| 1 | 0.774 | 0.082 | 0.083 |
| 2 | 0.617 | 0.078 | 0.062 |
| 3 | 0.325 | 0.036 | 0.033 |
| 4 | 0.318 | 0.043 | 0.024 |
| 5 | 0.260 | 0.042 | 0.043 |
| 6 | 0.126 | 0.029 | 0.029 |
| 7 | 0.101 | 0.022 | 0.022 |
| 8 | 0.108 | 0.018 | 0.013 |
3.2. Silyamandin hypothetical biosynthetic pathway
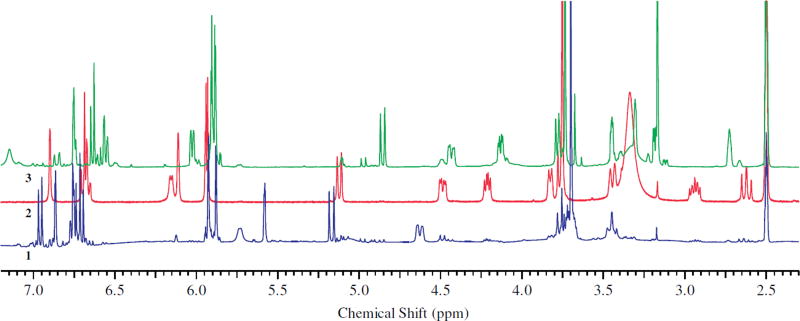
Quantitative analyses of the qHNMR spectra of the crude extracts of S. marianum populations revealed the presence of silyamandin. This flavonolignan was recently isolated from a tincture of S. marianum that had been incubated at 40 °C for 3 months [16] and postulated to have been formed via oxidative degradation of silydianin. The broad singlet at 6.11 ppm corresponding to the H-6′ of silyamandin, well-separated from other signals in the spectra of S. marianum extracts, was used to determine the silyamandin content. Table 2 shows the integral values of this resonance in spectra of S. marianum extracts. The same statistical test as mentioned earlier was used to demonstrate the correlation between silyamandin, silydianin, and isosilychristin. The correlation coefficient between silyamandin with the other two flavonolignans was 0.857 with a p-value equals to 0.011 at an alpha risk threshold of 0.05. This correlation shows the possible biosynthetic relationship between the three flavonolignans. Fig. 5 shows a possible biosynthetic scheme in which silyamandin, silydianin, and isosilychristin share the same precursor. This hypothetical biosynthetic pathway is at variance with the postulate that silyamandin is (exclusively) an artifact formed from oxidative coupling of silydianin. However, analysis of the 1H NMR spectra of isosilychristin and silydianin, previously isolated from S. marianum extract [13], showed the presence of 10.8% silyamandin as an impurity of isosilychristin (Fig. 6). An absolute qHNMR method was used to determine the silyamandin content in the isosilychristin sample using external calibration via the residual protonated solvent signal of DMSO-d5 as internal calibrant [17].
Fig. 5.
Hypothetical biosynthetic pathway of silyamandin.
Fig. 6.
1H NMR spectra (an expanded region 2.30–7.20 ppm) of isosilychristin (1, blue), silyamandin (2, red), and silydianin (3, green). (For interpretation of the references to color in this figure legend, the reader is referred to the web version of this article.)
Identification of the silyamandin was carried out by a detailed interpretation of its 1D 1H NMR spectrum, using a manual form of 1H iterative Full Spin Analysis (HiFSA). Utilizing the spin simulation tool of NUTS NMR software, the spin parameters (δ, J, half width) were extracted from the spectrum under first order assumptions and then refined by manual adjustment until the lines and intensities of the simulated matched those of the experimental spectrum. The observed characteristic J-patterns included several non-first order resonances and were fully consistent with the structure of silyamandin. While the data align well with those first reported by MacKinnon et al. [16], several of the previously reported coupling values and multiplicities require revision. Table 3 provides all chemical shifts and a comprehensive J-correlation map of silyamandin is represented in the form of a Quantum Interaction and Linkage Table (QuILT) [18].
Table 3.
The Quantum Interaction Linkage Table (QuILT) resulting from manual iterative full spin analysis (HiFSA) of the non-first order400 MHz 1D 1H NMR spectrum of silyamandin. Couplings less than an absolute value of 1.0 Hz are given as Φ. Cells in the upper right represent the number of bonds separating the two hydrogens. In the lower left are the observed coupling constants in Hz. The numbers of bonds separating two coupled nuclei are color-coded: violet = 2J, blue = 3J, yellow = 4J, green = 5J, and pink = 6J.
| ppm | mult. | H | H–2 | H–3 | OH–3 | H–6 | H–8 | H–2′ | H–5′ | H–6′ | H–α | H–β | H–γa | H–γb | H–2″ | H–5″ | H–6″ | OCH3 | COOH |
|---|---|---|---|---|---|---|---|---|---|---|---|---|---|---|---|---|---|---|---|
| 5.111 | dddd | H–2 | 3 | 4 | 7 | 5 | 4 | 5 | 4 | 6 | 5 | 6 | 6 | 8 | 9 | 8 | 11 | 7 | |
| 4.477 | ddddd | H–3 | 10.4 | 3 | 6 | 6 | 5 | 6 | 5 | 7 | 6 | 7 | 7 | 9 | 10 | 9 | 12 | 8 | |
| 6.144 | d(dd) | OH–3 | Φ | 4.8 | 7 | 7 | 6 | 7 | 6 | 8 | 7 | 8 | 8 | 10 | 11 | 10 | 13 | 9 | |
| 5.9176 | d | H–6 | Φ | Φ | Φ | 4 | 9 | 10 | 9 | 11 | 10 | 11 | 11 | 13 | 14 | 13 | 16 | 12 | |
| 5.9318 | d | H–8 | Φ | Φ | Φ | 2.1 | 7 | 8 | 7 | 9 | 8 | 9 | 9 | 11 | 12 | 11 | 14 | 10 | |
| 3.816 | ddd(d) | H–2′ | 1.2 | Φ | Φ | Φ | Φ | 5 | 4 | 4 | 3 | 4 | 4 | 6 | 7 | 6 | 9 | 7 | |
| 3.434 | dddd(d) | H–5′ | Φ | Φ | Φ | Φ | Φ | Φ | 3 | 3 | 4 | 5 | 5 | 5 | 6 | 5 | 8 | 4 | |
| 6.101 | dddd | H–6′ | Φ | Φ | Φ | Φ | Φ | 1.9 | Φ | 4 | 5 | 6 | 6 | 6 | 7 | 6 | 9 | 5 | |
| 2.612 | ddd | H–α | Φ | Φ | Φ | Φ | Φ | Φ | 10.7 | Φ | 3 | 4 | 4 | 4 | 5 | 4 | 7 | 5 | |
| 2.928 | dddd | H–β | Φ | Φ | Φ | Φ | Φ | 7.2 | Φ | Φ | 12.5 | 3 | 3 | 5 | 6 | 5 | 8 | 6 | |
| 4.202 | dddd | H–γa | Φ | Φ | Φ | Φ | Φ | Φ | Φ | Φ | Φ | 5.4 | 2 | 6 | 7 | 6 | 9 | 7 | |
| 3.758 | dddd | H–γb | Φ | Φ | Φ | Φ | Φ | Φ | Φ | Φ | Φ | Φ | 9.0 | 6 | 7 | 6 | 9 | 7 | |
| 6.8876 | d | H–2″ | Φ | Φ | Φ | Φ | Φ | Φ | Φ | Φ | Φ | Φ | Φ | Φ | d | 5 | 4 | 5 | 7 |
| 6.682 | d | H–5″ | Φ | Φ | Φ | Φ | Φ | Φ | Φ | Φ | Φ | Φ | Φ | Φ | Φ | 3 | 6 | 8 | |
| 6.654 | dd | H–6″ | Φ | Φ | Φ | Φ | Φ | Φ | Φ | Φ | Φ | Φ | Φ | Φ | 1.9 | 8.0 | 7 | 7 | |
| 3.850 | s | OCH3 | Φ | Φ | Φ | Φ | Φ | Φ | Φ | Φ | Φ | Φ | Φ | Φ | Φ | Φ | Φ | 10 | |
| 3.330 | brs | COOH | Φ | Φ | Φ | Φ | Φ | Φ | Φ | Φ | Φ | Φ | Φ | Φ | Φ | Φ | Φ | Φ |
The negative correlations of isosilybin A with isosilybin B, silydianin, and isosilychristin also challenge the alleged biosynthetically relationships of these flavonolignans according to the hypothetical scheme shown in Fig. 1. The p-values for the correlations between isosilybin A with isosilychristin and isosilybin B were 0.092 and 0.196, respectively. Notably, these values are higher than the alpha risk threshold taken when carrying out the statistical testing. This means that the null hypothesis is accepted in the two cases. Interestingly, isosilybin A was detected along with the silybins A and B from a fungal endophyte, Aspergillus iizukae, which had been isolated from the surface-sterilized leaves of S. marianum [19].
3.3. Taxifolin radical stability and flavonolignan biosynthesis
In silybin-rich samples (Fig. 2B), the content of the silybins A and B is usually higher than their corresponding regioisomers isosilybins A and B. The situation is reversed in silydianin-rich samples (Fig. 2C). A literature survey assessed the ratio between silybins and isosilybins in S. marianum grown in different countries and in tissue culture. Table 4 shows the difference in content between the silybins and the isosilybins in cultivars of S. marianum growing in Egypt, Iran, and Poland [13,20–24]. It also shows the difference in plant tissue culture systems established from the same plant. The silybins A & B consistently show a higher content than the isosilybins A and B, across different cultivars and tissue culture systems. It is plausible that both pairs of diastereomers share the same biosynthetic pathway except that the silybins A and B are formed from a 4′-O-taxifolin radical, while the isosilybin A & B are formed from a 3′-O-taxifolin radical.
Table 4.
Silybins/isosilybins ratios in different cultivars and tissue culture systems of Silybum marianum.
| Cultivar/tissue culture | Silybins/Isosilybins Ratio |
Reference |
|---|---|---|
| S. marianum var. purple, Nile delta, Egypt | 5.88 | [13] |
| S. marianum var. purple, Marzan Abad, Iran | 3.25 | [20] |
| S. marianum var. purple, Mockelek, Poland | 3.27 | [21] |
| Shoot tip culture of S. marianum | 3.38 | [22] |
| Hairy root culture of S. marianum | 1.15 | [23] |
| Untransformed root culture of S. marianum | 2.52 | [24] |
Flavonolignan biosynthesis (Fig. 1) shares a correlation with the well-studied antioxidant activity of its flavonoid moieties. Both processes involve the formation of a flavonoid free radical. This is in line with the observed correlations in light of the hypothetical biosynthetic scheme of flavonolignans and quantum chemistry studies on taxifolin radical formation. Two main mechanisms have been described in the literature for the free radical formation: H-atom abstraction (direct O—H bond breaking), and a one electron transfer (indirect H-atom abstraction) mechanism [25]. In the H-atom abstraction mechanism, a hydrogen atom is removed from a flavonoid hydroxyl group to form a radical, ArȮ.
Two important quantum parameters correlate with this reaction: O—H bond breaking and the stability of the formed radical ArȮ. The former is measured by the bond dissociation enthalpy (BDE) of the O—H bond, which is defined as the difference in heat of formation between the flavonoid and the corresponding radical. The weaker the O—H bond (low BDE), the faster the radical formation [26]. The ArȮ stability is determined by the number of hydrogen bonds, conjugation, and resonance effects.
In the one-electron transfer mechanism, an electron is removed from an oxygen atom of the hydroxyl group in the flavonoid to form a radical cation. The stability of this radical cation can be measured by the Ionization Potential (IP). It has been postulated that the formed cation is then rapidly deprotonated [26].
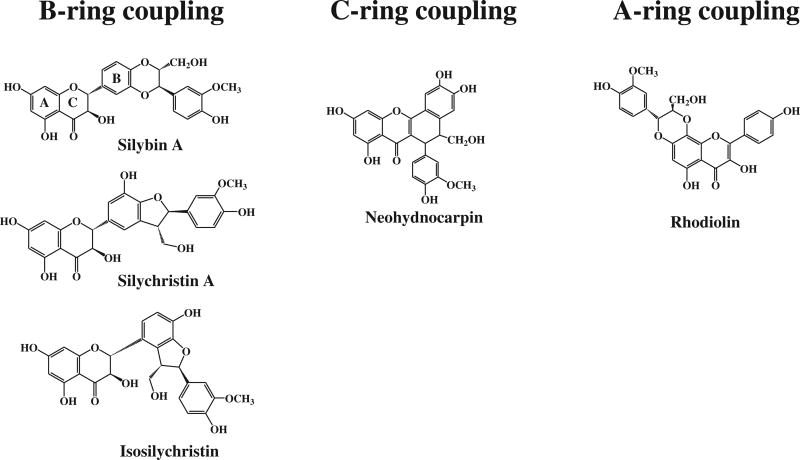
In both mechanisms, the formed radical/radical cation must be relatively stable so that their forming reactions are thermodynamically favorable. In the case of the H-atom abstraction mechanism, the B-ring is the most important site for H-transfer, especially when it is a catechol moiety. The C-ring OH at C-3 is important as a site for H-atom abstraction when a 2,3-double bond exists. The presence of this unsaturation stabilizes the ArȮ radical after H-abstraction by delocalization between the B and C rings [27]. Neohydnocarpin isolated from the fruits of Hydnocarpus wightiana [28] represents a typical example of a flavonolignan biosynthesized by radical formation on the C-ring OH at C-3. Some flavonolignans possess a 2,3-double bond similar to that in hydnocarpin and its congeners, salcolins A & B, calquiquelignans D & E, and sinaiticin [1]. None of these flavonolignans possess an OH group at C-3. However, flavonolignans possessing a 2,3-double bond as well as an OH group at C-3 have been isolated from S. marianum fruits [29–30]. Little is known about H-atom abstraction in the A-ring. However, rhodiolin isolated from the rhizomes of Rhodiola rosea [31] represents a flavonolignan that is considered to be formed by radical formation on the A-ring OH at C-8. Fig. 7 shows examples of flavonolignans with different coupling positions on the three flavonoid rings.
Fig. 7.
Examples of flavonolignans with different coupling positions on the three flavonoid rings.
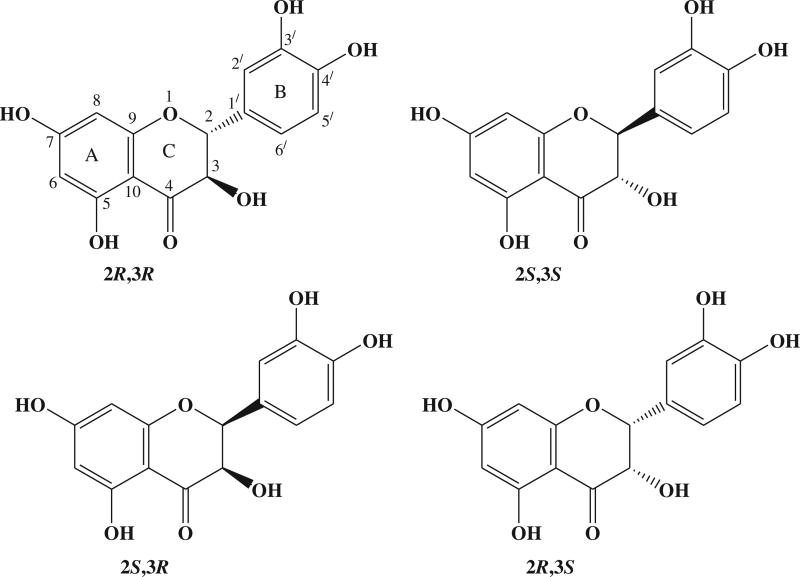
Taxifolin is the flavonoid involved in the biosynthesis of flavonolignans in S. marianum variety purple. Four stereoisomers of this dihydroflavonol exist due to the presence of two chiral centers in the C-ring: 2S3S, 2R3R, 2R3S, and 2S3R (Fig. 8) [26]. The first two isomers are trans, and the latter two are cis configured. The trans-2R3R taxifolin isomer is the predominant flavonoid in flavonolignans, especially those isolated from the S. marianum variety purple. Quantum mechanical calculations have shown that the trans-dihydroflavonols are more stable than the cis-compounds, explaining the predominance of trans-compounds. BDE calculated as the difference in total enthalpy between 2S,3S-taxifolin and the radical formed after H-atom abstraction from each of the 3, 5, 7, 3′, 4′ positions has been reported [27]. In this earlier study, all calculations correspond to systems in a vacuum. The effect of solvent was reported to be below 2 kcal/mol. The electronic structures for the most stable conformations of the four isomers of taxifolin were studied [26]. Predominant H-abstraction should occur from 4′- or 3′-OH groups, compared to 3-, 5-, or 7-OH groups based on BDE calculations. Moreover, the electronic density distribution in the highest occupied molecular orbitals (HOMO) level, which is directly related to the electron transfer capacity, was found to be delocalized on the B-ring and not extended to the 2,3-bond and 4-carbonyl groups. This confirms the minor role of the 3-OH group in taxifolin radical formation. In addition, the authors also studied the electronic density distribution using the singly-occupied molecular orbital (SOMO) level for the radicals obtained after H-atom abstraction. The SOMOs of the 4′- and 3′-OH group radicals were found to be delocalized, in contrast to that of 3-OH radical which was determined to be localized on the O-atom. This explains the predominant formation of flavonolignans from the 4′- and 3′-O-taxifolin radical in S. marianum variety purple (Fig. 1).
Fig. 8.
The four stereoisomers of taxifolin 2R3R, 2S3S, 2S3R, and 2R3S.
The difference in heat of formation (ΔfHꝋ) between the radical and the parent taxifolin molecule for the 2S3S and 2R3R isomers has been reported [26]. The lowest value for ΔfHꝋ was found for the 4′-OH radical, followed by 3′-OH radical. This confirms that the B-ring is the most energetically favorable site for H-transfer and radical formation. Stabilization by H-bond formation between the remaining OH group and the neighboring oxygen atom provides further support to this point. A small difference in ΔfHꝋ was found between 4′-OH and 3′-OH, which was attributed to steric hindrance between 3′-OH and the rest of the molecule. Nevertheless, this small difference in ΔfHꝋ can explain, at least in part, the higher content of silybins A and B, derived from the 4′-O-taxifolin radical, over isosilybins A and B, derived from the 3′-O-taxifolin radical.
4. Conclusions
PCA of the flavonolignans content in the investigated S. marianum populations provided important clues for the biosynthesis of these pharmaceutically important secondary metabolites. The outcome supports the depicted hypothetical biosynthetic pathway of flavonolignans, involving oxidative coupling between the flavonoid taxifolin and the phenylpropanoid coniferyl alcohol with certain site preferences (Figs. 1 and 5). These plausible pathways can be extended to other flavonolignans produced by different plant species. The usefulness of the multivariate statistical analysis and the 2D model that resulted from the analysis of the S. marianum samples may serve to explain the biosynthetic relations between known flavonolignans. In addition, these rationales might be suitable to predict the biosynthetic routes for yet unknown analogues. Open questions exist regarding the presence of silybin-rich and silydianin-rich cultivars growing under different environmental conditions. More detailed studies on the enzymatic and genetic levels are required for better understanding of the biosynthesis of flavonolignans in S. marianum.
Acknowledgments
Conflict of interest
The authors appreciate the support by the Science and Technology Development Fund (STDF-STF), Egypt, project ID 6081 (PI: SAZ), as well as through grant P50 AT000155 from NCCIH and ODS/NIH.
References
- 1.Chambers SC, Valentová K, Křen V. “Non-Taxifolin” derived flavonolignans: phytochemistry and biology. Curr. Pharm. Des. 2015;21:5489–5500. doi: 10.2174/1381612821666151002112720. [DOI] [PubMed] [Google Scholar]
- 2.Dewick P. Medicinal Natural Products: A Biosynthetic Approach. John Wiley & Sons; England: 2002. pp. 151–154. [Google Scholar]
- 3.Sanjari S, Shobbar ZS, Ebrahimi M, Hasanloo T, Sadat-Noori SA, Tirnaz S. Chalcone synthase genes from milk thistle (Silybum marianum): isolation and expression analysis. J. Genet. 2015;94:611–617. doi: 10.1007/s12041-015-0560-7. [DOI] [PubMed] [Google Scholar]
- 4.Bernards MA. Plant natural products: a primer. Can. J. Zool. 2010;88:601–614. [Google Scholar]
- 5.Althagafy HS, Meza-Aviña ME, Oberlies NH, Croatt MP. Mechanistic study of the biomimetic synthesis of flavonolignan diastereoisomers in milk thistle. J. Org. Chem. 2013;78:7594–7600. doi: 10.1021/jo4011377. [DOI] [PMC free article] [PubMed] [Google Scholar]
- 6.Flora K, Hahn M, Rosen H, Benner K. Milk thistle (Silybum marianum) for the therapy of liver disease. Am. J. Gastroenterol. 1998;93:139–143. doi: 10.1111/j.1572-0241.1998.00139.x. [DOI] [PubMed] [Google Scholar]
- 7.Deep G, Agarwal R. Antimetastatic efficacy of silibinin: molecular mechanisms and therapeutic potential against cancer. Cancer Metastasis Rev. 2010;29:447–463. doi: 10.1007/s10555-010-9237-0. [DOI] [PMC free article] [PubMed] [Google Scholar]
- 8.Steiber G, Szilágyi I, Tétényi P. Differences in active agent content and composition of two species of the Silybum genus (Silybum marianum (L.) Gaertn. and Silybum eburneum Coss. et Durr.) Herb. Hung. 1977;16:55–75. [Google Scholar]
- 9.Szilágyi I, Tétényi P, Antus S, Seligmann O, Chari M, Seitz M, Wagner H. Structure of silandrin and silymonin, two new flavanolignans from a white blooming Silybum marianum variety. Planta Med. 1981;43:121–127. doi: 10.1055/s-2007-971488. [DOI] [PubMed] [Google Scholar]
- 10.Samu Z, Nyiredy S, Baitz-Gács E, Varga Z, Kurtán T, Dinya Z, Antus S. Structure elucidation and antioxidant activity of (−)-isosilandrin isolated from Silybum marianum L. Chem. Biodivers. 2004;1:1668–1677. doi: 10.1002/cbdv.200490125. [DOI] [PubMed] [Google Scholar]
- 11.Sánchez-Sampedro MA, Fernández-Tárrago J, Corchete P. Silymarin synthesis and degradation by peroxidases of cell suspension cultures of Silybum marianum. J. Plant Physiol. 2007;164:669–674. doi: 10.1016/j.jplph.2006.06.015. [DOI] [PubMed] [Google Scholar]
- 12.Nyiredy S, Samu Z, Szücs Z, Gulácsi K, Kurtán T, Antus S. New insight into the biosynthesis of flavanolignans in the white-flowered variant of Silybum marianum. J. Chromatogr. Sci. 2008;46:93–96. doi: 10.1093/chromsci/46.2.93. [DOI] [PubMed] [Google Scholar]
- 13.AbouZid S, Chen SN, Pauli GF. Silymarin content in Silybum marianum populations growing in Egypt. Ind. Crop. Prod. 2016;83:729–737. doi: 10.1016/j.indcrop.2015.12.012. [DOI] [PMC free article] [PubMed] [Google Scholar]
- 14.AbouZid S, Chen SN, McAlpine JB, Friesen JB, Pauli GF. Silybum marianum pericarp yields enhanced silymarin products. Fitoterapia. 2016;112:136–143. doi: 10.1016/j.fitote.2016.05.012. [DOI] [PMC free article] [PubMed] [Google Scholar]
- 15.Kim NC, Graf TN, Sparacino CM, Wani MC, Wall ME. Complete isolation and characterization of silybins and isosilybins from milk thistle (Silybum marianum) Org. Biomol. Chem. 2003;1:1684–1689. doi: 10.1039/b300099k. [DOI] [PubMed] [Google Scholar]
- 16.MacKinnon SL, Hodder M, Craft C, Simmons-Boyce J. Silyamandin, a new flavonolignan isolated from milk thistle tinctures. Planta Med. 2007;73:1214–1216. doi: 10.1055/s-2007-981595. [DOI] [PubMed] [Google Scholar]
- 17.Pauli GF, Chen SN, Simmler C, Lankin DC, Gödecke T, Jaki BU, Friesen JB, McAlpine JB, Napolitano JG. Importance of purity evaluation and the potential of quantitative 1H NMR as a purity assay. J. Med. Chem. 2014;57:9220–9231. doi: 10.1021/jm500734a. [DOI] [PMC free article] [PubMed] [Google Scholar]
- 18.Pauli GF, Niemitz M, Bisson J, Lodewyk MW, Soldi C, Shaw JT, Tantillo DJ, Saya JM, Vos K, Kleinnijenhuis RA, Hiemstra H. Toward structural correctness: aquatolide and the importance of 1D proton NMR FID archiving. J. Org. Chem. 2016;81:878–889. doi: 10.1021/acs.joc.5b02456. [DOI] [PMC free article] [PubMed] [Google Scholar]
- 19.El-Elimat T, Raja HA, Graf TN, Faeth SH, Cech NB, Oberlies N. Flavonolignans from Aspergillus iizukae, a fungal endophyte of milk thistle (Silybum marianum) J. Nat. Prod. 2014;77:193–199. doi: 10.1021/np400955q. [DOI] [PubMed] [Google Scholar]
- 20.Radjabian T, Rezazadeh S, Fallah Huseini H. Analysis of silymarin components in the seed extracts of some milk thistle ecotypes from Iran by HPLC. Iran. J. Sci. Technol. Trans. A. 2008;32:141–146. [Google Scholar]
- 21.Andrzejewska J, Sadowska K, Mielcarek S. Effect of sowing date and rate on the yield and flavonolignan content of the fruits of milk thistle (Silybum marianum L. Gaertn.) grown on light soil in a moderate climate. Ind. Crop. Prod. 2011;33:462–468. [Google Scholar]
- 22.El Sherif F, Khattab S, Ibrahim A, Ahmed S. Improved silymarin content in elicited multiple shoot cultures of Silybum marianum L. Physiol. Mol. Biol. Plants. 2013;19:127–136. doi: 10.1007/s12298-012-0141-7. [DOI] [PMC free article] [PubMed] [Google Scholar]
- 23.Rahimi S, Hasanloo T, Najafi F, Khavari-Nejad RA. Enhancement of silymarin accumulation using precursor feeding in Silybum marianum hairy root cultures. Plant Omics J. 2011;4:34–39. [Google Scholar]
- 24.Alikaridis F, Papadakis D, Pantelia K, Kephalas T. Flavonolignan production from Silybum marianum transformed and untransformed root cultures. Fitoterapia. 2000;71:379–384. doi: 10.1016/s0367-326x(00)00134-9. [DOI] [PubMed] [Google Scholar]
- 25.Leopoldini M, Pitarch IP, Russo N, Toscano M. Structure, conformation, and electronic properties of apigenin, luteolin, and taxifolin antioxidants. A first principle theoretical study. J. Phys. Chem. 2004;108:92–96. [Google Scholar]
- 26.Trouillas P, Fagnere C, Lazzaroni R, Calliste C, Marfak A, Duroux J. A theoretical study of the conformational behavior and electronic structure of taxifolin correlated with the free radical-scavenging activity. Food Chem. 2004;88:571–582. [Google Scholar]
- 27.Trouillas P, Marsal P, Siri D, Lazzaroni R, Duroux JL. A DFT study of the reactivity of OH groups in quercetin and taxifolin antioxidants: the specificity of the 3-OH site. Food Chem. 2006;97:679–688. [Google Scholar]
- 28.Ranganathan KR, Seshadri TR. Constitution of isohydnocarpin isolated from the seed hulls of Hydnocarpus wightiana. Indian J. Chem. 1974;12:888–889. [Google Scholar]
- 29.Bandopadhyaya M, Pardeshi NP, Seshadri TR. Compounds of Silybum marianum. Indian J. Chem. 1972;10:808–809. [Google Scholar]
- 30.Takemoto T, Ikegawa S, Nomoto K. Studies on constituents of Silybum marianum (L.) Gaertn. I. New flavonolignans named 2,3-dehydrosilymarin and 2,3-dehydro-silychristin. Yakugaku Zasshi. 1975;95:1017–1021. doi: 10.1248/yakushi1947.95.8_1017. [DOI] [PubMed] [Google Scholar]
- 31.Zapesochnaya GG, Kurkin VA. The flavonoids of the rhizomes Rhodiola rosea. II. A flavonolignan and glycosides of herbacetin. Khimiya Prirodnykh Soedinenii. 1983;19:23–321. [Google Scholar]


