

Abstract
Background
Biomarkers may help us to unravel differences in the underlying pathophysiology between heart failure (HF) patients with a reduced ejection fraction (HFrEF) and a preserved ejection fraction (HFpEF). Therefore, we compared biomarker profiles to characterize pathophysiological differences between patients with HFrEF and HFpEF.
Methods and Results
We retrospectively analyzed 33 biomarkers from different pathophysiological domains (inflammation, oxidative stress, remodeling, cardiac stretch, angiogenesis, arteriosclerosis, and renal function) in 460 HF patients (21% HFpEF, left ventricular ejection fraction ≥45%) measured at discharge after hospitalization for acute HF. The association between these markers and the occurrence of all‐cause mortality and/or HF‐related rehospitalizations at 18 months was compared between patients with HFrEF and HFpEF. Patients were 70.6±11.4 years old and 37.4% were female. Patients with HFpEF were older, more often female, and had a higher systolic blood pressure. Levels of high‐sensitive C‐reactive protein were significantly higher in HFpEF, while levels of pro‐atrial‐type natriuretic peptide and N‐terminal pro‐brain natriuretic peptide were higher in HFrEF. Linear regression followed by network analyses revealed prominent inflammation and angiogenesis‐associated interactions in HFpEF and mainly cardiac stretch–associated interactions in HFrEF. The angiogenesis‐specific marker, neuropilin and the remodeling‐specific marker, osteopontin were predictive for all‐cause mortality and/or HF‐related rehospitalizations at 18 months in HFpEF, but not in HFrEF (P for interaction <0.05).
Conclusions
In HFpEF, inflammation and angiogenesis‐mediated interactions are predominantly observed, while stretch‐mediated interactions are found in HFrEF. The remodeling marker osteopontin and the angiogenesis marker neuropilin predicted outcome in HFpEF, but not in HFrEF.
Keywords: biomarker, heart failure, multimarker, pathophysiology
Subject Categories: Biomarkers, Mechanisms, Heart Failure, Remodeling
Introduction
The difference in pathophysiology between heart failure with a reduced ejection fraction (HFrEF) and heart failure with a preserved ejection fraction (HFpEF) remains poorly understood, and effective treatment options are currently not available for HFpEF.1, 2, 3, 4 Therefore, a better understanding of the pathophysiology of HFpEF is required, which eventually may help to improve outcome.
Patient‐specific biomarker profiles are useful for the purpose of monitoring disease severity and progression, to guide therapy, but also for characterizing the pathophysiology of HF.5, 6, 7, 8, 9 We hypothesize that differences in biomarker levels and correlative associations between HFrEF and HFpEF may provide important insights into specific activities of pathophysiological processes.5, 6, 7, 8, 9
The aim of this study was to characterize HFpEF and HFrEF using a network analysis on an extensive set of 33 biomarkers of various pathophysiological pathways. Therefore, we investigated differences in biomarker levels, patterns of correlations, and predictive value of biomarkers in patients with HFpEF and HFrEF.
Methods
Study Design and Population
Measurements of biomarkers were performed in a subcohort of the Coordinating study evaluating Outcomes of Advising and Counseling in Heart failure (COACH) trial of which rationale, design, and results have been previously described.10, 11 In short, the COACH trial studied the effects of additional intensive nurse‐led support on the prognosis of 1023 chronic HF patients. A hospital admission for HF (NYHA II‐IV) inclusion criteria for the COACH trial included and patients had to be at least 18 years of age. Patients were excluded if they underwent an intervention (percutaneous transluminal coronary angioplasty, coronary artery bypass graft, heart transplantation, valve replacement) in the previous 6 months or if they had a planned intervention in the following 3 months. Additionally, patients were excluded if they had an ongoing evaluation for heart transplantation.10 Left ventricular ejection fraction (LVEF) measurements were available in 832 patients. Biomarkers were measured in blood collected from 460 patients shortly before discharge between 8:00 am and 4:00 pm, after patients had been clinically stabilized and were considered well enough to go home. Baseline characteristics of the current substudy were comparable to the entire COACH study (Table S1). The study complies with the Declaration of Helsinki, local medical ethics committees approved the study, and all patients provided written informed consent.
Study and Laboratory Measurements
HFpEF was defined as having a LVEF ≥45%, measurements of high‐sensitive C‐reactive protein (hs‐CRP), pentraxin‐3, growth differentiation factor, soluble receptor of advanced glycation end‐products, interleukin‐6, tumor necrosis factor α, tumor necrosis factor–associated receptor 1 α, myeloperoxidase, syndecan‐1, periostin, ST‐2, osteopontin, pro‐atrial‐type natriuretic peptide (proANP), vascular endothelial growth factor receptor (VEGFR), angiogenin, end‐terminal pro c‐type natriuretic peptide, neuropilin‐1, endothelial cell‐selective adhesion molecule, neutrophil gelatinase‐associated lipocalin, d‐dimer, WAP 4‐disulfide core domain protein HE4, mesothelin, polymeric immunoglobulin receptor, prosaposin, and TROY were measured by Alere San Diego, Inc, (San Diego, CA), using enzyme‐linked immunosorbent assays. Immunoassays to ST2 were developed by Alere. This research assay by Alere has not been standardized to the commercialized assays used in research or in clinical use. Furthermore, the extent to which this Alere assay correlates with the commercial assay is not fully characterized. Galectin‐3 was measured using ELISA by BG Medicine, Inc. (Waltham, MA). Transforming growth factor‐β and VEGF were analyzed using a quantitative multiplexed sandwich ELISA system, SearchLightw proteome arrays (Aushon BioSystems, Billerica, MA). N‐terminal pro‐brain natriuretic peptide (NT‐proBNP) was measured using the Elecsys proBNP ELISA by Roche Diagnostics (Mannheim, Germany). Erythropoietin α was measured using the IMMULITEw erythropoietin ELISA by Diagnostic Products Corporation (Los Angeles, CA). Inter‐ and intra‐assay coefficients of the assays used can be found in Table S2. Endothelin‐1, interleukin‐6, and cardiac‐specific troponin I were measured in frozen plasma samples collected at baseline using high‐sensitive single molecule counting (SMC™) technology (RUO, Erenna® Immunoassay System; Singulex Inc, Alameda, CA). Estimated glomerular filtration rate was based on the simplified Modification of Diet in Renal Disease.12
Study End Points
For studying the relationship between biomarker levels and outcome, the primary end point of the COACH trial was used. This end point is a combined end point consisting of all‐cause mortality and/or HF‐related rehospitalizations at 18 months. An independent end point committee adjudicated the end point.
Statistical Analysis
Continuous variables are presented as medians with interquartile range or means±SD where appropriate. Categorical variables are presented as numbers with percentages. Baseline characteristics and biomarker concentrations at baseline were stratified according to HFrEF and HFpEF. Intergroup differences were tested using Student t test or Mann–Whitney U test for continuous variables or χ2 test for categorical variables. Principal component (PC) analysis was performed to correct for multiple comparisons with HFrEF and HFpEF as categorical variables, using an established statistical method described elsewhere.13 This method is often used in ‐omics based studies, where there is a natural correlation between markers because of the fact that these often belong to similar pathophysiological processes.14 Indeed, also for the 33 biomarkers employed in this study, biomarkers are clearly interrelated, belonging to several similar pathophysiological processes (Figure 1). In this situation the Bonferroni correction can be considered too conservative.15 Here, the PC‐based correction has been suggested to be more effective.14, 15 Additionally, this method has been previously successfully used in correcting for multiple comparisons in pairwise correlations.13 A total of 21 PCs, of which the eigenvalues cumulatively explained >95% of the variation observed in the data set when comparing HFrEF with HFpEF, were found. The corrected significance level for multiple testing was thus set at P<0.05/21, equating to an adjusted P‐value cut‐off of 0.00238. To correct for multiple comparison for interbiomarker correlations, 0.05/[PC×(PC−1)/2] was used for the adjusted P cut‐off value, where PC is the number of principal components found. To study the influence of clinical confounders on biomarker‐level differences between HFrEF and HFpEF, logistic regression was performed. Here, HFpEF is coded as 1 and HFrEF as 0. An odds ratio above 1 signifies that higher levels are associated with HFpEF. Associations were corrected for age, sex, estimated glomerular filtration rate, a history of diabetes mellitus, and other clinical covariates that significantly differed between HFrEF and HFpEF. Next, a Spearman's rank correlation coefficient was calculated for each possible biomarker pair in the HFrEF cohort of patients and the procedure was repeated for HFpEF. This resulted in 2 sets of R‐values with associated P‐values for both HFrEF and HFpEF. To adjust for multiple testing, only those correlations passing the adjusted P‐value cut‐off calculated from the PC analysis were deemed statistically significant and subsequently retained. These significant correlation coefficients for HFrEF and HFpEF were then graphically displayed as heatmaps with associated disease domains for all biomarkers. Network analysis was performed to analyze associations between biomarkers in HFrEF and HFpEF. First, all significant associations found within HFrEF and HFpEF were separately depicted as circular networks. Next, significant associations between biomarkers exclusive to HFrEF and HFpEF were identified. To ascertain whether these associations were significantly different, the Fishers z‐transformation test was used to compare R‐values between HFrEF and HFpEF. The P‐values from these associations were corrected using the PC analysis method described above.
Figure 1.
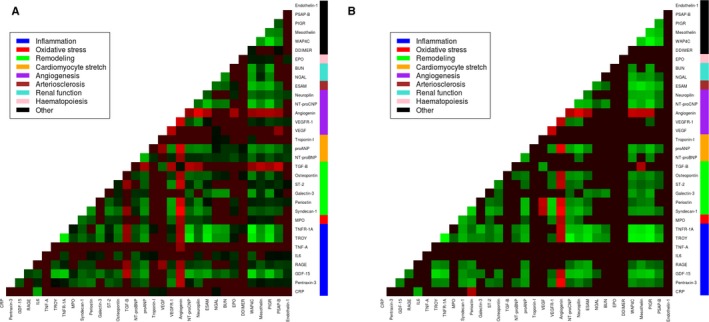
Heatmaps depicting correlation between biomarkers in HFrEF (A) and HFpEF (B). Biomarker correlations that did not pass the corrected P‐value (0.05/21) are black. Red entails a negative correlation, green entails a positive correlation. BUN indicates blood urea nitrogen; CRP, C‐reactive protein; EPO, erythropoietin; ESAM, endothelial cell‐selective adhesion molecule; GDF‐15, growth differentiation factor 15; HFpEF, heart failure with preserved ejection fraction; HFrEF, heart failure with reduced ejection fraction; IL‐6, interleukin 6; MPO, myeloperoxidase; NGAL, neutrophil gelatinase‐associated lipocalin; NT‐proBNP, N‐terminal pro‐brain‐type natriuretic peptide; NT‐proCNP, amino terminal pro‐C‐type natriuretic peptide; PIGR, polymeric immunoglobulin receptor; proANP, pro‐atrial‐type natriuretic peptide; PSAP, prostate‐specific acid phosphatase; RAGE, receptor of advanced glycation end‐products; ST‐2, suppression of tumorigenicity 2; TGF‐β, transforming growth factor β; TNF‐α, tumor necrosis factor α; TNF‐α‐R1a, tumor necrosis factor α receptor 1a; VEGF, vascular endothelial growth factor; VEGFR, vascular endothelial growth factor receptor; WAP4C, WAP 4 disulfide core domain protein.
For outcome analysis, a univariable interaction test was performed between the (log2‐transformed) biomarker and HF status (HFrEF versus HFpEF). The interaction test was then bootstrapped with 1000 iterations to validate the results. Following this, a multivariable interaction test was performed correcting for the COACH risk engine. The COACH risk engine includes sex, age, pulse pressure, diastolic blood pressure, history of stroke, history of diabetes mellitus, estimated glomerular filtration rate, atrial fibrillation, myocardial infarction, peripheral arterial disease, and levels of NT‐proBNP and sodium and is powered for the primary end point used in this study, as published elsewhere.16 The relationship of the primary end point with biomarkers, showing a significant interaction with HF status and outcome, was then graphically depicted using Kaplan–Meier curves. To correct for potential optimism and given the limited sample size, we bootstrapped the estimates with 1000 iterations.17 The significance of a difference between tertiles of biomarker levels and association with outcome was tested using the Log‐rank test. Univariable and multivariable associations of biomarkers with outcome were tested using the Cox regression. Tests performed were 2‐tailed and a P‐value of <0.05 was considered statistically significant. All statistical analyses were performed using STATA version 13.0 (StataCorp LP, College Station, TX) and R, version 3.2.3.
Results
Patient Characteristics
The 460 patients in this cohort had a mean age of 70.6±11.1 years and 37.4% were female. Most patients were in NYHA class III (52%) with a mean LVEF of 32.5±14.0% (Table 1). Ninety‐six patients had HFpEF (21%). Patients with HFpEF in this cohort were relatively older (74.5 years versus 69.6 years, P<0.001) and more often female (51.0% versus 33.8%, P=0.002). Additionally, patients with HFpEF were found to have a higher systolic blood pressure (126.6 mm Hg versus 115.6 mm Hg, P<0.001) compared to patients with HFrEF. Furthermore, patients with HFpEF used fewer angiotensin‐converting enzyme inhibitors (55.2% versus 76.9%, P<0.001) and β‐blockers (59.4% versus 70.1%, P<0.001) at discharge.
Table 1.
Baseline Characteristics
| Total Cohort (n=460) | HFrEF (LVEF <45%) (n=364) | HFpEF (LVEF ≥45%) (n=96) | P Value | |
|---|---|---|---|---|
| LVEF (%) | 32.5±14.0 | 26.7±8.5 | 54.4±7.5 | NA |
| Demographics and HF characteristics | ||||
| Age, y | 70.6±11.1 | 69.6 (11.2) | 74.5 (10.0) | <0.001a |
| Female sex, n (%) | 172 (37.4%) | 123 (33.8%) | 49 (51.0%) | 0.002a |
| NYHA class (at discharge) II/III/IV, % | 44/52/4 | 42/54/4 | 55/41/4 | 0.064 |
| Previous HF hospitalization, n (%) | 155 (33.7%) | 118 (32.4%) | 37 (38.5%) | 0.260 |
| Clinical signs | ||||
| BMI, kg/m2 | 27.0±5.6 | 26.8±5.5 | 28.0±5.7 | 0.08 |
| Systolic BP, mm Hg | 117.9±21.3 | 115.6±20 | 126.6±23.1 | <0.001a |
| Diastolic BP, mm Hg | 68.9±12.3 | 68.9±12.4 | 68.9±12.1 | 0.980 |
| eGFR, mL/min per 1.73 m2 | 54.9±20.5 | 55.1±20.4 | 53.8±21.1 | 0.580 |
| Heart rate, bpm | 74.2±13.4 | 74.7±13.8 | 72.2±11.8 | 0.110 |
| Medical history, n (%) | ||||
| Myocardial infarction | 187 (40.7%) | 161 (44.2%) | 26 (27.1%) | 0.002a |
| Hypertension | 191 (41.5%) | 143 (39.3%) | 48 (50.0%) | 0.058 |
| Diabetes mellitus | 135 (29.3%) | 104 (28.6%) | 31 (32.3%) | 0.048a |
| COPD | 130 (28.3%) | 99 (27.2%) | 31 (32.3%) | 0.320 |
| Atrial fibrillation/flutter | 209 (45.4%) | 159 (43.7%) | 50 (52.1%) | 0.140 |
| Anemia | 128 (27.8%) | 92 (25.3%) | 36 (37.5%) | 0.017a |
| Medication, n (%) | ||||
| ACE‐inhibitor/ARB | 378 (82.2%) | 311 (85.4%) | 67 (69.8%) | <0.001a |
| β‐Blocker | 312 (67.8%) | 255 (70.1%) | 57 (59.4%) | 0.005a |
| Diuretic | 440 (95.7%) | 350 (96.2%) | 90 (93.8%) | 0.300 |
| Statin | 183 (39.8%) | 153 (42.0%) | 30 (31.2%) | 0.055 |
| Digoxin | 155 (33.7%) | 120 (33.0%) | 35 (36.5%) | 0.052 |
| Laboratory | ||||
| Hemoglobin, g/dL | 8.5 (7.7, 9.2) | 8.6 (7.8, 9.3) | 8.1 (7.2, 8.8) | <0.001a |
| Sodium, mEq/L | 138.6±4.3 | 138.6±4.4 | 138.6±4.2 | 0.973 |
| Potassium, mEq/L | 4.2 (3.9, 4.6) | 4.3 (3.9, 4.6) | 4.1 (3.7, 4.6) | 0.214 |
ACE indicates angiotensin‐converting enzyme; ARB, angiotensin II receptor blocker; BMI, body mass index; BP, blood pressure; COPD, chronic obstructive pulmonary disease; eGFR, estimated glomerular filtration rate; HF, heart failure; HFpEF, heart failure with a preserved ejection fraction; HFrEF, heart failure with a reduced ejection fraction; LVEF, left ventricular ejection fraction; NA, not available; NYHA, New York Heart Association.
P‐value lower than the significance treshhold of 0.05.
Biomarker Levels in HF With Reduced and Preserved Ejection Fraction
PC analysis revealed 21 principal components that accounted for a cumulative proportion of variance of 95% between HFrEF and HFpEF, which were subsequently used for adjusting the P‐value significance threshold (P<0.05/21; Figure S1). Table 2 shows the baseline biomarker concentrations stratified according to HFrEF and HFpEF where P‐values shown are corrected for multiple testing. Levels of hs‐CRP were higher in HFpEF (3.6 mg/L versus 2.1 mg/L, P=0.001) and levels of pentraxin‐3 were higher in HFrEF (3.9 ng/mL versus 3.2 ng/mL, P=0.009). Levels of cardiac stretch markers NT‐proBNP (2988 pg/mL versus 1948 pg/mL, P<0.001) and proANP (21.9 pg/mL versus 17.0 pg/mL) were higher in HFrEF. Additionally, the angiogenesis‐specific marker VEGFR (0.8 ng/mL versus 0.7 ng/mL, P=0.009) was higher in HFrEF. After adjusting for multiple comparisons, levels of hs‐CRP (P=0.022) remained significantly higher in HFpEF, while the cardiac stretch markers NT‐proBNP (P<0.001) and proANP (P=0.042) remained significantly higher in HFrEF.
Table 2.
Baseline Markers Stratified to HFrEF and HFpEF
| Total Cohort (n=460) | HFrEF (n=364) | HFpEF (n=96) | P Value | P Valuea | |
|---|---|---|---|---|---|
| Inflammation | |||||
| hs‐CRP, mg/L | 2.3 (0.9, 5.2) | 2.1 (0.8, 4.7) | 3.6 (1.8, 7.0) | 0.001b | 0.022b |
| Pentraxin‐3, ng/mL | 3.7 (2.5, 5.6) | 3.9 (2.7, 5.8) | 3.2 (2.4, 4.7) | 0.009b | 0.198 |
| GDF‐15, ng/mL | 2.8 (1.9, 4.2) | 2.8 (1.9, 4.3) | 2.6 (1.9, 4.1) | 0.670 | 1.000 |
| RAGE, ng/mL | 2.9 (1.9, 4.8) | 3.0 (1.9, 4.9) | 2.6 (1.7, 4.0) | 0.053 | 1.000 |
| IL‐6, pg/mL | 7.0 (3.7, 12.2) | 6.7 (3.6, 11.3) | 8.2 (4.5, 13.6) | 0.100 | 1.000 |
| TNF‐α, pg/mL | 47.9 (6.2, 119.4) | 47.3 (8.1, 109.5) | 56.7 (4.8, 194.4) | 0.350 | 1.000 |
| TROY, ng/mL | 0.9 (0.7, 1.5) | 0.9 (0.7, 1.4) | 0.9 (0.6, 1.6) | 0.540 | 1.000 |
| TNF‐α‐R1a, ng/mL | 3.0 (2.1, 4.5) | 3.0 (2.1, 4.4) | 3.1 (2.2, 4.9) | 0.490 | 1.000 |
| Oxidative stress | |||||
| MPO, ng/mL | 20.4 (15.6, 28.2) | 20.6 (15.6, 28.4) | 19.9 (15.2, 27.2) | 0.530 | 1.000 |
| Remodeling | |||||
| Syndecan‐1, ng/mL | 20.2 (14.1, 27.5) | 20.5 (14.1, 28.1) | 19.2 (14.0, 24.6) | 0.360 | 1.000 |
| Periostin, ng/mL | 4.6 (3.4, 6.6) | 4.7 (3.4, 6.6) | 4.5 (3.4, 6.6) | 0.520 | 1.000 |
| Galectin‐3, ng/mL | 19.9 (15.2, 25.7) | 20.0 (14.8, 25.9) | 19.3 (15.8, 25.3) | 0.960 | 1.000 |
| ST‐2, ng/mL | 2.5 (1.4, 5.6) | 2.4 (1.4, 5.5) | 3.1 (1.6, 6.2) | 0.140 | 1.000 |
| Osteopontin, ng/mL | 160.1 (108.8, 219.5) | 161.2 (108.4, 217.1) | 153.8 (110.7, 240.5) | 0.980 | 1.000 |
| TGF‐ß, ng/mL | 50.6 (34.4, 75.1) | 51.4 (35.3, 77.5) | 44.3 (30.9, 63.3) | 0.069 | 1.000 |
| Cardiomyocyte stretch | |||||
| NT‐proBNP, pg/mL | 2601 (1398–5989) | 2988.8 (1511.0, 6708.9) | 1948.0 (855.3, 3827.0) | <0.001b | <0.001b |
| proANP, ng/mL | 20.4 (12.1–33.3) | 21.9 (13.2, 35.4) | 17.0 (10.0, 28.2) | 0.002b | 0.042b |
| cTnI, pg/mL | 14.1 (7.3, 29.4) | 13.1 (5.8, 34.8) | 0.562 | 1.000 | |
| Angiogenesis | |||||
| VEGF, pg/mL | 62.8 (31.4, 148.7) | 62.5 (28.5, 139.9) | 63.0 (35.8, 162.9) | 0.280 | 1.000 |
| VEFGR, ng/mL | 0.8 (0.6, 1.0) | 0.8 (0.6, 1.1) | 0.7 (0.5, 1.0) | 0.009b | 0.255 |
| Angiogenin, μg/mL | 5.0 (3.5, 7.4) | 5.0 (3.5, 7.5) | 5.2 (3.5, 7.3) | 0.840 | 1.000 |
| NT‐proCNP, ng/mL | 0.024 (0.017, 0.035) | 0.023 (0.017, 0.034) | 0.024 (0.015–0.037) | 0.440 | 1.000 |
| Neuropilin‐1, ng/mL | 10.0 (7.1, 13.7) | 10.1 (7.1, 14.0) | 9.6 (7.0, 13.5) | 0.770 | 1.000 |
| Arteriosclerosis | |||||
| ESAM, ng/mL | 52.9 (44.5, 64.4) | 53.8 (45.3, 64.8) | 50.2 (41.1, 63.2) | 0.065 | 1.000 |
| Renal function | |||||
| NGAL, ng/mL | 84.6 (60.4, 119.9) | 84.2 (59.4, 119.2) | 84.7 (63.3, 122.3) | 0.440 | 1.000 |
| BUN, mmol/L | 11.0 (8.2, 15.5) | 10.7 (8.3, 15.6) | 11.1 (7.7, 15.1) | 0.650 | 1.000 |
| Hematopoiesis | |||||
| EPOa, IU/L | 9.6 (5.1, 15.9) | 9.5 (5.0, 15.5) | 10.3 (5.2, 16.5) | 0.560 | 1.000 |
| Other | |||||
| D‐Dimer, μg/mL | 0.5 (0.2, 1.1) | 0.5 (0.2, 1.1) | 0.6 (0.2, 1.0) | 0.710 | 1.000 |
| WAP4C, ng/mL | 5.7 (3.1, 10.1) | 5.8 (3.5, 10.0) | 5.3 (3.1, 10.3) | 0.910 | 1.000 |
| Mesothelin, ng/mL | 29.4 (22.8, 38.7) | 29.8 (22.9, 38.8) | 28.3 (22.5, 38.0) | 0.380 | 1.000 |
| PIGR, ng/mL | 600.6 (337.4, 952.0) | 609.0 (388.7, 952.0) | 598.7 (331.5, 943.0) | 0.330 | 1.000 |
| PSAP, ng/mL | 68.6 (49.2, 98.5) | 68.8 (49.8, 101.0) | 67.3 (48.0, 93.6) | 0.760 | 1.000 |
| ET‐1, ng/mL | 4.5 (3.6, 6.1) | 4.5 (3.6, 6.1) | 4.5 (3.4, 5.7) | 0.430 | 1.000 |
BUN indicates blood urea nitrogen; cTNI, cardiac troponin‐I; EPOa, erythropoietin; ESAM, endothelial cell‐selective adhesion molecule; ET‐1, endothelin‐1; GDF‐15, growth differentiation factor 15; HFpEF, heart failure with a preserved ejection fraction; HFrEF, heart failure with a reduced ejection fraction; hs‐CRP, high‐sensitive C‐reactive protein; IL‐6, interleukin 6; MPO, myeloperoxidase; NGAL, neutrophil gelatinase‐associated lipocalin; NT‐proBNP, N‐terminal pro‐brain‐type natriuretic peptide; NT‐proCNP, amino terminal pro‐C‐type natriuretic peptide; PIGR, polymeric immunoglobulin receptor; proANP, pro‐atrial‐type natriuretic peptide; PSAP, prostate‐specific acid phosphatase; RAGE, receptor of advanced glycation end‐products; ST‐2, suppression of tumorigenicity 2; TGF‐β, transforming growth factor β; TNF‐α, tumor necrosis factor α; TNF‐α‐R1a, tumor necrosis factor α receptor 1a; VEGF, vascular endothelial growth factor; VEGFR, vascular endothelial growth factor receptor; WAP4C, WAP 4 disulfide core domain protein.
Corrected P‐value.
P‐value lower than the significance treshhold of 0.05.
Biomarker associations with HFrEF and HFpEF are shown in Table S3. When correcting for clinical covariates (age, sex, estimated glomerular filtration rate, systolic blood pressure, a history of myocardial infarction; diabetes mellitus; atrial fibrillation and anemia), higher levels of hs‐CRP (odds ratio: 1.29; 95% CI 1.09–1.52, P=0.003) remained associated with HFpEF, while higher levels of NT‐proBNP (odds ratio: 0.68; 95% CI 0.57–0.82, P<0.001) and proANP (odds ratio: 0.69; 95% CI 0.53–0.88, P=0.003) remained associated with HFrEF. After additionally correcting for β‐blocker and angiotensin‐converting enzyme inhibitor/angiotensin II receptor blocker use, the statistical associations for these 3 markers remained (Table S3).
Biomarker Associations and Network Analysis
Heatmaps for the association between biomarkers in HFrEF and HFpEF are depicted in Figure 1. Figure 2 shows the graphical depiction of biomarker networks in HFrEF and HFpEF. Results from the correlation analysis and associated heatmaps reveal that correlations between biomarkers in HFpEF are more associated with remodeling and inflammation, while in HFrEF angiogenesis is a more prominent feature (Figure 1). Network analysis further showed myeloperoxidase to be involved in interactions in both HFrEF and HFpEF. Additionally, renal marker neutrophil gelatinase‐associated lipocalin and blood urea nitrogen as well as inflammation marker receptor of advanced glycation end‐products were involved in biomarker associations in HFpEF.
Figure 2.
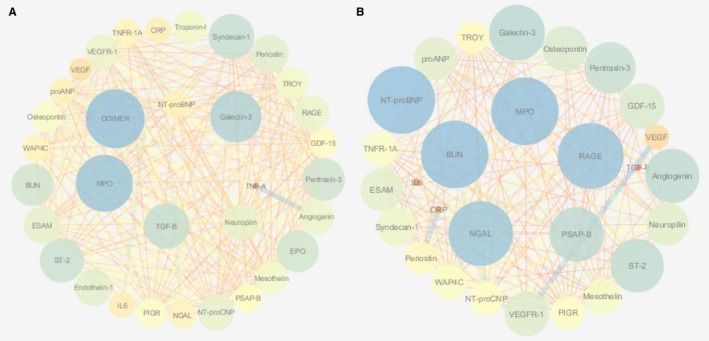
Network analysis depicting associations between biomarkers in HFrEF (A) and HFpEF (B). Associations shown are those that passed the P‐value cutoff (0.05/21). Node size and color are based on the clustering coefficient. The edge betweenness was used as a criterion for the edges. BUN indicates blood urea nitrogen; CRP, C‐reactive protein; EPO, erythropoietin; ESAM, endothelial cell‐selective adhesion molecule; GDF‐15, growth differentiation factor 15; HFpEF, heart failure with preserved ejection fraction; HFrEF, heart failure with reduced ejection fraction; IL‐6, interleukin 6; MPO, myeloperoxidase; NGAL, neutrophil gelatinase‐associated lipocalin; NT‐proBNP, N‐terminal pro‐brain‐type natriuretic peptide; NT‐proCNP, amino terminal pro‐C‐type natriuretic peptide; PIGR, polymeric immunoglobulin receptor; proANP, pro‐atrial‐type natriuretic peptide; PSAP, prostate‐specific acid phosphatase; RAGE, receptor of advanced glycation end‐products; ST‐2, suppression of tumorigenicity 2; TGF‐β, transforming growth factor β; TNF‐α, tumor necrosis factor α; TNF‐α‐R1a, tumor necrosis factor α receptor 1a; VEGF, vascular endothelial growth factor; VEGFR, vascular endothelial growth factor receptor; WAP4C, WAP 4 disulfide core domain protein.
When examining the exclusive interactions between biomarkers in HFrEF and HFpEF, HFpEF revealed interactions, which were mainly associated with inflammation (interleukin‐6; pentraxin‐3; Table 3, corrected P‐value for difference <0.05). In contrast, HFrEF showed exclusive interactions that were NT‐proBNP mediated (Table 3), indicating that biomarker interactions are more associated with cardiac stretch in HFrEF and inflammation in HFpEF. In sensitivity analysis with a definition of HFrEF at LVEF ≤40% and a definition of HFpEF at LVEF ≥50%, exclusive associations in HFpEF remained inflammation mediated, while NT‐proBNP mediated associations in HFrEF (Table S4).
Table 3.
Interaction Within HFrEF and HFpEF
| Biomarker | HFpEF | HFrEF | P Value (Difference) | P Valuea (Difference) | |||
|---|---|---|---|---|---|---|---|
| R | P Valuea | R | P Valuea | ||||
| HFpEF | |||||||
| IL‐6 | D‐Dimer | 0.365 | 0.030b | 0.149 | 1.000 | 0.001b | 0.021b |
| Pentraxin‐3 | VEGF | −0.344 | 0.029b | −0.154 | 1.000 | 0.002b | 0.043b |
| Periostin | VEGF | −0.438 | 0.001b | −0.112 | 1.000 | <0.001b | 0.001b |
| NGAL | PSAP‐B1 | 0.396 | 0.010b | 0.138 | 1.000 | <0.001b | 0.007b |
| HFrEF | |||||||
| NT‐proBNP | IL‐6 | 0.135 | 1.000 | 0.363 | <0.001b | 0.001b | 0.023b |
| NT‐proBNP | EPO‐A | 0.147 | 1.000 | 0.36 | <0.001b | 0.001b | 0.025b |
EPO‐A indicates erythropoietin; HFpEF, heart failure with a preserved ejection fraction; HFrEF, heart failure with a reduced ejection fraction; IL‐6, interleukin 6; NGAL, neutrophil gelatinase‐associated lipocalin; NT‐proBNP, N‐terminal pro‐brain‐type natriuretic peptide; PSAP, prostate‐specific acid phosphatase; VEGF, vascular endothelial growth factor.
Corrected P‐value.
P‐value lower than the significance treshhold of 0.05.
Outcome
Of the total cohort, 41% reached the clinical end point of death and/or HF rehospitalization (41% HFrEF versus 44.8% HFpEF, P=0.659, Figure S2). NT‐proBNP was found to be equally predictive in HFrEF and HFpEF (Table S5). A significant interaction in both univariable and multivariable analysis was found for HF status and neuropilin as well as osteopontin (both P<0.05). Both biomarkers were found only to be predictive in HFpEF (Figures 3 and 4, Table S5). Interaction between neuropilin (P=0.007) and osteopontin (P=0.018) and HF status for the primary end point remained following sensitivity analysis for a definition of HFpEF of LVEF ≥50%. After bootstrapping with 1000 iterations, the interaction with HF status for the primary end point stayed significant for both osteopontin (P=0.002) and neuropilin (P=0.011) in univariable analyses. Also in multivariable analyses, the interaction remained significant for osteopontin (P=0.016) and neuropilin (P=0.015).
Figure 3.
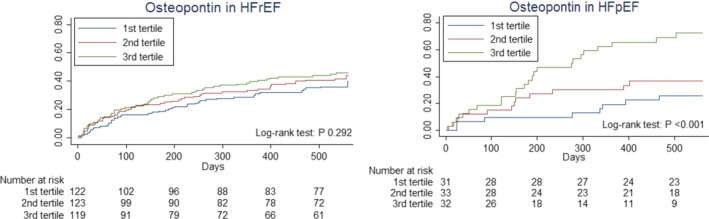
Kaplan–Meier curves depicting the relationship with outcome of osteopontin in tertiles, stratified to HFrEF and HFpEF. HFpEF indicates heart failure with preserved ejection fraction; HFrEF, heart failure with reduced ejection fraction.
Figure 4.
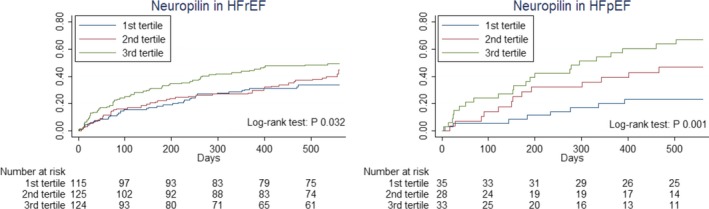
Kaplan–Meier curves depicting the relationship with outcome of neuropilin in tertiles, stratified to HFrEF and HFpEF. HFpEF indicates heart failure with preserved ejection fraction; HFrEF, heart failure with reduced ejection fraction.
When examining the relationship with HF rehospitalizations and all‐cause mortality separately in univariable analysis, we see that osteopontin is predictive for both HF rehospitalizations (P=0.007) and all‐cause mortality (P=0.031) separately, but not in HFrEF (Figures S3 and S4). Neuropilin was predictive in univariable analysis for all‐cause mortality in both HFrEF (P=0.003) and HFpEF (P=0.023). However, neuropilin was only predictive of HF rehospitalizations in HFpEF (P=0.026) and not in HFrEF (P=0.026) (Figures S5 and S6).
Discussion
In this study, we demonstrate a distinct biomarker profile for HFpEF and HFrEF patients by using a novel approach employing network analysis to identify exclusive interactions within the 2 disease entities. Higher levels of Hs‐CRP and lower levels of cardiac stretch markers NT‐proBNP and pro‐ANP are found in HFpEF, which confirm previous studies.8, 18 Furthermore, exclusive interactions between biomarkers in HFpEF were found to be associated with inflammation and angiogenesis. In contrast, HFrEF showed exclusive interactions associated with NT‐proBNP. This is the first study reporting on exclusive interactions between biomarkers in HFrEF and HFpEF. Additionally, this study showed for the first time that angiogenesis marker neuropilin and remodeling marker osteopontin have exclusive predictive value for clinical outcome in HFpEF.
Levels of hs‐CRP were found to be higher in HFpEF patients compared to HFrEF patients. Overall, reports with regard to differences in association of CRP between HFrEF and HFpEF have lacked consensus.8, 19, 20, 21 Yet, patients included in the previous studies were older and had relatively low levels of NT‐proBNP.8, 19, 20, 22 Regardless of the difference in levels, predictive value for hs‐CRP was found to be limited in both HFrEF and HFpEF after correction for a risk model in both this and an earlier study.21 The cardiac stretch markers proANP and NT‐proBNP were found to be lower in HFpEF. This is the first study reporting differential levels of proANP in HFrEF and HFpEF. The difference in levels of NTproBNP between HFrEF and HFpEF confirms earlier reports.8, 18, 23
A recent study used a similar network analysis approach.8 However, the number of biomarkers studied was limited and no exclusive correlations were identified. When examining exclusive correlations in HFpEF and HFrEF between biomarkers, we identified correlations that were inflammation and angiogenesis associated in HFpEF, while correlations were associated with NT‐proBNP in HFrEF. The relatively strong correlations between markers in both HFrEF and HFpEF provide putative insights into possible differences at the pathophysiological pathway level. For HFpEF, correlations were found to be associated with interleukin‐6 and pentraxin‐3. This is in line with earlier suggestions, in which a pro‐inflammatory state was proposed to underlie the pathophysiology of HFpEF.24, 25, 26, 27, 28, 29 In contrast, exclusive interactions in HFrEF were associated with NT‐proBNP. As such, the pathophysiology of HFrEF seems to be more associated with cardiac stretch and oxidative stress.24 However, using network analysis for determining underlying pathophysiological differences between disease entities using biomarkers is a relatively novel approach. Future studies should confirm these findings as well as combine them with data from experimental studies to examine whether the pathophysiological relationships found in clinical data also translate to pathophysiological differences in an experimental setting. Furthermore, most biomarkers are not cardiac exclusive.5 This makes it relatively difficult to discern whether biomarker differences found in a clinical study are the cause or consequence of HF. To optimize interpretability of biomarker studies, future studies should be focused on biomarkers that are highly cardiac specific. Secondly, when biomarker differences are found, experimental studies should validate the findings and discern possible underlying pathophysiological processes.
This study also showed differential association with outcome of angiogenesis markers neuropilin and remodeling marker osteopontin, which were both found to be more predictive in HFpEF. Results with regard to differential association with outcome should be interpreted in an explanatory context of the pathophysiology, in which an increase in levels of a certain biomarker can be detrimental in 1 disease entity and not necessarily in the other through biological involvement or reflecting an underlying pathway. Indeed, osteopontin was reported earlier to be involved in prognosis in HF.30 However, a differential involvement between HFrEF and HFpEF has not been previously reported. Earlier experimental studies found a direct involvement of osteopontin and cardiac remodeling, which in turn was found to cause diastolic dysfunction.31
Neuropilin is identified as a coreceptor of vascular endothelial growth factor receptor 2 (VEGFR‐2).32 In a murine model of cardiac pressure overload, animals that were heterozygous for neuropilin showed higher mortality rates.33 This is the first study reporting the predictive value of neuropilin in HF for the combined end point. Here, we found that neuropilin was predictive of HF rehospitalizations in HFpEF. Additionally, in multivariable analysis, neuropilin only held predictive power in HFpEF. This suggests that neuropilin is more reflective of HF severity in HFpEF and not in HFrEF. Essentially, neuropilin is associated with angiogenesis. This again emphasizes the importance of angiogenesis markers in HFpEF compared to HFrEF.24
In earlier studies a significant association between outcome and HF status was found for end‐terminal pro c‐type natriuretic peptide and galectin‐3 with a definition of HFpEF of LVEF >40%.34, 35 These findings were confirmed in this study. Additionally, an earlier publication found significant predictive value of syndecan‐1 in HFpEF but not in HFrEF.6 The fact that no significant interaction was found in this study for syndecan‐1 and the primary end point can potentially be explained by the limited power of this study for HFpEF patients at a definition of LVEF >45%, and the previous publication for syndecan‐1 corrected for a stepwise based model for syndecan‐1 instead of the COACH risk model.
The clinical implications of this study are 2‐fold. First, this study characterizes the underlying pathophysiology of patients with HFpEF to be associated with inflammation and endothelial function. This confirms earlier studies with regard to HFpEF and endorses the earlier proposed theory by Paulus et al.24 Secondly, this study propagates a novel method for utilizing network analysis to analyze a wide array of biomarkers in discerning the underlying pathophysiology of disease entities in HF.8 This methodology provides a possible step forward in dissecting the HF syndrome.5, 36
Strengths and Limitations
The strengths of this study are the relatively high levels of NT‐proBNP of both the HFrEF and HFpEF patients and the large number of available biomarkers. By having relatively high NT‐proBNP levels, the HFpEF patients in this study represent true HF patients and have a relatively low number of false positives. Secondly, the large number of biomarkers from different disease domains available in this study provide for a more unbiased approach towards discerning underlying pathophysiological pathways.
However, the current analysis is a post‐hoc analysis, leading to a possible selection bias. Secondly, since patients included are of European descent and relatively old, this limits extrapolation to patients of different age and origin. Also, pharmacological treatment during hospitalization might have influenced biomarker levels and associations between HFrEF and HFpEF. Furthermore, the choice for biomarkers was restricted by limited baseline sample availability, with the result that several interesting markers could not be studied. Therefore, this study is not an exhaustive study of biomarker‐level differences in HFrEF and HFpEF and should be considered exploratory and hypothesis generating. Also, some of the biomarkers measured had relatively high coefficients of variation. Therefore, some possible interesting interactions and differences between biomarkers in HFrEF and HFpEF may have been missed. Most importantly, results from this study should be validated in a separate cohort.
The sampling of patients in COACH was performed at discharge after recompensation. Since no data are available on treatment during admission for HF previous to discharge, this might confound some of the reported findings. In this context, patients in the COACH trial cover a gray area between acute decompensated and chronic HF patients. The findings in this study should be regarded as explanatory in the context of the pathophysiology of HFpEF and HFrEF, acting as a stepping‐stone for further research.
Conclusions
Biomarker levels differ in HFpEF and HFrEF, mainly in the domains of cardiac stretch and inflammation. Interactions in HFpEF were found to be associated with inflammation and angiogenesis, while interactions in HFrEF were associated with cardiac stretch. The angiogenesis marker neuropilin and remodeling marker osteopontin were found to only hold predictive value in HFpEF, possibly reflecting underlying pathophysiological processes. Results of this study should be confirmed in prospective biomarker studies.
Sources of Funding
COACH was supported by grant 2000Z003 from the Netherlands Heart Foundation and by additional unrestricted grants from Biosite France SAS, Jouy‐en‐Josas, France (brain natriuretic peptide), Roche Diagnostics Nederland BV, Venlo, the Netherlands (N‐terminal prohormone brain natriuretic peptide), BG Medicine Inc, Waltham, MA (galectin‐3 assays) and Novartis PharmaBV, Arnhem, the Netherlands.
Disclosures
Tromp, Khan, Klip, Meyer, de Boer, Jaarsma, Hillege, van Veldhuisen, and van der Meer have nothing to disclose with regard to this manuscript. Voors received research grants from Alere, Singulex, and Sphingotec.
Supporting information
Table S1. Differences Between Entire Cohort and Subcohort
Table S2. Biomarker Assay Data
Table S3. Logistic Regression Correcting for Clinical Confounders
Table S4. Sensitivity Analysis Exclusive Interactions
Table S5. Relationship With Outcome of Biomarkers
Figure S1. PCA analysis.
Figure S2. Survival stratified according to HFrEF and HFpEF.
Figure S3. Osteopontin in HFrEF and HFpEF for HF‐related hospitalizations at 18 months.
Figure S4. Osteopontin in HFrEF and HFpEF for all‐cause mortality at 18 months.
Figure S5. Neuropilin in HFrEF and HFpEF for HF‐related hospitalizations at 18 months.
Figure S6. Neuropilin in HFrEF and HFpEF for all‐cause mortality at 18 months.
(J Am Heart Assoc. 2017;6:e003989 DOI: 10.1161/JAHA.116.003989.)28360225
References
- 1. Owan TE, Hodge DO, Herges RM, Jacobsen SJ, Roger VL, Redfield MM. Trends in prevalence and outcome of heart failure with preserved ejection fraction. N Engl J Med. 2006;355:251–259. [DOI] [PubMed] [Google Scholar]
- 2. van Veldhuisen DJ, Cohen‐Solal A, Böhm M, Anker SD, Babalis D, Roughton M, Coats AJS, Poole‐Wilson PA, Flather MD. Beta‐blockade with nebivolol in elderly heart failure patients with impaired and preserved left ventricular ejection fraction: data from SENIORS (Study of Effects of Nebivolol Intervention on Outcomes and Rehospitalization in Seniors With Heart Failure). J Am Coll Cardiol. 2009;53:2150–2158. [DOI] [PubMed] [Google Scholar]
- 3. Yusuf S, Pfeffer MA, Swedberg K, Granger CB, Held P, McMurray JJ, Michelson EL, Olofsson B, Ostergren J; Committees CI . Effects of candesartan in patients with chronic heart failure and preserved left‐ventricular ejection fraction: the CHARM‐Preserved Trial. Lancet. 2003;362:777–781. [DOI] [PubMed] [Google Scholar]
- 4. Pitt B, Pfeffer MA, Assmann SF, Boineau R, Anand IS, Claggett B, Clausell N, Desai AS, Diaz R, Fleg JL, Gordeev I, Harty B, Heitner JF, Kenwood CT, Lewis EF, O'Meara E, Probstfield JL, Shaburishvili T, Shah SJ, Solomon SD, Sweitzer NK, Yang S, McKinlay SM; Investigators T . Spironolactone for heart failure with preserved ejection fraction. N Engl J Med. 2014;370:1383–1392. [DOI] [PubMed] [Google Scholar]
- 5. Braunwald E. Biomarkers in heart failure. N Engl J Med. 2008;358:2148–2159. [DOI] [PubMed] [Google Scholar]
- 6. Tromp J, van der Pol A, Klip IT, de Boer RA, Jaarsma T, van Gilst WH, Voors AA, van Veldhuisen DJ, van der Meer P. Fibrosis marker syndecan‐1 and outcome in patients with heart failure with reduced and preserved ejection fraction. Circ Heart Fail. 2014;7:457–462. [DOI] [PubMed] [Google Scholar]
- 7. Demissei BG, Cleland JG, O'Connor CM, Metra M, Ponikowski P, Teerlink JR, Cotter G, Davison B, Givertz MM, Bloomfield DM, Dittrich H, van der Meer P, van Veldhuisen DJ, Hillege HL, Voors AA. Optimizing clinical use of biomarkers in high‐risk acute heart failure patients. Eur J Heart Fail. 2016;3:269–280. [DOI] [PubMed] [Google Scholar]
- 8. Sanders‐van Wijk S, van Empel V, Davarzani N, Maeder MT, Handschin R, Pfisterer ME, Brunner‐La Rocca HP. Circulating biomarkers of distinct pathophysiological pathways in heart failure with preserved vs. reduced left ventricular ejection fraction. Eur J Heart Fail. 2015;17:1006–1014. [DOI] [PubMed] [Google Scholar]
- 9. Schmitter D, Cotter G, Voors AA. Clinical use of novel biomarkers in heart failure: towards personalized medicine. Heart Fail Rev. 2013;19:369–381. [DOI] [PubMed] [Google Scholar]
- 10. Jaarsma T, Van Der Wal MH, Hogenhuis J, Lesman I, Luttik ML, Veeger NJ, Van Veldhuisen DJ. Design and methodology of the COACH study: a multicenter randomised Coordinating study evaluating Outcomes of Advising and Counselling in Heart failure. Eur J Heart Fail. 2004;6:227–233. [DOI] [PubMed] [Google Scholar]
- 11. Jaarsma T, van der Wal MHL, Lesman‐Leegte I, Luttik M‐L, Hogenhuis J, Veeger NJ, Sanderman R, Hoes AW, van Gilst WH, Lok DJA, Dunselman PHJM, Tijssen JGP, Hillege HL, van Veldhuisen DJ. Effect of moderate or intensive disease management program on outcome in patients with heart failure: Coordinating Study Evaluating Outcomes of Advising and Counseling in Heart Failure (COACH). Arch Intern Med. 2008;168:316–324. [DOI] [PubMed] [Google Scholar]
- 12. Smilde TDJ, van Veldhuisen DJ, Navis G, Voors AA, Hillege HL. Drawbacks and prognostic value of formulas estimating renal function in patients with chronic heart failure and systolic dysfunction. Circulation. 2006;114:1572–1580. [DOI] [PubMed] [Google Scholar]
- 13. Auro K, Joensuu A, Fischer K, Kettunen J, Salo P, Mattsson H, Niironen M, Kaprio J, Eriksson JG, Lehtimäki T, Raitakari O, Jula A, Tiitinen A, Jauhiainen M, Soininen P, Kangas AJ, Kähönen M, Havulinna AS, Ala‐Korpela M, Salomaa V, Metspalu A, Perola M. A metabolic view on menopause and ageing. Nat Commun. 2014;5:4708. [DOI] [PubMed] [Google Scholar]
- 14. Gao X, Starmer J, Martin ER. A multiple testing correction method for genetic association studies using correlated single nucleotide polymorphisms. Genet Epidemiol. 2008;32:361–369. [DOI] [PubMed] [Google Scholar]
- 15. Johnson RC, Nelson GW, Troyer JL, Lautenberger JA, Kessing BD, Winkler CA, O'Brien SJ. Accounting for multiple comparisons in a genome‐wide association study (GWAS). BMC Genom. 2010;11:724. [DOI] [PMC free article] [PubMed] [Google Scholar]
- 16. Postmus D, van Veldhuisen DJ, Jaarsma T, Luttik ML, Lassus J, Mebazaa A, Nieminen MS, Harjola VP, Lewsey J, Buskens E, Hillege HL. The COACH risk engine: a multistate model for predicting survival and hospitalization in patients with heart failure. Eur J Heart Fail. 2012;14:168–175. [DOI] [PubMed] [Google Scholar]
- 17. Smith GCS, Seaman SR, Wood AM, Royston P, White IR. Correcting for optimistic prediction in small data sets. Am J Epidemiol. 2014;180:318–324. [DOI] [PMC free article] [PubMed] [Google Scholar]
- 18. van Veldhuisen DJ, Linssen GCM, Jaarsma T, van Gilst WH, Hoes AW, Tijssen JGP, Paulus WJ, Voors AA, Hillege HL. B‐type natriuretic peptide and prognosis in heart failure patients with preserved and reduced ejection fraction. J Am Coll Cardiol. 2013;61:1498–1506. [DOI] [PubMed] [Google Scholar]
- 19. Matsubara J, Sugiyama S, Nozaki T, Sugamura K, Konishi M, Ohba K, Matsuzawa Y, Akiyama E, Yamamoto E, Sakamoto K, Nagayoshi Y, Kaikita K, Sumida H, Kim‐Mitsuyama S, Ogawa H. Pentraxin 3 is a new inflammatory marker correlated with left ventricular diastolic dysfunction and heart failure with normal ejection fraction. J Am Coll Cardiol. 2011;57:861–869. [DOI] [PubMed] [Google Scholar]
- 20. Wisniacki N, Taylor W, Lye M, Wilding JPH. Insulin resistance and inflammatory activation in older patients with systolic and diastolic heart failure. Heart. 2005;91:32–37. [DOI] [PMC free article] [PubMed] [Google Scholar]
- 21. Michowitz Y, Arbel Y, Wexler D, Sheps D, Rogowski O, Shapira I, Berliner S, Keren G, George J, Roth A. Predictive value of high sensitivity CRP in patients with diastolic heart failure. Int J Cardiol. 2008;125:347–351. [DOI] [PubMed] [Google Scholar]
- 22. Niethammer M, Sieber M, von Haehling S, Anker SD, Munzel T, Horstick G, Genth‐Zotz S. Inflammatory pathways in patients with heart failure and preserved ejection fraction. Int J Cardiol. 2008;129:111–117. [DOI] [PubMed] [Google Scholar]
- 23. Maeder MT, Rickenbacher P, Rickli H, Abbühl H, Gutmann M, Erne P, Vuilliomenet A, Peter M, Pfisterer M, Brunner‐La Rocca H‐P. N‐terminal pro brain natriuretic peptide‐guided management in patients with heart failure and preserved ejection fraction: findings from the Trial of Intensified versus standard medical therapy in elderly patients with congestive heart failure (TIME‐CHF). Eur J Heart Fail. 2013;15:1148–1156. [DOI] [PubMed] [Google Scholar]
- 24. Paulus WJ, Tschöpe C. A novel paradigm for heart failure with preserved ejection fraction: comorbidities drive myocardial dysfunction and remodeling through coronary microvascular endothelial inflammation. J Am Coll Cardiol. 2013;62:263–271. [DOI] [PubMed] [Google Scholar]
- 25. Shah KB, Kop WJ, Christenson RH, Diercks DB, Henderson S, Hanson K, Li S‐Y, deFilippi CR. Prognostic utility of ST2 in patients with acute dyspnea and preserved left ventricular ejection fraction. Clin Chem. 2011;57:874–882. [DOI] [PubMed] [Google Scholar]
- 26. Kalogeropoulos A, Georgiopoulou V, Psaty BM, Rodondi N, Smith AL, Harrison DG, Liu Y, Hoffmann U, Bauer DC, Newman AB, Kritchevsky SB, Harris TB, Butler J. Inflammatory markers and incident heart failure risk in older adults: the Health ABC (Health, Aging, and Body Composition) study. J Am Coll Cardiol. 2010;55:2129–2137. [DOI] [PMC free article] [PubMed] [Google Scholar]
- 27. Collier P, Watson CJ, Voon V, Phelan D, Jan A, Mak G, Martos R, Baugh JA, Ledwidge MT, McDonald KM. Can emerging biomarkers of myocardial remodelling identify asymptomatic hypertensive patients at risk for diastolic dysfunction and diastolic heart failure? Eur J Heart Fail. 2011;13:1087–1095. [DOI] [PubMed] [Google Scholar]
- 28. Mentz RJ, Kelly JP, von Lueder TG, Voors AA, Lam CSP, Cowie MR, Kjeldsen K, Jankowska EA, Atar D, Butler J, Fiuzat M, Zannad F, Pitt B, O'Connor CM. Noncardiac comorbidities in heart failure with reduced versus preserved ejection fraction. J Am Coll Cardiol. 2014;64:2281–2293. [DOI] [PMC free article] [PubMed] [Google Scholar]
- 29. Ter Maaten JM, Damman K, Verhaar MC, Paulus WJ, Duncker DJ, Cheng C, van Heerebeek L, Hillege HL, Lam CSP, Navis G, Voors AA. Connecting heart failure with preserved ejection fraction and renal dysfunction: the role of endothelial dysfunction and inflammation. Eur J Heart Fail. 2016;6:588–598. [DOI] [PubMed] [Google Scholar]
- 30. Rosenberg M, Zugck C, Nelles M, Juenger C, Frank D, Remppis A, Giannitsis E, Katus HA, Frey N. Osteopontin, a new prognostic biomarker in patients with chronic heart failure. Circ Heart Fail. 2008;1:43–49. [DOI] [PubMed] [Google Scholar]
- 31. López B, González A, Lindner D, Westermann D, Ravassa S, Beaumont J, Gallego I, Zudaire A, Brugnolaro C, Querejeta R, Larman M, Tschöpe C, Díez J. Osteopontin‐mediated myocardial fibrosis in heart failure: a role for lysyl oxidase? Cardiovasc Res. 2013;99:111–120. [DOI] [PubMed] [Google Scholar]
- 32. Chaudhary B, Khaled YS, Ammori BJ, Elkord E. Neuropilin 1: function and therapeutic potential in cancer. Cancer Immunol Immunother. 2014;63:81–99. [DOI] [PMC free article] [PubMed] [Google Scholar]
- 33. Li F, Zhao H, Liao Y, Takashima S, Asano Y, Shintani Y, Hori M, Kitakaze M. Higher mortality in heterozygous neuropilin‐1 mice after cardiac pressure overload. Biochem Biophys Res Commun. 2008;370:317–321. [DOI] [PubMed] [Google Scholar]
- 34. Lok DJ, Klip IT, Voors AA, Lok SI, Bruggink‐André de la Porte PW, Hillege HL, Jaarsma T, van Veldhuisen DJ, van der Meer P. Prognostic value of N‐terminal pro C‐type natriuretic peptide in heart failure patients with preserved and reduced ejection fraction. Eur J Heart Fail. 2014;16:958–966. [DOI] [PubMed] [Google Scholar]
- 35. de Boer RA, Lok DJ, Jaarsma T, van der Meer P, Voors AA, Hillege HL, van Veldhuisen DJ. Predictive value of plasma galectin‐3 levels in heart failure with reduced and preserved ejection fraction. Ann Med. 2011;43:60–68. [DOI] [PMC free article] [PubMed] [Google Scholar]
- 36. Braunwald E. Another step toward personalized care of patients with heart failure. Eur J Heart Fail. 2015;17:988–990. [DOI] [PubMed] [Google Scholar]
Associated Data
This section collects any data citations, data availability statements, or supplementary materials included in this article.
Supplementary Materials
Table S1. Differences Between Entire Cohort and Subcohort
Table S2. Biomarker Assay Data
Table S3. Logistic Regression Correcting for Clinical Confounders
Table S4. Sensitivity Analysis Exclusive Interactions
Table S5. Relationship With Outcome of Biomarkers
Figure S1. PCA analysis.
Figure S2. Survival stratified according to HFrEF and HFpEF.
Figure S3. Osteopontin in HFrEF and HFpEF for HF‐related hospitalizations at 18 months.
Figure S4. Osteopontin in HFrEF and HFpEF for all‐cause mortality at 18 months.
Figure S5. Neuropilin in HFrEF and HFpEF for HF‐related hospitalizations at 18 months.
Figure S6. Neuropilin in HFrEF and HFpEF for all‐cause mortality at 18 months.