

Abstract
Background
Numerous epidemiological studies support an inverse association between serum bilirubin levels and the incidence of cardiovascular disease; however, the mechanism(s) by which bilirubin may protect against atherosclerosis is undefined. The goals of the present investigations were to assess the ability of bilirubin to prevent atherosclerotic plaque formation in low‐density lipoprotein receptor‐deficient (Ldlr −/−) mice and elucidate the molecular processes underlying this effect.
Methods and Results
Bilirubin, at physiological concentrations (≤20 μmol/L), dose‐dependently inhibits THP‐1 monocyte migration across tumor necrosis factor α–activated human umbilical vein endothelial cell monolayers without altering leukocyte binding or cytokine production. A potent antioxidant, bilirubin effectively blocks the generation of cellular reactive oxygen species induced by the cross‐linking of endothelial vascular cell adhesion molecule 1 (VCAM‐1) or intercellular adhesion molecule 1 (ICAM‐1). These findings were validated by treating cells with blocking antibodies or with specific inhibitors of VCAM‐1 and ICAM‐1 signaling. When administered to Ldlr −/− mice on a Western diet, bilirubin (30 mg/kg intraperitoneally) prevents atherosclerotic plaque formation, but does not alter circulating cholesterol or chemokine levels. Aortic roots from bilirubin‐treated animals exhibit reduced lipid and collagen deposition, decreased infiltration of monocytes and lymphocytes, fewer smooth muscle cells, and diminished levels of chlorotyrosine and nitrotyrosine, without changes in VCAM‐1 or ICAM‐1 expression.
Conclusions
Bilirubin suppresses atherosclerotic plaque formation in Ldlr −/− mice by disrupting endothelial VCAM‐1‐ and ICAM‐1‐mediated leukocyte migration through the scavenging of reactive oxygen species signaling intermediaries. These findings suggest a potential mechanism for the apparent cardioprotective effects of bilirubin.
Keywords: adhesion molecule, atherosclerosis, bilirubin, intercellular adhesion molecule 1, monocyte, vascular cell adhesion molecule 1, vascular endothelium
Subject Categories: Endothelium/Vascular Type/Nitric Oxide, Vascular Biology, Atherosclerosis
Introduction
Bilirubin is formed during the normal physiological degradation of heme. An inverse association between serum bilirubin concentrations and incidence of coronary artery disease was first described by Schwertner et al in 1994.1 Since this initial report, a number of epidemiological analyses have provided corroborating evidence that individuals with a higher serum bilirubin level exhibit a lower risk of cardiovascular events.2, 3, 4, 5 Notably, heme oxygenase (HO), the rate‐limiting enzyme in bilirubin synthesis, has an inducible isoform (HO‐1) that plays an important role in attenuating inflammation,6 including processes that can lead to atherogenesis. HO‐1 induction has been shown to suppress venular leukocyte adhesion, an effect that is abolished by HO inhibitors and reconstituted by bilirubin,7, 8 whereas knockdown of HO‐1 accelerates plaque formation in apolipoprotein E (apoE)‐deficient mice.9 However, the molecular mechanism(s) by which the products of the HO‐1 enzyme act to prevent atherosclerosis have yet to be delineated.
Vascular cell adhesion molecule 1 (VCAM‐1) is localized on the surface of activated endothelial cells and has been implicated as a key mediator of atherosclerosis.10 It selectively binds to α4‐containing integrins (α4β1, α4β7) expressed by T lymphocytes and monocytes11 and facilitates leukocyte migration into the vascular intima, an early and critical event in plaque formation.12, 13 VCAM‐1 is detected primarily at atherosclerosis‐prone sites,14 and targeted disruption of this adhesion molecule inhibits early plaque formation in low‐density lipoprotein receptor‐deficient (Ldlr −/−) mice.10 Integrin binding to VCAM‐1 triggers a signaling cascade within the endothelial cell that results in the generation of superoxide (O2˙−) through activation of NAPDH oxidase (Nox).15 The increase in intracellular reactive oxygen species (ROS) induces actin restructuring, leading to disruption of endothelial tight junctions and enabling leukocyte transmigration from the vessel lumen to the intima.15, 16 Bilirubin is a potent chain‐breaking antioxidant17 that uniquely undergoes intracellular redox cycling,18 facilitating the efficient consumption of ROS. Our group has shown that bilirubin inhibits the transendothelial migration of murine lymphocytes in vitro19 and also attenuates tissue injury in mouse models of VCAM‐1‐dependent inflammation.19, 20 Based on these findings, we postulate that bilirubin's cardioprotective effect is derived from its ability to disrupt VCAM‐1‐mediated leukocyte migration by scavenging Nox‐derived ROS.19, 20, 21
Intercellular adhesion molecule 1 (ICAM‐1) is another endothelial adhesion molecule that is upregulated at sites of atherosclerosis.22 Studies have shown that levels of soluble ICAM‐1 correlate with the extent of atherosclerosis in humans,23 and that ICAM‐1 knockdown is associated with a reduction in the size of vascular lesions in apoE‐deficient mice.24 The selective binding of αLβ2 integrin, which is expressed by lymphocytes, monocytes, and neutrophils,25, 26 to ICAM‐1 activates xanthine oxidase (XO) and generates O2˙− and hydrogen peroxide (H2O2) within the endothelial cell.27, 28 While the effect of bilirubin on ICAM‐1 signaling has not previously been studied, we speculate that it scavenges ICAM‐1‐dependent intracellular ROS in a manner analogous to what we have proposed for VCAM‐1, thereby augmenting its ability to inhibit atherosclerosis.
Monocytes represent one of the principal inflammatory cell types in early atherosclerotic plaques and are believed to play an important role in lesion progression.13 T lymphocytes also contribute to atherogenesis by producing cytokines and chemokines that induce adhesion molecule expression and recruit inflammatory cells to sites of vascular injury.29 Given that both monocytes and T cells express integrins that mediate binding to VCAM‐1 and ICAM‐1,22 we postulate that bilirubin impedes atherogenesis by disrupting the trafficking of these leukocytes to the vascular intima. To test this hypothesis, we investigated the modulatory effect of bilirubin on VCAM‐1‐ and ICAM‐1‐dependent monocyte migration in vitro and validated our findings by assessing the influence of bilirubin on the development of early atherosclerotic lesions in Ldlr −/− mice. Our data indicate that bilirubin impedes the migration of monocytes and lymphocytes to the vascular intima by scavenging ROS that mediate endothelial VCAM‐1 and ICAM‐1 signaling, suggesting a potential mechanism for the cardioprotective effects of bilirubin.
Materials and Methods
Materials
Unconjugated bilirubin (bilirubin IXα) was obtained from Porphyrin Products (Logan, UT) and further purified according to the method of McDonagh and Assisi30 to eliminate potential lipid contaminants. Unless otherwise indicated, bilirubin was freshly prepared in 0.1 mol/L of potassium phosphate (pH 12), as previously described by our group.19 The addition of a small aliquot (≤0.4% vol/vol) of this vehicle solution had no effect on the pH of the culture medium or on cell viability.31 Recombinant human tumor necrosis factor α (TNF‐α) was purchased from PeproTech (Rocky Hill, NJ) and solubilized in DMSO. Allopurinol (AP) was purchased from MP Biomedicals (Santa Ana, CA). ML171 (2‐acetylphenothiazine) and mouse immunoglobulin G (IgG) were purchased from Calbiochem (San Diego, CA). Mouse anti‐human CD18 (β2; ab8220) and mouse anti‐human CD49d (α4; clone 2B4) were purchased from Abcam (Paris, France) and R&D Systems (Minneapolis, MN), respectively. Mouse anti‐human VCAM‐1 (clone P3C4) and mouse anti‐human ICAM‐1 (clone P2A4) were purchased from Millipore (Temecula, CA). CellTrace Far Red, dihydrorhodamine 123, Texas Red‐dextran 10 000 molecular weight, and rhodamine 6G were obtained from Molecular Probes (Eugene, OR). Human serum albumin was purchased from Sigma‐Aldrich (St. Louis, MO).
Cell Isolation and Culture
Human umbilical vein endothelial cells (HUVECs) were isolated from umbilical cords using type I collagenase.32 Cells were grown in F‐12K supplemented with 10% FCS, endothelial cell growth supplement (Corning, Bedford, MA), 0.1 mg/mL of heparin (Sigma‐Aldrich), 100 IU of penicillin, and 100 μg/mL of streptomycin (Corning, Manassas, VA). All experiments were performed using cells pooled from multiple donors, passages 3 to 7. The human acute monocyte leukemia cell line, THP‐1 (ATCC, Manassas, VA), was cultured in RPMI 1640 (Hyclone, Logan, UT) supplemented with 10% FCS, 1 mmol/L of l‐glutamine, 100 IU of penicillin, and 100 μg/mL of streptomycin.
Immunoblot Analysis
Whole‐cell lysates were prepared in modified RIPA buffer (50 mmol/L of HEPES, 20 mmol/L of pyrophosphate, 25 mmol/L of β‐glycerophosphate, 50 mmol/L of NaF, 5 mmol/L of Na2MoO4, 5 mmol/L of EDTA, 150 mmol/L of orthophenanthrol, 1% NP‐40, 2% deoxycholate, and 1% Triton X‐100) in the presence of protease and phosphatase inhibitors. Protein concentrations were quantified using the Pierce BCA Protein Assay (Thermo Scientific, Waltham, MA). Samples (25 μg protein) were denatured, resolved on an 8% SDS‐polyacrylamide gel, and then transferred to an Immuno‐blot PVDF membrane (Amersham Biosciences, Piscataway, NJ). Incubation with primary antibodies (rabbit anti‐VCAM‐1, mouse anti‐ICAM‐1, rabbit anti‐E‐Selectin, and mouse anti‐GAPDH; Santa Cruz Biotechnology, Santa Cruz, CA) was performed for 2 hours, followed by HRP‐linked anti‐rabbit IgG or anti‐mouse IgG (Bio‐Rad, Hercules, CA) secondary antibodies for 40 minutes at room temperature. Immunoreactive bands were visualized by chemiluminescence using an Amersham ECL Prime Western Blotting Detection Kit (GE Healthcare, Pittsburgh, PA). Densitometry was performed using ChemiDoc MP System software (Bio‐Rad).
Quantitative Reverse‐Transcription Polymerase Chain Reaction Analysis
Total cellular RNA was extracted and quantitative reverse‐transcription polymerase chain reaction (qRT‐PCR) was performed with a MX300P system (Stratagene, Cedar Creek, TX) using SYBR Green QPRC Master Mix (AB‐4166; Thermo Scientific). Primers for human VCAM‐1 (sense: 5′‐caggctgtgagtccccatt‐3′; antisense: 5′‐ttgactgtgatcggcttcc‐3′), ICAM‐1 (sense: 5′‐accatctacagctttccggc‐3′; antisense: 5′‐tttctggccacgtccagttt‐3′), E‐Selectin (sense: 5′‐ggcagttccgggaaagatca‐3′; antisense: 5′‐gtgggagcttcacaggtagg‐3′), P‐Selectin (sense: 5′‐cgaggaaacatgacctgcct‐3′; antisense: 5′‐tagcctcacaggttggcaag‐3′), and platelet‐endothelial cell adhesion molecule 1 (PECAM‐1; sense: 5′‐gctaactgaacccactcccc‐3′; antisense: 5′‐gacagctgccatgtgactct‐3′) were utilized for assessment of adhesion molecule messenger RNA (mRNA) expression. Human β‐2‐microglobulin (sense: 5′‐ggcattcctgaagctgac‐3′; antisense: 5′‐gaatctttggagtacgctgg‐3′) was used as a control for amplification.
Luminex Assay for Cellular Cytokine Production
HUVECs were seeded at a density of 0.8×10⁵ cells per well and grown to confluence in 24‐well plates (Corning). Cytokine (interleukin [IL]‐6, IL‐1β, IL‐8, macrophage colony stimulating factor [M‐CSF], monocyte chemoattractant protein‐1 [MCP‐1; chemokine ligand {CCL} 2], and regulated on activation, normal T cell expressed and secreted [RANTES; CCL‐5]) levels in cell‐culture medium were determined 24 hours following the addition of the indicated treatments using a human Magnetic Luminex Assay Kit (R&D Systems), according to the manufacturer's instructions, and quantified by a Luminex multiplexing suspension array system (Millipore, Sigma‐Aldrich).33
Transendothelial Migration Assay
HUVECs were seeded at a density of 4×10⁵ cells per insert and grown to confluence on the upper chamber of 24‐well transwells with 8‐μm pores (Costar, Cambridge, MA) that were precoated with collagen (0.4 mg/cm2) and fibronectin (2 μg/cm2). Monolayer integrity was validated by overlaying Texas Red dextran 10 kDa (20 μg/mL) and measuring fluorescence intensity (excitation, 595 nm; emission, 625 nm) in the lower chamber. HUVEC monolayers were stimulated with 5 ng/mL of TNF‐α for 24 hours before performing migration studies in order to induce adhesion molecule expression.34 THP‐1 cells were incubated in the presence of 25 μmol/L of CellTrace Far Red for 45 minutes at 37°C, washed, and migration initiated by the addition of these fluorescently‐labeled cells (1×10⁵ cells per insert) to the upper chamber of the transwell. Studies were performed in the presence of bilirubin (0–20 μmol/L) or vehicle, which was added to the medium (F‐12K plus 0.1% human serum albumin) in both the upper and lower chambers. Transendothelial migration was quantified by measuring CellTrace fluorescence intensity (excitation, 625 nm; emission, 670 nm) in the lower chamber of the transwell at the indicated time intervals using a Biotek Synergy H1 reader.35 The accuracy of the measurements was validated by direct cell count. Migration studies also were conducted in the presence of maximally effective concentrations of blocking antibodies to VCAM‐1 (10 μg/mL), ICAM‐1 (10 μg/mL), α4 (20 μg/mL), and/or β2 (5 μg/mL), which were added to the upper chamber of the transwell. As control, isotype antibody was found to have no effect on THP‐1 migration. In experiments using maximally effective concentrations of the Nox inhibitor, ML171 (10 μmol/L), and/or the XO inhibitor, allopurinol (40 μmol/L), reagents were solubilized in DMSO and added to both the upper and lower chambers (final DMSO concentration, 0.05%).
Cell Adhesion Assay
HUVECs were seeded on 96‐well plates (Thermo Scientific) at a density of 1×10⁴ cells per well and grown to confluence. Monolayers were stimulated with 5 ng/mL of TNF‐α for 24 hours in the presence of bilirubin or vehicle, after which THP‐1 monocytes (1×10⁵ cells per well) labeled with 25 μmol/L of CellTrace Far Red were added. Following a 30‐minute incubation at 37°C, nonadherent monocytes were removed by gently vortexing and aspirating the supernatant 3 sequential times, as previously described.15, 19 Monolayers were then overlaid with 100 μL of PBS and adherence was quantified by measuring CellTrace fluorescence intensity.36
Measurement of Cellular Reactive Oxygen Species by Confocal Microscopy
HUVECs were grown on 35‐mm glass‐bottomed culture dishes (Ibidi, Munich, Germany) and stimulated with 5 ng/mL of TNF‐α for 24 hours to induce adhesion molecule expression. Monolayers were subsequently washed and incubated in the presence or absence of 10 μg/mL of anti‐VCAM‐1 or anti‐ICAM‐1 antibody for 30 minutes at 37°C. Cells were then washed, loaded with 1 μmol/L dihydrorhodamine, and incubated in the presence of 20 μmol/L of bilirubin or vehicle in Phenol Red–free medium for 15 minutes. Additional studies were conducted in the presence of ML171 (10 μmol/L) or AP (40 μmol/L). Adhesion molecule activation was triggered by the addition of cross‐linking goat anti‐mouse (1:100) secondary antibodies (Pierce, Rockford, IL) and the subsequent time‐dependent changes in dihydrorhodamine fluorescence intensity (excitation, 485 nm; emission, 525 nm) were quantified by confocal microscopy (Zeiss 7 LIVE; Carl Zeiss, Jena, Germany), as previously described.19
Xanthine Oxidase Inhibition Assay
XO activity was determined by colorimetric assay using an Amplex Red Xanthine/Xanthine Oxidase Assay Kit (Molecular Probes), according to the manufacturersȧ instructions. H2O2 production was quantified by measuring absorbance at 571 nm. All reactions were conducted at room temperature for 15 minutes. Bilirubin and the XO inhibitors AP and 2‐chloro‐6(methylamino)purine (CMAP), were solubilized in DMSO.
Murine Model of Atherosclerosis
Ldlr −/− mice on a C57BL/6 background were a generous gift from Dr David Hui (University of Cincinnati, Cincinnati, OH). Animals were maintained in a pathogen‐free environment on a 12‐hour light/dark cycle. Beginning at 12 weeks of age, male mice were fed a Western (D12108C; 20% fat, 1.25% cholesterol; Research Diets, Inc, New Brunswick, NJ) diet ad libitum while simultaneously receiving daily intraperitoneal injections of vehicle (50 mmol/L of K3PO4 plus 10% serum; n=4), bilirubin (30 mg/kg body weight in vehicle; n=7), or sham (n=7) for 8 weeks. Body weight was monitored weekly. Because the marked lipemia in Western diet–fed Ldlr −/− mice impedes the serological assay for bilirubin,37, 38 steady‐state bilirubin levels were determined in chow‐fed congenic C57BL/6J (The Jackson Laboratory, Bar Harbor, ME) mice. All studies were reviewed and approved by the University of Cincinnati Institutional Animal Care and Use Committee (protocol #14‐03‐03‐01).
Histological Analysis of Aortic Root Lesions
The heart and aorta were removed and prepared as previously described.39, 40 Briefly, hearts were embedded in optimal cutting temperature compound (Tissue‐Tek), frozen, and 7‐μm sections obtained with a cryostat (Leica Biosystems, Wetzlar, Germany), commencing at the valve nubs and appearance of the coronary artery and continuing through the aortic sinus until the valve separates at the base.40 Serial aortic root sections were stained with Oil Red O to assess for neutral lipid accumulation and with Sirius Red to identify collagen deposition.12 Immunohistochemical staining for α‐smooth muscle (α‐SM) actin (prediluted; Roche, Indianapolis, IN) to detect smooth muscle cells41 was conducted using an OmniMap detection kit (Roche). Immunofluorescence for VCAM‐1 (1:500; Biorbyt Ltd, Cambridge, UK), ICAM‐1 (1:75; Abcam, Cambridge, MA), CD68 (macrophages; 1:25; Abcam), CD3 (T lymphocytes; prediluted; Ventana Medical Systems, Oro Valley, AZ), chlorinated tyrosines (ROS; 1:100; Hycult Biotech, Uden, The Netherlands), and nitrosylated tyrosines (reactive nitrogen species; 1:100; Life Technologies, Invitrogen, CA) was assessed using anti‐rabbit secondary antibodies conjugated to Alexa488 (1:100; Life Technologies) and 4,6‐diamidino‐2‐phenylindole (DAPI) counterstaining. Images were obtained using an Olympus BX61 microscope (Olympus, Tokyo, Japan). Quantitative analyses of the lesion area were performed on digitalized images using ImageJ software (National Institutes of Health, Bethesda, MD) and expressed as ratios of lesion area to total valve area or as ratios of compositional area to total lesion area, as previously described.39, 42
Determination of Serum Bilirubin, Lipid, Lipid Peroxide, and Chemokine Levels
Blood samples were collected at the time of euthanasia. Serum bilirubin levels were determined using the Sigma Diagnostics Total Bilirubin Assay Kit (Sigma Chemical), as previously described.31 Serum chemokines (MCP‐1, MIP‐1α, and RANTES) were detected using an Immunology Multiplex Assay Kit (EMD Millipore), according to the manufacturer's instructions, and quantified by Luminex.33 Serum total cholesterol and triglyceride levels were determined using Cholesterol Fluorometric Assay and Triglyceride Colorimetric Assay Kits, respectively (Cayman Chemical Co, Ann Arbor, MI). Serum malondialdehyde (MDA) concentration, a marker of lipid peroxidation, was quantified using a Lipid Peroxidation (MDA) Fluorometric Assay Kit (Abcam).
Statistical Analyses
Data were analyzed using a computer‐based statistical package (SSI SigmaStat; Systat Software Inc, San Jose, CA) with differences between mean values assessed for statistical significance. For normally distributed data, one‐way ANOVA with Holm–Sidak post‐hoc analysis was used to correct for multiple hypothesis testing. For data that were not normally distributed, a nonparametric Kruskal–Wallis test was performed. Curve‐fit analyses were conducted utilizing a mixed model with random effects as implemented in SAS PROC MIXED. Experiment ID was included as a random effect to define non‐independent observations, with treatment, time, and a treatment×time interaction term included in the model. Identical results were obtained when the “repeated” statement was used.
Results
Induction of Adhesion Molecule Expression by HUVECs
To facilitate investigation of the effect of bilirubin on VCAM‐1‐ and ICAM‐1‐mediated leukocyte migration in vitro, we first identified conditions that optimized expression of these 2 adhesion molecules. HUVEC monolayers were incubated in the presence of TNF‐α, and cellular mRNA and protein levels for VCAM‐1 and ICAM‐1 were quantified by qRT‐PCR and Western blotting. We simultaneously assessed for expression of PECAM‐1, which also facilitates leukocyte transmigration,43 and E‐Selectin and P‐Selectin, which mediate leukocyte rolling.44 Consistent with previous reports,45 TNF‐α induced a marked increase in mRNA for E‐Selectin, VCAM‐1, and ICAM‐1 at 4 hours, while expression of P‐Selectin and PECAM‐1 was unchanged (Figure 1A and 1B). Concordantly, protein levels of E‐Selectin, VCAM‐1, and ICAM‐1 (Figure 1C and 1D) were significantly elevated after 4 hours of TNF‐α treatment, but only VCAM‐1 and ICAM‐1 exhibited sustained expression out to 24 hours.46 To specifically facilitate an analysis of the effect of bilirubin on these 2 adhesion molecules, all subsequent experiments used a 24‐hour incubation period.
Figure 1.
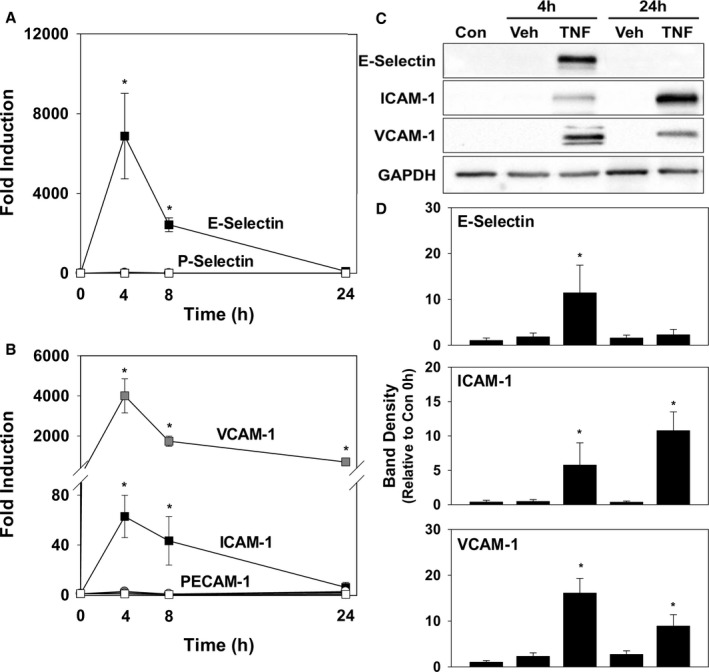
Time course for TNF‐α‐induced expression of adhesion molecules by HUVECs. HUVEC monolayers were incubated in the presence of 5 ng/mL of TNF‐α (TNF; squares) or the TNF vehicle (Veh; circles), and expression of VCAM‐1, ICAM‐1, E‐Selectin, P‐Selectin, and PECAM‐1 was determined at the indicated time points by qRT‐PCR and western blotting. A, Time‐dependent changes in mRNA for E‐Selectin (black symbols) and P‐Selectin (white symbols), while (B) displays the results obtained for VCAM‐1 (gray symbols), ICAM‐1 (black symbols), and PECAM‐1 (white symbols). Data reflect mRNA levels (±SEM) relative to untreated cells (n=4 separate sets of experiments). C, Representative immunoblots for E‐Selectin, ICAM‐1, and VCAM‐1, with graphs (D) quantifying expression at the indicated time points relative to unstimulated cells at time 0 (Con) and corrected for GAPDH (n=3 sets of experiments). *P<0.05 vs Veh at that time point. Con indicates control; HUVEC, human umbilical vein endothelial cell; ICAM‐1, intercellular adhesion molecule 1; mRNA, messenger RNA; PECAM‐1, platelet‐endothelial cell adhesion molecule 1; qRT‐PCR, quantitative reverse‐transcription polymerase chain reaction; TNF‐α, tumor necrosis factor alpha; VCAM‐1, vascular cell adhesion molecule 1.
Bilirubin Inhibits Monocyte Migration Across Endothelial Cell Monolayers
To determine whether bilirubin modulates human monocyte migration, HUVECs were seeded and grown in the upper chamber of a transwell system. CellTrace Far Red–labeled THP‐1 monocytes were overlaid onto confluent HUVEC monolayers and the time course for transmigration was assessed by measuring fluorescence intensity in the lower chamber. Expression of VCAM‐1 and ICAM‐1 was stimulated by incubating HUVECs in the presence of TNF‐α, which induced a significant increase in THP‐1 cell migration (Figure 2A). Bilirubin blocked TNF‐α‐stimulated monocyte migration in a dose‐dependent manner (Figure 2B), with maximal inhibition achieved by bilirubin concentrations within the upper‐normal physiological range (20 μmol/L ≈1.2 mg/dL).
Figure 2.
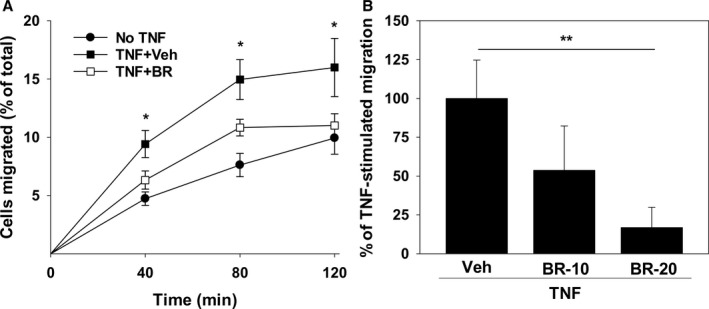
Bilirubin inhibits the migration of THP‐1 monocytes across activated HUVEC monolayers. A, Time course for migration of CellTrace Far Red–labeled THP‐1 cells across confluent HUVEC monolayers that were preincubated with (squares) or without (circles) 5 ng/mL of TNF‐α for 24 hours. Studies were conducted in the presence of 20 μmol/L of bilirubin (BR; white symbols) or the bilirubin vehicle (Veh; black symbols). Displayed is the percentage of THP‐1 cells in the lower chamber of the transwell (expressed relative to the total number added to the upper chamber) at the indicated time points. B, Dose‐dependent effect of 10 (BR‐10) and 20 (BR‐20) μmol/L of bilirubin on THP‐1 migration at 120 minutes expressed as the percentage of TNF‐stimulated migration in the presence of the bilirubin vehicle. Bars reflect the mean (±SEM) of 4 sets of experiments. *P<0.05 vs No TNF, TNF+BR; **P<0.05. HUVEC indicates human umbilical vein endothelial cell; TNF‐α, tumor necrosis factor alpha.
Release of cytokines and chemokines by activated endothelia fosters the recruitment of inflammatory cells that promote atherogenesis.47 To determine whether bilirubin modulates endothelial cell production of cytokines relevant to leukocyte trafficking, we examined its effect on interleukin (IL)‐6, IL‐1β, IL‐8, MCP‐1, M‐CSF, and RANTES release into the culture medium of TNF‐α‐activated HUVECs. As shown in Figure 3, bilirubin did not alter the cellular generation of any of these cytokines, suggesting that it does not act by regulating inflammatory or chemotactic stimuli. Further support for this conclusion is provided by our finding that addition of MCP‐1 to the lower chamber of the transwell did not augment bilirubin‐inhibited THP‐1 cell transmigration (data not shown).
Figure 3.
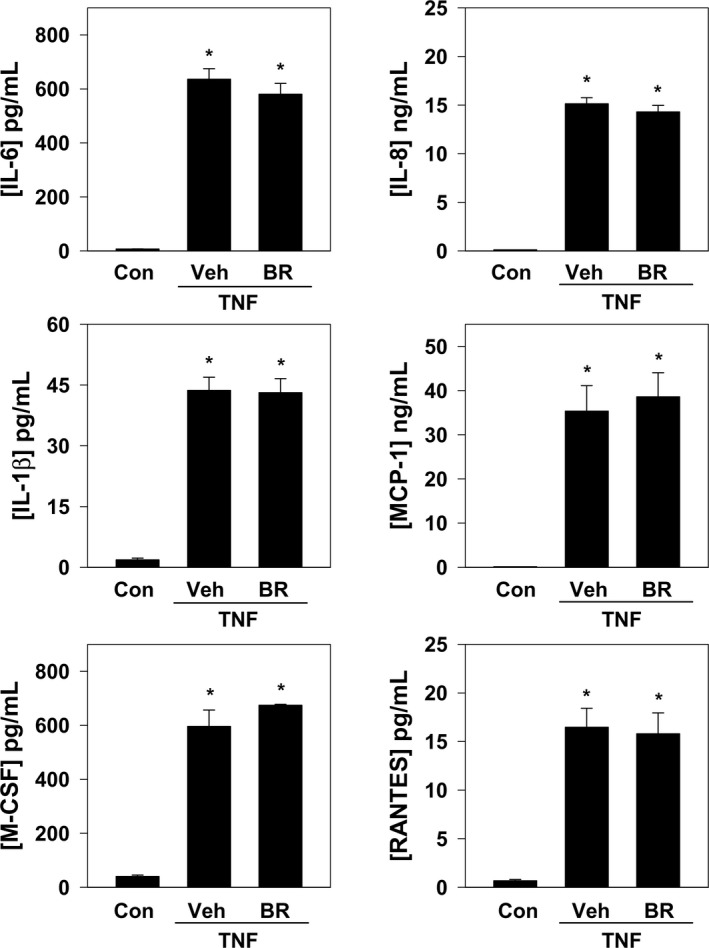
Bilirubin does not alter cytokine or chemokine expression by activated HUVECs. HUVEC monolayers were incubated with TNF‐α (5 ng/mL) in the presence of bilirubin (BR; 20 μmol/L) or the bilirubin vehicle (Veh) for 24 hours, and protein levels of IL‐6, IL‐8, IL‐1β, MCP‐1, M‐CSF, and RANTES in cell‐culture medium were determined by Luminex. Bars reflect mean (±SEM) expression relative to unstimulated HUVECs (Con; n=4 sets of experiments). *P<0.05 vs Con. Con indicates control; HUVEC, human umbilical vein endothelial cell; IL, interleukin; MCP‐1, monocyte chemoattractant protein‐1; M‐CSF, macrophage colony stimulating factor; RANTES, regulated on activation, normal T cell expressed and secreted; TNF‐α, tumor necrosis factor alpha.
Because transendothelial migration is predicated upon binding of leukocyte integrins to endothelial cell adhesion molecules, we investigated the influence of bilirubin on adhesion molecule expression. As shown in Figure 4, incubation of HUVECs in the presence of bilirubin did not alter basal or TNF‐α‐stimulated mRNA or protein levels of VCAM‐1, ICAM‐1, PECAM‐1, E‐Selectin, or P‐Selectin. Consistent with these findings, no effect of bilirubin on monocyte adhesion to untreated or TNF‐α‐stimulated HUVECs was observed (Figure 4A, lower right panel), indicating that bilirubin does not prevent monocyte migration by disrupting adhesion molecule expression or binding to leukocyte integrins.
Figure 4.
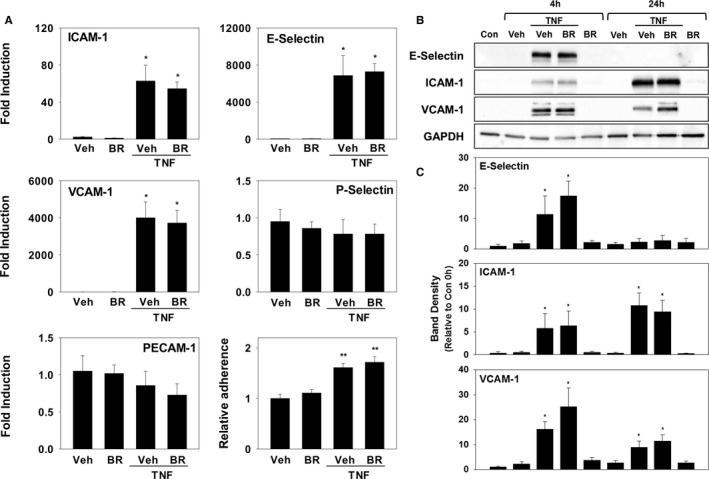
Bilirubin does not alter adhesion molecule expression or monocyte binding to HUVECs. HUVEC monolayers were incubated with or without TNF‐α (5 ng/mL) in the presence of bilirubin (BR; 20 μmol/L) or the bilirubin vehicle (Veh). A, mRNA levels for ICAM‐1, VCAM‐1, PECAM‐1, E‐Selectin, and P‐Selectin at baseline and at 4 hours (n=4 sets of experiments). The right lower panel depicts the results of an adhesion assay measuring the binding of CellTrace Far Red–labeled THP‐1 cells to HUVEC monolayers incubated with or without TNF‐α for 24 hours. Bars reflect mean fluorescence intensity (±SEM) relative to non‐TNF‐α‐activated HUVECs (n=4 sets of experiments). B, Representative immunoblots for E‐Selectin, ICAM‐1, and VCAM‐1, which are quantified (C) as described in Figure 1 (n=4 sets of experiments). *P<0.05 vs Veh, BR at that time point; **P<0.001 vs Veh, BR. Con indicates control; HUVEC, human umbilical vein endothelial cell; ICAM‐1, intercellular adhesion molecule 1; mRNA, messenger RNA; PECAM‐1, platelet‐endothelial cell adhesion molecule 1; TNF‐α, tumor necrosis factor alpha; VCAM‐1, vascular cell adhesion molecule 1.
Influence of Bilirubin on Endothelial Cell Reactive Oxygen Species Production in Response to Activation of VCAM‐1 and ICAM‐1
Because bilirubin is a potent antioxidant,17 we assessed whether it is able to inhibit the generation of ROS (ie, O2˙−, H2O2) that mediate endothelial cell signaling through VCAM‐1 (by activation of Nox) and/or ICAM‐1 (by activation of XO).15, 27, 28 To directly examine the influence of bilirubin on endothelial ROS signaling, TNF‐α‐activated HUVECs were incubated with anti‐VCAM‐1 or anti‐ICAM‐1 antibodies and then loaded with the redox‐sensitive fluorophore, dihydrorhodamine. Adhesion molecule activation was triggered by the addition of cross‐linking antibodies,15, 19 and fluorescence intensity was quantified by confocal microscopy. As expected, activation of VCAM‐1 (Figure 5, left panels) or ICAM‐1 (Figure 5, right panels) produced a robust time‐dependent increase in cellular fluorescence (indicative of ROS generation) that was markedly attenuated by bilirubin (Figure 5, lower panels). To validate these findings, we utilized ML171, which specifically blocks Nox activity by interfering with the catalytic subunit (but without affecting other cellular ROS‐producing enzymes),48 and AP, a purine analog that competitively inhibits XO.49 As anticipated, treatment with ML171 completely suppressed cellular ROS production in response to activation of VCAM‐1 (Figure 6A) while exerting no effect on ICAM‐1‐generated ROS (Figure 6B), whereas AP significantly abrogated ICAM‐1‐dependent ROS generation (Figure 6B) without altering VCAM‐1‐generated ROS (Figure 6A).
Figure 5.
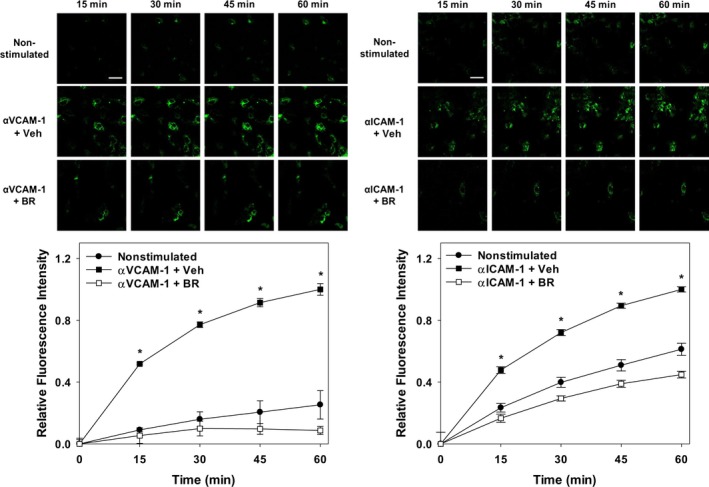
Bilirubin suppresses cellular ROS generation following activation of VCAM‐1 or ICAM‐1. TNF‐α‐activated HUVEC monolayers were incubated with anti‐VCAM‐1 (left panels, αVCAM‐1; 10 μg/mL) or anti‐ICAM‐1 (right panels, αICAM‐1; 10 μg/mL) for 30 minutes and then loaded with dihydrorhodamine. Adhesion molecule activation was triggered by the addition of a cross‐linking antibody and ROS generation quantified by confocal microscopy. Upper panels display representative time‐lapse images of nonstimulated and antibody‐activated cells treated with 20 μmol/L of bilirubin (BR) or the bilirubin vehicle (Veh). Scale bars represent 100 μm. Lower panels plot the time‐dependent changes in fluorescence intensity following VCAM‐1 (left panel) or ICAM‐1 (right panel) activation (squares), in the presence (white symbols) or absence (black symbols) of bilirubin. Cells that were not treated with cross‐linking antibodies (nonstimulated; circles) serve as control, with curves reflecting mean fluorescence intensity (±SEM) expressed relative to maximal activation at 60 minutes (n=3 sets of experiments). *P<0.001 vs nonstimulated, αVCAM‐1+BR and P<0.001 vs nonstimulated, αICAM‐1+BR. HUVEC, human umbilical vein endothelial cell; ICAM‐1, intercellular adhesion molecule 1; ROS, reactive oxygen species; TNF‐α, tumor necrosis factor alpha; VCAM‐1, vascular cell adhesion molecule 1.
Figure 6.
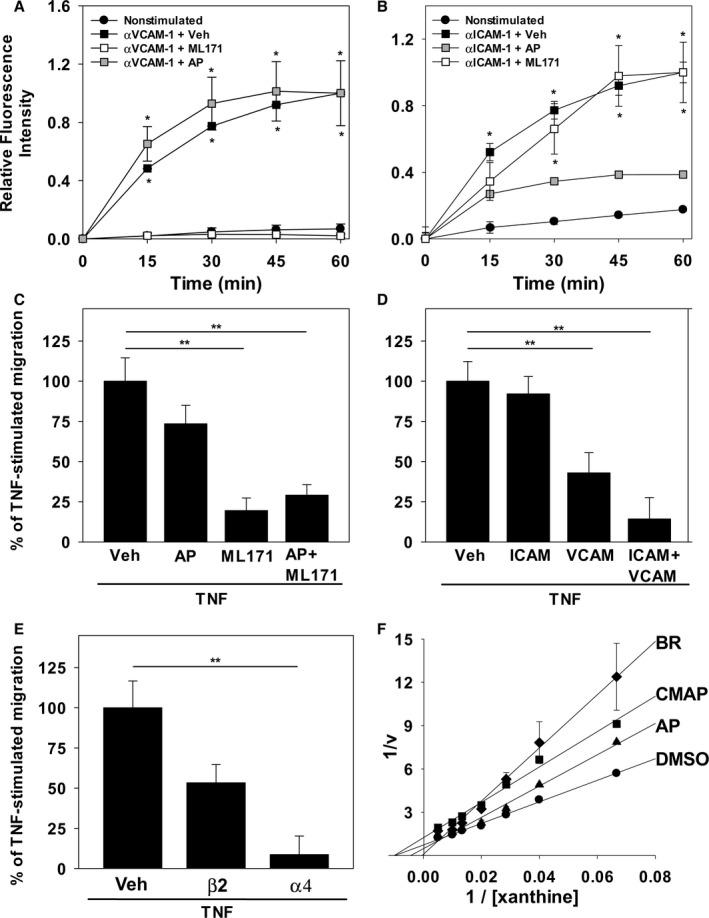
Nox and XO inhibitors and antibodies against VCAM‐1 and ICAM‐1 recapitulate the effect of bilirubin on endothelial ROS generation and monocyte transmigration. ROS production by TNF‐α‐stimulated HUVEC monolayers was assessed by monitoring dihydrorhodamine fluorescence following activation of VCAM‐1 (αVCAM‐1) or ICAM‐1 (αICAM‐1), as described in Figure 5. A and B, Time‐dependent changes in fluorescence intensity following VCAM‐1 (A) or ICAM‐1 (B) activation (squares), in the absence (black symbols) or presence of 10 μmol/L of ML171 (white symbols), or 40 μmol/L of allopurinol (AP; gray symbols). Curves reflect mean fluorescence intensity (±SEM) expressed relative to maximal activation at 60 minutes (n=3 sets of experiments). C, Compares the effect of the DMSO vehicle (Veh), 40 μmol/L of AP, and/or 10 μmol/L of ML171 on THP‐1 cell migration across HUVEC monolayers, as described in Figure 2 (n=4 sets of experiments). D and E, Results of analogous studies examining THP‐1 migration in the presence or absence of antibodies against ICAM‐1 (ICAM; 10 μg/mL), VCAM‐1 (VCAM; 10 μg/mL), β2 (5 μg/mL), and/or α4 (20 μg/mL). F, Lineweaver–Burk plot of H2O2 produced by isolated XO in the presence of 50 μmol/L of bilirubin (BR; diamonds; Ki=3.4 μmol/L), 30 μmol/L of the competitive inhibitor, AP (triangles; Ki=6.7 μmol/L), 30 μmol/L of the noncompetitive inhibitor, 2‐chloro‐6(methylamino) purine (CMAP; squares; Ki=4.7 μmol/L), or the DMSO vehicle (circles). Data reflect the mean (±SEM) of 3 sets of experiments. *P<0.001 verus nonstimulated, αVCAM‐1+ML171 and P<0.001 vs nonstimulated, αICAM‐1+AP; **P<0.05. HUVEC indicates human umbilical vein endothelial cell; ICAM‐1, intercellular adhesion molecule 1; Nox, NADPH oxidase; ROS, reactive oxygen species; TNF‐α, tumor necrosis factor alpha; VCAM‐1, vascular cell adhesion molecule 1; XO, xanthine oxidase.
Relative Contribution of VCAM‐1 and ICAM‐1 to TNFα‐Induced Monocyte Migration
To confirm that inhibition of VCAM‐1 or ICAM‐1 signaling disrupts monocyte transendothelial migration, and to delineate the relative contributions of VCAM‐1 and ICAM‐1 to this process, the effect of ML171 and/or AP on the movement of THP‐1 cells across HUVEC monolayers was assessed using a transwell system. As shown in Figure 6C, treatment of HUVECs with maximal inhibitory concentrations of the Nox inhibitor, ML171, was associated with a substantial reduction in TNF‐α‐stimulated monocyte migration, whereas the XO inhibitor, AP, had minimal effect, supporting a primary role for VCAM‐1 in monocyte transmigration. Consistent with these findings, incubation of HUVEC monolayers with anti‐VCAM‐1, but not anti‐ICAM‐1, caused significant inhibition of THP‐1 cell migration, with modest synergy when both antibodies were combined (Figure 6D). These data were further validated using antibodies that specifically block leukocyte integrin binding to VCAM‐1 (anti‐α4) or ICAM‐1 (anti‐β2; Figure 6E). While bilirubin has been shown to suppress Nox‐mediated ROS production in vitro,21 data regarding its effect on XO are lacking. Using an Amplex Red assay system, we studied the XO‐catalyzed generation of H2O2. Reciprocal plots (Figure 6F) demonstrate that bilirubin inhibits XO‐catalyzed H2O2 production in a competitive manner, with potency nearly twice that of AP. Taken together, our results indicate that VCAM‐1 constitutes the principal adhesion molecule mediating TNF‐α‐induced monocyte migration, and support the hypothesis that bilirubin inhibits monocyte transmigration by disrupting adhesion molecule‐dependent ROS signaling.
Effect of Bilirubin on the Development of Atherosclerotic Lesions in Ldlr−/− Mice
To determine whether bilirubin prevents atherogenesis in vivo, we used a murine model in which Ldlr −/− mice were fed a Western (high‐fat) diet. We administered a once‐daily dose of bilirubin (30 mg/kg), which produced a 3‐fold increase (1.7 mg/dL≈28.9 μmol/L) in steady‐state serum levels (Figure 7A). Mice received intraperitoneal bilirubin (n=7), vehicle (n=4), or sham (n=7) once‐daily for a total of 8 weeks. All animals appeared outwardly healthy throughout the course of the study. There were no significant differences in body weight (Figure 7B), serum triglycerides (Figure 7C), or serum cholesterol (Figure 7D) between the treatment groups, although there was a strong trend toward reduced triglyceride levels in mice that received bilirubin. At the end of treatment, cross‐sectional analysis of Oil Red O–stained aortic root specimens from sham‐ and vehicle‐treated mice demonstrated large, well‐established atherosclerotic plaques (Figure 8A), while bilirubin‐treated animals had significantly smaller lesions (Figure 8A) with reduced deposition of extracellular matrix and diminished numbers of smooth muscle cells (Figure 8B and 8C). Mice that received bilirubin also had fewer CD68‐ (Figure 9A) and CD3‐positive (Figure 9B) positive leukocytes in aortic root lesions, despite unchanged expression of VCAM‐1 and ICAM‐1 (Figure 10) and no differences in serum levels of the principal leukocyte chemoattractants,50 MCP‐1, MIP‐1α, or RANTES (Figure 11A through 11C). These data suggest that bilirubin impedes infiltration of monocytes and lymphocytes into the aortic root in spite of adequate adhesion molecule expression and chemotactic stimuli. Bilirubin‐treated animals also manifested significantly (albeit modestly) reduced serum indicators of lipid peroxidation (Figure 11D), and aortic root lesions from these mice exhibited substantially reduced immunoreactivity to chlorotyrosine and nitrotyrosine (Figure 9C and 9D), markers of tissue oxidation.39 These observations support a mitigating effect of bilirubin on oxidative and nitrosative stress and, when taken in conjunction with our finding that bilirubin suppresses VCAM‐1‐ and ICAM‐1‐stimulated endothelial ROS production (Figure 5), are consistent with the hypothesis that bilirubin prevents atherosclerotic plaque formation by inhibiting leukocyte migration through scavenging of ROS signaling intermediaries.
Figure 7.
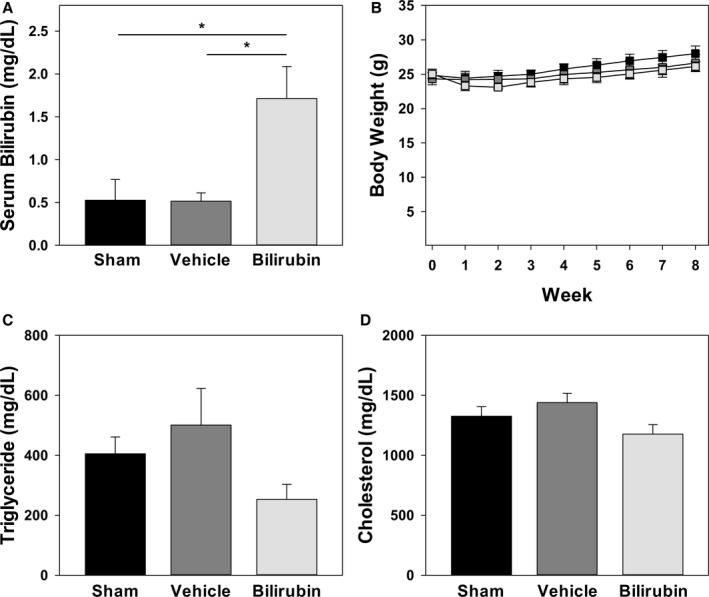
Effect of bilirubin administration on body weight, serum bilirubin, and lipid levels. A, Serum bilirubin levels in chow‐fed C57BL/6J mice that were administered intraperitoneal injections of bilirubin (30 mg/kg), vehicle, or sham once‐daily for 5 days. Bars reflect the mean (±SEM) for each treatment group (n=5–6). B, Body weights of Western diet–fed Ldlr −/− mice receiving intraperitoneal bilirubin (light gray symbols), vehicle (dark gray symbols), or sham (black symbols). Data points reflect the mean (±SEM) for each treatment group (n=4–7). C and D, Serum triglyceride and cholesterol levels, respectively, in Ldlr −/− mice after 8 weeks on a Western diet, with bars reflecting the mean (±SEM) for each treatment group (n=4–7). Although not statistically significant, bilirubin‐treated mice exhibited a strong trend toward reduced serum triglyceride concentrations when compared to sham (P=0.066) and vehicle (P=0.053) groups. *P<0.05.
Figure 8.
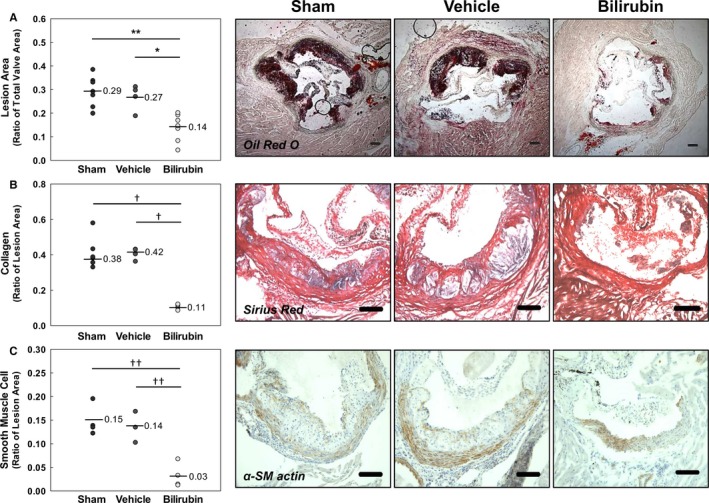
Bilirubin inhibits the formation of aortic root lesions in Ldlr −/− mice. Animals received intraperitoneal bilirubin (30 mg/kg), vehicle, or sham for 8 weeks while on a Western diet. A through C, Representative photomicrographs of aortic root sections stained for lipid (Oil Red O; A), extracellular matrix (Sirius Red; B), or smooth muscle cells (α‐smooth muscle [α‐SM] actin; C). Scale bars represent 100 μm. Panels on the left indicate the results of quantitative morphometric analysis, with (A) expressed as the ratio of lesion area to total valve area and (B and C) expressed as the ratio of compositional area to total lesion area. The geometric mean is indicated with a line for each treatment group (n=4–7). *P<0.01; **P<0.001; † P<0.05; †† P<0.005.
Figure 9.
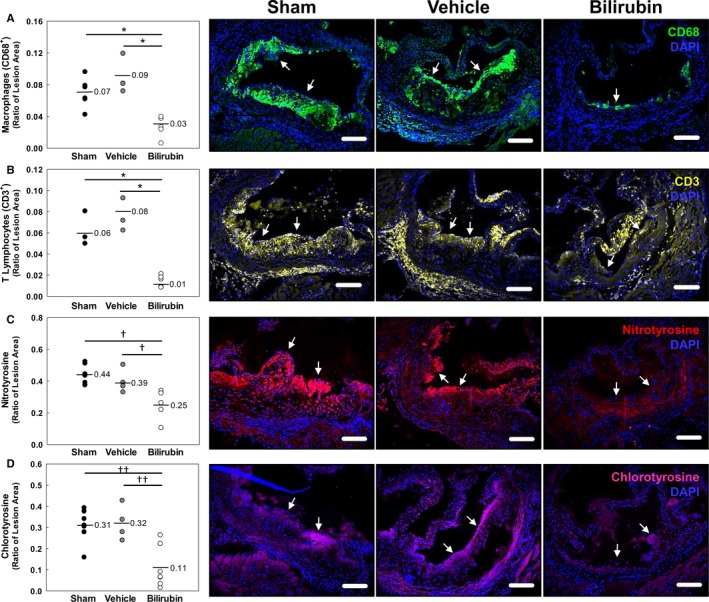
Bilirubin decreases leukocyte infiltration and oxidative injury in the aortic root of Ldlr −/− mice. A through D, Representative photomicrographs of aortic root sections stained with immunofluorescent antibodies against CD68 (macrophages; green; A), CD3 (lymphocytes; yellow; B), nitrotyrosine (red; C), or chlorotyrosine (pink; D) and counterstained with DAPI (blue). Arrows mark the luminal margin of atherosclerotic lesions. Scale bars represent 100 μm. Panels on the left indicate the pooled results of morphometric analysis of the aortic root images, with the horizontal line indicating the geometric mean and data expressed as the ratio of positively stained areas to total lesion area. Treatment groups are as described in Figure 8. *P<0.001; † P<0.05; †† P<0.005. DAPI indicates 4',6‐diamidino‐2‐phenylindole.
Figure 10.
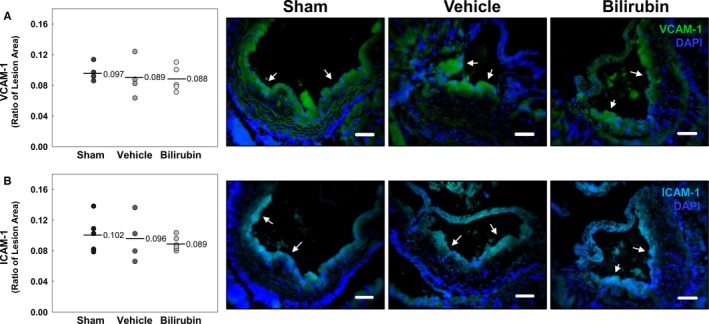
Bilirubin does not alter VCAM‐1 or ICAM‐1 expression in Ldlr −/− mice. A and B, Representative photomicrographs of sections of aortic root stained with immunofluorescent antibodies against VCAM‐1 (green; A) or ICAM‐1 (cyan; B). Data are presented and analyzed as described in Figure 9. DAPI indicates 4',6‐diamidino‐2‐phenylindole; ICAM‐1, intercellular adhesion molecule 1; VCAM‐1, vascular cell adhesion molecule 1.
Figure 11.
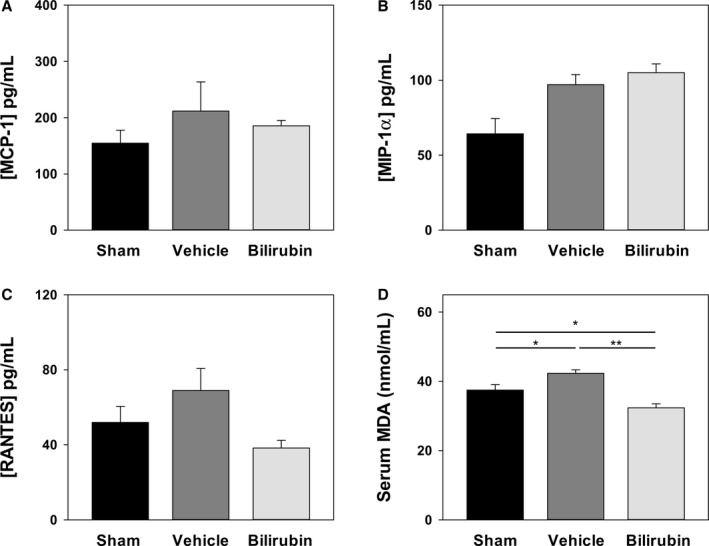
Effect of bilirubin on serum parameters in Ldlr −/− mice. Blood was collected from Ldlr −/− mice after 8 weeks on a Western diet and serum levels of MCP‐1 (A), MIP‐1α (B), and RANTES (C) determined by Luminex. D, Serum concentrations of malondialdehyde (MDA) quantified by fluorometric assay, with bars reflecting the mean (±SEM) for each treatment group (n=4–7). Treatments are as described in Figure 8. *P<0.05; **P<0.001. MCP‐1 indicates monocyte chemoattractant protein‐1; M‐CSF, macrophage colony stimulating factor; RANTES, regulated on activation, normal T cell expressed and secreted.
Discussion
Although numerous epidemiological studies have identified an inverse association between serum bilirubin levels and incidence of cardiovascular disease,1, 2, 3, 4, 5 it has not previously been shown that bilirubin is able to prevent atherosclerosis. In the present studies, we demonstrate that administration of bilirubin to Ldlr −/− mice impedes plaque formation and significantly reduces the infiltration of monocytes and lymphocytes into aortic root lesions, processes that are VCAM‐1‐ and ICAM‐1‐dependent.12, 15, 51, 52 We further show that bilirubin effectively blocks VCAM‐1‐ and ICAM‐1‐mediated migration of monocytes across activated endothelial monolayers at bilirubin concentrations (≤20 μmol/L) that are within the normal physiological range (women, 3–20 μmol/L; men, 5–29 μmol/L).53 These findings correlate well with epidemiological data demonstrating that patients in the highest quartile of serum bilirubin (>12–17 μmol/L) exhibit a decreased incidence of coronary1, 2, 4 and carotid54 artery disease, as compared with those in the lowest quartile (<7–10 μmol/L). Concordantly, individuals possessing the prevalent Gilbert's polymorphism, which is associated with mildly elevated serum bilirubin levels as a consequence of reduced expression of the bilirubin‐specific 1A1 isoform of UDP‐glucuronosyltransferase,55 have been found to develop ischemic heart disease at significantly lower rates than the general population.5, 56 Given that the recruitment and subendothelial accumulation of leukocytes are key initiating events in the formation of atherosclerotic plaques,13, 29 our findings suggest a potential mechanism as to how bilirubin exerts a cardioprotective effect.
Binding of leukocyte integrins to VCAM‐1 or ICAM‐1 has been shown to trigger signaling cascades that lead to production of superoxide and hydrogen peroxide within the endothelial cell.28, 57 These ROS induce downstream alterations in the endothelial junctional structure that facilitate the transmigration of leukocytes.20 Given that bilirubin is a potent, chain‐breaking antioxidant,17 we postulated that it would disrupt the endothelial response to adhesion molecule activation by scavenging superoxide and hydrogen peroxide signaling intermediaries (Figure 12). Our demonstration that bilirubin attenuates ROS generation by activated HUVECs in response to VCAM‐1 or ICAM‐1 cross‐linking and inhibits H2O2 production by isolated XO enzyme supports this hypothesis. These findings are in line with previous studies in which bilirubin has been shown to suppress VCAM‐1‐dependent ROS generation by murine high endothelial cells19 and scavenge Nox‐derived O2˙− and H2O2 in murine macrophages.21 That these mechanisms are relevant primarily at the tissue level in vivo are supported by the more pronounced inhibition by bilirubin of chlorinated and nitrosylated tyrosine formation in the aortic root, as compared with its modest effect on serum markers of lipid peroxidation.
Figure 12.
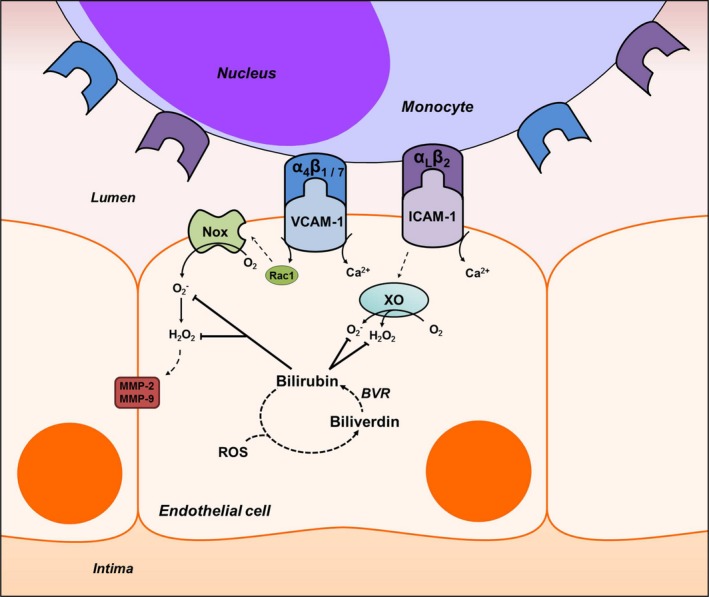
Proposed mechanism of bilirubin modulation of VCAM‐1‐ and ICAM‐1‐dependent monocyte migration. Ligation of VCAM‐1 and ICAM‐1 with their corresponding integrins, α4β1/α4β7 and αLβ2, leads to Rac‐1‐ and calcium (Ca2+)‐dependent activation of NADPH oxidase (Nox) and xanthine oxidase (XO). These enzymes generate the reactive oxygen species (ROS), superoxide (O2˙−) and hydrogen peroxide (H2O2), that comprise a signaling cascade, which leads to activation of matrix metalloproteinases (MMP)‐2 and ‐9 and disruption of endothelial tight junctions. Bilirubin, a potent antioxidant that undergoes intracellular redox cycling (dashed lines) through action of biliverdin reductase (BVR), scavenges Nox‐ and XO‐derived ROS, thereby inhibiting leukocyte migration. ICAM‐1 indicates intercellular adhesion molecule 1; Rac1, Ras‐related C3 botulinum toxin substrate 1; VCAM‐1, vascular cell adhesion molecule 1.
Our data demonstrating that bilirubin does not alter IL‐6, IL‐1β, or IL‐8 production by HUVECs, and does not affect VCAM‐1 or ICAM‐1 expression in vitro or in vivo, suggest that bilirubin does not modulate endothelial activation. These findings are concordant with our previous work showing no impact of bilirubin on VCAM‐1 expression by isolated murine19 or human endothelial cells,20 or in the pulmonary vasculature of mice with allergen‐induced asthma.19 Although we are unable to explain conflicting reports that bilirubin inhibits endothelial VCAM‐1 and ICAM‐1 expression in vitro,58, 59, 60 our demonstration that bilirubin has no influence on monocyte adhesion to TNF‐α‐activated HUVEC monolayers under conditions where transmigration is maximally inhibited supports an effect exerted beyond the step of integrin‐adhesion molecule interaction. Our observations that bilirubin also does not modulate the production of the chemoattractants, MCP‐1, M‐CSF, and RANTES, by activated HUVECs, or circulating levels of MCP‐1, MIP‐1α, and RANTES in Ldlr −/− mice, are consistent with previous reports19 and suggest that bilirubin does not inhibit leukocyte recruitment by regulating chemotactic stimuli.61
As atherosclerotic lesions mature, smooth muscle cells infiltrate the intima, where they proliferate and produce extracellular matrix proteins (eg, collagen).62 We found that bilirubin treatment was associated with a marked reduction in collagen deposition and in the number of smooth muscle cells in aortic root lesions, suggesting that bilirubin impedes plaque progression. While our data do not elucidate whether the decrease in plaque‐associated smooth muscle cells results from impaired migration, induced apoptosis, or reduced proliferation, our findings are consistent with previous reports that bilirubin directly inhibits smooth muscle cell proliferation in vitro and in response to balloon injury in vivo.63 Since it also has been shown that chlorotyrosine promotes aortic smooth muscle cell migration,64 our demonstration that bilirubin reduces the formation of this oxidative by‐product suggests an additional mechanism by which bilirubin may prevent plaque maturation. We note that Ldlr −/− mice treated with bilirubin manifested a strong trend toward reduced serum triglyceride concentrations. This finding is consistent with previous reports describing lower total triglyceride levels in congenitally hyperbilirubinemic rats, as well as in humans with elevated bilirubin levels.65 Although a number of explanations as to how bilirubin may modulate lipid metabolism have been proposed,65 data in support of these hypotheses remain scant.
In summary, we show that bilirubin inhibits monocyte migration across activated human endothelial cells by disrupting VCAM‐1 and ICAM‐1 signaling through scavenging of Nox‐ and XO‐generated ROS, findings that were recapitulated using specific enzyme inhibitors and blocking antibodies. We propose that this effect of bilirubin underlies the inverse association between serum bilirubin levels and cardiovascular disease, and have validated this hypothesis in a murine model of atherosclerosis, in which we show that treatment with bilirubin diminishes the number of monocytes, lymphocytes, and smooth muscle cells, decreases collagen deposition, and reduces oxidative stress in aortic root lesions, without altering adhesion molecule expression or circulating chemokine levels. While other antioxidants, such as tocopherols,66 have the potential to exert similar effects, bilirubin is unique in its ability to readily diffuse into cells67 and to be continuously regenerated by intracellular redox cycling through the action of the ubiquitous biliverdin reductase enzyme.18 It is notable that endothelial adhesion molecules have been implicated in the pathogenesis of a number of inflammatory disorders,10, 20, 68, 69, 70, 71, 72 and bilirubin has been shown to ameliorate animal models of VCAM‐1‐ and ICAM‐1‐mediated inflammation, including colitis,20 allergic pneumonitis,19 and encephalomyelitis.73 Given that the inducible isoform of HO‐1, which catalyzes the rate‐limiting step in bilirubin synthesis, appears to play a key role in attenuating inflammation,74 we speculate that HO‐1‐generated bilirubin may serve a fundamental physiological function with regard to regulation of inflammatory responses.
Sources of Funding
This study was supported by a National Institutes of Health research grant DK 071125 (Zucker) and by a University of Cincinnati: Department of Internal Medicine Rehn Family Research Award (Vogel).
Disclosures
None.
Acknowledgments
The authors gratefully acknowledge David Hui, PhD, for his guidance and assistance with aortic root analyses. We also wish to thank Alex Lentsch, PhD, George Deepe, MD, and Florence Rothenberg, MD, for their helpful suggestions and insights. Additionally, the authors gratefully acknowledge Alyssa Sproles, Betsy A. DiPasquale, and Chet Closson for their kind assistance and guidance.
(J Am Heart Assoc. 2017;6:e004820 DOI: 10.1161/JAHA.116.004820.)28365565
References
- 1. Schwertner HA, Jackson WG, Tolan G. Association of low serum concentration of bilirubin with increased risk of coronary artery disease. Clin Chem. 1994;40:18–23. [PubMed] [Google Scholar]
- 2. Breimer LH, Ebrahim S, Gerald A. Serum bilirubin and risk of ischemic heart disease in middle‐aged British men. Clin Chem. 1995;41:1504–1508. [PubMed] [Google Scholar]
- 3. Djoussé L, Rothman KJ, Cupples LA, Levy D, Ellison RC. Effect of serum albumin and bilirubin on the risk of myocardial infarction (the Framingham Offspring Study). Am J Cardiol. 2003;91:485–488. [DOI] [PubMed] [Google Scholar]
- 4. Hopkins PN, Wu LL, Hunt SC, James BC, Vincent GM, Williams RR. Higher serum bilirubin is associated with decreased risk for early familial coronary artery disease. Arterioscler Thromb Vasc Biol. 1996;16:250–255. [DOI] [PubMed] [Google Scholar]
- 5. Lin JP, O'Donnell CJ, Schwaiger JP, Cupples LA, Lingenhel A, Hunt SC, Yang S, Kronenberg F. Association between the UGT1A1*28 allele, bilirubin levels, and coronary heart disease in the Framingham Heart Study. Circulation. 2006;114:1476–1481. [DOI] [PubMed] [Google Scholar]
- 6. Wagener F, Volk HD, Willis D, Abraham NG, Soares MP, Adema GJ, Figdor CG. Different faces of the heme‐heme oxygenase system in inflammation. Pharmacol Rev. 2003;55:551–571. [DOI] [PubMed] [Google Scholar]
- 7. Ishikawa K, Navab M, Leitinger N, Fogelman AM, Lusis AJ. Induction of heme oxygenase‐1 inhibits the monocyte transmigration induced by mildly oxidized LDL. J Clin Invest. 1997;100:1209–1216. [DOI] [PMC free article] [PubMed] [Google Scholar]
- 8. Hayashi S, Takamiya R, Yamaguchi T, Matsumoto K, Tojo SJ, Tamatani T, Kitajima M, Makino N, Ishimura Y, Suematsu M. Induction of heme oxygenase‐1 suppresses venular leukocyte adhesion elicited by oxidative stress: role of bilirubin generated by the enzyme. Circ Res. 1999;85:663–671. [DOI] [PubMed] [Google Scholar]
- 9. Yet SF, Layne MD, Liu X, Chen YH, Ith B, Sibinga NE, Perrella MA. Absence of heme oxygenase‐1 exacerbates atherosclerotic lesion formation and vascular remodeling. FASEB J. 2003;17:1759–1761. [DOI] [PubMed] [Google Scholar]
- 10. Cybulsky MI, Iiyama K, Li H, Zhu S, Chen M, Iiyama M, Davis V, Gutierrez‐Ramos JC, Connelly PW, Milstone DS. A major role for VCAM‐1, but not ICAM‐1, in early atherosclerosis. J Clin Invest. 2001;107:1255–1262. [DOI] [PMC free article] [PubMed] [Google Scholar]
- 11. Elices MJ, Osborn L, Takada Y, Crouse C, Luhowskyj S, Hemler ME, Lobb RR. VCAM‐1 on activated endothelium interacts with the leukocyte integrin VLA‐4 at a site distinct from the VLA‐4/fibronectin binding site. Cell. 1990;60:577–584. [DOI] [PubMed] [Google Scholar]
- 12. Song L, Leung C, Schindler C. Lymphocytes are important in early atherosclerosis. J Clin Invest. 2001;108:251–259. [DOI] [PMC free article] [PubMed] [Google Scholar]
- 13. Ley K, Miller YI, Hedrick CC. Monocyte and macrophage dynamics during atherogenesis. Arterioscler Thromb Vasc Biol. 2011;31:1506–1516. [DOI] [PMC free article] [PubMed] [Google Scholar]
- 14. Nakashima Y, Raines EW, Plump AS, Breslow LJ, Ross R. Upregulation of VCAM‐1 and ICAM‐1 at atherosclerosis‐prone sites on the endothelium in the apoE‐deficient mouse. Arterioscler Thromb Vasc Biol. 1998;18:842–851. [DOI] [PubMed] [Google Scholar]
- 15. Matheny HE, Deem TL, Cook‐Mills JM. Lymphocyte migration through monolayers of endothelial cell lines involves VCAM‐1 signaling via endothelial cell NADPH oxidase. J Immunol. 2000;164:6550–6559. [DOI] [PubMed] [Google Scholar]
- 16. Cook‐Mills JM, Johnson JD, Deem TL, Ochi A, Wang L, Zheng Y. Calcium mobilization and Rac1 activation are required for VCAM‐1 (vascular cell adhesion molecule‐1) stimulation of NADPH oxidase activity. Biochem J. 2004;378:539–547. [DOI] [PMC free article] [PubMed] [Google Scholar]
- 17. Stocker R, Yamamoto Y, McDonagh AF, Glazer AN, Ames BN. Bilirubin is an antioxidant of possible physiological importance. Science. 1987;235:1043–1046. [DOI] [PubMed] [Google Scholar]
- 18. Baranano DE, Rao M, Ferris CD, Snyder SH. Biliverdin reductase: a major physiologic cytoprotectant. Proc Natl Acad Sci USA. 2002;99:16093–16098. [DOI] [PMC free article] [PubMed] [Google Scholar]
- 19. Keshavan P, Deem TL, Schwemberger SJ, Babcock GF, Cook‐Mills JM, Zucker SD. Unconjugated bilirubin inhibits VCAM‐1‐mediated transendothelial leukocyte migration. J Immunol. 2005;174:3709–3718. [DOI] [PubMed] [Google Scholar]
- 20. Zucker SD, Vogel ME, Kindel TL, Smith DL, Idelman G, Avissar U, Kakarlapudi G, Masnovi ME. Bilirubin prevents acute DSS‐induced colitis by inhibiting leukocyte infiltration and suppressing up‐regulation of inducible nitric oxide synthase. Am J Physiol Gastrointest Liver Physiol. 2015;309:G841–G854. [DOI] [PMC free article] [PubMed] [Google Scholar]
- 21. Idelman G, Smith DL, Zucker SD. Bilirubin inhibits the up‐regulation of inducible nitric oxide synthase by scavenging reactive oxygen species generated by the toll‐like receptor 4‐dependent activation of NADPH oxidase. Redox Biol. 2015;5:398–408. [DOI] [PMC free article] [PubMed] [Google Scholar]
- 22. Galkina E, Ley K. Vascular adhesion molecules in atherosclerosis. Arterioscler Thromb Vasc Biol. 2007;27:2292–2301. [DOI] [PubMed] [Google Scholar]
- 23. Rohde LE, Lee RT, Rivero J, Jamacochian M, Arroyo LH, Briggs W, Rifai N, Libby P, Creager MA, Ridker PM. Circulating cell adhesion molecules are correlated with ultrasound‐based assessment of carotid atherosclerosis. Arterioscler Thromb Vasc Biol. 1998;18:1765–1770. [DOI] [PubMed] [Google Scholar]
- 24. Bourdillon MC, Poston RN, Covacho C, Chignier E, Bricca G, McGregor JL. ICAM‐1 deficiency reduces atherosclerotic lesions in double‐knockout mice (ApoE(‐/‐)/ICAM‐1(‐/‐)) fed a fat or a chow diet. Arterioscler Thromb Vasc Biol. 2000;20:2630–2635. [DOI] [PubMed] [Google Scholar]
- 25. Lawson C, Wolf S. ICAM‐1 signaling in endothelial cells. Pharmacol Rep. 2009;61:22–32. [DOI] [PubMed] [Google Scholar]
- 26. Rahman A, Fazal F. Hug tightly and say goodbye: role of endothelial ICAM‐1 in leukocyte transmigration. Antioxid Redox Signal. 2009;11:823–839. [DOI] [PMC free article] [PubMed] [Google Scholar]
- 27. Wakabayashi Y, Fujita H, Morita I, Kawaquchi H, Murota S. Conversion of xanthine dehydrogenase to xanthine oxidase in bovine carotid artery endothelial cells induced by activated neutrophils: involvement of adhesion molecules. Biochim Biophys Acta. 1995;1265:103–109. [DOI] [PubMed] [Google Scholar]
- 28. Wang Q, Doerschuk CM. Neutrophil‐induced changes in the biomechanical properties of endothelial cells: roles of ICAM‐1 and reactive oxygen species. J Immunol. 2000;164:6487–6494. [DOI] [PubMed] [Google Scholar]
- 29. Hansson GK. Innate and adaptive immunity in the pathogenesis of atherosclerosis. Circ Res. 2002;91:281–291. [DOI] [PubMed] [Google Scholar]
- 30. McDonagh AF, Assisi F. The ready isomerization of bilirubin IX‐alpha in aqueous solution. Biochem J. 1972;129:797–800. [DOI] [PMC free article] [PubMed] [Google Scholar]
- 31. Wang WW, Smith DL, Zucker SD. Bilirubin inhibits iNOS expression and NO production in response to endotoxin in rats. Hepatology. 2004;40:424–433. [DOI] [PubMed] [Google Scholar]
- 32. Davis J, Crampton SP, Hughes CW. Isolation of human umbilical vein endothelial cells (HUVEC). J Vis Exp. 2007;3:e183. [DOI] [PMC free article] [PubMed] [Google Scholar]
- 33. Edsfeldt A, Grufman H, Asciutto G, Nitulescu M, Persson A, Nilsson M, Nilsson J, Gonçalves I. Circulating cytokines reflect the expression of pro‐inflammatory cytokines in atherosclerotic plaques. Atherosclerosis. 2015;241:443–449. [DOI] [PubMed] [Google Scholar]
- 34. Lee S, Yoon IH, Yoon A, Cook‐Mills JM, Park CG, Chung J. An antibody to the sixth Ig‐like domain of VCAM‐1 inhibits leukocyte transendothelial migration without affecting adhesion. J Immunol. 2012;189:4592–4601. [DOI] [PubMed] [Google Scholar]
- 35. Westhorpe CL, Dufour EM, Maisa A, Jaworowski A, Crowe SM, Muller WA. Endothelial cell activation promotes foam cell formation by monocytes following transendothelial migration in an in vitro model. Exp Mol Pathol. 2012;93:220–226. [DOI] [PMC free article] [PubMed] [Google Scholar]
- 36. Kartikasari AE, Georgiou NA, Visseren FL, Van Kats‐Renaud H, Van Asbeck BS, Marx JJ. Endothelial activation and induction of monocyte adhesion by nontransferrin‐bound iron present in human sera. FASEB J. 2006;20:353–355. [DOI] [PubMed] [Google Scholar]
- 37. Nikolac N, Simundic AM, Miksa M, Lima‐Oliveira G, Salvagno GL, Caruso B, Guidi GC. Heterogeneity of manufacturers' declarations for lipemia interference—urgent call for standardization. Clin Chim Acta. 2013;426:33–40. [DOI] [PubMed] [Google Scholar]
- 38. De Cordova CM, Nogara MS, De Cordova MM. Interference on the laboratory measurement of bilirubin: the effect of in vitro interactions. Clin Chim Acta. 2009;407:77–79. [DOI] [PubMed] [Google Scholar]
- 39. Lingrel JB, Pilcher‐Roberts R, Basford JE, Manoharan P, Neumann J, Konaniah ES, Srinivasan R, Bogdanov VY, Hui DY. Myeloid‐specific Kruppel‐like factor 2 inactivation increases macrophage and neutrophil adhesion and promotes atherosclerosis. Circ Res. 2012;110:1294–1302. [DOI] [PMC free article] [PubMed] [Google Scholar]
- 40. Kodvawala A, Ghering AB, Davidson WS, Hui DY. Carboxyl ester lipase expression in macrophages increases cholesteryl ester accumulation and promotes atherosclerosis. J Biol Chem. 2005;280:38592–38598. [DOI] [PubMed] [Google Scholar]
- 41. Azuma K, Ichimura K, Mita T, Nakayama S, Jin WL, Hirose T, Fujitani Y, Sumiyoshi K, Shimada K, Daida H, Sakai T, Mitsumata M, Kawamori R, Watada H. Presence of alpha‐smooth muscle actin‐positive endothelial cells in the luminal surface of adult aorta. Biochem Biophys Res Commun. 2009;380:620–626. [DOI] [PubMed] [Google Scholar]
- 42. Daugherty A, Rateri DL. Development of experimental designs for atherosclerosis studies in mice. Methods. 2005;36:129–138. [DOI] [PubMed] [Google Scholar]
- 43. Woodfin A, Voisin MB, Nourshargh S. PECAM‐1: a multi‐functional molecule in inflammation and vascular biology. Arterioscler Thromb Vasc Biol. 2007;27:2514–2523. [DOI] [PubMed] [Google Scholar]
- 44. Lorenzon P, Vecile E, Nardon E, Ferrero E, Harlan JM, Tedesco F, Dobrina A. Endothelial cell E‐ and P‐selectin and vascular cell adhesion molecule‐1 function as signaling receptors. J Cell Biol. 1998;142:1381–1391. [DOI] [PMC free article] [PubMed] [Google Scholar]
- 45. Zhou Z, Connell M, MacEwan D. TNFR1‐induced NF‐kappaB, but not ERK, p38MAPK or JNK activation, mediates TNF‐induced ICAM‐1 and VCAM‐1 expression on endothelial cells. Cell Signal. 2007;19:1238–1248. [DOI] [PubMed] [Google Scholar]
- 46. Haraldsen G, Kvale D, Lien B, Farstad IN, Brandtzaeg P. Cytokine‐regulated expression of E‐selectin, intercellular adhesion molecule‐1 (ICAM‐1), and vascular cell adhesion molecule‐1 (VCAM‐1) in human microvascular endothelial cells. J Immunol. 1996;156:2558–2565. [PubMed] [Google Scholar]
- 47. Tedgui A, Mallat Z. Cytokines in atherosclerosis: pathogenic and regulatory pathways. Physiol Rev. 2006;86:515–581. [DOI] [PubMed] [Google Scholar]
- 48. Gianni D, Taulet N, Zhang H, DerMardirossian C, Kister J, Roush WR, Brown SJ, Bokoch GM, Rosen H. A novel and specific NADPH oxidase‐1 (Nox1) small‐molecule inhibitor blocks the formation of functional invadopodia in human colon cancer cells. ACS Chem Biol. 2010;5:981–993. [DOI] [PMC free article] [PubMed] [Google Scholar]
- 49. Pacher P, Nivorozhkin A, Szabó C. Therapeutic effects of xanthine oxidase inhibitors: renaissance half a century after the discovery of allopurinol. Pharmacol Rev. 2006;58:87–114. [DOI] [PMC free article] [PubMed] [Google Scholar]
- 50. Zernecke A, Weber C. Chemokines in atherosclerosis: proceedings resumed. Arterioscler Thromb Vasc Biol. 2014;34:742–750. [DOI] [PubMed] [Google Scholar]
- 51. Van Kooyk Y, Van de Wiel‐van Kemenade E, Weder P, Huijbens RJ, Figdor CG. Lymphocyte function‐associated antigen 1 dominates very late antigen 4 in binding of activated T cells to endothelium. J Exp Med. 1993;177:185–190. [DOI] [PMC free article] [PubMed] [Google Scholar]
- 52. Luscinskas FW, Kansas GS, Ding H, Pizcueta P, Schleiffenbaum BE, Tedder TF, Gimbrone MA. Monocyte rolling, arrest and spreading on IL‐4‐activated vascular endothelium under flow is mediated via sequential action of L‐selectin, beta 1‐integrins, and beta 2‐integrins. J Cell Biol. 1994;125:1417–1427. [DOI] [PMC free article] [PubMed] [Google Scholar]
- 53. Zucker SD, Horn PS, Sherman KE. Serum bilirubin levels in the U.S. population: gender effect and inverse correlation with colorectal cancer. Hepatology. 2004;40:827–835. [DOI] [PubMed] [Google Scholar]
- 54. Ishizaka N, Ishizaka Y, Takahashi E, Yamakado M, Hashimoto H. High serum bilirubin level is inversely associated with the presence of carotid plaque. Stroke. 2001;32:580–583. [DOI] [PubMed] [Google Scholar]
- 55. Bosma PJ, Chowdhury JR, Bakker C, Gantla S, De Boer A, Oostra BA, Lindhout D, Tytgat GN, Jansen PL, Oude Elferink RP, Chowdhury NR. The genetic basis of the reduced expression of bilirubin UDP‐glucuronosyltransferase 1 in Gilbert's syndrome. N Engl J Med. 1995;333:1171–1175. [DOI] [PubMed] [Google Scholar]
- 56. Vítek L, Jirsa M, Brodanová M, Kalab M, Marecek Z, Danzig V, Novotný L, Kotal P. Gilbert syndrome and ischemic heart disease: a protective effect of elevated bilirubin levels. Atherosclerosis. 2002;160:449–456. [DOI] [PubMed] [Google Scholar]
- 57. Cook‐Mills JM, Marchese ME, Abdala‐Valencia H. Vascular cell adhesion molecule‐1 expression and signaling during disease: regulation by reactive oxygen species and antioxidants. Antioxid Redox Signal. 2011;15:1607–1638. [DOI] [PMC free article] [PubMed] [Google Scholar]
- 58. Kawamura K, Ishikawa K, Wada Y, Kimura S, Matsumoto H, Kohro T, Itabe H, Kodama T, Maruyama Y. Bilirubin from heme oxygenase‐1 attenuates vascular endothelial activation and dysfunction. Arterioscler Thromb Vasc Biol. 2005;25:155–160. [DOI] [PubMed] [Google Scholar]
- 59. Mazzone GL, Rigato I, Ostrow JD, Bossi F, Bortoluzzi A, Sukowati CH, Tedesco F, Tiribelli C. Bilirubin inhibits the TNFalpha‐related induction of three endothelial adhesion molecules. Biochem Biophys Res Commun. 2009;386:338–344. [DOI] [PubMed] [Google Scholar]
- 60. Soares MP, Seldon MP, Gregoire IP, Vassilevskaia T, Berberat PO, Yu J, Bach FH. Heme oxygenase‐1 modulates the expression of adhesion molecules associated with endothelial cell activation. J Immunol. 2004;172:3553–3563. [DOI] [PubMed] [Google Scholar]
- 61. De Lemos JA, Morrow DA, Sabatine MS, Murphy SA, Gibson CM, Antman EM, McCabe CH, Cannon CP, Braunwald E. Association between plasma levels of monocyte chemoattractant protein‐1 and long‐term clinical outcomes in patients with acute coronary syndromes. Circulation. 2003;107:690–695. [DOI] [PubMed] [Google Scholar]
- 62. Libby P, Ridker PM, Hansson GK. Progress and challenges in translating the biology of atherosclerosis. Nature. 2011;473:317–325. [DOI] [PubMed] [Google Scholar]
- 63. Öllinger R, Bilban M, Erat A, Froio A, McDaid J, Tyagi S, Csizmadia E, Graça‐Souza AV, Liloia A, Soares MP, Otterbein LE, Usheva A, Yamashita K, Bach FH. Bilirubin: a natural inhibitor of vascular smooth muscle cell proliferation. Circulation. 2005;112:1030–1039. [DOI] [PubMed] [Google Scholar]
- 64. Mu H, Wang X, Lin PH, Yao Q, Chen C. Chlorotyrosine promotes human aortic smooth muscle cell migration through increasing superoxide anion production and ERK1/2 activation. Atherosclerosis. 2008;201:67–75. [DOI] [PMC free article] [PubMed] [Google Scholar]
- 65. Bulmer AC, Verkade HJ, Wagner K. Progress in lipid research bilirubin and beyond: a review of lipid status in Gilbert's syndrome and its relevance to cardiovascular disease protection. Prog Lipid Res. 2013;52:193–205. [DOI] [PubMed] [Google Scholar]
- 66. Mathur P, Ding Z, Saldeen T, Mehta JL. Tocopherols in the prevention and treatment of atherosclerosis and related cardiovascular disease. Clin Cardiol. 2015;38:570–576. [DOI] [PMC free article] [PubMed] [Google Scholar]
- 67. Zucker SD, Goessling W, Hoppin AG. Unconjugated bilirubin exhibits spontaneous diffusion through model lipid bilayers and native hepatocyte membranes. J Biol Chem. 1999;274:10852–10862. [DOI] [PubMed] [Google Scholar]
- 68. Blankenberg S, Barbaux S, Tiret L. Adhesion molecules and atherosclerosis. Atherosclerosis. 2003;170:191–203. [DOI] [PubMed] [Google Scholar]
- 69. Jones SC, Banks RE, Haidar A, Gearing AJ, Hemingway IK, Ibbotson SH, Dixon MF, Axon AT. Adhesion molecules in inflammatory bowel disease. Gut. 1995;36:724–730. [DOI] [PMC free article] [PubMed] [Google Scholar]
- 70. Khachigian LM, Collins T, Friestt JW. N‐acetyl cysteine blocks mesangial VCAM‐1 and NF‐KB expression in vivo. Am J Pathol. 1997;151:1225–1229. [PMC free article] [PubMed] [Google Scholar]
- 71. Mollà M, Gironella M, Miquel R, Tovar V, Engel P, Biete A, Piqué JM, Panés J. Relative roles of ICAM‐1 and VCAM‐1 in the pathogenesis of experimental radiation‐induced intestinal inflammation. Int J Radiat Oncol Biol Phys. 2003;57:264–273. [DOI] [PubMed] [Google Scholar]
- 72. Peng F, Deng X, Yu Y, Chen X, Shen L, Zhong X, Qiu W, Jiang Y, Zhang J, Hu X. Serum bilirubin concentrations and multiple sclerosis. J Clin Neurosci. 2011;18:1355–1359. [DOI] [PubMed] [Google Scholar]
- 73. Liu Y, Zhu B, Wang X, Luo L, Li P, Paty DW, Cynader MS. Bilirubin as a potent antioxidant suppresses experimental autoimmune encephalomyelitis: implications for the role of oxidative stress in the development of multiple sclerosis. J Neuroimmunol. 2003;139:27–35. [DOI] [PubMed] [Google Scholar]
- 74. Willis D, Moore A, Frederick R, Willoughby D. Heme oxygenase: a novel target for the modulation of the inflammatory response. Nat Med. 1996;2:87–90. [DOI] [PubMed] [Google Scholar]