

Abstract
Background
Monocrotaline has been widely used to establish an animal model of pulmonary hypertension. The molecular target underlying monocrotaline‐induced pulmonary artery endothelial injury and pulmonary hypertension remains unknown. The extracellular calcium–sensing receptor (CaSR) and particularly its extracellular domain hold the potential structural basis for monocrotaline to bind. This study aimed to reveal whether monocrotaline induces pulmonary hypertension by targeting the CaSR.
Methods and Results
Nuclear magnetic resonance screening through WaterLOGSY (water ligand‐observed gradient spectroscopy) and saturation transfer difference on protein preparation demonstrated the binding of monocrotaline to the CaSR. Immunocytochemical staining showed colocalization of monocrotaline with the CaSR in cultured pulmonary artery endothelial cells. Cellular thermal shift assay further verified the binding of monocrotaline to the CaSR in pulmonary arteries from monocrotaline‐injected rats. Monocrotaline enhanced the assembly of CaSR, triggered the mobilization of calcium signaling, and damaged pulmonary artery endothelial cells in a CaSR‐dependent manner. Finally, monocrotaline‐induced pulmonary hypertension in rats was significantly attenuated or abolished by the inhibitor, the general or lung knockdown or knockout of CaSR.
Conclusions
Monocrotaline aggregates on and activates the CaSR of pulmonary artery endothelial cells to trigger endothelial damage and, ultimately, induces pulmonary hypertension.
Keywords: endothelial injury, extracellular calcium–sensing receptor, intracellular calcium, monocrotaline, pulmonary hypertension
Subject Categories: Animal Models of Human Disease, Basic Science Research, Cell Signalling/Signal Transduction, Vascular Biology
Introduction
Monocrotaline was shown to induce pulmonary arteritis1 and was used subsequently to establish an animal model of pulmonary hypertension by 1 subcutaneous or intraperitoneal injection.2, 3, 4 Monocrotaline induces the selective damage of pulmonary artery endothelial cells (PAECs) and causes the development of pulmonary hypertension.5, 6, 7 Increasing evidence highlights the potential role of the extracellular calcium–sensing receptor (CaSR) in the dysfunction of pulmonary vasculature.8, 9, 10 The structure of CaSR, and particularly its extracellular domain, richly contains histidine, tryptophan, and cysteine and a specific motif of cysteine‐X (noncysteine amino acid)‐X‐cysteine (CXXC), all of which offer the potential structural basis for monocrotaline to bind to a protein.11, 12, 13, 14 This study aimed to examine the hypothesis that monocrotaline induces endothelial injury and pulmonary hypertension by binding and subsequent activating CaSR.
Our studies used 3 different technological strategies including nuclear magnetic resonance (NMR) with purified CaSR protein, immunocytochemical staining of cultured PAECs, and cellular thermal shift assay on pulmonary arteries isolated from monocrotaline‐administered rats, and all consistently demonstrated the binding of monocrotaline to CaSR. The evaluation of the downstream calcium signaling of CaSR indicated the activation of CaSR by monocrotaline and the subsequent damage of PAECs. Furthermore, our examination of a monocrotaline‐administered rat model showed pulmonary hypertension to be significantly attenuated or almost completely abolished by the inhibitor of CaSR, global or lung tissue knockdown or knockout of CaSR. These findings finally and strongly demonstrated the mechanistic target of monocrotaline at CaSR.
Methods
Ethics Approval
All studies using Sprague‐Dawley rats were approved by the institutional animal care and use committee of Tongji Medical College, Huazhong University of Science and Technology, and performed in accordance with the National Institutes of Health Guide for the Care and Use of Laboratory Animals.
Fluorescein Isothiocyanate Labeling of Monocrotaline
Retronecine, the core structure of monocrotaline for its binding to protein11, 15, 16 was exploited in the current study as the strategy for labeling monocrotaline with fluorescein isothiocyanate (FITC), as shown schematically in Figure 1. The synthesis procedures consisted of 2 steps: the alkalization of monocrotaline to obtain retronecine17 and then the ligation of FITC to retronecine. Briefly, potassium hydroxide (0.69 g) was added to monocrotaline (2 g) in MeOH (10 mL) at room temperature. The resulting solution was stirred at 100°C for 10 minutes, and then cooled to room temperature, and the solvent was removed under vacuum. The residue was purified on a silica gel (CHCl3:MeOH:NH4OH at 10:5:1) to afford retronecine as yellow oil (896 mg, 94.0%). Retronecine (0.65 g) was added to a solution of 5‐FITC (1.79 g) in N,N‐dimethylformamide (10 mL), the mixture was stirred at 30°C for 72 hours, and then dibutyltindilaurate (26.5 mg) was supplemented. The mixture was stirred at 50°C for an additional 24 hours, then quenched with EtOH (5 mL), and the solvent was removed under vacuum. The final mixture was purified on a C‐18 flash column (MeOH in H2O: from 0% to 75% in 100 minutes) to afford the target compound, FITC‐conjugated monocrotaline (FITC‐MCT; 167 mg). The compound was purified by high‐performance liquid chromatography to be >98%, and its structure was fully verified with the measured molecular weight of 545 at M+1 peak corresponding to the FITC‐MCT molecular weight of 544 through subsequent mass spectrometry (liquid chromatography/mass spectrometry, ZQ 2000; Waters). The compound structure was further confirmed by NMR analysis (Ascend 300; Bruker) showing the proton spectrum to be completely consistent with the FITC‐MCT chemical formula of C29O7N2SH24.
Figure 1.
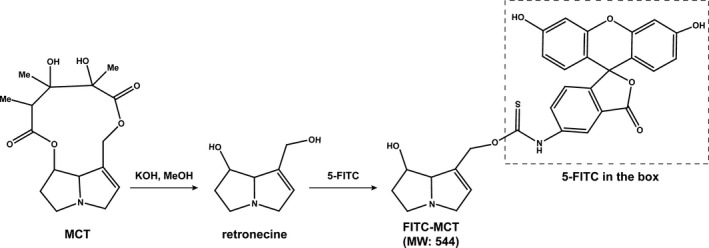
The synthesis procedures of FITC‐labeled MCT (FITC‐MCT). The synthesis procedures consisted of 2 steps: the alkalization of MCT to obtain retronecine, and then the ligation of FITC to retronecine. FITC indicates fluorescein isothiocyanate; MCT, monocrotaline.
Purification of CaSR Extracellular Domain
The gene encoding the rat CaSR extracellular domain (ECD, 1–612 amino acids) was synthesized and subcloned into pcDNA3.1(+) (Invitrogen) through Hind III and Not I with a tag insert of 10 histidine at the C‐terminus. The correct subcloning and inserts were verified by sequencing in both forward and reverse directions using primers specific to the vector on an ABI 3730 Automated Sequencer (Applied Biosystems). The pcDNA3.1(+) CaSR ECD was transfected into HEK293T cells using 10 μg plasmid DNA and 30 μL Lipofectamine 2000 (Invitrogen) at the cell density of 106 cells/mL. The tranfsected HEK293T cells were cultured with Opti‐MEM (Invitrogen), and the expression of exogenous protein was monitored every 24 hours for identifying the optimal time point to harvest. The recombinant CaSR ECD was obtained from the lysate of HEK293T cells through affinity purification using a standard Ni column (HisTrap Excel 1‐mL Ni column; GE Healthcare) as follows. The Ni column was prebalanced with binding buffer containing 0.02 mol/L Na2HPO4/NaH2PO4 (pH 7.4) and 0.5 mol/L NaCl at 2 mL/min. The cell lysates were centrifuged at 2292 g for 10 minutes at 4°C. The aspirated supernatant was passed through a membrane filter with a diameter of 0.22 μm and then applied to the Ni column through an AKTA Prime fast‐performance liquid chromatography system (GE Healthcare). The Ni column was completely rinsed with washing buffer containing 0.02 mol/L Na2HPO4/NaH2PO4 (pH 7.4), 0.5 mol/L NaCl, and 30 mmol/L imidazole to eliminate bulk impurities. The CaSR ECD sample was then rinsed from the Ni column with elution buffer containing 0.02 mol/L Na2HPO4/NaH2PO4 (pH 7.4), 0.5 mol/L NaCl, and 500 mmol/L imidazole and finally collected in PBS (pH 7.4) through ultrafiltration. The recombinant CaSR ECD was quantified with Pierce BCA Protein Assay Kit (Thermo Scientific), and the molecular size was verified by immunoblotting.
WaterLOGSY and Saturation Transfer Difference NMR
For WaterLOGSY (water ligand‐observed gradient spectroscopy), the recombinant CaSR ECD and monocrotaline were dissolved at a final concentration of 5 μmol/L and 1 mmol/L, respectively, in 10 mmol/L PBS (pH 7.5) containing 10% D2O and then scanned on an NMR system (Ascend 850; Bruker) to obtain the proton spectrum for CaSR ECD and monocrotaline. Monocrotaline was subsequently added into the CaSR ECD solution at a series of final concentrations of 1, 2, 3, and 5 mmol/L, and the samples were subsequently scanned on the NMR at the saturation of water to obtain the WaterLOGSY spectrum.
For saturation transfer difference, the recombinant CaSR ECD and monocrotaline were dissolved at a final concentration of 5 μmol/L and 1 mmol/L, respectively, in 10 mmol/L Tris, pD7.8 D2O, and then scanned on an NMR system (Ascend 700; Bruker) to obtain the proton spectrum for CaSR ECD and monocrotaline. The recombinant CaSR ECD was dissolved at a final concentration of 5 μmol/L in 10 mmol/L Tris, pD7.8 D2O, supplied with 1 mmol/L monocrotaline, then irradiated on the NMR system for 3 seconds at 2.0 and 30 ppm for the saturation and nonsaturation, respectively, of CaSR ECD.
Cell Culture
PAECs were cultured from the third‐order branches of rat intralobar artery explants. The primary PAECs migrated from the artery explants with their intimal surface adhered to the culture dish were digested by trypsin, split, and maintained in DMEM supplemented with 5% fetus bovine serum. PAECs displayed the characteristic cobble stone‐like morphology, and their purity was >95%, as identified by immunocytochemical staining with von Willebrand factor. The PAECs at ≈70% confluence in 1 to 3 passages were used in experiments. PAECs were isolated from at least 3 rats for each kind of experiment.
Cytosolic Ca2+ Measurement
Cytosolic Ca2+ ([Ca2+]i) measurements were performed in the continuous presence of 2.0 mmol/L Ca2+ using Fura‐2, as described previously.8, 18 .
Transfection of short hairpin RNA
The effective short hairpin RNA (shRNA) specifically against CaSR, nonspecific control, and vector (Origene) were transfected into PAECs using Lipofectamine 2000, as described previously.8, 18 The shRNA constructs simultaneously encoded DsRed for identification of transfected PAECs individually.19 The transduction of shRNA for CaSR knockdown in vivo was conducted as we reported previously.8 Briefly, the oligo‐DNA encoding the control and the effective shRNA targeting CaSR were subcloned, respectively, into the Lenti‐X shRNA expression vector (Clontech), confirmed by sequencing, and packaged into lentiviral particles using Lenti‐X HTX packaging system and HEK293T cells (Clontech). Each rat was injected intravenously or intratracheally with 1 mL lentivirus (≈108 transducing units per milliliter [TU/mL]). Systemic and lung knockdown were verified by Western blot analysis of CaSR expression in lung and other major organs as well as measurements of serum phosphate, calcium, and parathyroid hormone (PTH) levels (Figure S1).
Western Blot and Immunocytochemical Staining
To determine the thermal stability of CaSR prepared from pulmonary arteries of rats, the protein lysates were preheated at a series of temperatures from 42 to 72°C for 3 minutes and then subjected to Western blot, as described previously in detail.8
To determine the binding of monocrotaline to CaSR in cultured PAECs, immunocytochemical staining was performed, as reported previously.8, 18, 20 Briefly, the PAECs cultured on coverslips were rinsed with warm PBS 3 times, fixed with 4% paraformaldehyde for 20 minutes at room temperature, and rinsed again with PBS 3 times. After blocking with 5% BSA in a humidified chamber at room temperature overnight and draining off the blocking buffer, the PAECs were incubated with primary monoclonal antibody against CaSR (1:100 diluted in 0.5% BSA in PBS; ABclonal) in a humidified chamber at 4°C overnight. After rinsing with PBS 3 times, DyLight 549‐conjugated IgG (1:100 diluted in 0.5% BSA in PBS; Abbkine) was applied to the PAECs, and the cells were incubated in a humidified dark chamber at room temperature for 60 minutes. After rinsing with PBS 3 times, the PAECs were incubated with FITC‐MCT (2.5 mmol/L) in a humidified dark chamber at room temperature overnight. After rinsing with PBS 3 times for 5 minutes each and brief incubation with 50 μL DAPI for nucleus labeling, the coverslips were washed 3 times with PBS before visualization. A confocal fluorescent microscope (Olympus IX70) was used at room temperature with an oil‐immersion lens (Olympus UPlanSApo 60X/1.35) with Melles Griot (Melles Griot 05 LPL 915‐065 and Melles Griot IMA 10 10 10 BOS004) and Olympus (Olympus FV5‐LDPSU) laser excitations at 405, 488, and 543 nm and band pass filters of 430 to 460, 505 to 525, and 610 nm emissions corresponding to DAPI, FITC, and DyLight 549 fluorescence, respectively. The images were captured with the aid of FluoView v.5.0 software (Olympus).
Fluorescence Resonance Energy Transfer
The synthesized gene encoding the rat CaSR ECD mentioned above was subcloned into pECFP‐N1 and pEYFP‐N1 (Invitrogen) through BamHI and AgeI to generate cyan fluorescent protein–conjugated CaSR (CFP‐CaSR) and yellow fluorescent protein–conjugated CaSR (YFP‐CaSR) vectors, respectively, for expressing fused protein. After verification of the correct subcloning and inserts by sequencing, the vectors were simultaneously transfected into PAECs. Fluorescence resonance energy transfer (FRET) examinations were conducted on a laser confocal microscopy system (Carl Zeiss LSM 710) with an oil lens and Chroma filters of S440/20 nm, Q455lp, and S480/40 nm for CFP; S507/20 nm, Q515lp, and S537/30 nm for YFP; and S440/20 nm, Q455lp, and S537/30 nm for FRET. Images of CFP, YFP, and FRET were taken for each cell examined under unsaturated fluorescence before and after exposure to vehicle or monocrotaline and analyzed using ZEN 2011 software. The generation of corrected FRET (Fc) images and the calculation of net FRET (N‐FRET) were performed following the method of Xia and Liu.21
CaSR Knockout
The CaSR and PTH double‐knockout rats were created using a recently modified CRISPR/Cas9 technique.22, 23
The rat Casr gene (rCasr; GenBank accession number: NM_016996.1; Ensembl: ENSRNOG00000002265) is located on rat chromosome 11. Seven exons have been identified in rCasr, with the ATG start codon in exon 2 and TAA stop codon in exon 7. Exon 3 of the rCasr gene was selected as the Cas9 targeting region based on its critical importance in CaSR function,24, 25, 26 and the targeting site was GTGGTGGGAGCCACCGGCTC. The single guide RNA (gRNA) was constructed at a CRISPR/Cas9 expression vector, pRP[CRISPR]‐hCas9_D10A‐U6 (Cyagen Biosciences, Guangzhou, China), with a U6 promoter that can be in vitro transcribed into Cas9 mRNA and gRNA. As shown in Figure S2, the pRP[CRISPR]‐hCas9_D10A‐U6 vector was constructed following the well‐known advancements in CRISPR/Cas9 technology.27, 28, 29 The CRISPR/Cas9 expression plasmid was linearized and used as the template for in vitro transcription. The transcribed Cas9 mRNA and gRNA were both purified, and the mixture of Cas9 mRNA and gRNA was then injected into zygotes for Sprague‐Dawley rat production. The founder animals (F0) were genotyped by tail biopsy followed by polymerase chain reaction using the forward primer 5′‐CCCTAATACAACGGGAATGCACTG‐3′ and the reverse primer 5′‐ACCACCTGTAACTCCAGCTCCG‐3′. The 645‐bp‐long products were then purified and sequenced (ABI 3730XL DNA analyzer; Applied Biosystems).
The rat PTH gene (rPth; GenBank accession number: NM_017044.1, Ensembl: ENSRNOG00000014318) is located on rat chromosome 1. Three exons have been identified in rPth, with the ATG start codon in exon 2 and the TAA stop codon in exon 3. Exon 2 of the rPth gene was selected as the Cas9 targeting region, and the targeting site was GTCTGCAAGCACCATGGCTA. The single gRNA was also constructed at the pRP[CRISPR]‐hCas9_D10A‐U6 vector. The founder animals (F0) were genotyped by polymerase chain reaction using the forward primer 5′‐CGGTCATGGAAACTGTTTGCTC‐3′ and the reverse primer 5′‐CAGGTGTTTGCCCAGGTTGTG‐3′. The 673‐bp‐long products were then purified and sequenced. The strategies for the noted rCasr and rPth vector constructions are illustrated in Figure S3.
Two CaSR‐heterozygous and 4 PTH‐heterozygous rats were selected from the F0 rats to breed; the genotypes of the F0 heterozygous rats are displayed in Figure S4A. The rat heterozygous for missing 7 bases (CTCCGGT) in 1 strand of rCasr (F0_21#) and the one heterozygous for missing 2 bases (GC) in 1 strand of rPth (F0_26#) were fertile and bred to successfully generate offspring heterozygous rats at both the Casr and Pth loci (CaSR+/−PTH+/−F1_4# and 6#) (Figure S4B). The 2 latter were then used to generate CaSR+/+PTH+/+, CaSR+/+PTH−/−, and CaSR−/−PTH−/− rats (F2, Figure S4C). The genomewide off‐target sites or candidates were screened using CRISPR Design (http://crispr.mit.edu), and none site was scored as possible off‐target candidates for CaSR or PTH gRNA, respectively. Even so, 2 and 3 sites on the top score list of CaSR and PTH, respectively, were sequenced to verify no off‐target activity. The following primers were used for polymerase chain reaction: CaSR off‐target site 1, chr10:+108706769: forward primer 5′‐CCGCTAGGATTCGTTCCACGTC‐3′, reverse primer 5′‐CTAGCTGCGAGCGGTGATTGG‐3′; CaSR off‐target site 2, chr12:‐9709465: forward primer 5′‐AGGTCAGCCAGTGAGGCTGTCTAAG‐3′, reverse primer 5′‐TTGCACAGTGAAACCCACCGC‐3′; PTH off‐target site 1, chr16:‐8463870: forward primer 5′‐CCAGCCTCCGTTCACTGGAATG‐3′, reverse primer 5′‐AGTTATTCCTGGCCTCCCGCTG‐3′; PTH off‐target site 2, chr15:+23512282: forward primer 5′‐TTCCCGAGAGATGGAAGGGTTGA‐3′, reverse primer 5′‐TCAGGTAGTCGTAGTCGCTTTGAGAGC‐3′; PTH off‐target site 3, chr11:‐59590415: forward primer 5′‐CAGGCGTGAGAACATTAAACAAGTT‐3′, reverse primer 5′‐CAGCAATGGATCTCTCCTTGTGA‐3′.
Pulmonary Hypertension Model and Hemodynamic Measurements
Sprague‐Dawley rats (male, 180–200 g, aged 4 weeks) received 1 subcutaneous administration of monocrotaline at 60 mg/kg, the standard dosage in rodent to produce the pulmonary hypertension model.3, 4, 6, 9, 30, 31, 32, 33, 34, 35, 36 For treatment with CaSR inhibitor, rats received 10 days of intraperitoneal injection of Calhex 231 successively from day 1 at the dosage of 41 μg/kg each day, a protocol that was used successfully in a recent study to evaluate a CaSR inhibitor of pulmonary hypertension in rats.9 Two weeks after the administration of monocrotaline, when stable pulmonary hypertension was established in rats, as documented previously,9, 31, 33, 34, 36, 37 pulmonary hemodynamic studies were conducted, as described previously.8
Animal experiments were performed in the following 14 groups. Group 1 received 1 subcutaneous administration of solvent (ethanol and PBS at 1:4) for monocrotaline at day 1 of the experiment (n=9). Group 2 received 1 subcutaneous administration of monocrotaline at 60 mg/kg at day 1 of experiment (n=10). Group 3 received 10 days of intraperitoneal injection of Calhex 231 successively from day 1 at a daily dosage of 41 μg/kg (n=8). Group 4 received 1 subcutaneous administration of monocrotaline at 60 mg/kg at the day 1 of experiment and 10 days of intraperitoneal injection of Calhex 231 successively from day 1 at the daily dosage of 41 μg/kg (n=8). Group 5 received an intravenous injection of 1 mL lentivirus (≈108 TU/mL) packed with an empty shRNA vector for systemic CaSR knockdown 3 days before receiving 1 subcutaneous administration of monocrotaline on day 1 of the experiments (n=8). Group 6 received an intravenous injection of 1 mL lentivirus (≈108 TU/mL) packed with control shRNA vector for systemic CaSR knockdown 3 days before receiving 1 subcutaneous administration of monocrotaline on day 1 of the experiments (n=8). Group 7 received an intravenous injection of 1 mL lentivirus (≈108 TU/mL) packed with a CaSR shRNA vector for systemic CaSR knockdown 3 days before receiving 1 subcutaneous administration of monocrotaline at the day 1 of experiments (n=8). Group 8 received an intratracheal injection of 1 mL lentivirus (≈108 TU/mL) packed with an empty shRNA vector for lung CaSR knockdown 3 days before receiving 1 subcutaneous administration of monocrotaline at the day 1 of experiments (n=8). Group 9 received an intratracheal injection of 1 mL lentivirus (≈108 TU/mL) packed with control shRNA vector for lung CaSR knockdown 3 days before receiving 1 subcutaneous administration of monocrotaline on day 1 of the experiments (n=8). Group 10 received an intratracheal injection of 1 mL lentivirus (≈108 TU/mL) packed with CaSR shRNA vector for lung CaSR knockdown 3 days before receiving 1 subcutaneous administration of monocrotaline on day 1 of experiments (n=8). Group 11, composed of CaSR+/+PTH−/− rats, received 1 subcutaneous administration of the solvent for monocrotaline on day 1 of the experiments (n=5). Group 12, composed of CaSR+/+PTH−/− rats, received 1 subcutaneous administration of monocrotaline on day 1 of the experiments (n=5). Group 13, composed of CaSR−/−PTH−/− rats, received 1 subcutaneous administration of the solvent for monocrotaline on day 1 of experiments (n=5). Group 14, composed of CaSR−/−PTH−/− rats, received 1 subcutaneous administration of monocrotaline on day 1 of the experiments (n=6).
By the end of hemodynamic experiments, prewarmed saline was introduced into pulmonary circulation through the pulmonary artery catheter and drained from the left atrium to wash out the blood. The lungs and heart tissues were removed, and the lungs were fixed with formaldehyde solution (10%) for ≥3 days at room temperature. Right ventricular hypertrophy was quantified by weighing the right ventricular free wall and the left ventricle together with the septum (left ventricle plus septum). For the analysis of pulmonary morphometry, 1 sagittal 5‐μm‐thick section from the top, middle, and bottom of each left lung was embedded with paraffin. Two slides from each section were subjected to hematoxylin and eosin staining and examined at room temperature under an Olympus BX60 microscope using the Olympus UPlanFL 40×/0.75 lens. Medial wall thickness was determined in distal pulmonary arteries with diameters between 50 and 150 μm, and image capture was performed using the Olympus DP50 camera with the aid of ViewFinder Lite software (Olympus).
Statistical Analysis
Data are reported as mean±SE. The Student's t test and 1‐way ANOVA followed by Student–Newman–Keuls were used for 2‐ or multiple‐group comparisons. Four‐parameter logistic regression was performed for nonlinear regression. P<0.05 was considered significantly different.
Results
Monocrotaline Binds to CaSR
To determine whether monocrotaline was capable of binding to CaSR, this study used 3 divergent techniques well‐suited to detect any ligation or combining of a chemical compound with a protein molecule in different types of sample preparations.
To explore whether monocrotaline was able to bind to CaSR in vitro, we conducted WaterLOGSY NMR screening with purified protein preparation of CaSR ECD. As shown in Figure 2A, 5 μmol/L CaSR ECD and 1 mmol/L monocrotaline exhibited a distinct proton spectrum with weak signals in 10 mmol/L PBS containing 10% D2O on NMR (marked “a1” and “a2,” respectively). The concomitant presence of CaSR ECD and monocrotaline resulted in enormous enhancement of proton signals in several down fields of the monocrotaline spectrum, at 1.1, 1.3, 1.4, 2.2, 3.0, 3.6, 3.8, and 6.2 ppm on NMR (marked “a3” in Figure 2A), and the enhancement effect was dose‐dependent on monocrotaline (marked “a4” through “a7” in Figure 2A), strongly suggesting the possible binding of monocrotaline to CaSR ECD. Furthermore, we carried out saturation transfer difference NMR analysis with the purified CaSR ECD protein. As shown in Figure 2B, 5 μmol/L CaSR ECD and 1 mmol/L monocrotaline exhibited different proton spectrums in 10 mmol/L Tris in D2O on NMR (marked “b1” and “b2,” respectively). When CaSR‐ECD was irradiated in the presence of 1 mmol/L monocrotaline on NMR for 3 seconds at 2.0 and 30 ppm for saturation and nonsaturation, respectively, of CaSR‐ECD, the resulting saturation transfer difference (STD) clearly identified several increased proton signals at the down fields around 0.7, 0.9, 1.0, 1.7, 2.5, 3.0, and 6.5 ppm (marked “b3” in Figure 2B), which completely coincided with the corresponding down fields of monocrotaline proton spectrum (marked “b2” in Figure 2B) and thus confirmed the binding of monocrotaline to CaSR ECD. It is noted that N,N‐dimethylformamide, the solvent of monocrotaline pyrrole (MCTP) prevented us from comparing any potentially enhanced or altered binding capacity of MCTP to CaSR versus monocrotaline, since N,N‐dimethylformamide usually induces denaturalization of purified protein in vitro. In addition, N,N‐dimethylformamide contains the intrastructures of methyl groups, which most likely interfere with the proton NMR spectrum by giving rise to 2 singlets of 3 protons by itself38 and thus is treated as an inappropriate component in the sample preparations for NMR monitoring, even at a trace amount.
Figure 2.
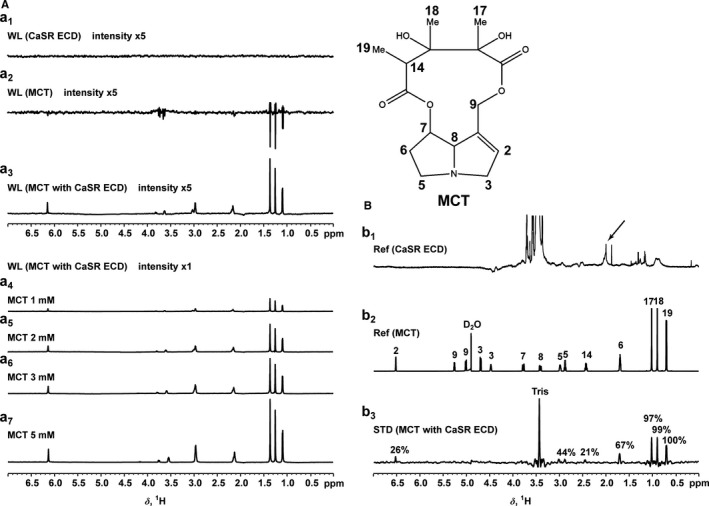
MCT binding to CaSR in protein preparation. A, The proton spectrum of 5 μmol/L CaSR ECD and 1 mmol/L MCT in 10 mmol/L PBS containing 10% D2O (pH 7.5) obtained on NMR at the saturation of water (WL) and the enormous enhancement of proton signals in several down fields of 1 mmol/L MCT spectrum in the concomitant presence of 5 μmol/L CaSR ECD as well as the dose dependence of MCT. B, The proton spectrum of 5 μmol/L CaSR ECD and 1 mmol/L MCT in 10 mmol/L Tris in D2O (pD 7.8) obtained on NMR at the saturation of MCT and CaSR ECD, respectively, and the STD between MCT and CaSR ECD when irradiated on NMR for 3 seconds at 2.0 and 30 ppm for saturation and nonsaturation, respectively, of CaSR ECD. CaSR indicates extracellular calcium–sensing receptor; ECD, extracellular domain; MCT, monocrotaline; NMR, nuclear magnetic resonance; Ref, reference; STD, saturation transfer difference; WL, WaterLOGSY.
To examine whether monocrotaline was capable of ligating the native CaSR, we performed immunocytochemical staining of cultured PAECs. For this purpose, we labeled monocrotaline with FITC and then incubated FITC‐MCT with PAECs with or without coimmunostaining of CaSR. As shown in Figure 3, FITC‐MCT incubation clearly showed localization of monocrotaline on the cell membrane and, to some extent, in the cytosol of PAECs (shown in green in Figure 3A and 3C, left), not in FITC‐incubated control PAECs, ensuring the specificity of this staining (Figure 3B, left). Also shown in Figure 3, indirect immunostaining showed the localization of CaSR on the cell membrane and, to some extent, in the cytosol of PAECs (shown in red in Figure 3A and 3B, middle). The expression of CaSR on the cell membrane and in the cytosol of PAECs was completely consistent with previous reports on other types of vascular endothelial cells including human aortic endothelial cells.39 The coimmunostaining of CaSR in FITC‐MCT–incubated PAECs further showed the yellow fluorescence resulting from the merging of the green fluorescence of monocrotaline and the red fluorescence of CaSR, indicating colocalization of monocrotaline together CaSR on the cell membrane and, to a lesser extent, in the cytosol of PAECs (Figure 3A, right). It is noted that the structure of monocrotaline pyrrole (MCTP) and its relatively unstable property prevented us from labeling it with FITC or other types of fluorescent tracer. Considering the conversion of monocrotaline to MCTP in the liver after their injection into animals and the subsequent targeting of MCTP on PAECs,5, 6, 7 the potential binding of MCTP to CaSR was explored in monocrotaline‐injected rats as follows.
Figure 3.
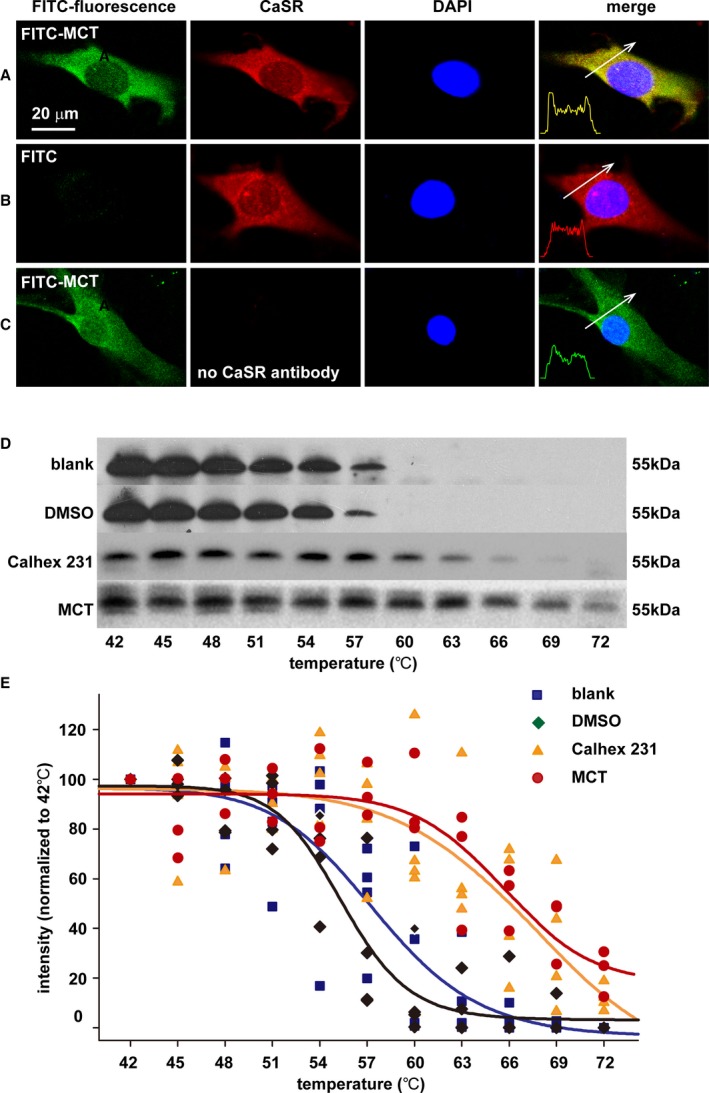
MCT binding to CaSR in cultured pulmonary endothelial cells and pulmonary arteries in vivo. A through C, Immunocytochemical stainings of CaSR (red) and nucleus (blue) in PAECs after incubation with and washout of the MCT labeled by FITC (FITC‐MCT; green in A and C) or FITC alone (B). The confocal images represented the similar results of 3 separate experiments examining a total of 71 to 96 individual PAECs for each. D, Representative immunoblotting analysis of the protein lysates of pulmonary arteries isolated from blank control, DMSO, Calhex 231 or MCT‐administered rats and heated at a series of temperatures from 42 to 72°C for 3 minutes. E, Statistical regression (4 parameter logistic regressions, P<0.05) of separate immunoblots generating the cellular thermal shift assay curves for the enhanced thermal stability of CaSR by Calhex 231 and MCT. CaSR indicates extracellular calcium–sensing receptor; ECD, extracellular domain; FITC, fluorescein isothiocyanate; MCT, monocrotaline; N‐FRET, net fluorescence resonance energy transfer; PAEC, pulmonary artery endothelial cell.
To finally verify whether MCTP was able to combine with native CaSR in vivo, we conducted the cellular thermal shift assay on pulmonary arteries isolated from monocrotaline‐injected rats. The cellular thermal shift assay is a recently established approach to reveal whether a chemical compound or drug can bind to a protein.40, 41 The new technique methodologically exploits the chemical property of enhanced thermal stability of a protein on specific binding of a compound.40, 41 The protein lysates of pulmonary arteries isolated from rats administered control (the vehicle DMSO), the chemical inhibitor of CaSR ([1S,2S,1′R]‐N1‐[4‐chlorobenzoyl]‐N2‐[1‐(1‐naphthyl)ethyl]‐1,2‐diaminocyclo‐hexane, Calhex 231), or monocrotaline were heated at a series of temperatures from 42 to 72°C for 3 minutes and then subjected to immunoblotting analysis. In control‐ or DMSO‐treated animals, the CaSR was stable below or at 48°C, was slightly degraded from 51 to 54°C, was significantly degraded at 57°C, and was almost completely degraded at 60°C (Figure 3D). In Calhex 231‐treated animals, the CaSR was stable below or at 57°C, was slightly or significantly degraded from 60 to 63°C, and was almost completely degraded at 69 to 72°C (Figure 3D). In monocrotaline‐treated animals, the CaSR was stable below or at 63°C, was slightly or significantly degraded from 66 to 69°C, and was not completely degraded even at 72°C (Figure 3D). As summarized in Figure 3E, the statistical regression analysis showed the significant right shift of thermal stability curves of CaSR in pulmonary arteries from animals administered monocrotaline or Calhex 231 compared with control or vehicle, clearly indicating the specific binding of MCTP to CaSR in vivo.
These results consistently demonstrated the binding of monocrotaline or MCTP to CaSR.
Monocrotaline Induces the Activation of CaSR
To examine whether the binding of monocrotaline affected the functional status of CaSR, we evaluated the mobilization of intracellular calcium signaling ([Ca2+]i), one of the major downstream events after CaSR activation.42 As shown in Figure 4A through 4H, the exposure of PAECs to 2.5 mmol/L monocrotaline, equivalent to the standard dosage used for the establishment of pulmonary hypertension in rats3, 4, 6, 9, 30, 31, 32, 33, 34, 35, 36 induced robust [Ca2+]i, indicating the mobilization of intracellular calcium signaling. Calhex 231, the known inhibitor of CaSR that did not affect [Ca2+]i by itself, significantly inhibited the monocrotaline‐induced elevation of [Ca2+]i, suggesting the role of CaSR in mediating monocrotaline‐induced mobilization of intracellular calcium signaling. In CaSR‐knockdown preparations of PAECs, monocrotaline‐induced elevation of [Ca2+]i was completely abolished, further confirming the activation of CaSR by monocrotaline.
Figure 4.
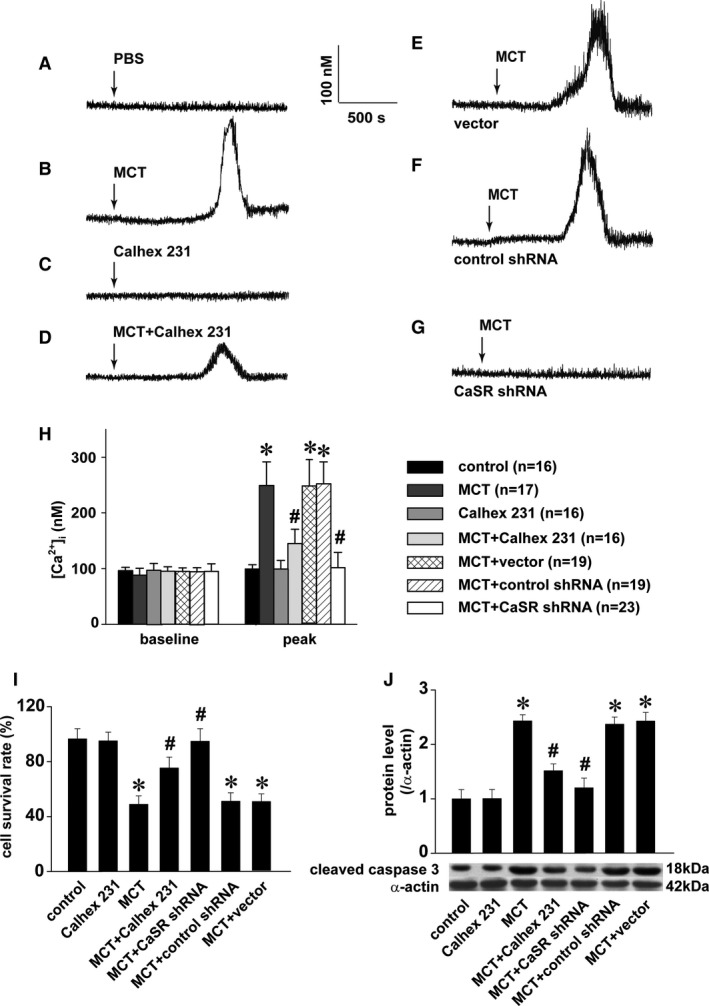
MCT‐induced mobilization of [Ca2+]i and endothelial injury via CaSR. A through G, Representative curves of [Ca2+]i responses to PBS, 1 μmol/L Calhex 231, or 2.5 mmol/L MCT in PAECs in the absence or presence of 1 μmol/L Calhex 231 or to 2.5 mmol/L MCT in PAECs transfected with CaSR shRNA, control shRNA, or the vector. H, Statistical summary of [Ca2+]i baseline and MCT‐induced peak responses. The sample size indicated is the total number of PAECs from 3 independent experiments for each (* P<0.001 vs control, # P<0.001 vs MCT). After 24‐hour incubation with 2.5 mmol/L MCT in the absence or presence of 1 μmol/L Calhex 231 in PAECs or in PAECs transfected with CaSR shRNA, control shRNA, or the vector, CCK‐8 staining and Western blots were performed to quantify the cell survival rate and cleaved caspase 3, respectively. Summarized were 4 independent measurements of the cell survival rate normalized to control (I), and the representative Western blot and comparison of cleaved caspase 3 levels from 3 independent experiments (J), * P<0.05 vs control, # P<0.05 vs MCT. [Ca2+]i indicates cytosolic Ca2+; CaSR indicates extracellular calcium–sensing receptor; MCT, monocrotaline; PAEC, pulmonary artery endothelial cell; shRNA, short hairpin RNA.
CaSR Mediates Monocrotaline‐Induced Endothelial Injury
To reveal whether the activation of CaSR by monocrotaline functionally and eventually affected the integrity of PAECs, cell survival and cleaved caspase 3 were evaluated on exposure of monocrotaline in the presence or absence of the manipulation of CaSR function or expression. As shown in Figure 4I and 4J, the exposure of monocrotaline induced significant loss of cell survival and elevated levels of cleaved caspase 3, and both Calhex 231 and the knockdown of CaSR obviously inhibited monocrotaline‐induced cell damage, respectively, suggesting that CaSR mediated monocrotaline‐induced endothelial injury.
Monocrotaline Induces CaSR Assembly
To reveal the mechanism underlying how monocrotaline activated CaSR, we performed FRET analysis to determine the status of CaSR assembly, a sufficient step for CaSR activation. For this purpose, we simultaneously expressed CFP‐CaSR and YFP‐CaSR fused protein into cultured PAECs and then exposed the cells to 2.5 mmol/L monocrotaline. As shown in Figure 5, the fluorescence transfer from CFP‐CaSR to YFP‐CaSR was significantly enhanced on exposure of monocrotaline (Figure 5A through 5C), indicating the assembly of CaSR. To confirm these results, we conducted Western blots and identified the expression of CaSR with high molecular weight in PAECs after monocrotaline exposure (Figure 5D).
Figure 5.
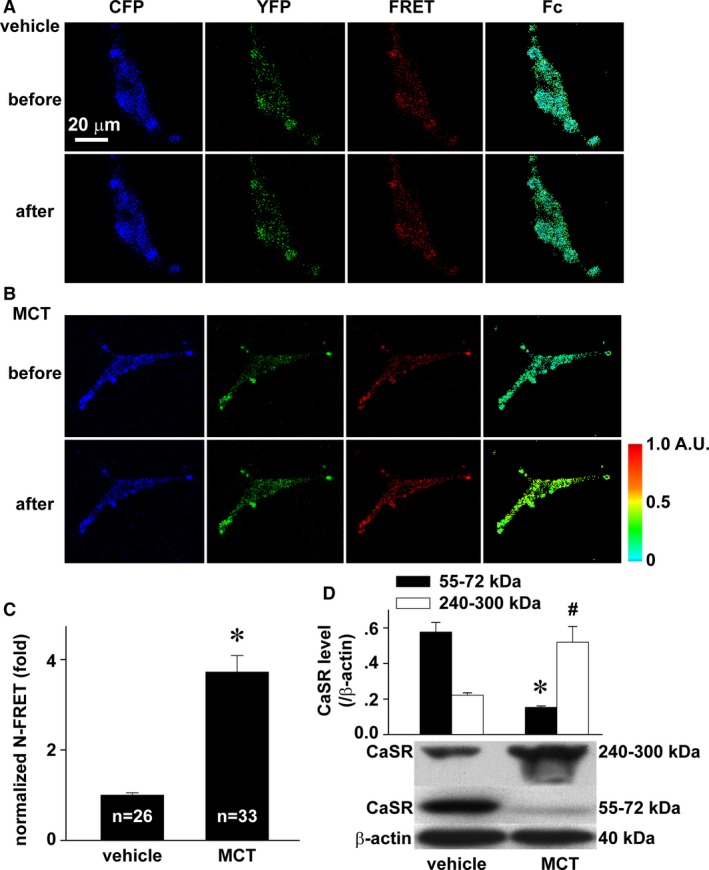
MCT‐induced assembly of CaSR. A through C, Representative images of CFP, YFP, FRET, and Fc in PAECs coexpressed with CFP CaSR ECD and YFP CaSR ECD before and after exposure to vehicle (A) or 2.5 mmol/L monocrotaline (B) and the quantification of N‐FRET (C). The sample size indicated is the number of individual PAECs examined, * P<0.05. D, Representative Western blot and normalized densitometry analysis. *# P<0.05 vs 55 to 72 or 240 to 300 kDa in control, respectively, n=3 separate experiments for each. CaSR indicates extracellular calcium–sensing receptor; CFP, cyan fluorescent protein; ECD, extracellular domain; Fc, corrected fluorescence resonance energy transfer; FRET, fluorescence resonance energy transfer; MCT, monocrotaline; N‐FRET; net fluorescence resonance energy transfer; PAEC, pulmonary artery endothelial cell; YFP, yellow fluorescent protein.
CaSR Mediates Monocrotaline‐Induced Pulmonary Hypertension
To understand whether CaSR mediated monocrotaline‐induced pulmonary hypertension, we evaluated the hemodynamics of pulmonary circulation and vascular remodeling in animals with or without inhibition of CaSR function, knockdown, or knockout of its expression.
We started by evaluating the role of CaSR in monocrotaline‐induced pulmonary hypertension, using the chemical inhibitor of CaSR Calhex 231, the potent negative allosteric modulator of CaSR. As shown in Figure 6, the administration of Calhex 231 significantly attenuated monocrotaline‐altered hemodynamic status of pulmonary circulation as well as the structure of pulmonary arteries and right ventricle in terms of pulmonary artery pressure, pulmonary vascular resistance, vascular wall thickness, and Fulton's index, the index of right ventricular hypertrophy.
Figure 6.
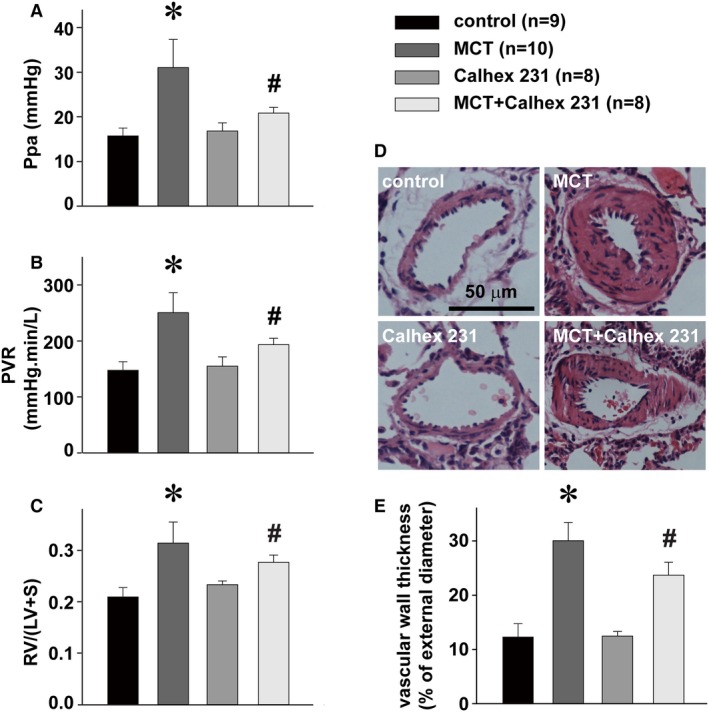
Attenuation of MCT‐induced pulmonary hypertension by CaSR inhibitor. Alterations of Ppa (A), PVR (B), Fulton index (the index of right ventricular hypertrophy, RV/[LV+S]) (C), representative hematoxylin and eosin stainings of a resistance pulmonary artery (D) and summary of pulmonary artery muscularization (E) in control rats or rats treated with MCT, Calhex 231, or MCT plus Calhex 231. * P<0.05 vs control, # P<0.05 vs MCT. The sample size indicated is the number of rats for each group. CaSR indicates extracellular calcium–sensing receptor; LV, left ventricle; MCT, monocrotaline; Ppa, pulmonary artery pressure; PVR, pulmonary vascular resistance; RV, right ventricle; S, septum.
To further and more specifically reveal the role of CaSR in monocrotaline‐induced pulmonary hypertension, we downmanipulated the expression of CaSR in rats using a series of strategies. We generated a global knockdown CaSR rat preparation by the intravenous injections of lentivirus‐packed shRNA against CaSR, as we established previously8 (Figure S1). As summarized in Figure 7A through 7E, CaSR knockdown at global level obviously attenuated monocrotaline‐increased pulmonary artery pressure, pulmonary vascular resistance, vascular wall thickness, and right ventricular hypertrophy.
Figure 7.
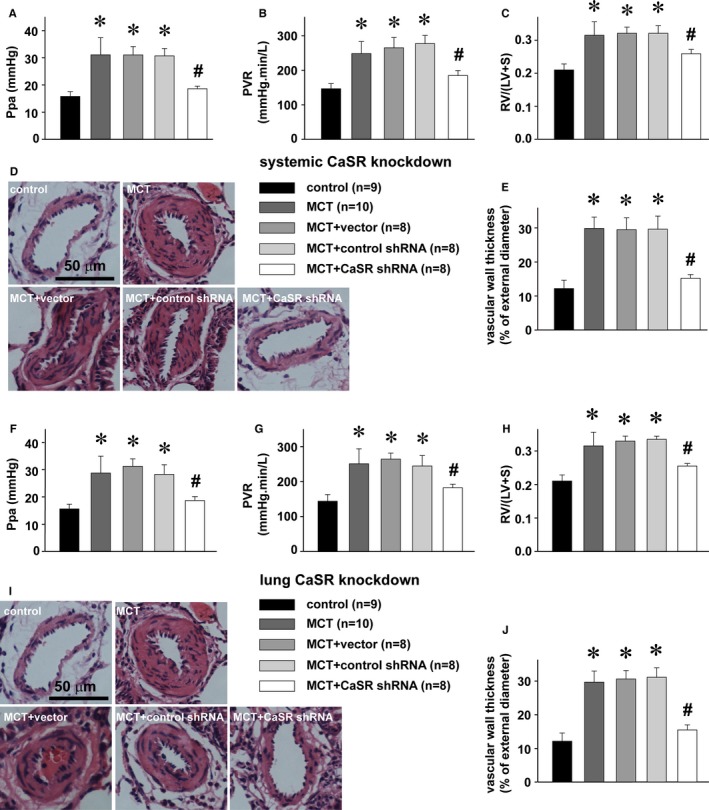
Attenuation of MCT‐induced pulmonary hypertension by CaSR knockdown. A through E, Alterations of Ppa (A), PVR (B), Fulton index, RV/(LV+S) (C), representative HE stainings of a resistance pulmonary artery (D), and summary of pulmonary artery muscularization (E) in control rats and MCT‐treated rats without or with intravenous pretransduction of control shRNA, vector, or CaSR shRNA, respectively. * P<0.05 vs control, # P<0.05 vs MCT. F through J, Alterations of Ppa (F), PVR (G), Fulton index, RV/(LV+S) (H), representative HE stainings of a resistance pulmonary artery (I), and summary of pulmonary artery muscularization (J) in control rats and MCT‐treated rats without or with the intratracheal pretransduction of control shRNA, vector, or CaSR shRNA, respectively. * P<0.05 vs control, # P<0.05 vs MCT. The sample size indicated is the number of rats for each group. The groups of blank control and MCT treatment were included in Figures 6, 7 through 8 for comparison. CaSR indicates extracellular calcium–sensing receptor; HE, hematoxylin and eosin; LV, left ventricle; MCT, monocrotaline; Ppa, pulmonary artery pressure; PVR, pulmonary vascular resistance; RV, right ventricle; S, septum; shRNA, short hairpin RNA.
To further confirm these findings, we prepared lung‐specific knockdown rats by the intratracheal instillations of lentivirus‐packed shRNA against CaSR, and our Western blots confirmed the tissue‐specific knockdown of CaSR in the lungs, not in other major organs (heart, brain, liver, or kidney) as also downregulated in global knockdown rats (Figure S1A through S1E). The lung CaSR knockdown rats did not show any abnormal serum phosphate, calcium, or PTH levels, as significantly noted in global knockdown preparations (Figure S1F through S1H). Consistent with the findings with global knockdown rats, lung‐specific knockdown of CaSR also attenuated monocrotaline‐increased pulmonary artery pressure, pulmonary vascular resistance, vascular wall thickness, and right ventricular hypertrophy (Figure 7F through 7J).
To completely or fully verify the targeting role of CaSR, we constructed and bred CaSR knockout rats in this study (Figures S2 through S4). CaSR−/− knockout rats died from severe hypercalcemia after birth; therefore, we developed PTH and CaSR double‐knockout (PTH−/−/CaSR−/−) animals, the general strategy for experimental studies with CaSR−/− knockout mice preparations.43 As shown in Figure 8, monocrotaline‐induced elevations of pulmonary artery pressure, pulmonary vascular resistance, vascular wall thickness, and right ventricular hypertrophy were almost completely diminished in CaSR knockout (PTH−/−/CaSR−/−) rats, not in wild‐type or control rats (PTH−/−). Of note, the findings about monocrotaline‐induced development of pulmonary hypertension in PTH−/− animals in this experimental study are in agreement with a previous investigation in patients showing that the development of pulmonary hypertension was not related to the level of PTH.44
Figure 8.
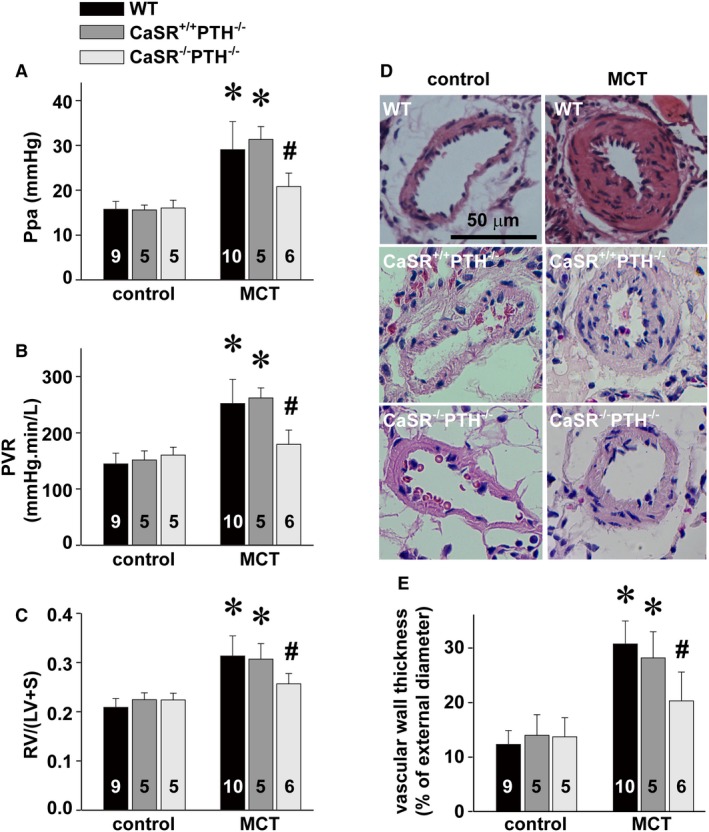
Attenuation of MCT‐induced pulmonary hypertension by CaSR knockout. Alterations of Ppa (A), PVR (B), Fulton index, RV/(LV+S) (C), representative HE stainings of a resistance pulmonary artery (D), and summary of pulmonary artery muscularization (E) in control rats and MCT‐treated PTH knockout (PTH −/−CaSR +/+) rats or PTH and CaSR double‐knockout (PTH −/−CaSR −/−) rats, respectively. *P<0.05 vs control, # P<0.05 vs MCT. The number in the bar indicates the total rats examined for each group. CaSR indicates extracellular calcium–sensing receptor; HE, hematoxylin and eosin; LV, left ventricle; MCT, monocrotaline; Ppa, pulmonary artery pressure; PTH, parathyroid hormone; PVR, pulmonary vascular resistance; RV, right ventricle; S, septum; shRNA, short hairpin RNA; WT, wild type.
Our studies with a monocrotaline‐administered rat model showed significantly attenuated or almost completely abolished pulmonary hypertension by the inhibitor of CaSR, global or lung tissue knockdown or knockout of CaSR, thus finally and strongly demonstrating the role of CaSR as the target underlying monocrotaline‐induced pulmonary hypertension.
Discussion
The structural basis for monocrotaline‐targeting protein may be associated with the amino acids of cysteine, histidine, and tryptophan, as suggested in earlier studies,11, 14 and a specific motif of Cys‐Xaa‐Xaa‐Cys (CXXC), as revealed in recent studies.12, 13 CaSR contains 4 CXXC motifs and 1 CXXXC motif.45 The extracellular domain of CaSR houses 3 of the 4 CXXC motifs and the CXXXC motif as well as 19 cysteines, 13 histidines, and 10 tryptophans (3.2%, 2.2%, and 1.7%, respectively, of total amino acids of ECD). These structures can provide a possible explanation for the binding of monocrotaline to CaSR. Although no one molecule has been identified as the molecular target for monocrotaline‐induced pulmonary hypertension, amino acid comparison between CaSR and several known candidates claimed previously for the development of pulmonary hypertension interestingly reveals the superior structure of CaSR in housing more cysteines, histidines, and tryptophans as well as CXXC motifs over the other molecules such as metabotropic glutamate receptor 5, TRPC1, TRPC4, TRPC6, TRPV4; the KCNE1, KCNA5, KCNMB2, KCNMB3, and KCNJ5 potassium channels; endothelin 1, endothelin A receptor, endothelin B receptor, angiotensin II receptor 1, 5‐HT receptor 2A, endothelial and inducible nitric oxide synthases, bone morphogenetic protein receptor type II, matrix metalloproteinase‐2, hypoxia‐inducible factor‐1α, Nuclear factor of activated T‐cells (cytoplasmic 3), hypoxia‐induced mitogenic factor, RhoA, protein‐disulfide isomerase, and tropomyosin 1. CaSR was not listed among the molecules with potential binding to monocrotaline in a previous study by Lamé et al.13 The failure of the study to identify CaSR as a monocrotaline‐binding protein may be due to its high molecular weight. The proteins with high molecular weight could have been missed by techniques such as sample soaking and gel composition, as also stated in the study.13
The dosage of monocrotaline used in vitro in the current study was adopted from well‐established investigations previously conducted to reveal the binding12, 13 and cellular toxicity of monocrotaline.46, 47, 48 The dosage was also in the range of estimated or calculated serum concentration of monocrotaline after its administration into rats by the standard protocol at 60 mg/kg body weight in inducing pulmonary hypertension.3, 4, 6, 9, 30, 31, 32, 33, 34, 35, 36 Both monocrotaline and MCTP were used in previous studies with isolated blood cells or cultured PAECs in vitro.12, 13, 49 In the pilot experiments with CaSR protein preparations, we prepared MCTP and tried to use MCTP instead of monocrotaline, as Segall and colleagues did previously.12, 13 We found, however, that MCTP aggregated in water to form red insoluble polymers, as reported previously,50, 51 and this prevented us from exploring its binding to CaSR by proton NMR spectroscopy or labeling it with FITC. This might have been the reason for the use of monocrotaline instead of MCTP in experiments using proton NMR spectroscopy in a previous study.49 Of note, our conclusion about the binding of monocrotaline to CaSR in protein preparation and in cultured PAECs was further supported by our cellular thermal shift assay experiments aiming to confirm the binding of MCTP to CaSR in vivo using the pulmonary arteries isolated from monocrotaline‐administered rats, under which MCTP was generally believed to be the major form of monocrotaline metabolites targeting pulmonary endothelial cells. To the best of our knowledge, the binding of MCTP to any molecule in vivo has not been evaluated in any previous studies.
Monocrotaline can bind to other proteins in addition to CaSR, as stated in previous studies.12, 13 This study, therefore, aimed to reveal the potential role of CaSR in mediating the development of pulmonary hypertension by a serious analysis of phenotype. Our physiological results using 3 different preparations of CaSR‐manipulated animals strongly indicated the functional role of CaSR after being bound and altered by monocrotaline. In other words, monocrotaline may bind to proteins, not merely to CaSR; however, CaSR is the first one, to the best of our knowledge, that monocrotaline can not only bind to but also cause the activation or alteration of its functional status. The activation of CaSR by the binding of monocrotaline seemed to result from the assembly of CaSR (Figure 5), and the monocrotaline‐induced CaSR assembly may in turn result from the aggregation of monocrotaline itself, thus providing multiple binding sites.52
The signaling pathways involved in monocrotaline‐induced endothelial injury and pulmonary hypertension that are well known and well studied include Smad, TGF‐β/Alk5, and Rho.35, 36, 53, 54 These pathways also appear to be or associated with the downstream events on activation of CaSR,42, 55, 56 providing an additional line of support for the role of CaSR in mediating the effect of monocrotaline. Nevertheless, this study does not exclude the possible co‐contributions of other proteins bound and functionally altered by monocrotaline, particularly those signaling molecules cross‐talking with the downstream pathways on CaSR activation.
A recent study showed that the CaSR inhibitor NPS 2143 attenuated the development of monocrotaline‐induced pulmonary hypertension by decreasing upregulated expression in CaSR.9 Our findings on inhibition of monocrotaline‐induced pulmonary hypertension by the CaSR inhibitor Calhex 231 in the current study are completely consistent with that report. A possible explanation is that the CaSR inhibitor may be able to diffuse into the cell from its well‐known binding sites in the transmembrane domain of CaSR.57 Specifically, the binding of CaSR inhibitors to CaSR precursors could interfere with their posttranslational modification, maturation, and/or membrane translocation. In support of this possibility, our cytoimmunochemical stainings demonstrated the localization of CaSR, presumably the pre‐matured form of CaSR in the cytosol of PAEC (Figure 3), as reported previously in other types of vascular endothelial cells.38 The activation of CaSR has been well established to stimulate or enhance transcriptional activity of nuclear factor κB58 and Sp1,59 the transcriptional regulators harbored in the promoters of the CaSR gene.60 Indeed, activators of CaSR such as extracellular calcium42 have been shown to upregulate the transcription and gene or protein expression of CaSR.42, 60 Thus, the activation of CaSR seems to upregulate the expression of CaSR in a positive‐feedback manner. The findings of the current study on the binding of monocrotaline to CaSR and the subsequent activation of CaSR, together with its well‐known downstream signaling cascades, may provide an alternative explanation for the upregulated CaSR expression in monocrotaline‐administered animals9 and CaSR inhibitor‐attenuated development of monocrotaline‐induced pulmonary hypertension, as reported in the previous study9 and the current one.
Author Contributions
Hu originated the hypothesis; Hu, Zhu, Su, and Xiao designed the experiments; Hu, Zhu, Xiao, Feng, Su, Zhang, Lu, Li, and Wang carried out the data analyses and interpretation; Zhu, Xiao, Feng, Sun, and Liu performed the data acquisition; Hu wrote the manuscript. All authors approved the manuscript.
Sources of Funding
The study was supported by research grants from the National Natural Science Foundation of China (81330001, 81170048, 31371422, 30971162, 31270031, 81170049, 81470252 and 31400990).
Disclosures
None.
Supporting information
Figure S1. The systemic and lung knockdown of CaSR. Representative immunoblots and statistical summaries of CaSR expression levels in lung (A), liver (B), kidney (C), brain (D), and heart (E) as well as serum levels of phosphate (F), calcium (G), and parathyroid hormone (H) in blank control rats and rats intravenously or intratracheally transduced with CaSR shRNA or control shRNA for systemic and lung CaSR knockdown, respectively. *P<0.05 vs control, n=3 for each group. CaSR indicates extracellular calcium–sensing receptor; shRNA, short hairpin RNA.
Figure S2. The map of the pRP[CRISPR]‐hCas9_D10A‐U6 vector.
Figure S3. Genome editing via the Cas9/gRNA system in Sprague‐Dawley rats. A, Constructs and schematic illustration of the Cas9/gRNA system used in this experiment. The U6 promoter drives transcription of the gRNA, which consists of a target sequence and a scaffold sequence. The CBh promoter drives the expression of Cas9 nuclease. BGH polyA facilitates transcriptional termination of the upstream ORF. B, Target sequence of Casr and parathyroid hormone. The rat Casr gene is located on chromosome 11, and 7 exons have been identified. E3 was selected as the Cas9 targeting region, and gRNA targeting sequences were labeled above in the E3. The rPth gene is located on chromosome 1, and 3 exons have been identified. E2 was selected as the Cas9 targeting region, and gRNA targeting sequences were labeled above in E2. PAM (which is indispensable for Cas9 binding and cleavage) sequences are highlighted in pink. BGH polyA indicates bovine growth hormone polyadenylation signal; CaSR indicates extracellular calcium–sensing receptor; E2, exon 2; E3, exon 3; gRNA, guide RNA; NLS, nuclear localization signal; PAM, protospacer adjacent motif.
Figure S4. Generation of CaSR and PTH double‐knockout rats. A, Detailed mutations of CaSR and PTH genes in F0 KO rats. Deletions are indicated by dashes, insertions are indicated in blue, and substitutions are indicated in red. Deletions (−) and insertions (+) are shown to the right of each allele. B, Detailed mutations of CaSR and PTH genes in F1 KO rats. C, Detailed mutations of CaSR and PTH genes in F2 KO rats. CaSR indicates extracellular calcium–sensing receptor; KO, knockout; PTH, parathyroid hormone.
(J Am Heart Assoc. 2017;6:e004865. DOI: 10.1161/JAHA.116.004865.)
Contributor Information
Liping Zhu, Email: 16654396@qq.com.
Qinghua Hu, Email: qinghuaa@mails.tjmu.edu.cn.
References
- 1. Lalich JJ, Merkow L. Pulmonary arteritis produced in rat by feeding Crotalaria spectabilis . Lab Invest. 1961;10:744–750. [PubMed] [Google Scholar]
- 2. Kay JM, Harris P, Heath D. Pulmonary hypertension produced in rats by ingestion of Crotalaria spectabilis seeds. Thorax. 1967;22:176–179. [DOI] [PMC free article] [PubMed] [Google Scholar]
- 3. Lu A, Zuo C, He Y, Chen G, Piao L, Zhang J, Xiao B, Shen Y, Tang J, Kong D, Alberti S, Chen D, Zuo S, Zhang Q, Yan S, Fei X, Yuan F, Zhou B, Duan S, Yu Y, Lazarus M, Su Y, Breyer RM, Funk CD, Yu Y. EP3 receptor deficiency attenuates pulmonary hypertension through suppression of Rho/TGF‐β1 signaling. J Clin Invest. 2015;125:1228–1242. [DOI] [PMC free article] [PubMed] [Google Scholar]
- 4. Long L, Ormiston ML, Yang X, Southwood M, Gräf S, Machado RD, Mueller M, Kinzel B, Yung LM, Wilkinson JM, Moore SD, Drake KM, Aldred MA, Yu PB, Upton PD, Morrell NW. Selective enhancement of endothelial BMPR‐II with BMP9 reverses pulmonary arterial hypertension. Nat Med. 2015;21:777–785. [DOI] [PMC free article] [PubMed] [Google Scholar]
- 5. Gomez‐Arroyo JG, Farkas L, Alhussaini AA, Farkas D, Kraskauskas D, Voelkel NF, Bogaard HJ. The monocrotaline model of pulmonary hypertension in perspective. Am J Physiol Lung Cell Mol Physiol. 2012;302:L363–L369. [DOI] [PubMed] [Google Scholar]
- 6. Nogueira‐Ferreira R, Vitorino R, Ferreira R, Henriques‐Coelho T. Exploring the monocrotaline animal model for the study of pulmonary arterial hypertension: a network approach. Pulm Pharmacol Ther. 2015;35:8–16. [DOI] [PubMed] [Google Scholar]
- 7. Ryan JJ, Marsboom G, Archer SL. Rodent models of group 1 pulmonary hypertension. Handb Exp Pharmacol. 2013;218:105–149. [DOI] [PubMed] [Google Scholar]
- 8. Zhang J, Zhou J, Cai L, Lu Y, Wang T, Zhu L, Hu Q. Extracellular calcium‐sensing receptor is critical in hypoxic pulmonary vasoconstriction. Antioxid Redox Signal. 2012;17:471–484. [DOI] [PubMed] [Google Scholar]
- 9. Yamamura A, Guo Q, Yamamura H, Zimnicka AM, Pohl NM, Smith KA, Fernandez RA, Zeifman A, Makino A, Dong H, Yuan JX. Enhanced Ca2+‐sensing receptor function in idiopathic pulmonary arterial hypertension. Circ Res. 2012;111:469–481. [DOI] [PMC free article] [PubMed] [Google Scholar]
- 10. Tang H, Yamamura A, Yamamura H, Song S, Fraidenburg DR, Chen J, Gu Y, Pohl NM, Zhou T, Jiménez‐Pérez L, Ayon RJ, Desai AA, Goltzman D, Rischard F, Khalpey Z, Black SM, Garcia JG, Makino A, Yuan JX. Pathogenic role of calcium‐sensing receptors in the development and progression of pulmonary hypertension. Am J Physiol Lung Cell Mol Physiol. 2016;310:L846–L859. [DOI] [PMC free article] [PubMed] [Google Scholar]
- 11. Lamé MW, Jones AD, Morin D, Wilson DW, Segall HJ. Association of dehydromonocrotaline with rat red blood cells. Chem Res Toxicol. 1997;10:694–701. [DOI] [PubMed] [Google Scholar]
- 12. Lamé MW, Jones AD, Wilson DW, Dunston SK, Segall HJ. Protein targets of monocrotaline pyrrole in pulmonary artery endothelial cells. J Biol Chem. 2000;275:29091–29099. [DOI] [PubMed] [Google Scholar]
- 13. Lamé MW, Jones AD, Wilson DW, Segall HJ. Monocrotaline pyrrole targets proteins with and without cysteine residues in the cytosol and membranes of human pulmonary artery endothelial cells. Proteomics. 2005;5:4398–4413. [DOI] [PubMed] [Google Scholar]
- 14. Mattocks AR, Bird I. Alkylation by dehydroretronecine, a cytotoxic metabolite of some pyrrolizidine alkaloids: an in vitro test. Toxicol Lett. 1983;16:1–8. [DOI] [PubMed] [Google Scholar]
- 15. Yao J, Li CG, Gong LK, Feng CC, Li CZ, Gao M, Luan Y, Qi XM, Ren J. Hepatic cytochrome P450s play a major role in monocrotaline‐induced renal toxicity in mice. Acta Pharmacol Sin. 2014;35:292–300. [DOI] [PMC free article] [PubMed] [Google Scholar]
- 16. Zhao YW, Wang SG, Xia QS, Costa GG, Doerge DR, Cai LN, Fu PP. Reaction of dehydropyrrolizidine alkaloids with valine and hemoglobin. Chem Res Toxicol. 2014;27:1720–1731. [DOI] [PubMed] [Google Scholar]
- 17. Martinez ST, Pinto AC, Glasnov T, Kappe CO. Chemistry of pyrrolizidine alkaloids revisited‐semi‐synthetic microwave and continuous‐flow approaches toward Crotalaria‐alkaloids. Tetrahedron Lett. 2014;55:4181–4184. [Google Scholar]
- 18. Chen F, Zhu L, Cai L, Zhang J, Zeng X, Li J, Su Y, Hu Q. A stromal interaction molecule 1 variant up‐regulates matrix metalloproteinase‐2 expression by strengthening nucleoplasmic Ca2+ signaling. Biochim Biophys Acta. 2016;1863:617–629. [DOI] [PubMed] [Google Scholar]
- 19. Song S, Li J, Zhu L, Cai L, Xu Q, Ling C, Su Y, Hu Q. Irregular Ca2+ oscillations regulate transcription via cumulative spike duration and spike amplitude. J Biol Chem. 2012;287:40246–40255. [DOI] [PMC free article] [PubMed] [Google Scholar]
- 20. Li J, Peng X, Zeng X, Liu B, Hao Q, Yu X, Zhu L, Hu Q. Estrogen secreted by mesenchymal stem cells necessarily determines their feasibility of therapeutical application. Sci Rep. 2015;5:15286. [DOI] [PMC free article] [PubMed] [Google Scholar]
- 21. Xia Z, Liu Y. Reliable and global measurement of fluorescence resonance energy transfer using fluorescence microscopes. Biophys J. 2001;81:2395–2402. [DOI] [PMC free article] [PubMed] [Google Scholar]
- 22. Carroll KJ, Makarewich CA, McAnally J, Anderson DM, Zentilin L, Liu N, Giacca M, Bassel‐Duby R, Olson EN. A mouse model for adult cardiac‐specific gene deletion with CRISPR/Cas9. Proc Natl Acad Sci USA. 2016;113:338–343. [DOI] [PMC free article] [PubMed] [Google Scholar]
- 23. Yan Q, Zhang Q, Yang H, Zou Q, Tang C, Fan N, Lai L. Generation of multi‐gene knockout rabbits using the Cas9/gRNA system. Cell Regen (Lond). 2014;3:12. [DOI] [PMC free article] [PubMed] [Google Scholar]
- 24. D'Souza‐Li L, Canaff L, Janicic N, Cole DE, Hendy GN. An acceptor splice site mutation in the calcium‐sensing receptor (CASR) gene in familial hypocalciuric hypercalcemia and neonatal severe hyperparathyroidism. Hum Mutat. 2001;18:411–421. [DOI] [PubMed] [Google Scholar]
- 25. Freichel M, Zink‐Lorenz A, Holloschi A, Hafner M, Flockerzi V, Raue F. Expression of a calcium‐sensing receptor in a human medullary thyroid carcinoma cell line and its contribution to calcitonin secretion. Endocrinology. 1996;137:3842–3848. [DOI] [PubMed] [Google Scholar]
- 26. Hendy GN, Canaff L, Cole DE. The CASR gene: alternative splicing and transcriptional control, and calcium‐sensing receptor (CaSR) protein: structure and ligand binding sites. Best Pract Res Clin Endocrinol Metab. 2013;27:285–301. [DOI] [PubMed] [Google Scholar]
- 27. Cong L, Ran FA, Cox D, Lin S, Barretto R, Habib N, Hsu PD, Wu X, Jiang W, Marraffini LA, Zhang F. Multiplex genome engineering using CRISPR/Cas systems. Science. 2013;339:819–823. [DOI] [PMC free article] [PubMed] [Google Scholar]
- 28. Hsu PD, Scott DA, Weinstein JA, Ran FA, Konermann S, Agarwala V, Li Y, Fine EJ, Wu X, Shalem O, Cradick TJ, Marraffini LA, Bao G, Zhang F. DNA targeting specificity of RNA‐guided Cas9 nucleases. Nat Biotechnol. 2013;31:827–832. [DOI] [PMC free article] [PubMed] [Google Scholar]
- 29. Ran FA, Hsu PD, Lin CY, Gootenberg JS, Konermann S, Trevino AE, Scott DA, Inoue A, Matoba S, Zhang Y, Zhang F. Double nicking by RNA‐guided CRISPR Cas9 for enhanced genome editing specificity. Cell. 2013;154:1380–1389. [DOI] [PMC free article] [PubMed] [Google Scholar]
- 30. George J, D'Armiento J. Transgenic expression of human matrix metalloproteinase‐9 augments monocrotaline‐induced pulmonary arterial hypertension in mice. J Hypertens. 2011;29:299–308. [DOI] [PMC free article] [PubMed] [Google Scholar]
- 31. Alencar AK, Pereira SL, da Silva FE, Mendes LV, Cunha Vdo M, Lima LM, Montagnoli TL, Caruso‐Neves C, Ferraz EB, Tesch R, Nascimento JH, Sant'anna CM, Fraga CA, Barreiro EJ, Sudo RT, Zapata‐Sudo G. N‐acylhydrazone derivative ameliorates monocrotaline‐induced pulmonary hypertension through the modulation of adenosine AA2R activity. Int J Cardiol. 2014;173:154–162. [DOI] [PubMed] [Google Scholar]
- 32. Kameshima S, Kazama K, Okada M, Yamawaki H. Eukaryotic elongation factor 2 kinase mediates monocrotaline‐induced pulmonary arterial hypertension via reactive oxygen species‐dependent vascular remodeling. Am J Physiol Heart Circ Physiol. 2015;308:H1298–H1305. [DOI] [PubMed] [Google Scholar]
- 33. Ranchoux B, Antigny F, Rucker‐Martin C, Hautefort A, Péchoux C, Bogaard HJ, Dorfmüller P, Remy S, Lecerf F, Planté S, Chat S, Fadel E, Houssaini A, Anegon I, Adnot S, Simonneau G, Humbert M, Cohen‐Kaminsky S, Perros F. Endothelial‐to‐mesenchymal transition in pulmonary hypertension. Circulation. 2015;131:1006–1018. [DOI] [PubMed] [Google Scholar]
- 34. Zhao L, Ashek A, Wang L, Fang W, Dabral S, Dubois O, Cupitt J, Pullamsetti SS, Cotroneo E, Jones H, Tomasi G, Nguyen QD, Aboagye EO, El‐Bahrawy MA, Barnes G, Howard LS, Gibbs JS, Gsell W, He JG, Wilkins MR. Heterogeneity in lung 18FDG uptake in pulmonary arterial hypertension: potential of dynamic 18FDG positron emission tomography with kinetic analysis as a bridging biomarker for pulmonary vascular remodeling targeted treatments. Circulation. 2013;128:1214–1224. [DOI] [PubMed] [Google Scholar]
- 35. Li XH, Peng J, Tan N, Wu WH, Li TT, Shi RZ, Li YJ. Involvement of asymmetric dimethylarginine and Rho kinase in the vascular remodeling in monocrotaline‐induced pulmonary hypertension. Vascul Pharmacol. 2010;53:223–229. [DOI] [PubMed] [Google Scholar]
- 36. Zaiman AL, Podowski M, Medicherla S, Gordy K, Xu F, Zhen L, Shimoda LA, Neptune E, Higgins L, Murphy A, Chakravarty S, Protter A, Sehgal PB, Champion HC, Tuder RM. Role of the TGF‐beta/Alk5 signaling pathway in monocrotaline‐induced pulmonary hypertension. Am J Respir Crit Care Med. 2008;177:896–905. [DOI] [PMC free article] [PubMed] [Google Scholar]
- 37. Brown MB, Chingombe TJ, Zinn AB, Reddy JG, Novack RA, Cooney SA, Fisher AJ, Presson RG, Lahm T, Petrache I. Novel assessment of haemodynamic kinetics with acute exercise in a rat model of pulmonary arterial hypertension. Exp Physiol. 2015;100:742–754. [DOI] [PubMed] [Google Scholar]
- 38. “Dimethylformamide”. Spectral database for organic compounds. Japan: AIST. Accessed June 28, 2012. [Google Scholar]
- 39. Ziegelstein RC, Xiong Y, He C, Hu Q. Expression of a functional extracellular calcium‐sensing receptor in human aortic endothelial cells. Biochem Biophys Res Commun. 2006;342:153–163. [DOI] [PubMed] [Google Scholar]
- 40. Martinez Molina D, Jafari R, Ignatushchenko M, Seki T, Larsson EA, Dan C, Sreekumar L, Cao Y, Nordlund P. Monitoring drug target engagement in cells and tissues using the cellular thermal shift assay. Science. 2013;341:84–87. [DOI] [PubMed] [Google Scholar]
- 41. Jafari R, Almqvist H, Axelsson H, Ignatushchenko M, Lundbäck T, Nordlund P, Martinez Molina D. The cellular thermal shift assay for evaluating drug target interactions in cells. Nat Protoc. 2014;9:2100–2122. [DOI] [PubMed] [Google Scholar]
- 42. Chakravarti B, Chattopadhyay N, Brown EM. Signaling through the extracellular calcium‐sensing receptor (CaSR). Adv Exp Med Biol. 2012;740:103–142. [DOI] [PubMed] [Google Scholar]
- 43. Kantham L, Quinn SJ, Egbuna OI, Baxi K, Butters R, Pang JL, Pollak MR, Goltzman D, Brown EM. The calcium‐sensing receptor (CaSR) defends against hypercalcemia independently of its regulation of parathyroid hormone secretion. Am J Physiol Endocrinol Metab. 2009;297:E915–E923. [DOI] [PMC free article] [PubMed] [Google Scholar]
- 44. Amin M, Fawzy A, Hamid MA, Elhendy A. Pulmonary hypertension in patients with chronic renal failure: role of parathyroid hormone and pulmonary artery calcifications. Chest. 2003;124:2093–2097. [DOI] [PubMed] [Google Scholar]
- 45. Morrill GA, Kostellow AB, Gupta RK. Computational analysis of the extracellular domain of the Ca2+‐sensing receptor: an alternate model for the Ca2+ sensing region. Biochem Biophys Res Commun. 2015;459:36–41. [DOI] [PubMed] [Google Scholar]
- 46. Aziz SM, Toborek M, Hennig B, Mattson MP, Guo H, Lipke DW. Oxidative stress mediates monocrotaline‐induced alterations in tenascin expression in pulmonary artery endothelial cells. Int J Biochem Cell Biol. 1997;29:775–787. [DOI] [PubMed] [Google Scholar]
- 47. Lappin PB, Ross KL, King LE, Fraker PJ, Roth RA. The response of pulmonary vascular endothelial cells to monocrotaline pyrrole: cell proliferation and DNA synthesis in vitro and in vivo. Toxicol Appl Pharmacol. 1998;150:37–48. [DOI] [PubMed] [Google Scholar]
- 48. Maioli MA, Alves LC, Perandin D, Garcia AF, Pereira FT, Mingatto FE. Cytotoxicity of monocrotaline in isolated rat hepatocytes: effects of dithiothreitol and fructose. Toxicon. 2011;57:1057–1064. [DOI] [PubMed] [Google Scholar]
- 49. Yang YC, Crowder J, Wardle NJ, Yang L, White KN, Wang ZT, Annie Bligh SW. ¹H NMR study of monocrotaline and its metabolites in human blood. Food Chem Toxicol. 2011;49:2793–2799. [DOI] [PubMed] [Google Scholar]
- 50. Mattocks AR. Chemistry and Toxicology of Pyrrolizidine Alkaloids. London: London Academic Press; 1986. [Google Scholar]
- 51. Mattocks AR, Jukes R, Brown J. Simple procedures for preparing putative toxic metabolites of pyrrolizidine alkaloids. Toxicon. 1989;27:561–567. [DOI] [PubMed] [Google Scholar]
- 52. Pereira TN, Webb RI, Reilly PE, Seawright AA, Prakash AS. Dehydromonocrotaline generates sequence‐selective N‐7 guanine alkylation and heat and alkali stable multiple fragment DNA crosslinks. Nucleic Acids Res. 1998;26:5441–5447. [DOI] [PMC free article] [PubMed] [Google Scholar]
- 53. Ramos M, Lamé MW, Segall HJ, Wilson DW. Monocrotaline pyrrole induces Smad nuclear accumulation and altered signaling expression in human pulmonary arterial endothelial cells. Vascul Pharmacol. 2007;46:439–448. [DOI] [PMC free article] [PubMed] [Google Scholar]
- 54. Upton PD, Morrell NW. The transforming growth factor‐β‐bone morphogenetic protein type signalling pathway in pulmonary vascular homeostasis and disease. Exp Physiol. 2013;98:1262–1266. [DOI] [PubMed] [Google Scholar]
- 55. Pi M, Spurney RF, Tu Q, Hinson T, Quarles LD. Calcium‐sensing receptor activation of rho involves filamin and rho‐guanine nucleotide exchange factor. Endocrinology. 2002;143:3830–3838. [DOI] [PubMed] [Google Scholar]
- 56. Li L, Chen F, Cao YG, Qi HP, Huang W, Wang Y, Jing S, Sun HL. Role of calcium‐sensing receptor in cardiac injury of hereditary epileptic rats. Pharmacology. 2015;95:10–21. [DOI] [PubMed] [Google Scholar]
- 57. Petrel C, Kessler A, Dauban P, Dodd RH, Rognan D, Ruat M. Positive and negative allosteric modulators of the Ca2+‐sensing receptor interact within overlapping but not identical binding sites in the transmembrane domain. J Biol Chem. 2004;279:18990–18997. [DOI] [PubMed] [Google Scholar]
- 58. Mentaverri R, Yano S, Chattopadhyay N, Petit L, Kifor O, Kamel S, Terwilliger EF, Brazier M, Brown EM. The calcium sensing receptor is directly involved in both osteoclast differentiation and apoptosis. FASEB J. 2006;20:2562–2564. [DOI] [PubMed] [Google Scholar]
- 59. Cañadillas S, Canalejo R, Rodriguez‐Ortiz ME, Martinez‐Moreno JM, Estepa JC, Zafra R, Perez J, Muñoz‐Castañeda JR, Canalejo A, Rodriguez M, Almaden Y. Upregulation of parathyroid VDR expression by extracellular calcium is mediated by ERK1/2‐MAPK signaling pathway. Am J Physiol Renal Physiol. 2010;298:F1197–F1204. [DOI] [PubMed] [Google Scholar]
- 60. Chakrabarty S, Wang H, Canaff L, Hendy GN, Appelman H, Varani J. Calcium sensing receptor in human colon carcinoma: interaction with Ca2+ and 1,25‐dihydroxyvitamin D3 . Cancer Res. 2005;65:493–498. [PubMed] [Google Scholar]
Associated Data
This section collects any data citations, data availability statements, or supplementary materials included in this article.
Supplementary Materials
Figure S1. The systemic and lung knockdown of CaSR. Representative immunoblots and statistical summaries of CaSR expression levels in lung (A), liver (B), kidney (C), brain (D), and heart (E) as well as serum levels of phosphate (F), calcium (G), and parathyroid hormone (H) in blank control rats and rats intravenously or intratracheally transduced with CaSR shRNA or control shRNA for systemic and lung CaSR knockdown, respectively. *P<0.05 vs control, n=3 for each group. CaSR indicates extracellular calcium–sensing receptor; shRNA, short hairpin RNA.
Figure S2. The map of the pRP[CRISPR]‐hCas9_D10A‐U6 vector.
Figure S3. Genome editing via the Cas9/gRNA system in Sprague‐Dawley rats. A, Constructs and schematic illustration of the Cas9/gRNA system used in this experiment. The U6 promoter drives transcription of the gRNA, which consists of a target sequence and a scaffold sequence. The CBh promoter drives the expression of Cas9 nuclease. BGH polyA facilitates transcriptional termination of the upstream ORF. B, Target sequence of Casr and parathyroid hormone. The rat Casr gene is located on chromosome 11, and 7 exons have been identified. E3 was selected as the Cas9 targeting region, and gRNA targeting sequences were labeled above in the E3. The rPth gene is located on chromosome 1, and 3 exons have been identified. E2 was selected as the Cas9 targeting region, and gRNA targeting sequences were labeled above in E2. PAM (which is indispensable for Cas9 binding and cleavage) sequences are highlighted in pink. BGH polyA indicates bovine growth hormone polyadenylation signal; CaSR indicates extracellular calcium–sensing receptor; E2, exon 2; E3, exon 3; gRNA, guide RNA; NLS, nuclear localization signal; PAM, protospacer adjacent motif.
Figure S4. Generation of CaSR and PTH double‐knockout rats. A, Detailed mutations of CaSR and PTH genes in F0 KO rats. Deletions are indicated by dashes, insertions are indicated in blue, and substitutions are indicated in red. Deletions (−) and insertions (+) are shown to the right of each allele. B, Detailed mutations of CaSR and PTH genes in F1 KO rats. C, Detailed mutations of CaSR and PTH genes in F2 KO rats. CaSR indicates extracellular calcium–sensing receptor; KO, knockout; PTH, parathyroid hormone.