

Abstract
Background
The objective of this study was to evaluate whether aortic pulse wave velocity (Ao‐PWV) predicts estimated glomerular filtration rate (eGFR) decline in patients with type 2 diabetes mellitus.
Methods and Results
This prospective single‐center cohort study investigated 211 type 2 diabetes mellitus patients with eGFR ≥45 mL/min with a baseline mean age of 60.1 years (range, 30–82 years). The mean±SD baseline eGFR was 85±26.1 mL/min. We divided the cohort into 2 groups above (n=117, “older”) and below (n=94, “younger”) the mean age to evaluate whether Ao‐PWV predicted progression of kidney disease differentially in older and younger patients. The primary end point was reaching a final eGFR below the median for the age group and an eGFR fall ≥1 mL/min per year. Median follow‐up was 9 years (range, 3–11 years) and ≈50% of patients in both groups reached the primary end point. In older patients, Ao‐PWV was similar in those who did and did not reach the primary end point. By contrast, younger patients who reached the primary end point had a higher Ao‐PWV at baseline compared with those who did not (10.8 m/s versus 9.5 m/s, respectively; mean difference of 1.36 m/s [95% CI, 0.38–2.33], P=0.007). Ao‐PWV was an independent predictor of the primary end point (incident risk ratio, 1.09; 95% CI, 1.02–1.18) after adjustment for traditional risk factors only in younger patients (P=0.02). A 1m/s increase in Ao‐PWV was associated with a mean fall in eGFR of 2.1 mL/min per year (95% CI, 0.09–4.1) independent of other risk factors in younger patients (P=0.04).
Conclusions
Ao‐PWV predicts eGFR decline, before the onset of advanced renal dysfunction, and is a potential target for renoprotection in younger patients with type 2 diabetes mellitus.
Keywords: aortic stiffness, arterial stiffness, diabetes (kidney), renal disease progression, renal insufficiency, type 2 diabetes mellitus
Subject Categories: Vascular Disease, Nephrology and Kidney
Introduction
Increased arterial stiffness, involving accelerated vascular aging of the aorta, is a powerful risk factor for early mortality and progression of renal function decline as measured by estimated glomerular filtration rate (eGFR) in patients with advanced stages of chronic kidney disease (CKD).1, 2, 3 Aortic pulse wave velocity (Ao‐PWV) is the most reliable measure of arterial stiffness that predicts cardiorenal outcomes.4 Increased Ao‐PWV leads to greater transmission of pressure changes to the renal microcirculation with the resultant exposure of glomerular capillaries to damaging pulsatile pressures.2 Both the kidney and the brain have high volume flow at very low vascular resistance and are therefore exquisitely vulnerable to pressure‐induced damage.5, 6 We previously demonstrated an inverse relationship of Ao‐PWV with eGFR in type 2 diabetes mellitus (T2DM) patients with comparatively preserved renal function, suggesting that even modest renal functional impairment is associated with changes in the elastic properties of the aorta well before the onset of overt renal insufficiency.7 The predictive role of Ao‐PWV on eGFR decline in T2DM patients with eGFR >45 mL/min is unclear.
Therefore, we evaluated whether Ao‐PWV predicted eGFR decline in a prospective observational single‐center cohort study of 211 T2DM patients with relatively preserved renal function.
Research Design and Methods
This was a prospective cohort study of T2DM patients with eGFR ≥45 mL/min attending the diabetes clinic at Guy's Hospital, London, UK, between 2002 and 2004 for baseline measurements. All patients were followed to 2015 or their death, a median time interval of 9 years (range, 3–11 years). T2DM was defined according to American Diabetes Association criteria.8 Exclusion criteria were presence of connective tissue diseases known to affect arterial vasculature, history of nondiabetic kidney disease, and pregnancy.
All baseline measurements and procedures were taken with the patients in the fasted state and having refrained from nicotine, alcohol, and caffeine for at least the previous 10 hours. Brachial blood pressure (BP) was measured in triplicate in the supine position with an automated sphygmomanometer (Omron Digital Blood Pressure Monitor HEM907, Bannockburn, IL). Ao‐PWV was determined from carotid and femoral pressure waveforms obtained noninvasively by applanation tonometry (Millar Instruments, Houston, TX) using the Sphygmocor system (AtCor Medical, Sydney, Australia) as previously described.7 The distance between the surface markings of the sternal notch and the carotid (dc) and femoral artery (df) were used to estimate the path length between the carotid and femoral arteries (L=df−dc) and Ao‐PWV computed as L/ΔT.7 The within‐subject SD of Ao‐PWV assessed using this method in our laboratory is 0.5 m/s. The intraobserver coefficient of variation was 3.5%.7, 9
Standardized clinical and biochemical measures were performed at least annually for the duration of the follow‐up period. These included urine albumin to creatinine ratio (ACR) from morning urine samples (urine creatinine [by Jaffe reaction] and urine albumin concentration [by immunoturbidimetry]) determined using a Cobas Mira Plus analyzer (Roche Diagnostics, Basel, Switzerland), serum total cholesterol (enzymatic colorimetry), and serum creatinine (Jaffe rate reaction method) using a Cobas Mira Plus analyzer (Roche Diagnostics).7 Glycated hemoglobin (HbA1c) was measured by boronate affinity high‐pressure liquid chromatography (Primus CLC330, Kansas City, MO).
Arterial hypertension was diagnosed if mean systolic BP was >140 mm Hg or diastolic BP was >90 mm Hg or if the patient was taking antihypertensive drugs. Ischemic cardiovascular disease, cerebrovascular disease, peripheral vascular disease, and medication history were confirmed from clinical records. Diabetic retinopathy was evaluated from a diabetic retinal screening database and the clinical records of the ophthalmology department.
eGFR was determined using the Chronic Kidney Disease Epidemiology Collaboration Formula equation.10 The natural rate of glomerular filtration rate (GFR) decline with age as described in longitudinal studies is up to 1 mL/min per year,11, 12 and this decline commences in patients aged 30 to 40 years.11 An acceleration in the rate of decline of GFR is described after the age of 60 years.11
Many patients with T2DM do not have significant progression of renal impairment. In a recent study in T2DM patients with eGFR >60 mL/min, 85% of the cohort had an annual decline in GFR <1 mL/min.13 In T2DM patients with a baseline eGFR <60 mL/min, the annual decline of renal function was 0.85 mL/min.14
For these reasons, we based the definition of progression in our cohort with early kidney disease as a fall in eGFR ≥1 mL/min per year. We first evaluated whether the baseline Ao‐PWV predicted eGFR decline across the whole cohort, as our previous cross‐sectional data suggested an inverse relationship between Ao‐PWV and eGFR. Because age is the most powerful determinant of Ao‐PWV and also determines the natural rate of eGFR decline, it could potentially confound the relationship between Ao‐PWV and progression of renal dysfunction. To address this, we divided the cohort into 2 groups above and below the mean age of the cohort (60 years). The median eGFR at the end of follow‐up in each age group was used to categorize those patients with progression of renal dysfunction to obtain a more precise age and cohort‐specific cutoffs for progression of renal dysfunction in this population.
Patients with final eGFR below the median for the group and annual fall in GFR ≥1 mL/min were defined as progressors and those with final eGFR above the median and annual fall in GFR <1 mL/min were defined as nonprogressors. We also evaluated eGFR change as a continuous factor in a repeated measures mixed model analysis.
The study was approved by the research ethics committee of Guy's and St. Thomas's Hospitals. All patients gave informed consent and the study was undertaken in adherence to the Declaration of Helsinki.
Statistical Analysis
Descriptive statistics were used for the analysis of demographic and clinical features of the cohort. ACR values were log‐transformed before calculation because of their positively skewed distribution. Patients with and without progression of kidney disease were compared by unpaired t test (for continuous normal variables), Mann–Whitney test (for continuous nonparametrically distributed variables), and chi‐square test (for categorical variables). Differences significant at the <10% level were entered in a Poisson (log‐linear) multiple regression model with progression of kidney disease as the dependent variable to determine which variables best predicted progression. For each patient, a linear regression model of time on eGFR (least‐squares method) was created, and the slope of the regression line was used to estimate the patient's changes in eGFR over time.15
Candidate variables entered into the multivariate regression models included the following: age, sex, diabetes mellitus duration, smoking status, hypertension, antihypertensive treatment, (number and classes of drugs), pulse pressure, mean arterial pressure, systolic BP, retinopathy status, ACR, HbA1c, baseline eGFR, and number of eGFR measurements.
Three investigators, who were blinded to baseline Ao‐PWV results, independently collected all of the follow‐up data. Data are given as mean±SD or 95% CIs, percentage for categorical variables, or median and interquartile range for variables not normally distributed. Poisson regression results are presented as incident rate ratios, calculated as the exponential of the estimated regression coefficients, with their respective 95% CIs, and a 2‐tailed P<0.05 was considered significant. Poisson multivariate regression analyses is suitable when analyzing time to event data and when times between successive events are independent and exponentially distributed (as in our data set).
This approach also allows dependence of risk on multiple time scales and enables for direct estimation of the survival distribution function and estimation of relative risks.16, 17
To evaluate the variables that predicted longitudinal change in eGFR during follow‐up, a repeated measures linear mixed model (with random intercepts and slopes specific to each participant) were used.18, 19, 20 Regression diagnostics (omnibus test and change in maximum likelihood) were examined and these indicated no significant overspecification. Collinearity diagnostics (variance inflation factor and tolerance) were examined and excluded significant collinearity.
We also performed net reclassification improvement21, 22 analyses to determine improvement in risk prediction when Ao‐PWV was added to traditional predictors of renal disease progression with MATLAB 2014a software (MathWorks, Natick, MA). All other statistical analyses were performed with SPSS version 19.0 (SPSS Inc, Chicago, IL).
Results
The baseline demographic and clinical characteristics of the whole cohort (n=211) and in those “older” (above mean age n=117) and “younger” (below mean age n=94) is shown in Table 1.
Table 1.
Baseline Demographic, Clinical and Biochemical Characteristics of the Whole Cohort of 211 Patients and of Those Below (“Younger”) and Above (“Older”) Mean Age of Cohort
| Whole Cohort (N=211) | Younger (n=94) | Older (n=117) | P Value Younger vs Older | |
|---|---|---|---|---|
| Age, ya | 60.1 (33–82) | 50.5 (33–59) | 67.5 (60–82) | |
| Male sex, % | 64 | 66 | 62 | 0.44 |
| Diabetes mellitus duration, years | 9.9±6.7 | 7.7±4.7 | 11.8±7.6 | <0.001 |
| Hypertension, % | 88 | 86 | 90 | 0.32 |
| Body mass index, kg/m2 | 31.8±6.2 | 33.1±7.2 | 30.7±5.1 | 0.005 |
| SBP, mm Hg | 141.9±16.6 | 139.7±15.0 | 143.0±17.8 | 0.16 |
| DBP, mm Hg | 79.6±8.8 | 82.2±8.9 | 77.4±8.3 | <0.001 |
| Mean arterial pressure, mm Hg | 98.7±13.3 | 99.5±12.0 | 98.0±13.0 | 0.4 |
| Pulse pressure, mm Hg | 62.1±14.2 | 57.6±12.2 | 65.9±14.8 | <0.001 |
| Urine ACR, mg/mmolb | 2.5 (0.8–8.8) | 3.65 (0.8–11.7) | 2.25 (0.8–6.77) | 0.54 |
| Total cholesterol, mmol/L | 4.47±0.86 | 4.44±0.78 | 4.5±0.8 | 0.60 |
| Glycated hemoglobin, % | 7.8±1.4 | 7.8±1.3 | 7.8±1.4 | 0.9 |
| Estimated GFR, mL/min | 85.3±26.1 | 97.5±23.1 | 73.2±23 | <0.001 |
| Ao‐PWV, m/s | 11.1±2.7 | 10.1±2.3 | 12.04±2.7 | <0.001 |
Values are expressed as mean±SD unless otherwise stated. ACR indicates albumin to creatinine ratio; Ao‐PWV, aortic pulse wave velocity; DBP, diastolic blood pressure; GFR, estimated glomerular filtration rate; SBP, systolic blood pressure.
Values expressed as mean (range).
Values expressed as median (interquartile range).
In the whole cohort, there were 136 men and 75 women with a mean age (range) of 60.1 (30–82) years. Approximately 56% of patients were of Caucasian origin, 10% of Asian origin, and 34% of Afro‐Caribbean origin. Forty‐six percent of patients had never smoked and 77% were taking treatment with inhibitors of the renin‐angiotensin‐aldosterone system. Approximately 73% were taking oral antidiabetic agents and 27% insulin treatment for diabetes mellitus. A confirmed diagnosis of diabetic retinopathy was present in 47% of patients and 5% had a history of cardiovascular disease at baseline. At baseline 49% of patients were normoalbuminuric (ACR <3 mg/mmol), 37% had microalbuminuria (ACR 3–30 mg/mmol), and 14% had ACR >30 mg/mmol.
In the whole cohort of 211 patients, baseline Ao‐PWV was not significantly different between patients with progression of renal dysfunction versus those with no progression (11.2±2.6 versus 10.8±2.6 [P=0.28], respectively). Progressors were significantly older (61.6±9.6 years versus 58.5±10.8 years, P=0.03), had higher urine ACR (median 3.8 [interquartile range, 0.87–18.2] versus 2.3 [0.7–4.8] mg/mmol; P=0.001), and lower baseline eGFR (72±20 mL/min versus 92±23 mL/min, P=0.001). Approximately 66% of the cohort had an Ao‐PWV ≥10 m/s. Patients with an Ao‐PWV above this cutoff did not have higher risk of progression of renal dysfunction when compared with patients below it. We observed a significant inverse association between baseline eGFR and Ao‐PWV in the whole cohort similar to what we and others have previously described.7
Because eGFR, Ao‐PWV, and age are statistically and biologically highly interrelated and correlated, to investigate whether age may have confounded the relationships between Ao‐PWV and progression, we divided the cohort into 2 age groups above (“older”) and below (“younger”) the mean age of the cohort, at baseline. Older patients had significantly longer duration of diabetes mellitus; lower body mass index, eGFR, and diastolic BP; and higher pulse pressure and Ao‐PWV at baseline (Table 1, P<0.05 for all). The effect of age within both subgroups was linear.
After a median time interval of 9 years (range 3–11), 49% of younger and 50% of older patients had progression. The baseline characteristics of patients with and without progression in each age category are shown in Table 2 (older patients) and Table 3 (younger patients), respectively.
Table 2.
Comparison of Baseline Characteristics of 117 Older T2DM Patients With or Without Progression of Renal Dysfunction
| Progressors (n=59) | Nonprogressors (n=58) | P Value | |
|---|---|---|---|
| Age, y | 68.1±4.8 | 67.2±4.7 | 0.3 |
| Male sex, % | 60 | 66 | 0.54 |
| Diabetes mellitus duration, y | 11.5±6.8 | 12±8.2 | 0.7 |
| Hypertension, % | 95 | 86.5 | 0.5 |
| RAAS inhibitor treatment, % | 80.4 | 78.3 | 0.79 |
| Body mass index, kg/m2 | 31.8±5.5 | 29.5±4.4 | 0.016 |
| SBP, mm Hg | 144.6±16.6 | 142.7±18.6 | 0.69 |
| DBP, mm Hg | 77.2±7.7 | 77.8±8.8 | 0.57 |
| Pulse pressure, mm Hg | 67.1±14.4 | 64.8±15.2 | 0.4 |
| Urine ACR, mg/mmola | 4.05 (0.8–20.4) | 1.5 (0.77–4.4) | 0.006 |
| Cholesterol, mmol/L | 4.4±0.8 | 4.5±0.7 | 0.32 |
| Glycated hemoglobin, % | 7.83±1.6 | 7.86±1.2 | 0.92 |
| Baseline eGFR, mL/min | 62.2±15.1 | 86.5±23.5 | <0.001 |
| Final eGFR, mL/min | 42.2±16.3 | 84.5±13.6 | <0.001 |
| Ao‐PWV, m/s | 12.03±2.7 | 12.02±2.6 | 0.99 |
Values are expressed as mean±SD unless otherwise stated. ACR indicates albumin to creatinine ratio; Ao‐PWV, aortic pulse wave velocity; DBP, diastolic blood pressure; eGFR, estimated glomerular filtration rate; RAAS, renin‐angiotensin‐aldosterone system; SBP, systolic blood pressure.
Values expressed as median (interquartile range).
Table 3.
Comparison of Baseline Characteristics of 94 Younger T2DM Patients With or Without Progression of Renal Dysfunction
| Progressors (n=46) | Nonprogressors (n=48) | P Value | |
|---|---|---|---|
| Age, y | 51.6±6.2 | 49.5±6.5 | 0.12 |
| Male sex, % | 67 | 58 | 0.43 |
| Diabetes mellitus duration, y | 8.9±5.6 | 6.9±3.8 | 0.05 |
| Hypertension, % | 94 | 75 | 0.01 |
| RAAS inhibitor treatment, % | 80 | 60 | 0.17 |
| Body mass index, kg/m2 | 33.7±5.6 | 33.7±8.7 | 0.97 |
| SBP, mm Hg | 143.3±14.2 | 136.2±15.1 | 0.02 |
| DBP, mm Hg | 82.5±7.6 | 79.8±9.2 | 0.13 |
| Mean arterial pressure, mm Hg | 102.7±8 | 98.7±10.1 | 0.04 |
| Pulse pressure, mm Hg | 60.7±13.5 | 56.5±11 | 0.09 |
| Urine ACR, mg/mmola | 5.35 (1.22–19.8) | 2.35 (0.47–5.77) | 0.007 |
| Cholesterol, mmol/L | 4.7±0.76 | 4.32±0.86 | 0.15 |
| Glycated hemoglobin, % | 7.8±1.27 | 7.7±1.44 | 0.64 |
| Baseline eGFR, mL/min | 87.0±15.6 | 98.5±15.1 | 0.001 |
| Final eGFR, mL/min | 57.0±20.6 | 102.6±11.6 | 0.001 |
| Ao‐PWV, m/s | 10.8±2.6 | 9.5±2.0 | 0.007 |
Values are expressed as mean±SD unless otherwise stated. ACR indicates albumin to creatinine ratio; Ao‐PWV, aortic pulse wave velocity; eGFR, estimated glomerular filtration rate; RAAS, renin‐angiotensin‐aldosterone system.
Values expressed as median (interquartile range).
Older patients with progression had significantly higher body mass index, higher urine ACR, and a lower baseline eGFR compared with those without progression (P<0.05 for all; Table 2). Ao‐PWV was similar in older patients with (12.03±2.7 m/s) and without (12.02±2.6 m/s) progression (Figure) and not significantly associated with progression of renal dysfunction.
Figure 1.
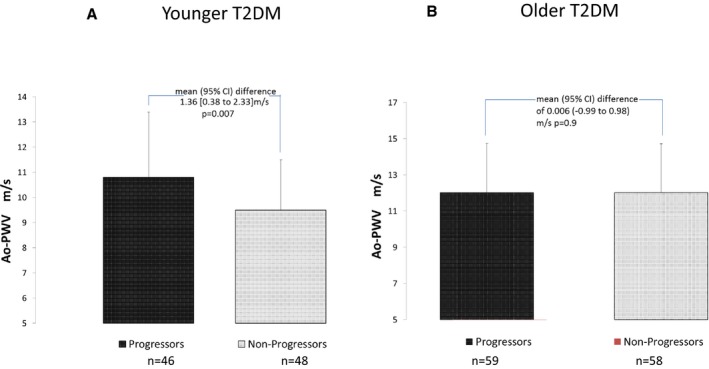
Ao‐PWV in 211 T2DM “younger” (A) and “older” (B) patients with or without progression of renal function decline. Ao‐PWV indicates aortic pulse wave velocity; T2DM, type 2 diabetes mellitus.
The proportion of Ao‐PWV ≥10 m/s in younger patients was 51% and in older patients was 78%. Patients with an Ao‐PWV above this cutoff did not have a higher risk of progression of renal dysfunction when compared with patients below it in either age group.
Younger patients with progression had a significantly longer duration of diabetes mellitus; higher prevalence of hypertension, higher systolic BP, and urine ACR; and a lower eGFR at baseline (P<0.05 for all; Table 3) compared with patients without progression. Progressors had a mean annual fall in eGFR of −3.85 mL/min per year (95% CI, −4.58 to −3.18) compared with 0.7 mL/min per year (95% CI, 0.33–1.01) in nonprogressors and a final eGFR <83 mL/min (median eGFR at end of follow‐up for the age group). In patients with progression, mean±SD baseline and final eGFR was 87.0±15.5 and 57.0±20.6 mL/min, respectively, compared with 98.5±15 and 102.6±11.6 mL/min in nonprogressors.
In younger patients, mean±SD Ao‐PWV was significantly higher in patients with progression of renal function decline (10.8±2.6 m/s) compared with patients without progression (9.5±2.0 m/s), a mean 95% CI difference of 1.36 m/s (0.38–2.33) (P=0.007; Figure A). Ao‐PWV was significantly associated with age, ACR, and pulse pressure in bivariate analyses. There were no significant differences in age, sex, ethnicity including proportion of patients of Afro‐Caribbean ethnicity, smoking status, body mass index, HbA1c, prevalence of retinopathy, drug treatments (including use of renin‐angiotensin‐aldosterone system inhibitors), peripheral vascular disease, or cardiovascular disease in patients who had progression compared with those with no progression.
In younger patients, baseline Ao‐PWV was a predictor of progression with an increased incident risk ratio of 1.09 (95% CI, 1.02–1.18; P=0.02) independent of traditional risk factors such as age (baseline and final when entered either together or individually to the model), sex, mean arterial pressure or systolic BP or pulse pressure, hypertension or number of antihypertensive agents, baseline eGFR, duration of diabetes mellitus, total cholesterol, HbA1c, number of eGFR measurements, and ACR.
Table 4 presents the independent variables that predicted the progression by Poisson regression in younger patients. This model suggests that an increase in Ao‐PWV of 1 m/s increased the risk of progression of renal function decline by 9% independent of traditional risk factors/predictors. The unadjusted and adjusted effect of Ao‐PWV on progression of renal disease is reported in Table 5. The results from an unadjusted model and a model adjusted for age, sex, and baseline eGFR indicates that a 1‐m/s increase in Ao‐PWV increases risk of progression by 12%.
Table 4.
Results of Poisson Regression Analysis for Baseline Variables That Predict Progression Renal Dysfunction in 94 Younger T2DM Patients
| IRR | 95% CI | P Value | |
|---|---|---|---|
| Baseline age | 0.94 | 0.88–1.01 | 0.10 |
| Male sex | 1.25 | 0.89–1.61 | 0.18 |
| Diabetes mellitus duration | 1.00 | 0.97–1.03 | 0.99 |
| Baseline eGFR | 0.98 | 0.97–0.99 | 0.002 |
| Albuminuriaa | 1.06 | 0.95–1.17 | 0.28 |
| Ao‐PWV | 1.09 | 1.01–1.17 | 0.02 |
| Hypertension | 0.52 | 0.24–1.13 | 0.10 |
| Glycated hemoglobin | 1.005 | 0.99–1.02 | 0.39 |
| No. of eGFR measurements | 0.99 | 0.94–1.03 | 0.54 |
| Final age at follow‐up | 1.05 | 0.99–1.12 | 0.10 |
| Pulse pressure | 1.00 | 0.98–1.01 | 0.90 |
Aortic pulse wave velocity (Ao‐PWV) remained significant predictor progression renal dysfunction if systolic blood pressure or mean arterial pressure were entered in place of pulse pressure and if renin‐angiotensin‐aldosterone inhibitors were entered in place of hypertension. eGFR indicates estimated glomerular filtration rate; IRR, incident rate ratio; T2DM, type 2 diabetes mellitus.
log albumin to creatinine ratio mg/mmol.
Table 5.
Unadjusted and Adjusted Models Evaluating the Effect of Ao‐PWV on Progression of Renal Dysfunction in 94 Younger T2DM Patients
| IRR | 95% CI | P Value | |
|---|---|---|---|
| Unadjusted model | 1.12 | 1.05–1.18 | <0.001 |
| Model 1 adjusted for age and sex | 1.12 | 1.05–1.19 | 0.001 |
| Model 2 adjusted for age, sex, and baseline eGFR | 1.12 | 1.05–1.19 | 0.001 |
| Model 3 adjusted for age, sex, baseline eGFR, pulse pressure, ACR | 1.08 | 1.01–1.16 | 0.028 |
| Model 4 (model 3+diabetes mellitus duration, glycated hemoglobin, hypertension, number of eGFR measurements, final age) | 1.09 | 1.01–1.17 | 0.020 |
ACR indicates albumin to creatinine ratio; Ao‐PWV, aortic pulse wave velocity; eGFR, estimated glomerular filtration rate; IRR, incident rate ratio; T2DM, type 2 diabetes mellitus.
The only other independent variable that significantly predicted progression was a lower baseline eGFR (incident risk ratio, 0.98; 95% CI, 0.97–0.99 [P=0.002]). Baseline albuminuria (incident risk ratio, 1.06; 95% CI, 0.95–1.17 [P=0.288]) increased the risk of progression but this did not reach statistical significance. Similarly, when ACR was entered as a categorical (microalbuminuria and macroalbuminuria) risk marker, it did not significantly predict progression.
We examined the relationship between baseline eGFR and progression of renal dysfunction and, as would be expected, a lower baseline eGFR predicted faster rate of eGFR fall. Patients with a 1‐mL/min lower baseline eGFR had a greater mean reduction in eGFR of 0.84 (95% CI, 0.57–1.10) and 0.9 (95% CI, 0.76–1.04) mL/min per year in younger and older patient groups, respectively. Similarly, younger and older patients with a 1‐mL/min lower baseline eGFR had a 2% and 3% higher incident risk ratio of progression, respectively.
In a linear mixed model analysis, a 1‐m/s increase in Ao‐PWV was associated with a mean fall in eGFR independent of other established risk factors (2.1; 95% CI, 0.09–4.1 mL/min per year [P=0.04]) only in younger patients (Table 6).
Table 6.
Results of Repeated Measures Linear Mixed Model Evaluating the Independent Variables That Predicted Longitudinal Change in eGFR During Follow‐Up in 94 Younger T2DM Patients
| Estimate | 95% CI | P Value | |
|---|---|---|---|
| Age | 0.001 | −0.74 to 0.75 | 0.99 |
| Male sex | 1.92 | −6.47 to 10.30 | 0.88 |
| Diabetes mellitus duration | −0.64 | −1.53 to 0.25 | 0.22 |
| Baseline eGFR | 0.84 | 0.57 to 1.10 | 0.001 |
| Albuminuriaa | 0.18 | −2.53 to 2.89 | 0.89 |
| Ao‐PWV | −2.1 | −4.10 to −0.09 | 0.04 |
| Hypertension | −14.3 | −29.05 to 0.35 | 0.06 |
| Glycated hemoglobin | 0.001 | −0.32 to 0.22 | 0.72 |
| Pulse pressure | 0.10 | −0.24 to 0.44 | 0.55 |
Ao‐PWV remained significant predictor progression renal dysfunction if systolic blood pressure or mean arterial pressure were entered in place of pulse pressure and if renin angiotensin aldosterone inhibitors were entered in place of hypertension. Ao‐PWV indicates aortic pulse wave velocity; eGFR, estimated glomerular filtration rate; T2DM, type 2 diabetes mellitus.
log albumin to creatinine ratio mg/mmol.
We also performed net reclassification improvement analyses to determine improvement in risk prediction when Ao‐PWV was added to traditional predictors of renal disease progression. The net reclassification improvement analyses demonstrated that including Ao‐PWV in the model correctly reclassified a further ≈9% of the “young” progressors compared with a model without Ao‐PWV. In brief, 4 patients of a total 46 progressors (P=0.04) and 1 of 48 nonprogressors (P=0.3) were correctly reclassified with an overall statistically significant net reclassification improvement of 0.11 (P=0.02).
There were 47 deaths during follow‐up (39 above and 8 below 60 years of age). Baseline Ao‐PWV was not significantly different between patients who survived compared with those who died (12.0±2.5 versus 11.7±2.7 m/s, P=0.47).
In patients older than 60 years, there were 22 deaths in the progressor group and 17 deaths in the nonprogressor group. The 8 deaths in patients younger than 60 were distributed equally between progressors and nonprogressors and when entered in analyses did not alter the significant independent effect of Ao‐PWV on predicting renal disease progression.
Discussion
In this prospective study of T2DM patients with relatively preserved renal function (eGFR >45 mL/min) we have demonstrated that Ao‐PWV is an independent predictor of significant progression of renal function decline in younger patients aged below 60 years. Moreover, this effect of Ao‐PWV on eGFR decline was independent of BP variables such as mean arterial pressure, pulse pressure, systolic BP, and number of antihypertensive agents.
Recent studies in patients with T2DM suggest that the average annual decline of renal function is <1 mL/min.13, 14 In our study, patients with progression had an annual mean eGFR decline of 3.5 mL/min per year. Our results indicate that an increase in Ao‐PWV of 1 m/s increased the risk of faster progression of renal function decline by a moderate 9% in younger T2DM patients independent of other established risk factors. In a repeated measures mixed model, we also demonstrated that a 1‐m/s increase in Ao‐PWV is a significant predictor of a mean fall in eGFR of 2.1 (95% CI, 0.09–4.1) mL/min per year independent of established risk factors only in younger patients. The results of net reclassification improvement analyses demonstrate that including Ao‐PWV in the model correctly reclassified a further ≈9% of the “young” progressors compared with a model without Ao‐PWV.
In contrast, in older patients, Ao‐PWV did not predict faster progression of eGFR decline. Age, which is significantly associated with Ao‐PWV and the natural rate of eGFR decline, may have confounded the relationship between Ao‐PWV and progression of renal disease.
We can speculate that in older patients with long‐duration diabetes mellitus, Ao‐PWV may not add any predictive value as aging per se strongly influences the determinants of arterial stiffness (Ao‐PWV was significantly higher in older patients compared with younger patients). This group of patients may also have other factors driving renal disease progression such as hypertensive and aging related renal disease.4, 23 Younger T2DM patients had a faster rate of fall in eGFR and this may have contributed to Ao‐PWV being a more sensitive predictor of progression. T2DM patients of young age have accelerated progression of renal dysfunction, often in the setting of a proinflammatory milieu, insulin resistance, and obesity, which are also known factors associated with increased Ao‐PWV.24, 25, 26
Several studies have explored and reported discrepant results on the predictive role of Ao‐PWV and eGFR decline, which may be due to the differing populations and disease states evaluated.
Tomiyama et al reported that baseline brachial ankle pulse wave velocity was related to a higher annual rate of decline in eGFR in a cohort of 2053 (all younger than 47 years and <1% with T2DM) Japanese employees with eGFR >60 mL/min.27 In a prospective study of 133 patients with CKD stages 3 and 4 (only 6% had diabetes mellitus) followed for a mean of 1.5 years, Ao‐PWV was independently associated with the rate of decline of renal function.3 Bouchi et al28 studied 461 T2DM Japanese patients aged between 20 and 80 years, who were admitted to the hospital for diabetes mellitus care, with eGFR >15 mL/min, followed for a median duration of 5.9 years. The authors reported a significant association of Ao‐PWV with the annual rate of eGFR decline in patients older than 60 years and progression from normoalbuminuria to microalbuminuria and microalbuminuria to macroalbuminuria. However, only 30% of patients were on renin‐angiotensin‐aldosterone system blockade at baseline (this increased to 55% at the end of the study), the prevalence of diabetic retinopathy was low (20.4%), and nondiabetic causes of renal disease were not excluded, all of which could have influenced the results.28 A recent general population study of older patients (mean age, 75 years and <10% with T2DM) followed for 5 years, Ao‐PWV predicted eGFR decline but not albuminuria.29
In contrast, a study in 2129 patients (mean age, 74 years and 14% with T2DM) demonstrated that rate of GFR fall was not predicted by Ao‐PWV.30 Similarly a general population study of predominantly older patients (mean age, >60 years) with mild to moderate CKD at baseline did not show an association between baseline Ao‐PWV measures and incident CKD over 7 to 10 years.31 In a 4‐year prospective study of 27 newly diagnosed treatment‐naive T2DM patients (mean age, 60 years) and 47 patients with essential hypertension not on treatment, Ao‐PWV did not predict eGFR decline (defined as fall >1 mL/min per year) in T2DM patients but did in patients with hypertension only.
We studied a T2DM clinic cohort of predominantly Caucasian origin with less advanced kidney disease and longer duration of diabetes mellitus who were followed for a longer duration than those in many of the studies reported above. We also excluded patients with nondiabetic renal disease.
Study Strengths
The strengths of our study are the long follow‐up, the high ascertainment rate (100%), and the standardized clinical care and measurements at a single center for the duration of the follow‐up. The median duration of follow‐up was 9 years, with a range from 3 to 11 years, and there were no differences in follow‐up time between patients with and without progression of renal dysfunction. Our data from an outpatient clinical cohort also reflects the heterogonous and changing nature of the natural progression of renal dysfunction in patients with T2DM where a significant proportion of patients do not display clinically meaningful reduction in renal function.13, 14, 32
We did not observe a statistically significant independent predictive effect of albuminuria as a continuous or categorical risk marker for predicting progression of renal function decline. A significant proportion of our cohort had normal or modestly raised urinary albumin excretion at baseline, and there was a relatively high background use of renin‐angiotensin‐aldosterone system inhibitors, which may explain the above finding.
Study Limitations
There are several limitations to our study. The creatinine‐based eGFR equations may not be reliable and accurate for GFR values >60 mL/min; however, the Chronic Kidney Disease Epidemiology Collaboration equation that we used is what is currently widely recommended in clinical practice. More importantly, we measured sequential change in eGFR over a long period of follow‐up, which is more accurate in the context of predicting risk of renal function decline.32, 33 We also did not take direct measurements of the mechanical properties of the vessel wall. This would require an invasive technique not applicable in such a clinical study. Our study included a significant percentage of patients of Afro‐Caribbean origin, which reflects our local population. Ethnicity may affect Ao‐PWV and renal disease progression.4, 25 However, we did not observe a significant effect of ethnicity on progression of renal dysfunction. Finally, the number of patients we studied is relatively small and our results need to be confirmed in larger cohorts. Our previous work and that of others indicate that reduction in Ao‐PWV may be achievable with specific drug treatments.34 Although no clinical trial to date has demonstrated that differential lowering of Ao‐PWV results in improved renal outcomes, our work establishes a platform to address this important question in future clinical studies. The importance of the need for such studies is underscored by the epidemiological evidence that Ao‐PWV per se is an independent risk factor for progression of renal disease.2, 4
T2DM patients with a faster rate of progression will develop the advanced stages of renal dysfunction and “hard” renal end points and cardiovascular outcomes faster.24, 35 Moreover, there is evidence that interventions that slow the rate of decline of renal function in early phases of CKD may be associated with longer‐term cardiorenal protection.23, 35 We demonstrate that relatively early in the course of their renal dysfunction, Ao‐PWV may identify those at higher risk of progression. Further confirmatory studies are required to establish whether Ao‐PWV can help risk stratify and identify patients at high risk for progression to advanced renal disease.
Perspectives
Ao‐PWV in our opinion represents the integrated effect over time of various factors on the arterial wall and provides a “long‐term” index of vascular aging analogous to a “long‐term HbA1c.” Intensive glycemic control implemented early in “relatively younger” patients with a shorter duration of diabetes mellitus results in a glycemic legacy effect of reducing diabetic complications including renal disease progression.36, 37 Our data suggest that in “younger patients” (<60 years) with T2DM, there is a potential window of opportunity to intervene and influence arterial aging that may delay progression of renal dysfunction. This may not be the case in older patients with a longer duration of disease and more advanced renal disease where a J‐shaped curve for pulse pressure reduction and clinical outcomes is often observed.38 Younger T2DM patients have faster progression of cardiorenal disease often driven by obesity‐associated increased insulin resistance.24, 26, 39, 40, 41 In our study, younger patients with T2DM had shorter duration of diabetes mellitus and greater body mass index, which, in part, may explain the above differences.26, 39, 40, 41 However, this hypothesis needs to be evaluated and confirmed in further larger studies.
Conclusions
The results of our study demonstrate that an increased Ao‐PWV predicts progression of renal dysfunction independent of traditional markers of renal risk in younger T2DM patients below the age of 60 years. Our study establishes the rationale and platform to evaluate in further studies whether Ao‐PWV is a potential target for renoprotection in T2DM.
Disclosures
None.
(J Am Heart Assoc. 2017;6:e004934 DOI: 10.1161/JAHA.116.004934.)28360227
This work was partly presented at the 51st annual meeting of the European Association for the Study of Diabetes, September 14–18, 2015, in Stockholm, Sweden.
References
- 1. Vlachopoulos C, Aznaouridis K, Stefanadis C. Prediction of cardiovascular events and all‐cause mortality with arterial stiffness: a systematic review and meta‐analysis. J Am Coll Cardiol. 2010;55:1318–1327. [DOI] [PubMed] [Google Scholar]
- 2. Briet M, Boutouyrie P, Laurent S, London GM. Arterial stiffness and pulse pressure in CKD and ESRD. Kidney Int. 2012;82:388–400. [DOI] [PubMed] [Google Scholar]
- 3. Ford ML, Tomlinson LA, Chapman TP, Rajkumar C, Holt SG. Aortic stiffness is independently associated with rate of renal function decline in chronic kidney disease stages 3 and 4. Hypertension. 2010;55:1110–1115. [DOI] [PubMed] [Google Scholar]
- 4. Van Bortel LM, Laurent S, Boutouyrie P, Chowienczyk P, Cruickshank JK, De Backer T, Filipovsky J, Huybrechts S, Mattace‐Raso FU, Protogerou AD, Schillaci G, Segers P, Vermeersch S, Weber T; Artery Society, European Society of Hypertension Working Group on Vascular Structure and Function; European Network for Noninvasive Investigation of Large Arteries . Expert consensus document on the measurement of aortic stiffness in daily practice using carotid‐femoral pulse wave velocity. J Hypertens. 2012;30:445–448. [DOI] [PubMed] [Google Scholar]
- 5. O'Rourke MF, Safar ME. Relationship between aortic stiffening and microvascular disease in brain and kidney: cause and logic of therapy. Hypertension. 2005;46:200–204. [DOI] [PubMed] [Google Scholar]
- 6. Scuteri A, Nilsson PM, Tzourio C, Redon J, Laurent S. Microvascular brain damage with aging and hypertension: pathophysiological consideration and clinical implications. J Hypertens. 2011;29:1469–1477. [DOI] [PubMed] [Google Scholar]
- 7. Smith A, Karalliedde J, De Angelis L, Goldsmith D, Viberti G. Aortic pulse wave velocity and albuminuria in patients with type 2 diabetes. J Am Soc Nephrol. 2005;16:1069–1075. [DOI] [PubMed] [Google Scholar]
- 8. Expert Committee on the Diagnosis and Classification of Diabetes Mellitus . Report of the expert committee on the diagnosis and classification of diabetes mellitus. Diabetes Care. 2003;26(suppl 1):S5–S20. [DOI] [PubMed] [Google Scholar]
- 9. Karalliedde J, Smith A, DeAngelis L, Mirenda V, Kandra A, Botha J, Ferber P, Viberti G. Valsartan improves arterial stiffness in type 2 diabetes independently of blood pressure lowering. Hypertension. 2008;51:1617–1623. [DOI] [PubMed] [Google Scholar]
- 10. Levey AS, Stevens LA, Schmid CH, Zhang YL, Castro AF III, Feldman HI, Kusek JW, Eggers P, Van Lente F, Greene T, Coresh J. A new equation to estimate glomerular filtration rate. Ann Intern Med. 2009;150:604–612. [DOI] [PMC free article] [PubMed] [Google Scholar]
- 11. Glassock RJ, Winearls C. Ageing and the glomerular filtration rate: truths and consequences. Trans Am Clin Climatol Assoc. 2009;120:419–428. [PMC free article] [PubMed] [Google Scholar]
- 12. Davies DF, Shock NW. Age changes in glomerular filtration rate, effective renal plasma flow, and tubular excretory capacity in adult males. J Clin Invest. 1950;29:496–507. [DOI] [PMC free article] [PubMed] [Google Scholar]
- 13. Zoppini G, Targher G, Chonchol M, Ortalda V, Negri C, Stoico V, Bonora E. Predictors of estimated GFR decline in patients with type 2 diabetes and preserved kidney function. Clin J Am Soc Nephrol. 2012;7:401–408. [DOI] [PubMed] [Google Scholar]
- 14. Dreyer G, Hull S, Mathur R, Chesser A, Yaqoob MM. Progression of chronic kidney disease in a multi‐ethnic community cohort of patients with diabetes mellitus. Diabet Med. 2013;30:956–963. [DOI] [PubMed] [Google Scholar]
- 15. Chen SC, Chang JM, Liu WC, Tsai YC, Tsai JC, Hsu PC, Lin TH, Lin MY, Su HM, Hwang SJ, Chen HC. Brachial‐ankle pulse wave velocity and rate of renal function decline and mortality in chronic kidney disease. Clin J Am Soc Nephrol. 2011;6:724–732. [DOI] [PMC free article] [PubMed] [Google Scholar]
- 16. Preston DL. Poisson regression in epidemiology In: Armitage P, Colton T, eds. Encyclopedia of Biostatistics. 2nd ed Vol. 6. Chichester: John Wiley & Sons; 2005:4124–4127. [Google Scholar]
- 17. Spiegelman D, Hertzmark E. Easy SAS calculations for risk or prevalence ratios and differences. Am J Epidemiol. 2005;162:199–200. [DOI] [PubMed] [Google Scholar]
- 18. Jaffa MA, Gebregziabher M, Jaffa AA. Analysis of multivariate longitudinal kidney function outcomes using generalized linear mixed models. J Transl Med. 2015;13:192. [DOI] [PMC free article] [PubMed] [Google Scholar]
- 19. Alves TP, Hulgan T, Wu P, Sterling TR, Stinnette SE, Rebeiro PF, Vincz AJ, Bruce M, Ikizler TA. Race, kidney disease progression, and mortality risk in HIV‐infected persons. Clin J Am Soc Nephrol. 2010;5:2269–2275. [DOI] [PMC free article] [PubMed] [Google Scholar]
- 20. Cianciaruso B, Pota A, Bellizzi V, Di Giuseppe D, Di Micco L, Minutolo R, Pisani A, Sabbatini M, Ravani P. Effect of a low‐ versus moderate‐protein diet on progression of CKD: follow‐up of a randomized controlled trial. Am J Kidney Dis. 2009;54:1052–1061. [DOI] [PubMed] [Google Scholar]
- 21. Pencina MJ, D'Agostino RB Sr, D'Agostino RB Jr, Vasan RS. Evaluating the added predictive ability of a new marker: from area under the ROC curve to reclassification and beyond. Stat Med. 2008;27:157–172. [DOI] [PubMed] [Google Scholar]
- 22. Pickering JW, Endre ZH. New metrics for assessing diagnostic potential of candidate biomarkers. Clin J Am Soc Nephrol. 2012;7:1355–1364. [DOI] [PubMed] [Google Scholar]
- 23. Karalliedde J, Viberti GC. Diabetic nephropathy In: Davies M, Amiel SA, eds. Oxford Textbook of Diabetes and Endocrinology. 2nd ed Oxford, UK: Oxford University Press; 2011:1935–1946. 13.5.2. [Google Scholar]
- 24. Pavkov ME, Bennett PH, Knowler WC, Krakoff J, Sievers ML, Nelson RG. Effect of youth‐onset type 2 diabetes mellitus on incidence of end‐stage renal disease and mortality in young and middle‐aged Pima Indians. JAMA. 2006;296:421–426. [DOI] [PubMed] [Google Scholar]
- 25. Thomas MC, Cooper ME, Zimmet P. Changing epidemiology of type 2 diabetes mellitus and associated chronic kidney disease. Nat Rev Nephrol. 2015;12:73–81. [DOI] [PubMed] [Google Scholar]
- 26. Al‐Saeed AH, Constantino MI, Molyneaux L, D'Souza M, Limacher‐Gisler F, Luo C, Wu T, Twigg SM, Yue DK, Wong J. An inverse relationship between age of type 2 diabetes onset and complication risk and mortality: the impact of youth‐onset type 2 diabetes. Diabetes Care. 2016;39:823–829. [DOI] [PubMed] [Google Scholar]
- 27. Tomiyama H, Tanaka H, Hashimoto H, Matsumoto C, Odaira M, Yamada J, Yoshida M, Shiina K, Nagata M, Yamashina A. Arterial stiffness and declines in individuals with normal renal function/early chronic kidney disease. Atherosclerosis. 2010;212:345–350. [DOI] [PubMed] [Google Scholar]
- 28. Bouchi R, Babazono T, Mugishima M, Yoshida N, Nyumura I, Toya K, Hanai K, Tanaka N, Ishii A, Uchigata Y, Iwamoto Y. Arterial stiffness is associated with incident albuminuria and decreased glomerular filtration rate in type 2 diabetic patients. Diabetes Care. 2011;34:2570–2575. [DOI] [PMC free article] [PubMed] [Google Scholar]
- 29. Huang N, Foster MC, Mitchell GF, Andresdottir MB, Eiriksdottir G, Gudmundsdottir H, Harris TB, Launer LJ, Palsson R, Gudnason V, Levey AS, Inker LA. Aortic stiffness and change in glomerular filtration rate and albuminuria in older people. Nephrol Dial Transplant. 2016. Available at: https://academic.oup.com/ndt/article-abstract/doi/10.1093/ndt/gfw050/3059411/Aortic-stiffness-and-change-in-glomerular?redirectedFrom=PDF. Accessed March 3, 2017. [DOI] [PMC free article] [PubMed] [Google Scholar]
- 30. Madero M, Peralta C, Katz R, Canada R, Fried L, Najjar S, Shlipak M, Simonsick E, Lakatta E, Patel K, Rifkin D, Hawkins M, Newman A, Sarnak M; Health ABC Study . Association of arterial rigidity with incident kidney disease and kidney function decline: the Health ABC study. Clin J Am Soc Nephrol. 2013;8 424–433. [DOI] [PMC free article] [PubMed] [Google Scholar]
- 31. Upadhyay A, Hwang SJ, Mitchell GF, Vasan RS, Vita JA, Stantchev PI, Meigs JB, Larson MG, Levy D, Benjamin EJ, Fox CS. Arterial stiffness in mild‐to‐moderate CKD. J Am Soc Nephrol. 2009;20:2044–2053. [DOI] [PMC free article] [PubMed] [Google Scholar]
- 32. Altemtam N, Russell J, El Nahas M. A study of the natural history of diabetic kidney disease (DKD). Nephrol Dial Transplant. 2012;27:1847–1854. [DOI] [PubMed] [Google Scholar]
- 33. Matsushita K, Tonelli M, Lloyd A, Levey AS, Coresh J, Hemmelgarn BR. Clinical risk implications of the CKD Epidemiology Collaboration (CKD‐EPI) equation compared with the Modification of Diet in Renal Disease (MDRD) study equation for estimated GFR. Am J Kidney Dis. 2012;60:241–249. [DOI] [PubMed] [Google Scholar]
- 34. Kum F, Karalliedde J. Critical appraisal of the differential effects of antihypertensive agents on arterial stiffness. Integr Blood Press Control. 2010;3:63–71. [DOI] [PMC free article] [PubMed] [Google Scholar]
- 35. Andresdottir G, Jensen ML, Carstensen B, Parving HH, Rossing K, Hansen TW, Rossing P. Improved survival and renal prognosis of patients with type 2 diabetes and nephropathy with improved control of risk factors. Diabetes Care. 2014;37:1660–1667. [DOI] [PubMed] [Google Scholar]
- 36. Bilous R. Microvascular disease: what does the UKPDS tell us about diabetic nephropathy? Diabet Med. 2008;25(suppl 2):25–29. [DOI] [PubMed] [Google Scholar]
- 37. Schernthaner G. Diabetes and cardiovascular disease: is intensive glucose control beneficial or deadly? Lessons from ACCORD, ADVANCE, VADT, UKPDS, PROactive, and NICE‐SUGAR. Wien Med Wochenschr. 2010;160:8–19. [DOI] [PubMed] [Google Scholar]
- 38. Agarwal R. Blood pressure components and the risk for end‐stage renal disease and death in chronic kidney disease. Clin J Am Soc Nephrol. 2009;4:830–837. [DOI] [PMC free article] [PubMed] [Google Scholar]
- 39. Dart AB, Sellers EA, Martens PJ, Rigatto C, Brownell MD, Dean HJ. High burden of kidney disease in youth‐onset type 2 diabetes. Diabetes Care. 2012;35:1265–1271. [DOI] [PMC free article] [PubMed] [Google Scholar]
- 40. Wilmot E, Idris I. Early onset type 2 diabetes: risk factors, clinical impact and management. Ther Adv Chronic Dis. 2014;5:234–244. [DOI] [PMC free article] [PubMed] [Google Scholar]
- 41. Afghahi H, Cederholm J, Eliasson B, Zethelius B, Gudbjornsdottir S, Hadimeri H, Svensson MK. Risk factors for the development of albuminuria and renal impairment in type 2 diabetes–the Swedish National Diabetes Register (NDR). Nephrol Dial Transplant. 2011;26:1236–1243. [DOI] [PubMed] [Google Scholar]