Abstract
Background
Conflicting findings of the association between serum uric acid (UA) and stroke have been reported in both men and women, and it is unclear whether this association was different between men and women. We preformed this meta‐analysis to assess the sex‐specific effect of serum UA on the risk of stroke and its subtypes.
Methods and Results
Prospective studies that reported sex‐specific association of UA levels with stroke or reported in a certain sex were included. Dose‐response relationships were assessed by the generalized least squares trend estimation, and summary effect estimates were evaluated with random‐effect models. Subgroup and sensitivity analyses were performed to assess the potential sources of heterogeneity and the robustness of the pooled estimation. Altogether, 13 prospective studies were identified in this study. The summary of relative risks (95% CIs) of stroke for a 1‐mg/dL increase in serum UA levels were 1.10 (1.05–1.14) for men and 1.11 (1.09–1.13) for women. There is no significant difference in the effect of UA on future stroke risk between men and women (P interaction=0.736). Subgroup analyses showed that the significant associations persisted in most stratifications, and sensitivity analyses according to various inclusion criteria yielded similar results. A nonlinear relationship was observed in men (P non‐linearity<0.001), with risk increasing significantly from a UA of 6 mg/dL and more steeply at higher UA levels.
Conclusions
Elevated serum UA levels were significantly associated with modestly increased risk of stroke in both men and women and have similar adverse effects on development of stroke in both sexes.
Keywords: meta‐analysis, prospective studies, sex difference, stroke, uric acid
Subject Categories: Cerebrovascular Disease/Stroke, Ischemic Stroke, Risk Factors
Introduction
Stroke is the leading cause of death and long‐term disability worldwide.1 Because of longer life expectancy of women and substantially increased rates of stroke events in the oldest age groups, stroke affects a greater number of women than men.2 Moreover, accumulating evidence suggested sex differences in the effect of cardiovascular risk factors on stroke.2, 3
Uric acid (UA), a product of purine metabolism in humans, is known to be associated with many systemic risk factors of stroke, such as hypertension, obesity, diabetes mellitus, and insulin resistance.4, 5, 6 On the other hand, UA is a potent endogenous antioxidant that effectively scavenges reactive nitrogen and oxygen radicals.7, 8 During the past decades, epidemiological studies investigating the association between serum UA levels and risk of stroke have yielded inconsistent findings.9, 10, 11, 12, 13, 14, 15, 16, 17, 18, 19, 20, 21 Some studies,9, 17, 18 but not all,10, 20 demonstrated significant and positive correlations. Two previous meta‐analyses indicated that hyperuricemia could modestly increase the risks of both stroke incidence and mortality;22, 23 several prospective studies with conflicting results have been published since then.9, 10, 20 Moreover, the exact shapes of the dose‐response relationships of serum UA with risk of stroke and its subtypes are unknown, and it is not clear whether there are any threshold effects between serum UA and stroke in men and women.
It is well known that UA levels are different in men and women, and sex difference in the associations between serum UA and risk of vascular diseases, including stroke, had been reported previously.16, 19, 24 For example, an analysis from the Rotterdam Study found that serum UA was a risk factor for stroke only in women,19 and the Apolipoprotein MOrtality RISk (AMORIS) Study suggested that UA was more strongly related to stroke in women than in men.10 However, to date, no studies have systematically assessed whether a sex difference exists with respect to the effect of serum UA on the development of stroke.
Clarifying this potential sex‐specific association has important clinical and public health implications to choose effective treatments for prevention of stroke. We conducted this dose‐response meta‐analysis of prospective studies to determine whether sex modifies the association between serum UA levels and risk of stroke and clarify the shape of the relationship between serum UA and stroke.
Methods
Literature Search and Study Selection
This meta‐analysis was performed and reported in accord with the Preferred Reporting Items for Systematic Reviews and Meta‐Analyses (PRISMA) Statement, 2009.25 We conducted a systematic literature search by using the electronic databases, PubMed (from 1965 to September 2016), Embase (from 1965 to September 2016), and Web of Science (from 1986 to September 2016). The following search terms were used: “stroke”, “cerebrovascular disease”, “intracranial hemorrhage”, “cerebrovascular disorder”, “cerebral hemorrhage”, “brain infarction” in combined with “UA”, “uric acid”, “urate”, “hyperuricemia”, and “hyperuric” (Table S1). No language restrictions were imposed. We also conducted manual searches of the reference lists of relevant articles to identify additional eligible studies.
Studies were considered eligible if they met the following inclusion criteria: (1) reported sex‐specific association of UA levels with stroke or reported in a certain sex; (2) the study design was a prospective study (prospective cohort or prospective nested case‐control study); (3) the study outcomes were fatal or nonfatal total stroke, ischemic stroke, or hemorrhagic stroke; (4) enrolled participants were free of stroke at baseline; and (5) risk estimates (risk ratio [RR], hazard ratio [HR], or odds ratio [OR]) and corresponding 95% CIs of the association between UA and stroke were reported.
Data Collection and Quality Assessment
Data were collected using a standard electronic form. The following data elements were extracted from each included study: first author's last name, publication year, location, study design, follow‐up duration, sample size, age at baseline, percentage of male, number of events, exposure and outcome assessment, and covariates in the adjusted model. In addition, we extracted the number of cases/noncases or person‐years, effects of the different exposure categories, and the 95% CIs. For the studies that reported several multivariable‐adjusted RRs, we selected the effect estimate that was maximally adjusted for potential confounders. The Newcastle‐Ottawa Scale (NOS) was used to evaluate methodological quality.26 The NOS is a comprehensive tool that has been partially validated for evaluating the quality of observational studies in meta‐analyses, and a higher score represents better methodological quality. Literature search, data extraction, and quality assessment were independently performed by C.K.Z. and X.Y.Z. and independently checked for accuracy by Y.H.Z.
Statistical Analysis
We examined the relationships between serum UA levels and risk of stroke based on the adjusted RRs and 95% CIs published in each study. The ORs and HRs were considered equivalent to RRs. The method described by Greenland and Longnecker was used for the dose‐response analysis and study‐specific slopes (linear trends) and 95% CIs were computed from the natural logs of the RRs and CIs across categories of serum UA levels.27, 28 Possible nonlinear relationships between serum UA levels and stroke risk in men and women were examined by using restricted cubic splines with 3 knots at fixed percentiles (10%, 50%, and 90%) of the distribution.29 This method was used under the premise of knowing the distributions of cases, controls or person‐years, effect estimates with the variance estimates in each category, and at least 3 quantitative exposure categories. We estimated the distribution of cases or person years in studies that did not report these, but reported the total number of cases or person years, if the results were analyzed by quantiles (and could be approximated).30 We assigned the dose of UA levels from every study to these categories based on the calculated midpoint of UA levels if the median or mean level per category was not reported. If the highest or lowest category was open ended, we assumed the width of the interval to be the same as in the closest category. A heterogeneity test was performed by use of Q and I2 statistics. For the Q statistic, P<0.1 was considered a statistically significant heterogeneity.31 Forest plots were produced to visually assess RR estimates and corresponding 95% CIs across studies for individual studies and all combined.
To explore potential sources of heterogeneity, subgroup analyses based on adjusted RRs were conducted according to study endpoint, geographical area, sample size, length of follow‐up, adjusted body mass index, adjusted smoking status, adjusted hypertension, adjusted diabetes mellitus, adjusted hyperlipidemia, and adjusted renal factors. To test the robustness of the associations between serum UA levels and risk of stroke, sensitivity analyses were performed according to various inclusion criteria. Additional sensitivity analyses were performed by removing each individual study from the meta‐analysis. Furthermore, because the Gerber et al study12 found a protective effect of uric acid and was entirely composed of men, another sensitivity analysis was performed by removing this study from the cubic spline analysis. Several methods were used to check for potential publication bias, including visual inspection of funnel plots, Begg rank correlation test, and Egger linear regression test.32, 33 All reported P values were 2‐sided, and P<0.05 was considered statistically significant. Statistical analyses were performed using STATA software (version 12.0; StataCorp LP, College Station, TX).
Results
Characteristics of Studies
Overall, a total 3256 articles were identified from the initial database search. The results of the study selection process are shown in Figure 1. After the first screening based on titles and abstracts, we excluded 3184 records and retained 72 studies for further evaluation by reading the full text. After detail evaluations, 13 prospective studies were finally included in this meta‐analysis. A manual search of the reference lists of these studies did not yield any new eligible studies.
Figure 1.
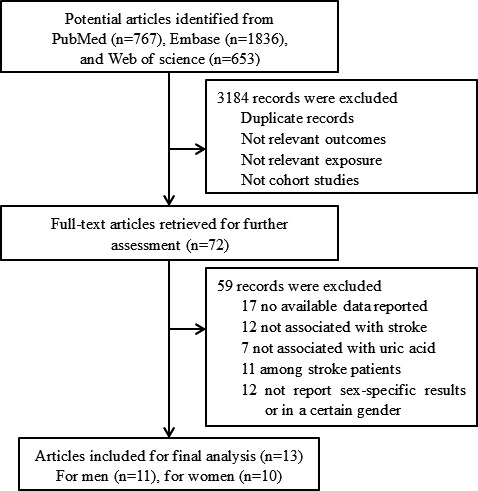
Flow chart of study selection.
The characteristics of the selected studies are presented in Table 1, 9, 10, 11, 12, 13, 14, 15, 16, 17, 18, 19, 20, 21 and Table S2. All studies were published between 2001 and 2016. Follow‐up durations ranged from 2 to 23 years. Six studies were conducted in Asia,9, 10, 11, 12, 13, 14 5 in Europe,15, 16, 17, 18, 19 and 2 in the United States.20, 21 Of the included studies, 12 were prospective cohorts, whereas only 1 was a prospective, nested case‐control study.20 Study quality was assessed by using the NOS (Table S3). Overall, 3 studies had a score of 9, 2 had a score of 8, 5 had a score of 7, and the remaining 3 had a score of 6.
Table 1.
Characteristics of Prospective Studies Included in this Meta‐Analysis
| Author, y | Location | Study Design | Follow‐up, y | Sample Size | Age at Baseline, y | Male (%) | Events | Outcome Assessment | Study Quality |
|---|---|---|---|---|---|---|---|---|---|
| Kamei et al, 20169 | Japan | Prospective cohort | 2 | 155 322 | 40 to 73 | 39 | Nonfatal stroke: 1089 (M), 992 (W) | Self‐reporting questionnaire | 6 |
| Jimenez et al, 201620 | United States | Nested case‐control | 17 | 920 | 30 to 55 | 0 | Ischemic stroke: 460 (W) | Medical records | 7 |
| Zhang et al, 201610 | Japan | Prospective cohort | 10 | 36 313 | 35 to 89 | 43 | Fatal stroke: 301 (M), 293 (W) | ICD‐9 and ICD 10 | 8 |
| Storhaug et al, 201315 | Norway | Prospective cohort | 12.5 | 5700 | ≥25 | 42 | Ischemic stroke: 430 | Hospital or out‐hospital records | 7 |
| Holme et al, 200916 | Sweden | Prospective cohort | 11.8 | 417 734 | 30 to 85 | 53 | Stroke: 9324 (M), 6952 (W) | ICD‐7, ICD‐8, ICD‐9, ICD‐10 | 7 |
| Strasak et al, 200817 | Austria | Prospective cohort | 15.2 | 28 613 | Mean 62.3 | 0 | Fatal stroke: 776 (W) | ICD‐9 and ICD‐10 | 9 |
| Strasak et al, 200818 | Austria | Prospective cohort | 13.6 | 83 683 | Mean 41.6 | 100 | Fatal stroke: 645 (M) | ICD‐9 and ICD‐10 | 9 |
| Hozawa et al, 200621 | United States | Prospective cohort | 12.6 | 11 263 | 45 to 64 | 46 | Ischemic stroke: 149 (M), 118 (W) | ICD‐9 | 8 |
| Bos et al, 200619 | Netherlands | Prospective cohort | 8.4 | 4385 | ≥55 | 35.4 | All stroke: 132 (M), 249 (W) | Hospital records | 6 |
| Chien et al, 200511 | Taiwan | Prospective cohort | 11 | 3602 | >35 | 47 | Stroke: 155 | Preliminary diagnoses, death certificates | 7 |
| Gerber et al, 200612 | Israel | Prospective cohort | 23 | 9125 | ≥40 | 100 | Fatal stroke: 292 (M) | ICD‐9 | 6 |
| Jee et al, 200413 | Korea | Prospective cohort | 9 | 22 698 | 30 to 77 | 100 | Fatal stroke: 192 (M) | Death certificate | 7 |
| Sakata et al, 200114 | Japan | Prospective cohort | 14 | 8172 | ≥30 | 44 | Fatal stroke: 94 (M), 80 (W) | ICD‐9 | 9 |
ICD indicates International Classification of Diseases.
Main Analysis
A total of 11 prospective cohort studies with 428 287 participants and 12 494 stroke cases reported an association between UA levels and stroke among men. The summary RR for an increase in UA levels of 1 mg/dL was 1.10 (95% CI, 1.05–1.14), with moderate heterogeneity (P=0.043; I2=46.8%; Figure 2A). There was evidence of a nonlinear association between UA levels and stroke risk (P for nonlinearity, <0.001; Figure 2B; Table S4), with risk increasing significantly from a UA of 6 mg/dL and more steeply at higher UA levels.
Figure 2.
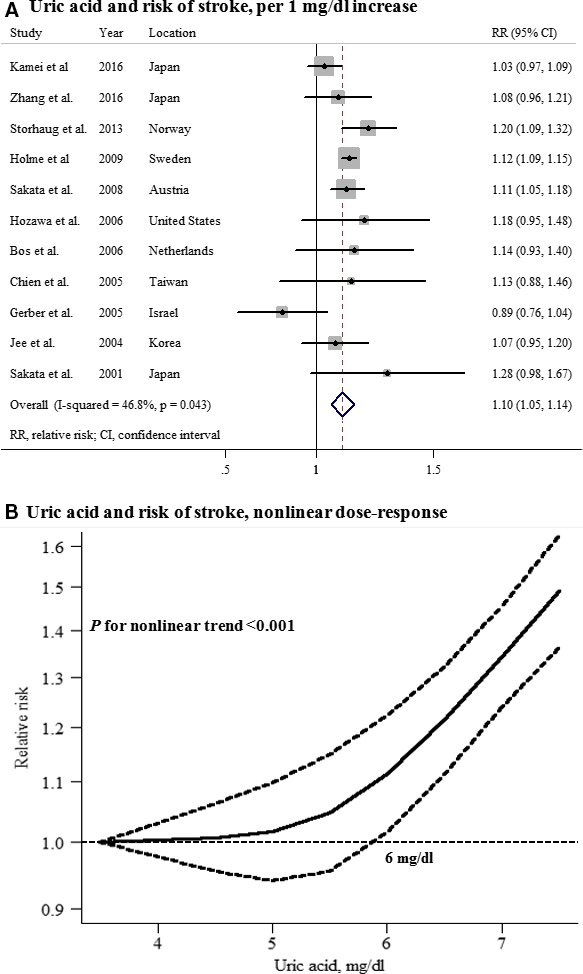
Uric acid and risk of stroke among men. A, Per 1‐mg/dL increase; (B) nonlinear dose response.
A total of 10 prospective studies with 359 243 participants and 10 229 stroke cases reported an association between UA levels and stroke in women. The summary RR for an increase in UA levels of 1 mg/dL was 1.11 (95% CI, 1.09–1.13), with no heterogeneity (P=0.606; I2=0.0%; Figure 3A). There was no evidence of a nonlinear association between UA levels and stroke risk (P for nonlinearity=0.51; Figure 3B; Table S4).
Figure 3.
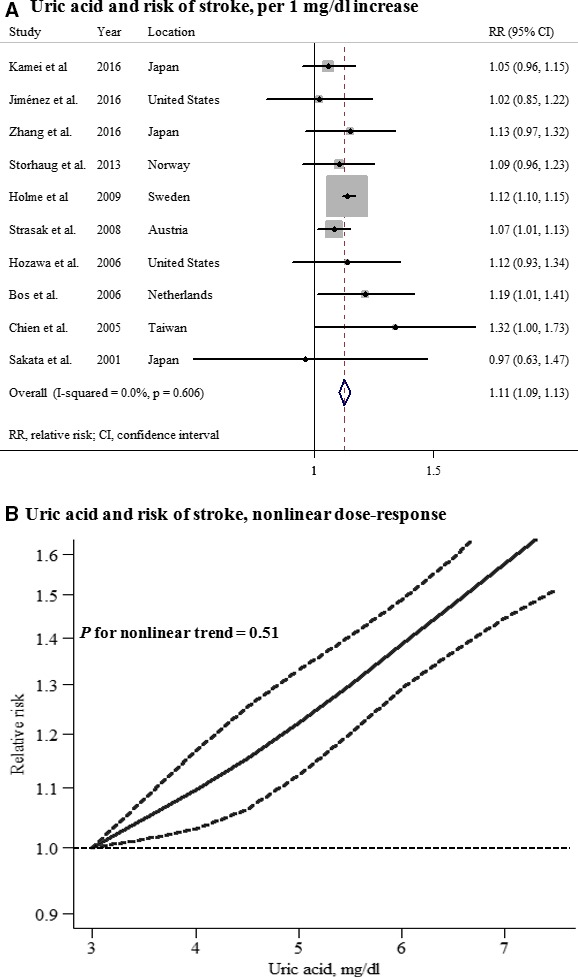
Uric acid and risk of stroke among women. A, Per 1‐mg/dL increase; (B) nonlinear dose response.
No significant difference in effect of UA on future stroke risk between men and women was observed (P for interaction=0.736). There was no evidence of publication bias (Begg, P=0.755 and Egger, P=0.759 for men; Begg, P=0.592 and Egger, P=0.696 for women; Figure S1).
Subgroup and Sensitivity Analyses
Subgroup and sensitivity analyses were performed to assess the potential sources of heterogeneity and robustness of the pooled estimation (Table 2). The summary RRs of stroke did not materially change when restricting to studies that were prospective cohort studies and studies that had a high quality (NOS score, ≥7). There was no evidence of heterogeneity between subgroups when stratified by study endpoint, sample size, length of follow‐up, and adjusted for confounding factors (all P for interaction, >0.05). However, only geographical area was found to modify the association between UA and stroke with a statistically significant positive association among Asian and European studies, but not among those of American (P for interaction=0.009). Also, the significantly positive associations between UA levels and stroke risk remained in subgroups that adjusted for potential confounding factors, including body mass index, smoking status, hypertension, diabetes mellitus, hyperlipidemia, and renal factors. Moreover, no significant difference between men and women was observed in all stratifications. Sensitivity analyses by removing each individual study did not materially affect the overall risk estimates, with a range from 1.08 (95% CI, 1.04–1.13) to 1.11 (95% CI, 1.07–1.15) among men and 1.08 (95% CI, 1.04–1.12) to 1.11 (95% CI, 1.09–1.14) among women. In addition, the moderate heterogeneity of the association in men was mainly attributed to 1 study,12 and the overall risk estimate tended to be homogeneous, but still significant after omitting this study (RR, 1.11; 95% CI, 1.07–1.14; P for heterogeneity=0.252; I2=20.8%). Further sensitivity analysis by removing the Gerber et al study from the cubic spline analysis showed that the nonlinear association between UA levels and stroke still existed in men (P for nonlinearity=0.003).
Table 2.
Subgroup and Sensitivity Analyses of the Associations Between UA Levels and Stroke in Men and Women
| Men | Women | P Valuec | |||||||||
|---|---|---|---|---|---|---|---|---|---|---|---|
| N | RR (95% CI) | P Valuea | I2 (%) | P Valueb | N | RR (95% CI) | P Valuea | I2 (%) | P Valueb | ||
| Sensitivity analyses | |||||||||||
| Prospective cohort studies | 11 | 1.10 (1.05–1.14) | 0.043 | 46.8 | 9 | 1.11 (1.09–1.13) | 0.598 | 0.0 | 0.686 | ||
| High‐quality studiesd | 8 | 1.12 (1.10–1.15) | 0.753 | 0.0 | 8 | 1.11 (1.09–1.14) | 0.644 | 0.0 | 0.608 | ||
| Subgroup analyses | |||||||||||
| Endpoint | |||||||||||
| Incidence | 6 | 1.11 (1.09–1.14) | 0.085 | 48.3 | 0.347 | 7 | 1.12 (1.09–1.14) | 0.550 | 0.0 | 0.194 | 0.762 |
| Mortality | 5 | 1.08 (1.04–1.13) | 0.083 | 51.5 | 3 | 1.08 (1.02–1.13) | 0.721 | 0.0 | 0.813 | ||
| Geographical area | |||||||||||
| Asia | 6 | 1.04 (1.00–1.09) | 0.201 | 31.3 | 0.009 | 4 | 1.08 (1.01–1.17) | 0.391 | 0.2 | 0.650 | 0.354 |
| Europe | 4 | 1.12 (1.10–1.15) | 0.561 | 0.0 | 4 | 1.11 (1.09–1.14) | 0.404 | 0.0 | 0.582 | ||
| American | 1 | 1.18 (0.95–1.47) | ··· | ··· | 2 | 1.07 (0.94–1.22) | 0.476 | 0.0 | 0.447 | ||
| Sample size | |||||||||||
| >10 000 | 5 | 1.10 (1.08–1.13) | 0.137 | 42.7 | 0.518 | 4 | 1.11 (1.09–1.13) | 0.287 | 20.5 | 0.942 | 0.648 |
| ≤10 000 | 6 | 1.13 (1.06–1.21) | 0.044 | 56.2 | 6 | 1.11 (1.03–1.20) | 0.620 | 0.0 | 0.792 | ||
| Follow‐up, y | |||||||||||
| >12 | 6 | 1.12 (1.07–1.17) | 0.042 | 56.5 | 0.601 | 5 | 1.07 (1.02–1.12) | 0.939 | 0.0 | 0.103 | 0.211 |
| ≤12 | 5 | 1.10 (1.08–1.13) | 0.134 | 43.1 | 5 | 1.12 (1.10–1.14) | 0.427 | 0.0 | 0.353 | ||
| Adjusted body mass index | |||||||||||
| Yes | 8 | 1.08 (1.05–1.12) | 0.024 | 56.7 | 0.151 | 8 | 1.08 (1.03–1.12) | 0.820 | 0.0 | 0.075 | 0.793 |
| No | 3 | 1.12 (1.09–1.15) | 0.743 | 0.0 | 2 | 1.12 (1.10–1.15) | 0.480 | 0.0 | 0.862 | ||
| Adjusted smoking status | |||||||||||
| Yes | 9 | 1.08 (1.05–1.12) | 0.040 | 50.6 | 0.108 | 8 | 1.08 (1.03–1.12) | 0.820 | 0.0 | 0.075 | 0.818 |
| No | 2 | 1.12 (1.09–1.15) | 0.866 | 0.0 | 2 | 1.12 (1.10–1.15) | 0.480 | 0.0 | 0.966 | ||
| Adjusted hypertension or blood pressure | |||||||||||
| Yes | 10 | 1.11 (1.08–1.13) | 0.028 | 51.9 | 0.764 | 9 | 1.11 (1.09–1.13) | 0.577 | 0.0 | 0.413 | 0.770 |
| No | 1 | 1.14 (0.93–1.40) | ··· | ··· | 1 | 1.19 (1.01–1.41) | ··· | ··· | 0.750 | ||
| Adjusted diabetes mellitus or blood glucose | |||||||||||
| Yes | 8 | 1.10 (1.08–1.13) | 0.029 | 55.1 | 0.253 | 7 | 1.11 (1.09–1.13) | 0.370 | 7.6 | 0.734 | 0.602 |
| No | 3 | 1.15 (1.07–1.23) | 0.389 | 0.0 | 3 | 1.13 (1.04–1.22) | 0.709 | 0.0 | 0.722 | ||
| Adjusted hyperlipidemia or lipids | |||||||||||
| Yes | 10 | 1.11 (1.08–1.13) | 0.028 | 51.9 | 0.764 | 9 | 1.11 (1.09–1.13) | 0.577 | 0.0 | 0.413 | 0.770 |
| No | 1 | 1.14 (0.93–1.40) | ··· | ··· | 1 | 1.19 (1.01–1.41) | ··· | ··· | 0.750 | ||
| Adjusted renal factors | |||||||||||
| Yes | 4 | 1.08 (1.03–1.14) | 0.025 | 67.9 | 0.390 | 5 | 1.06 (1.00–1.13) | 0.921 | 0.0 | 0.149 | 0.616 |
| No | 7 | 1.11 (1.09–1.14) | 0.189 | 31.3 | 5 | 1.12 (1.09–1.14) | 0.368 | 0.0 | 0.743 | ||
RR indicates relative risk; UA, uric acid.
P value for heterogeneity.
P value for effect modification by study characteristics.
P value for effect modification by sex.
Studies with a Newcastle‐Ottawa Scale (NOS) score ≥7 were considered to be high‐quality studies.
Serum UA Levels and Risk of Ischemic Stroke in Men and Women
Seven studies that reported the association between UA levels and ischemic stroke in men and 7 studies in women were included in this analysis. The summary RR for an increase in UA levels of 1 mg/dL was 1.13 (95% CI, 1.08–1.17) among men and 1.12 (95% CI, 1.06–1.18) among women, with no heterogeneity (Figures 4 and 5). A significant nonlinear association between UA levels and ischemic stroke risk was observed in men (P for nonlinearity=0.003), but not in women (P for nonlinearity=0.91). No significant difference in the effect of UA on future ischemic stroke risk between men and women was observed (P for interaction=0.502), and there was no evidence of publication bias (Figure S2).
Figure 4.
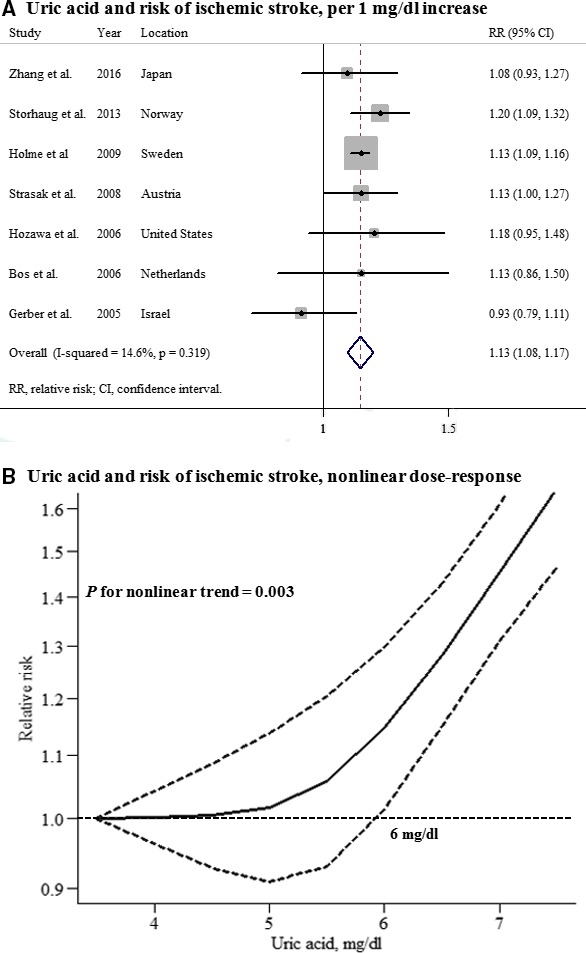
Uric acid and risk of ischemic stroke among men. A, Per 1‐mg/dL increase; (B) nonlinear dose response.
Figure 5.
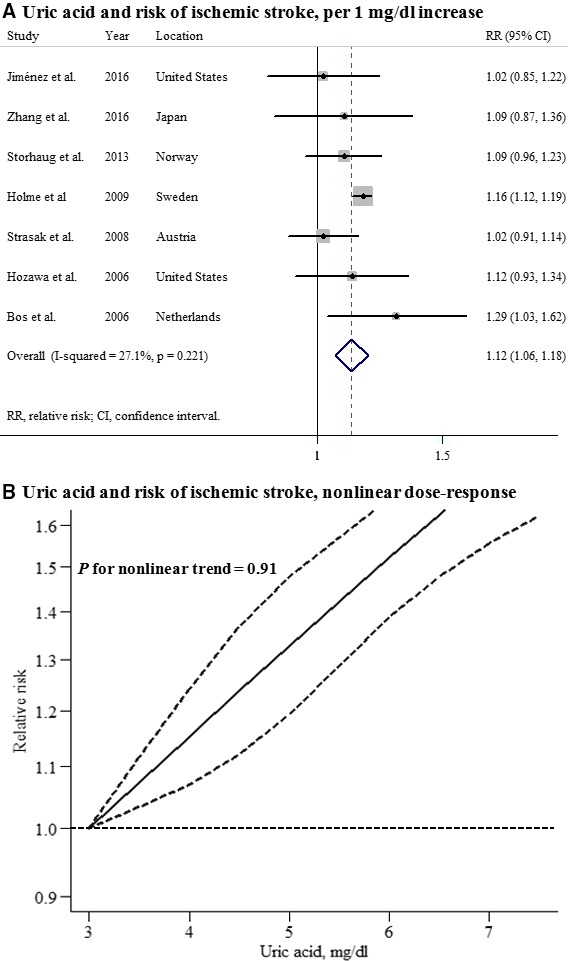
Uric acid and risk of ischemic stroke among women. A, Per 1‐mg/dL increase; (B) nonlinear dose response.
Serum UA Levels and Risk of Hemorrhagic Stroke in Men and Women
Five studies that reported the association between UA levels and hemorrhagic stroke in men and 4 studies in women were included in this analysis. The summary RR for an increase in UA levels of 1 mg/dL was 1.05 (95% CI, 0.97–1.14) among men and 1.07 (95% CI, 1.01–1.14) among women, with no heterogeneity (Figures 6 and 7). A significant nonlinear association between UA levels and hemorrhagic stroke risk was observed in men (P for nonlinearity<0.001), but not in women (P for nonlinearity=0.44). No significant difference in the effect of UA on future hemorrhagic stroke risk between men and women was observed (P for interaction=0.710), and there was no evidence of publication bias (Figure S3).
Figure 6.
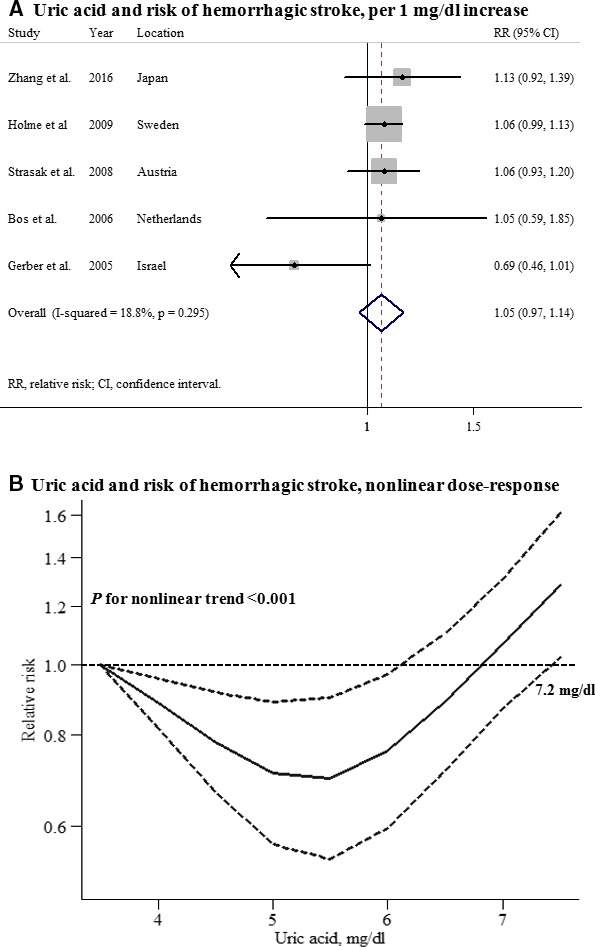
Uric acid and risk of hemorrhagic stroke among men. A, Per 1‐mg/dL increase; (B) nonlinear dose response.
Figure 7.
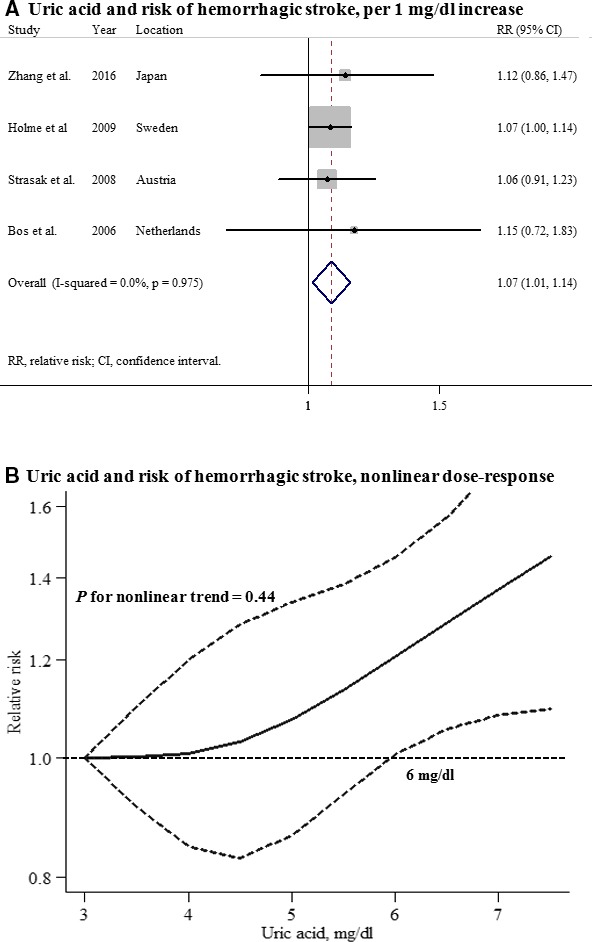
Uric acid and risk of hemorrhagic stroke among women. A, Per 1‐mg/dL increase; (B) nonlinear dose response.
Discussion
To our knowledge, this is the first systematic review about the potential sex‐specific effects of serum UA levels on the development of stroke. Based on data of 787 530 individuals and 22 723 incident stroke cases, we found broadly similar effects of UA increments on stroke between men and women. Each 1‐mg/dL increase in UA levels was significantly associated with a 10% increased risk of stroke in men and an 11% increased risk in women, respectively. These associations were robust in various sensitivity analyses and persisted in stratifications by multiple study characteristics, including adjustment for potential confounders, suggesting that elevated serum UA was probably an independent risk factor of stroke in both men and women.
During the past decades, conflicting findings of the association between serum UA and stroke have been reported in both men and women. A recent prospective study in the Japanese population showed no significant association between serum UA levels and stroke mortality in both men and women.10 Also, another recent nested case‐control study by Jimenez et al found that UA levels were associated with stroke risk factors, but not independently associated with stroke, among generally healthy women.20 Although Storhaug et al analyzed the data from The Tromsø Study and suggested a sex‐specific finding of the association between serum UA and ischemic stroke, they found that serum UA is an independent marker of ischemic stroke only in men.15 Judged on these studies, there are some obvious weak points, especially poor study design and small sample size, which may induce some bias and limit statistical power to detect an important association.
Meta‐analysis allows for the pooling and quantification of results from different studies to enhance statistical power and provide more‐precise and ‐reliable risk estimates. When this meta‐analysis of 13 prospective studies was preformed, we found that a 1‐mg/dL increase in UA levels was significantly associated with a 10% increased risk of stroke in men and an 11% increased risk in women. Our findings are in line with 2 previous meta‐analyses, which suggested that hyperuricemia could modestly increase the risk of stroke incidence and mortality.22, 23 More important, our study extended these studies. We first found a broadly similar effect of UA increments on stroke between men and women, and a nonlinear relationship was observed in men, with risk increasing significantly from a UA of 6 mg/dL and more steeply at higher UA levels. Although stroke is a sexually dimorphic disease, and a possible sex difference in the associations of serum UA with stroke‐related risk factors and development of cardiovascular diseases, elevated serum UA levels have similar adverse effects on development of stroke in both sexes.
The mechanisms underlying the association of UA with development of stroke are not completely understood. Several potential pathophysiological mechanisms have been proposed, including enhancing lipid peroxidation and platelet adhesiveness, stimulating vascular smooth cell proliferation, causing vascular inflammation, damaging endothelial cells, and accelerating atherosclerosis.34, 35, 36, 37, 38 A nonlinear relationship was observed in men, whereas a linear relationship was found in women. There are some plausible explanations for the different patterns. Previous studies had demonstrated that higher UA levels were more relevant with hypertension, diabetes mellitus, and metabolic syndrome in women than men, and risk factors like diabetes mellitus had been found to confer a greater risk for cardiovascular disease in women than in men.39, 40, 41 Because of the strong linear relationships of high blood pressure and glucose with stroke risk, it is reasonable to observe an obvious linear relation in women. In addition, different estrogen levels between men and women may also partially contribute to the different patterns. Further studies are needed to clarify the potential biological mechanisms for the sex different patterns and verify our findings.
Moderate heterogeneity across studies of the association of UA and stroke in men was observed. This is not surprising because of variations in characteristics of study populations, study designs, follow‐up length, and adjustment for confounding factors. Our additional sensitivity analyses suggested that the moderate heterogeneity was mainly attributed to 1 study.12 After removing this study, no significant heterogeneity was observed in the combined risk estimate of the remained studies. Furthermore, we did not find subgroup heterogeneity when stratified by sample size or any other study characteristics examined, except for geographical area, which significantly modified the association between UA and stroke in men. Positive associations were found in the Asian and European studies, but was not significant in the American study. However, it is not clear whether this is a chance finding, because there was only 1 American study in this subgroup analysis, or if it is attributed to genetic or other factors.
In this study, only prospective studies were included, which should eliminate selection and recall bias. The comprehensive subgroup and sensitivity analyses according to multiple study characteristics and various inclusion criteria supported generalizability of our findings. Furthermore, the dose‐response analysis included a wide range of UA levels, which allowed an accurate assessment of any nonlinear associations between serum UA levels and stroke risk. However, several potential limitations should be taken into consideration. First, like any observational studies, a causal relationship could not fully be established. Although these significant positive subgroups that adjusted for important confounders (body mass index, smoking status, hypertension, diabetes mellitus, hyperlipidemia, and renal factors), we still could not rule out the possibility that other unmeasured or inadequately measured factors could confound the true associations. Second, we observed moderate heterogeneity across studies of the association of UA and stroke in men. Nevertheless, the possible source of heterogeneity was detected through the sensitivity analyses. Finally, potential publication bias might influence the findings. Although there was no evidence of small study effects with the statistical tests in our analysis, it is still possible that a number of studies with null results remained unpublished, and this could lead to exaggerated risk estimates.
Conclusions
We found a broadly similar effect of UA increments on stroke in men and women. Men and women with higher serum UA levels had increased risk of stroke, especially ischemic stroke, and these increases were probably independent of several important confounders. Further randomized, controlled trials are warranted to better understand the associations of serum UA levels with future risk of stroke in both men and women.
Sources of Funding
This study was supported by the National Natural Science Foundation of China (Grant Nos.: 81172761 and 81320108026) and a Project of the Priority Academic Program Development of Jiangsu Higher Education Institutions, China.
Disclosures
None.
Supporting information
Table S1. Search Strategy
Table S2. Quality Scores of Prospective Studies Using Newcastle‐Ottawa Scale
Table S3. Relative Risks of Stroke Among Men and Women in the Included Prospective Studies
Table S4. Uric Acid Levels and Stroke in Men and Women, Nonlinear Dose Response
Figure S1. Funnel plots of uric acid and risk of stroke among men (A) and women (B).
Figure S2. Funnel plots of uric acid and risk of ischemic stroke among men (A) and women (B).
Figure S3. Funnel plots of uric acid and risk of hemorrhagic stroke among men (A) and women (B).
(J Am Heart Assoc. 2017;6:e005042 DOI: 10.1161/JAHA.116.005042.)28356280
References
- 1. Global, regional, and national age‐sex specific all‐cause and cause‐specific mortality for 240 causes of death, 1990–2013: a systematic analysis for the Global Burden of Disease Study 2013. Lancet. 2015;385:117–171. [DOI] [PMC free article] [PubMed] [Google Scholar]
- 2. Reeves MJ, Bushnell CD, Howard G, Gargano JW, Duncan PW, Lynch G, Khatiwoda A, Lisabeth L. Sex differences in stroke: epidemiology, clinical presentation, medical care, and outcomes. Lancet Neurol. 2008;7:915–926. [DOI] [PMC free article] [PubMed] [Google Scholar]
- 3. Gall SL, Donnan G, Dewey HM, Macdonell R, Sturm J, Gilligan A, Srikanth V, Thrift AG. Sex differences in presentation, severity, and management of stroke in a population‐based study. Neurology. 2010;74:975–981. [DOI] [PubMed] [Google Scholar]
- 4. Chu NF, Wang DJ, Liou SH, Shieh SM. Relationship between hyperuricemia and other cardiovascular disease risk factors among adult males in Taiwan. Eur J Epidemiol. 2000;16:13–17. [DOI] [PubMed] [Google Scholar]
- 5. Johnson RJ, Kang DH, Feig D, Kivlighn S, Kanellis J, Watanabe S, Tuttle KR, Rodriguez‐Iturbe B, Herrera‐Acosta J, Mazzali M. Is there a pathogenetic role for uric acid in hypertension and cardiovascular and renal disease? Hypertension. 2003;41:1183–1190. [DOI] [PubMed] [Google Scholar]
- 6. Feig DI, Kang DH, Johnson RJ. Uric acid and cardiovascular risk. N Engl J Med. 2008;359:1811–1821. [DOI] [PMC free article] [PubMed] [Google Scholar]
- 7. Glantzounis GK, Tsimoyiannis EC, Kappas AM, Galaris DA. Uric acid and oxidative stress. Curr Pharm Des. 2005;11:4145–4151. [DOI] [PubMed] [Google Scholar]
- 8. Davies KJ, Sevanian A, Muakkassah‐Kelly SF, Hochstein P. Uric acid‐iron ion complexes. A new aspect of the antioxidant functions of uric acid. Biochem J. 1986;235:747–754. [DOI] [PMC free article] [PubMed] [Google Scholar]
- 9. Kamei K, Konta T, Hirayama A, Ichikawa K, Kubota I, Fujimoto S, Iseki K, Moriyama T, Yamagata K, Tsuruya K, Narita I, Kondo M, Shibagaki Y, Kasahara M, Asahi K, Watanabe T. Associations between serum uric acid levels and the incidence of nonfatal stroke: a nationwide community‐based cohort study. Clin Exp Nephrol. 2016;1–7. [Epub ahead of print]. [DOI] [PubMed] [Google Scholar]
- 10. Zhang W, Iso H, Murakami Y, Miura K, Nagai M, Sugiyama D, Ueshima H, Okamura T. Serum uric acid and mortality form cardiovascular disease: EPOCH‐JAPAN Study. J Atheroscler Thromb. 2016;23:692–703. [DOI] [PMC free article] [PubMed] [Google Scholar]
- 11. Chien KL, Hsu HC, Sung FC, Su TC, Chen MF, Lee YT. Hyperuricemia as a risk factor on cardiovascular events in Taiwan: the Chin‐Shan Community Cardiovascular Cohort Study. Atherosclerosis. 2005;183:147–155. [DOI] [PubMed] [Google Scholar]
- 12. Gerber Y, Tanne D, Medalie JH, Goldbourt U. Serum uric acid and long‐term mortality from stroke, coronary heart disease and all causes. Eur J Cardiovasc Prev Rehabil. 2006;13:193–198. [DOI] [PubMed] [Google Scholar]
- 13. Jee SH, Lee SY, Kim MT. Serum uric acid and risk of death from cancer, cardiovascular disease or all causes in men. Eur J Cardiovasc Prev Rehabil. 2004;11:185–191. [DOI] [PubMed] [Google Scholar]
- 14. Sakata K, Hashimoto T, Ueshima H, Okayama A. Absence of an association between serum uric acid and mortality from cardiovascular disease: NIPPON DATA 80, 1980–1994. National Integrated Projects for Prospective Observation of Non‐communicable Diseases and its Trend in the Aged. Eur J Epidemiol. 2001;17:461–468. [DOI] [PubMed] [Google Scholar]
- 15. Storhaug HM, Norvik JV, Toft I, Eriksen BO, Lochen ML, Zykova S, Solbu M, White S, Chadban S, Jenssen T. Uric acid is a risk factor for ischemic stroke and all‐cause mortality in the general population: a gender specific analysis from The Tromso Study. BMC Cardiovasc Disord. 2013;13:115. [DOI] [PMC free article] [PubMed] [Google Scholar]
- 16. Holme I, Aastveit AH, Hammar N, Jungner I, Walldius G. Uric acid and risk of myocardial infarction, stroke and congestive heart failure in 417,734 men and women in the Apolipoprotein MOrtality RISk study (AMORIS). J Intern Med. 2009;266:558–570. [DOI] [PubMed] [Google Scholar]
- 17. Strasak AM, Kelleher CC, Brant LJ, Rapp K, Ruttmann E, Concin H, Diem G, Pfeiffer KP, Ulmer H. Serum uric acid is an independent predictor for all major forms of cardiovascular death in 28,613 elderly women: a prospective 21‐year follow‐up study. Int J Cardiol. 2008;125:232–239. [DOI] [PubMed] [Google Scholar]
- 18. Strasak A, Ruttmann E, Brant L, Kelleher C, Klenk J, Concin H, Diem G, Pfeiffer K, Ulmer H. Serum uric acid and risk of cardiovascular mortality: a prospective long‐term study of 83,683 Austrian men. Clin Chem. 2008;54:273–284. [DOI] [PubMed] [Google Scholar]
- 19. Bos MJ, Koudstaal PJ, Hofman A, Witteman JC, Breteler MM. Uric acid is a risk factor for myocardial infarction and stroke: the Rotterdam Study. Stroke. 2006;37:1503–1507. [DOI] [PubMed] [Google Scholar]
- 20. Jimenez MC, Curhan GC, Choi HK, Forman JP, Rexrode KM. Plasma uric acid concentrations and risk of ischaemic stroke in women. Eur J Neurol. 2016;23:1158–1164. [DOI] [PMC free article] [PubMed] [Google Scholar]
- 21. Hozawa A, Folsom AR, Ibrahim H, Nieto FJ, Rosamond WD, Shahar E. Serum uric acid and risk of ischemic stroke: the ARIC Study. Atherosclerosis. 2006;187:401–407. [DOI] [PubMed] [Google Scholar]
- 22. Li M, Hou W, Zhang X, Hu L, Tang Z. Hyperuricemia and risk of stroke: a systematic review and meta‐analysis of prospective studies. Atherosclerosis. 2014;232:265–270. [DOI] [PubMed] [Google Scholar]
- 23. Kim SY, Guevara JP, Kim KM, Choi HK, Heitjan DF, Albert DA. Hyperuricemia and risk of stroke: a systematic review and meta‐analysis. Arthritis Rheum. 2009;61:885–892. [DOI] [PMC free article] [PubMed] [Google Scholar]
- 24. Gao X, O'Reilly EJ, Schwarzschild MA, Ascherio A. Prospective study of plasma urate and risk of Parkinson disease in men and women. Neurology. 2016;86:520–526. [DOI] [PMC free article] [PubMed] [Google Scholar]
- 25. Liberati A, Altman DG, Tetzlaff J, Mulrow C, Gotzsche PC, Ioannidis JP, Clarke M, Devereaux PJ, Kleijnen J, Moher D. The PRISMA statement for reporting systematic reviews and meta‐analyses of studies that evaluate health care interventions: explanation and elaboration. PLoS Med. 2009;6:e1000100. [DOI] [PMC free article] [PubMed] [Google Scholar]
- 26. Wells G, Shea B, O'connell D. The Newcastle–Ottawa Scale (NOS) for Assessing the Quality of Nonrandomised Studies in Meta‐Analyses. Ottawa, ON: Ottawa Health Research Institute; 2010. [Google Scholar]
- 27. Greenland S, Longnecker MP. Methods for trend estimation from summarized dose‐response data, with applications to meta‐analysis. Am J Epidemiol. 1992;135:1301–1309. [DOI] [PubMed] [Google Scholar]
- 28. Orsini N, Bellocco R, Greenland S. Generalized least squares for trend estimation of summarized dose‐response data. Stata J. 2006;6:40–57. [Google Scholar]
- 29. Orsini N, Li R, Wolk A, Khudyakov P, Spiegelman D. Meta‐analysis for linear and nonlinear dose‐response relations: examples, an evaluation of approximations, and software. Am J Epidemiol. 2012;175:66–73. [DOI] [PMC free article] [PubMed] [Google Scholar]
- 30. Aune D, Norat T. Dietary fibre, whole grains, and risk of colorectal cancer: systematic review and dose‐response meta‐analysis of prospective studies. BMJ. 2011;343:d6617. [DOI] [PMC free article] [PubMed] [Google Scholar]
- 31. Higgins JPT, Thompson SG. Quantifying heterogeneity in a meta‐analysis. Stat Med. 2002;21:1539–1558. [DOI] [PubMed] [Google Scholar]
- 32. Begg CB, Mazumdar M. Operating characteristics of a rank correlation test for publication bias. Biometrics. 1994;50:1088–1101. [PubMed] [Google Scholar]
- 33. Egger M, Smith GD, Schneider M, Minder C. Bias in meta‐analysis detected by a simple, graphical test. BMJ. 1997;315:629–634. [DOI] [PMC free article] [PubMed] [Google Scholar]
- 34. Carmelinda R, Antonio C, Alessandro B, Bos AJG, Marcello M, Dixit VD, Fulvio L, Stefania B, Umberto S, Luigi F. Uric acid and inflammatory markers. Eur Heart J. 2006;27:1174–1181. [DOI] [PMC free article] [PubMed] [Google Scholar]
- 35. Kanellis J, Kang DH. Uric acid as a mediator of endothelial dysfunction, inflammation, and vascular disease. Semin Nephrol. 2005;25:39–42. [DOI] [PubMed] [Google Scholar]
- 36. Li P, Zhang L, Zhang M, Zhou C, Lin N. Uric acid enhances PKC‐dependent eNOS phosphorylation and mediates cellular ER stress: a mechanism for uric acid‐induced endothelial dysfunction. Int J Mol Med. 2016;37:989–997. [DOI] [PMC free article] [PubMed] [Google Scholar]
- 37. Waring WS, Maxwell SR, Webb DJ. Uric acid concentrations and the mechanisms of cardiovascular disease. Eur Heart J. 2003;23:1888–1889. [DOI] [PubMed] [Google Scholar]
- 38. Montalcini T, Gorgone G, Gazzaruso C, Sesti G, Perticone F, Pujia A. Relation between serum uric acid and carotid intima‐media thickness in healthy postmenopausal women. Intern Emerg Med. 2007;2:19–23. [DOI] [PMC free article] [PubMed] [Google Scholar]
- 39. Kivity S, Kopel E, Maor E, Abu‐Bachar F, Segev S, Sidi Y, Olchovsky D. Association of serum uric acid and cardiovascular disease in healthy adults. Am J Cardiol. 2013;111:1146–1151. [DOI] [PubMed] [Google Scholar]
- 40. Babio N, Martínez‐González MA, Estruch R, Wärnberg J, Recondo J, Ortega‐Calvo M, Serra‐Majem L, Corella D, Fitó M, Ros E. Associations between serum uric acid concentrations and metabolic syndrome and its components in the PREDIMED study. Nutr Metab Cardiovasc Dis. 2014;25:173–180. [DOI] [PubMed] [Google Scholar]
- 41. Barrett‐Connor EL, Cohn BA, Wingard DL, Edelstein SL. Why is diabetes mellitus a stronger risk factor for fatal ischemic heart disease in women than in men? The Rancho Bernardo Study. JAMA. 1991;265:627–631. [PubMed] [Google Scholar]
Associated Data
This section collects any data citations, data availability statements, or supplementary materials included in this article.
Supplementary Materials
Table S1. Search Strategy
Table S2. Quality Scores of Prospective Studies Using Newcastle‐Ottawa Scale
Table S3. Relative Risks of Stroke Among Men and Women in the Included Prospective Studies
Table S4. Uric Acid Levels and Stroke in Men and Women, Nonlinear Dose Response
Figure S1. Funnel plots of uric acid and risk of stroke among men (A) and women (B).
Figure S2. Funnel plots of uric acid and risk of ischemic stroke among men (A) and women (B).
Figure S3. Funnel plots of uric acid and risk of hemorrhagic stroke among men (A) and women (B).


