

Abstract
Background
Thoracic aortic calcification (TAC) and coronary artery calcification (CAC) are markers of subclinical atherosclerosis and are associated with incident major cardiovascular events. We investigated major determinants for incidence and progression of TAC and the association between TAC and CAC incidence and progression.
Methods and Results
In a population‐based cohort study, 3270 participants (aged 45–74 years, 53.1% women) received cardiac computed tomography at baseline and after a mean follow‐up of 5.1±0.3 years for quantification of calcification of the ascending (ATAC) and descending thoracic aorta (DTAC) and CAC. Multivariable relative risk regression analysis was used to investigate associations of cardiovascular risk factors with incident TAC, of baseline TAC with incident CAC, and of baseline CAC with incident TAC. Of 1243 participants with baseline TAC of 0, 517 (41.6%) revealed incident TAC after 5 years. Incidence of descending TAC was higher (34.5%) than ascending TAC (23.3%). Incident TAC after 5 years was associated with age (relative risk 1.26 [95% CI 1.21–1.33], per 5 years), blood pressure (relative risk 1.06 [95% CI 1.03–1.10], per 10 mm Hg), low‐density lipoprotein cholesterol (relative risk 1.08 [95% CI 1.04–1.12], per 20 mg/dL), and smoking (relative risk 1.28 [95% CI 1.07–1.53]). Among the 1185 participants without CAC at baseline, the risk of developing CAC was 28.3% when baseline TAC was present compared with 22.2% among those without baseline TAC (excess risk 6.1% [95% CI 1.2–11.0%]). The point estimate of excess risk for incident CAC was higher for ascending TAC (10.8% [95% CI 4.8–16.7%]) and low for descending TAC (1.8% [95% CI −3.2% to 6.7%]). Excess risk for developing ascending and descending TAC with present baseline CAC was 16.4% (95% CI 12.7–20.0%) and 15.6% (95% CI 10.8–20.4%), respectively.
Conclusion
TAC and CAC share similar major determinants for incident calcification. Participants with TAC, especially ascending TAC, are at elevated risk for development of CAC.
Keywords: aortic disease, calcification, cardiac CT, computed tomography, coronary artery calcification, thoracic aortic calcification
Subject Categories: Cardiovascular Disease, Epidemiology, Computerized Tomography (CT), Atherosclerosis
Introduction
Thoracic aortic calcification (TAC) and coronary artery calcification (CAC) are markers of subclinical atherosclerosis and can be quantified from noncontrast cardiac computed tomography (CT).1, 2 Prevalence of TAC is associated with risk factors similar to those for CAC and is closely related to coronary atherosclerosis, consistent with a common underlying systemic vascular atherosclerotic process.3, 4 With rising TAC and CAC scores, the probability of future coronary and cardiovascular events increases. Both CAC and aortic calcification predict vascular morbidity and mortality5, 6, 7, 8; therefore, quantification of vascular calcification is currently regarded as the best single test for risk assessment in asymptomatic patients at intermediate risk for cardiovascular events. For those without CAC, excellent cardiovascular prognosis is well documented.9, 10
Corresponding to overall atherosclerosis burden, the extent of vascular calcification changes over time. The incidence or progression of TAC and CAC can be investigated by repetitive CT examinations.11 New onset or rapid CAC progression is associated with an enhanced risk for future coronary heart disease events and all‐cause mortality.2, 12 The likelihood of subsequent CAC incidence has recently been shown to increase with rising TAC scores, suggesting that a TAC score >100 could serve as an independent predictor of CAC incidence.13 So far, this finding is not confirmed in a population‐based setting. TAC burden varies between ascending and descending thoracic aorta,1, 14 with different impact of thoracic aortic segment calcifications on cardiovascular events.15 Furthermore, presence of calcification in the descending thoracic aortic (descending TAC [DTAC]) has been demonstrated to be associated with CAC independent of cardiovascular risk factors.14 To date, neither the impact of different TAC scores on CAC progression nor the influence of TAC progression on CAC has been reported.
The aim of this study was to assess the main determinants of TAC incidence and progression and the predictive value of baseline TAC (TACbl) scores on CAC incidence and progression for the overall thoracic aorta and for aortic segments separately, as quantified from cardiac CT in a population‐based cohort.
Methods
Study Population
The Heinz Nixdorf Recall study is a population‐based prospective cohort study designed to assess the predictive value of novel markers for risk stratification in addition to traditional cardiovascular risk factors. Between December 2000 and August 2003, a total of 4814 persons were contacted on the basis of a random sample of men and women aged 45 to 74 years who were registered in mandatory citizen registries in the German cities of Bochum, Essen, and Mülheim/Ruhr. Details of recruitment and study design were published previously.2, 5 Those with prior coronary artery disease (coronary artery bypass grafting and/or interventional revascularization procedures and history of prior myocardial infarction) were excluded from this analysis (n=327). Of the remaining participants (n=4487), 3916 participated in the follow‐up examination after 5 years. Of those, 3446 participants had information on TACbl (both ascending TAC [ATAC] and DTAC), baseline CAC (CACbl), and follow‐up. Also excluded were participants with stent implantation, bypass surgery, or myocardial infarction during the 5‐year follow‐up period, (n=141); participants outside the study age range (45–74 years at baseline, 50–79 years at 5‐year follow‐up; n=10); or participants with missing information on Framingham risk factors (n=25). A total of 3270 eligible participants (53.1% women) remained for the present analysis (Figure S1). All participants provided written informed consent, and the study was approved by the ethics committee of the University Clinic Essen, Germany.
Risk Factor Analyses
Cardiovascular risk factors were assessed at the time of each noncontrast CT scan (baseline and after 5 years). The methodology was published previously.5 Smoking behavior was assessed in detail.16 Body mass index (kg/m2) was calculated using standardized height and weight measurements. Total cholesterol, high‐density lipoprotein cholesterol, triglycerides, and low‐density lipoprotein cholesterol (LDL‐C) were measured with the standard enzymatic methods. Use of lipid‐lowering medication was documented. Blood pressure was measured using an oscillometric method (Omron), according to a standard protocol. The mean value of the second and third of 3 measurements taken at least 2 minutes apart was used. Hypertension was defined as systolic or diastolic blood pressure ≥140 or ≥90 mm Hg, respectively, or documented use of antihypertensive medication. Blood fasting glucose was measured after overnight fasting 9.7+4.9 hours (median 12 hours). Participants were classified as diabetic when glucose was ≥126 mg/dL or use of insulin or oral hypoglycemic agents was reported.17
CT Scan Protocol
CT scans were performed for quantification of CAC with a C‐100 and C‐150 scanner (GE Imatron) in 2 independent radiology institutions at baseline. Follow‐up imaging was performed after a mean of 5.1±0.3 years (median 5.1 years, interquartile range [IQR] 5.0–5.2 years) with an identical scanning protocol, using an Imatron C‐150 scanner.
The CTs were operated in the single‐slice mode with an image acquisition time of 100 ms. A slice thickness of 3 mm was chosen. Prospective ECG triggering was performed at 80% of the R‐R interval. Contiguous slices from the right pulmonary artery down to the apex of the heart were obtained, sufficient to include the entire heart as well as the ascending aorta and descending thoracic aorta. TAC and CAC were defined as a focus of at least 4 contiguous pixels with a CT density >130 Hounsfield units and quantified using the Agatston method.18
TAC included calcification scored from segments of the ascending and descending portions of the thoracic aorta visible in the coronary CT scan and was classified using the standard CAC categories (TAC 0, 1–99, 100–399, and ≥400), as described previously.1, 3 The aortic arch and the infrarenal abdominal aorta were not included in the scan. Calcification in the aortic root (eg, above the aortic valve) was included in ATAC. Participants and physicians remained unaware of the CAC and TAC scoring results of the baseline examination.
Statistical Analyses
Means and standard deviations were calculated for continuous measures with the exception of TAC and CAC, for which medians and IQRs were calculated due to the skewed nature; frequencies were given as number (percentage). Demographics and risk factors at baseline were estimated for each TAC score category at baseline (TACbl). To statistically evaluate the relationship between TAC groups and continuous data, we used a Spearman correlation test for trend with TAC groups. For frequencies, we used the Mantel‐Haenszel χ2 or Cochran–Armitage test as a trend test.
Incidence of overall TAC within 5 years and of ATAC and DTAC separately was modeled using the robust variance version19 of relative risk regression. These models with CACbl (on the log‐scale) as exposure were calculated crude (and univariate for each cardiovascular risk factor) and adjusting the influence of CACbl for all cardiovascular risk factors. Results are given as relative risk with 95% CI.
For graphical representation, the sex‐specific 50th, 75th, and 90th percentiles per 5‐year age group of TAC distribution for baseline and 5‐year follow‐up data were analyzed, investigating ATAC and DTAC separately. These observed data points were plotted together with linear quantile regression fits of the form log(TAC+1)=I+b age for the 50th, 75th, and 90th percentiles.
To operationalize 5‐year TAC progression as a continuous end point, we let y=[((TACf)+1)/(TACbl+1)](5/T) denote TAC change in 5 years, explicitly taking the actual time (T) in years between scans (5.1±0.3 years) into account. Then, in a given subgroup, 100·[y−1]% is the 5‐year TAC progression in that subgroup, represented as median percentage (IQR). Furthermore, β denoted the regression coefficient of TAC change in 5 years in the framework of linear regression of log(y) on x (known as exponential regression), where x is a potential risk factor. Then the 5‐year change in TAC progression related to an increase in x by 1 is given as 100·[exp(β)−1]%. The results are given crude and, with addition of cardiovascular risk factors, adjusted for TACbl (as log[TACbl+1]) and are reported with their 95% CIs.
In the next step, as primary outcome, we estimated the excess risk of incident CAC (CACi) by contrasting participants with versus without TACbl as risk differences with their 95% CIs. This calculation was also carried out for excess risk of incident CAC depending on the presence of ATAC and DTAC separately. Secondary outcomes were all other combinations: incident ATAC depending on presence of CACbl or DTAC at baseline (DTACbl) and incident DTAC depending on ATAC as well as CACbl. We also computed relative risk regressions for CACi with TACbl, baseline ATAC (ATACbl) or DTACbl (on the log scale) as exposure, crude, and fully adjusted for cardiovascular risk factors.
For both sexes, we calculated CAC percentiles at baseline as functions of age from linear quantile regression on the log scale, log(CACbl+1). CAC at follow up (CACf) was predicted exponentially extrapolating along the participant's percentile by the time T between measurements. A predefined acceptance band nominally covers 20% of observed values around the individually predicted value. CAC progression was classified as CAC function within band (expected progression), above band (fast progression), or below band (slow progression). Overall, 68% of the participants lay within the acceptance band.20, 21 We found that this approach could not be transferred to progression of thoracic aortic calcium.
We further calculated and reported confidence intervals to assess the precision of our estimates. Reported P values are to be understood as additional but purely descriptive information. Our primary goal was estimation, not significance testing, and to avoid publication bias by preferential reporting of significant results. The value of our estimates will be discussed with a focus on precision and validity.
Results
Baseline Parameter
The baseline demographics of the cohort of 3270 participants, who underwent baseline and 5‐year follow‐up CT, are given in Table 1 for men and women. Both cohorts are subdivided by TAC score categories at baseline (TACbl) (Table 1). All baseline risk factors showed a strong association with TAC except for high‐density lipoprotein cholesterol.
Table 1.
Baseline Characteristics by TAC Categories in Men and Women
| TACbl Categories at Baseline for Men (n=1533) | TACbl Categories at Baseline for Women (n=1737) | |||||||||
|---|---|---|---|---|---|---|---|---|---|---|
| TACbl 0 (n=558) | TACbl 1–99 (n=537) | TACbl 100–399 (n=254) | TACbl ≥400 (n=184) | P for Trend | TACbl 0 (n=685) | TACbl 1–99 (n=665) | TACbl 100–399 (n=252) | TACbl ≥400 (n=135) | P for Trend | |
| Age, y | 56.3±7.0 | 58.0±7.2 | 61.7±6.6 | 64.8±6.3 | <0.0001a | 56.4±7.1 | 58.6±7.1 | 63.2±7.2 | 65.9±6.3 | <0.0001a |
| Diabetes mellitus, % | 10.6 | 13.6 | 19.7 | 25.0 | <0.0001b | 6.6 | 7.5 | 9.5 | 17.0 | 0.0003b |
| Systolic BP, mm Hg | 134.0±17.8 | 135.7±17.8 | 140.3±18.4 | 148.5±20.2 | <0.0001a | 123.3±18.8 | 127.0±20.4 | 133.3±20.8 | 137.1±20.7 | <0.0001a |
| Diastolic BP, mm Hg | 83.9±10.5 | 84.1±10.2 | 85.2±10.0 | 85.4±10.4 | 0.027a | 77.5±10.0 | 79.2±10.6 | 79.8±10.5 | 80.3±10.5 | <0.0001a |
| Hypertension, % | 38.0 | 41.0 | 50.0 | 70.7 | <0.0001b | 21.2 | 28.3 | 42.1 | 43.0 | <0.0001b |
| Antihypertensive med., % | 26.0 | 22.9 | 38.6 | 50.5 | <0.0001b | 23.4 | 27.1 | 44.4 | 57.8 | <0.0001b |
| Former smoking, % | 40.1 | 48.6 | 47.6 | 52.2 | 0.005c | 27.9 | 21.5 | 22.2 | 21.5 | 0.033c |
| Present smoking, % | 26.2 | 22.2 | 22.0 | 27.7 | 18.2 | 22.9 | 16.7 | 20.7 | ||
| LDL‐C, mg/dL | 144.9±33.7 | 146.1±34.8 | 152.3±37.7 | 149.7±38.4 | 0.015a | 140.1±34.9 | 144.8±34.7 | 154.3±35.2 | 158.6±39.4 | <0.0001a |
| HDL‐C, mg/dL | 52.0±14.2 | 51.9±13.1 | 51.6±15.5 | 51.5±15.7 | 0.29a | 66.3±17.4 | 66.8±17.2 | 64.1±16.0 | 63.9±15.0 | 0.16a |
| Lipid‐lowering med., % | 6.7 | 5.8 | 10.4 | 20.9 | <0.0001b | 7.4 | 9.0 | 14.9 | 20.8 | <0.0001b |
| Framingham risk, % | 12.7±6.8 | 13.8±8.0 | 18.0±10.1 | 22.7±10.4 | <0.0001a | 6.2±4.4 | 7.3±4.9 | 9.1±5.0 | 10.6±6.2 | <0.0001a |
| CACbl‐score, median (IQR) | 14 (0–104) | 21 (1–112) | 118 (25– 345) | 288 (106–823) | <0.0001a | 0 (0–8) | 0 (0–9) | 11 (0–86) | 83 (6–267) | <0.0001a |
Values are mean±SD or percentages unless otherwise stated. BP indicates blood pressure; CACbl, coronary artery calcification at baseline; HDL‐C, high‐density lipoprotein cholesterol; IQR, interquartile range; LDL‐C, low‐density lipoprotein cholesterol; med., medications; TACbl, thoracic aortic calcification at baseline.
Spearman correlation test.
Cochran–Armitage test.
χ2 test.
Incidence of TAC
At the time of repeated CT scan, 517 (41.6%) of the 1243 participants without TACbl developed overall incident TAC (TACi; incident ATAC: 448 [23.3%]; incident DTAC: 502 [34.5%]). Regression analysis revealed systolic blood pressure, smoking, LDL‐C, and CACbl score in addition to age and sex as determinants significantly associated with TACi in fully adjusted models, similar to incident ATAC, whereas incident DTAC was significantly associated with systolic blood pressure, intake of antihypertensive medication, diabetes mellitus, smoking, and CACbl score (Table 2).
Table 2.
Relative Risk Regression Analysis of TAC, ATAC, and DTAC Incidence at 5 Years (Crude and Fully Adjusted)
| Parameters at Baseline | TAC Incidence (n=1243, 517 With Incidence) | ATAC Incidence (n=1924, 448 With Incidence) | DTAC Incidence (n=1456, 502 With Incidence) | |||
|---|---|---|---|---|---|---|
| Crude RR (95% CI) | Fully Adjusted RR (95% CI) | Crude RR (95% CI) | Fully Adjusted RR (95% CI) | Crude RR (95% CI) | Fully Adjusted RR (95% CI) | |
| Age (5 years) | 1.33 (1.28–1.39)a | 1.26 (1.21–1.33)a | 1.28 (1.22–1.35)a | 1.14 (1.07–1.21)a | 1.41 (1.35–1.47)a | 1.35 (1.29–1.42)a |
| Sex (female vs male) | 0.95 (0.83–1.08) | 1.18 (1.01–1.37)a | 0.96 (0.81–1.12) | 1.40 (1.15–1.71)a | 0.98 (0.85–1.13) | 1.23 (1.04–1.46)a |
| BMI, kg/m2 | 1.03 (1.02–1.04)a | 1.00 (0.98–1.02) | 1.05 (1.04–1.07)a | 1.01 (0.99–1.03) | 1.03 (1.01–1.04)a | 0.99 (0.98–1.01) |
| Diabetes mellitus, yes vs no | 1.33 (1.10–1.61)a | 1.19 (0.98–1.44) | 1.41 (1.12–1.78)a | 1.12 (0.88–1.42) | 1.54 (1.28–1.86)a | 1.25 (1.03–1.51)a |
| Systolic BP (10 mm Hg) | 1.12 (1.09–1.16)a | 1.06 (1.03–1.10)a | 1.16 (1.12–1.20)a | 1.09 (1.05–1.14)a | 1.13 (1.10–1.17)a | 1.07 (1.03–1.11)a |
| Antihypertensive medication, yes vs no | 1.43 (1.25–1.63)a | 1.06 (0.92–1.22) | 1.66 (1.41–1.95)a | 1.14 (0.96–1.36) | 1.59 (1.38–1.83)a | 1.19 (1.02–1.37)a |
| Former smoking vs never | 0.92 (0.79–1.08) | 1.03 (0.88–1.20) | 0.91 (0.76–1.10) | 1.01 (0.83–1.23) | 0.91 (0.78–1.08) | 1.04 (0.87–1.23) |
| Present smoking vs never | 0.99 (0.84–1.18) | 1.28 (1.07–1.53)a | 0.92 (0.75–1.14) | 1.15 (0.92–1.43) | 1.06 (0.89–1.27) | 1.50 (1.24–1.82)a |
| HDL‐C (5 mg/dL) | 0.99 (0.97–1.01) | 1.00 (0.98–1.02) | 0.97 (0.94–0.99) | 0.98 (0.95–1.01) | 0.97 (0.95–1.00) | 0.98 (0.96–1.01) |
| LDL‐C (20 mg/dL) | 1.10 (1.06–1.15)a | 1.08 (1.04–1.12)a | 1.14 (1.09–1.19)a | 1.11 (1.06–1.16)a | 1.06 (1.02–1.11)a | 1.03 (0.99–1.07) |
| Lipid‐lowering medication, yes vs no | 1.27 (1.02–1.59)a | 1.06 (0.85–1.32) | 1.53 (1.16–2.01)a | 1.27 (0.96–1.68) | 1.32 (1.06–1.64)a | 1.02 (0.82–1.26) |
| Baseline CACbl scoreb | 1.14 (1.12–1.17)a | 1.08 (1.05–1.12)a | 1.20 (1.17–1.24)a | 1.15 (1.11–1.20)a | 1.14 (1.11–1.17)a | 1.07 (1.03–1.10)a |
ATAC indicates ascending thoracic aortic calcification; BMI indicates body mass index; BP, blood pressure; CAC, coronary artery calcification; CACbl, coronary artery calcification at baseline; DTAC, descending thoracic aortic calcification; HDL‐C, high‐density lipoprotein cholesterol; IQR, interquartile range; LDL‐C, low‐density lipoprotein cholesterol; RR, relative risk; TAC, thoracic aortic calcification.
P<0.05. Fully adjusted: for age, sex, BMI, diabetes mellitus, systolic BP, antihypertensive medication, smoking, HDL‐C, LDL‐C, lipid‐lowering medication, and CACbl score.
log(CAC+1).
Progression of TAC
The fitted percentile curves as a function of age for the TAC distribution at follow‐up in either sex showed little overlap with their counterparts at baseline. This holds especially for the 75th and 90th percentiles (Figure 1A). This phenomenon was even more pronounced in DTAC percentiles (Figure 1C), whereas ATAC percentiles showed curvature nearly indistinguishable from the baseline results except for men in the highest percentile (Figure 1B).
Figure 1.
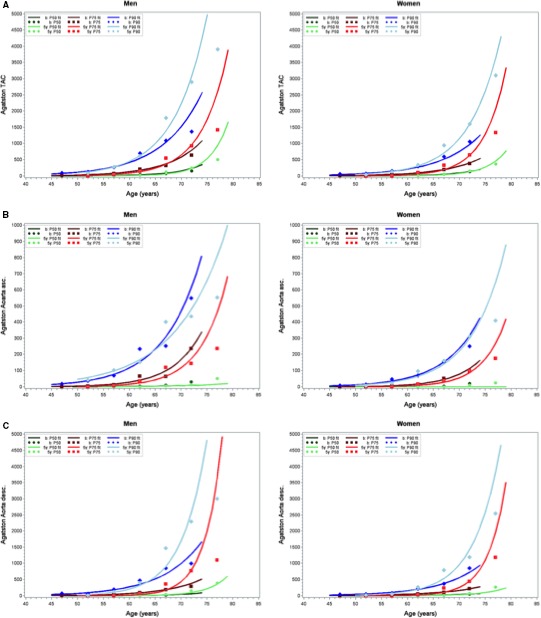
Observed and fitted 50th, 75th, and 90th percentiles (P50, P75, and P90, respectively) of thoracic aortic calcification (TAC) distribution for (A) overall TAC, (B) ascending (asc.) TAC and (C) descending (desc.) TAC by age categories in men and women. Dark colors show baseline values when participant age was between 45 and 74 years, and light colors show 5‐year follow‐up data.
Regression analysis revealed systolic blood pressure, diabetes mellitus, smoking, LDL‐C, and presence of lipid‐lowering and/or antihypertensive medication besides age as the determinants significantly associated with TAC progression in fully adjusted analysis (Table 3).
Table 3.
Regression Analysis for TAC, ATAC, and DTAC Progression After 5 Years (Crude and Full Model, Given as Percentage Change in [TAC+1] depicted as β‐estimates [95% CI])
| Parameters at Baseline | TAC Progression Percentage Change in (TAC+1) | ATAC Progression Percentage Change in (ATAC+1) | DTAC Progression Percentage Change in (DTAC+1) | |||
|---|---|---|---|---|---|---|
| Crude | Full Model | Crude | Full Model | Crude | Full Model | |
| Age (5 years) | 46.1 (38.7–53.8)a | 83.6 (73.9–94)a | 9.3 (5.1–13.7)a | 23.2 (18–28.7)a | 57.4 (49.2–66)a | 86.3 (76.1–97.1)a |
| Sex (female vs male) | −1.6 (−16.3 to 15.7) | 11.9 (−5.4 to 32.3) | −6.6 (−17.1 to 5.3) | −2.4 (−14.8 to 11.7) | −5.2 (−19.9 to 12.1) | 19.6 (0.3–42.6)a |
| BMI, kg/m2 | 3.5 (1.6–5.5)a | 0.1 (−1.7 to 2) | 0.8 (−0.6 to 2.2) | 0.2 (−1.2 to 1.8) | 3.4 (1.4 to 5.4)a | −1.1 (−3 to 0.8) |
| Diabetes mellitus, yes vs no | 62.9 (26.3–110)a | 56.9 (24.2–98.2)a | 43.1 (18.5–72.7)a | 50.2 (24.4–81.3)a | 67.5 (28.6–118.2)a | 44 (12.7–83.9)a |
| Systolic BP (10 mm Hg) | 17.7 (13.1–22.4)a | 16 (11.5–20.7)a | 6.5 (3.4–9.6)a | 7.3 (3.9–10.7)a | 21 (16.2–26.1)a | 17.3 (12.5–22.2)a |
| Antihypertensive medication, yes vs no | 89.9 (59.5–126)a | 62.1 (37.2–91.6)a | 22 (7.2–39)a | 18.9 (3.9–35.9)a | 108.5 (74–149.9)a | 72.2 (44.6–105.1)a |
| Former smoking, vs never | −5.1 (−21 to 14.1) | 24.9 (5.5–47.9)a | 4.3 (−9 to 19.5) | 18.9 (3.8–36.3)a | −1.4 (−18.6 to 19.4) | 23.5 (3.5–47.4)a |
| Present smoking, vs never | 22 (−1.2 to 50.6) | 137 (94.9–188.2)a | 30 (11.2–52)a | 68.4 (43.7–97.2)a | 14.2 (−8.3 to 42.2) | 120.7 (79.9–170.9)a |
| HDL‐C (5 mg/dL) | −3.3 (−5.5 to −1) | −2.2 (−4.6 to 0.3) | −2.1 (−3.8 to −0.4) | −0.8 (−2.8 to 1.2) | −3.8 (−6.1 to −1.4) | −3.1 (−5.6 to −0.5) |
| LDL‐C (20 mg/dL) | 13.2 (8.2–18.4)a | 15.2 (10.5–20)a | 6.7 (3.1–10.3)a | 12 (8.3–15.8)a | 10.2 (5.2–15.5)a | 8.2 (3.6–12.9)a |
| Lipid‐lowering medication, yes vs no | 59 (19.4–111.6)a | 68.4 (31.3–116.1)a | 30.9 (5.8–61.8)a | 81.6 (48.2–122.5)a | 71.2 (27.1–130.5)a | 40.8 (8.5–82.7)a |
| Baseline CAC score (log[CAC+1]) | 21.9 (17.9–26.1)a | 9.7 (6.9–12.4)a | 24.4 (20.2–28.8)a | |||
| Baseline TAC score (log[TAC+1]) in the respective vessels | −23.8 (−26.2 to −21.4) | −39.2 (−41.2 to −37.2) | −21.2 (−23.4 to −19) | −30.3 (−32.4 to −28.1) | −25.6 (−28.1 to −22.9) | −39 (−41.1 to −36.8) |
ATAC indicates ascending thoracic aortic calcification; BMI indicates body mass index; BP, blood pressure; CAC, coronary artery calcification; DTAC, descending thoracic aortic calcification; HDL‐C, high‐density lipoprotein cholesterol; LDL‐C, low‐density lipoprotein cholesterol; TAC, thoracic aortic calcification.
P<0.05. Full model containing age, sex, BMI, diabetes mellitus, systolic BP, antihypertensive medication, smoking, HDL‐C, LDL‐C, lipid‐lowering medication, and respective baseline TAC score as log(TACbl+1)/log(ATACbl+1)/log(DTACbl+1).
CACi by Presence of TACbl
In the absence of TACbl, 22.1% of participants developed CACi after 5 years, mostly low CAC burden (Table 4). With rising TACbl scores, this trend increased to 65.4% of CACi when TACbl scores were ≥400. Furthermore, the portion of high CACi burden increased with rising TACbl scores.
Table 4.
Amount of CACi After 5 Years Distributed in Different CACi Categories Depending on TACbl
| Baseline TACbl Score (n=1185) | Amount of CACi After 5 Years | |||
|---|---|---|---|---|
| CACi 0 (n=886, 75%) | CACi 1–99 (n=290, 24%) | CACi 100–399 (n=9, 1%) | P for Trend | |
| TACbl 0 (n=587, 50%) | 457 (78%) | 127 (21%) | 3 (1%) | <0.0001a |
| TACbl 1–99 (n=491, 41%) | 367 (75%) | 120 (24%) | 4 (1%) | |
| TACbl 100–399 (n=81, 7%) | 53 (65%) | 26 (32%) | 2 (3%) | |
| TACbl ≥400 (n=26, 2%) | 9 (35%) | 17 (65%) | 0 (0%) | |
CACi indicates amount of incident coronary artery calcification; TACbl, thoracic aortic calcification at baseline.
Mantel‐Haenszel test.
Regarding aortic segments separately, similar results were found. When ATACbl was absent (n=881), only 22.5% of participants developed CACi, and 24.4% developed CACi when DTACbl was absent (n=635). However, with rising ATACbl and DTACbl scores, portion of CACi increased up to 83.3% (ATACbl scores ≥400, n=6) and 65% (DTACbl ≥400, n=20). Similar to overall TACbl, CACi scores increased with rising ATACbl and DTACbl scores (Table S1).
Besides age, systolic blood pressure, smoking, LDL‐C, and presence of lipid‐lowering regression analysis showed a significant association of present ATACbl with CACi in fully adjusted models. Nevertheless, the presence of overall TACbl or DTACbl was not significantly associated with CACi after 5 years (Table 5).
Table 5.
Relative Risk Regression for Incidence of CAC by Amount of TAC, ATAC, and DTAC at Baseline (Fully Adjusted)
| Parameters at Baseline | Incidence of CAC as a Function | |||
|---|---|---|---|---|
| Crude | Fully Adjusted Models | |||
| RR (95% CI) | TAC at Baseline RR (95% CI) | ATAC at Baseline RR (95% CI) | DTAC at Baseline RR (95% CI) | |
| Age (5 years) | 1.25 (1.17–1.33)a | 1.17 (1.08–1.26)a | 1.16 (1.08–1.25)a | 1.18 (1.1–1.27)a |
| Sex (female vs male) | 0.76 (0.62–0.93)a | 0.89 (0.7–1.15) | 0.9 (0.7–1.15) | 0.9 (0.7–1.15) |
| BMI, kg/m2 | 1.04 (1.01–1.06)a | 1 (0.98–1.03) | 1 (0.97–1.02) | 1 (0.98–1.03) |
| Diabetes mellitus, yes vs no | 1.53 (1.1–2.13)a | 1.19 (0.83–1.69) | 1.18 (0.83–1.68) | 1.18 (0.83–1.68) |
| Systolic BP (10 mm Hg) | 1.18 (1.14–1.23)a | 1.11 (1.06–1.17)a | 1.11 (1.06–1.17)a | 1.11 (1.06–1.17)a |
| Antihypertensive medication, yes vs no | 1.47 (1.19–1.81)a | 1.15 (0.91–1.44) | 1.14 (0.91–1.43) | 1.15 (0.92–1.44) |
| Former smoking vs never | 1.04 (0.84–1.28) | 1.17 (0.92–1.48) | 1.17 (0.93–1.48) | 1.17 (0.93–1.48) |
| Present smoking vs never | 1.11 (0.87–1.4) | 1.37 (1.05–1.77)a | 1.35 (1.04–1.76)a | 1.38 (1.06–1.8)a |
| HDL‐C (5 mg/dL) | 0.96 (0.93–0.99)a | 0.98 (0.94–1.02) | 0.98 (0.94–1.02) | 0.98 (0.94–1.02) |
| LDL‐C (20 mg/dL) | 1.11 (1.04–1.17)a | 1.09 (1.03–1.15)a | 1.08 (1.02–1.15)a | 1.09 (1.03–1.15)a |
| Lipid‐lowering medication, yes vs no | 1.69 (1.22–2.35)a | 1.47 (1.08–2.01)a | 1.43 (1.06–1.94)a | 1.48 (1.08–2.02)a |
| Baseline TAC score (log[TACbl+1]) | 1.09 (1.04–1.14)a | 1.03 (0.98–1.08) | ||
| Baseline ATAC score (log[ATACbl+1]) | 1.16 (1.1–1.22)a | 1.07 (1.01–1.13)a | ||
| Baseline DTAC score (log[DTACbl+1]) | 1.05 (1–1.11)a | 1 (0.95–1.05) | ||
ATAC indicates ascending thoracic aortic calcification; BMI, body mass index; BP, blood pressure; CAC, coronary artery calcification; DTAC, descending thoracic aortic calcification; HDL‐C, high‐density lipoprotein cholesterol; LDL‐C, low‐density lipoprotein cholesterol; TAC, thoracic aortic calcification.
P<0.05. Fully adjusted for age, sex, BMI, diabetes mellitus, systolic BP, antihypertensive medication, smoking, HDL‐C, LDL‐C, and lipid‐lowering medication.
Correspondingly, the presence of ATACbl was associated with a high excess risk of CACi (10.8%, IQR 4.8–16.7%, P=0.0002). Reciprocally the presence of CACbl was associated with a high excess risk of ATACi (excess risk 16.4%, IQR 12.7–20.0%, P<0.0001). DTACbl was not associated with a high excess risk of CACi (1.8%, IQR −3.2–6.7%, P=0.48) (Figure 2).
Figure 2.
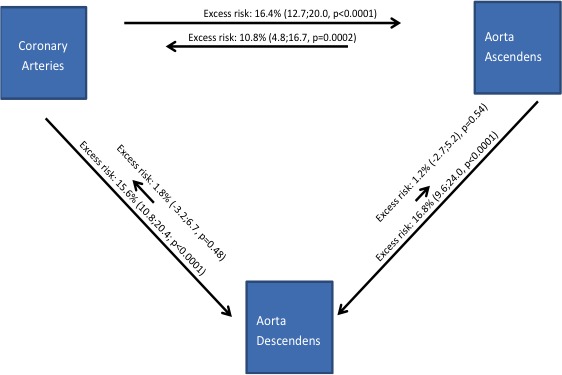
Five‐year progression of calcification with relations between vascular beds. Lengths of arrows indicate excess risk of 5‐year onset in the artery where the arrow points and contrasting presence and absence of baseline calcification where the arrow originates, IQR indicates interquartile range.
TACi by Presence of CACbl
To investigate the influence of CACbl on 5‐year incident TAC as a secondary outcome, we calculated TACi for different CACbl categories. When CACbl was absent, only 32% of participants developed TACi after 5 years (mostly low TACi burden), whereas this trend increased with up to 85% of TACi when CACbl scores were ≥400 (Table S2). Furthermore, the portion of high TACi burden increased with rising CACbl scores (P<0.0001 for trend). When CACbl was absent, 14% and 25% of participants developed ATACi and DTACi, respectively; however, with higher CACbl scores, incidence of ATAC and DTAC markedly increased (P<0.0001 for trend) (Table S3).
Prediction of CAC Progression by TACbl
In the absence of TACbl, 15.5% of participants revealed slow CAC progression, 67.1% had expected progression, and 17.4% had fast progression. With rising TACbl scores, the portion of fast CAC progression increased up to 24.1% (TACbl ≥400, P<0.0001 for trend) (Table 6).
Table 6.
CAC Progression in 5 Years Distributed by Slow, Expected, and Fast Progression Depending on TACbl
| Baseline TACbl Score (n=3270) | CAC Progression in 5 Years | P for Trend | ||
|---|---|---|---|---|
| Slow (n=395, 12%) | Expected (n=2238, 68%) | Fast (n=637, 20%) | ||
| TACbl 0 (n=1243, 38%) | 192 (16%) | 834 (67%) | 217 (17%) | <0.0001a |
| TACbl 1–99 (n=1202, 37%) | 133 (11%) | 828 (69%) | 241 (20%) | |
| TACbl 100–399 (n=506, 15%) | 55 (11%) | 349 (69%) | 102 (20%) | |
| TACbl ≥400 (n=319, 10%) | 15 (5%) | 227 (71%) | 77 (24%) | |
CAC indicates coronary artery calcification; TACbl, thoracic aortic calcification at baseline.
Mantel‐Haenszel test.
Regarding aortic segments separately, data corresponded with findings to overall TACbl; when ATACbl was absent (n=1924), 13.6% of participants revealed slow CAC progression, 67.5% had expected progression, and 18.9% fast progression. In the absence of DTACbl (n=1456), 14.4% had slow CAC progression, 66.6% had expected progression, and 19.0% had fast progression. With rising ATACbl and DTACbl scores, the proportion of fast CAC progression increased respectively to 28.1% (ATACbl ≥400, n=96) and 23.9% (DTACbl ≥400, n=222; P<0.0001 for trend) (Table S4).
Discussion
In this study, we investigated the interaction of both TACi and CACi with progression over 5 years in the general population. We found that the thoracic aorta and coronary arteries share similar major determinants for incidence and progression of calcification. In addition, participants with high extent of TAC, especially in the ascending aorta, reveal considerably elevated risk of incidence and accelerated progression of coronary calcification.
CT scanning for detection and quantification of CAC and TAC was previously demonstrated to show important prognostic information for the management of patients at intermediate cardiovascular risk.5, 6, 7, 8 Furthermore, repetitive calcification scanning after 5 years is recommended because ≈20% of participants without initial CAC develop subsequent CAC after 4 years.11 New‐onset or extensive CAC progression is associated with an enhanced risk of future coronary heart disease events and all‐cause mortality.2, 12 Previous studies demonstrated systolic blood pressure, diabetes mellitus, smoking, and lipid‐lowering medication as the main confounders for accelerated CAC progression.21, 22, 23, 24, 25
Similar to CAC, TAC, which is closely related to coronary atherosclerosis, can easily be measured and categorized with a noncontrast CT scan.3, 4, 6, 7, 13 Taking the strong association of thoracic aortic with coronary calcification into account, the identification of main determinants for TAC incidence and progression may play a pivotal role in cardiovascular prevention. In a multiethnic population‐based cohort, Youssef et al found age, systolic blood pressure, intake of antihypertensive medication, and smoking to be associated with TACi, thus not discriminating between the ascending and descending thoracic aorta.26 Accordingly, our results reveal—aside from age and sex—systolic blood pressure and LDL‐C as the main determinants of TACi, especially in the ascending aorta. Incidence of DTAC was triggered by systolic blood pressure, intake of antihypertensive medication, diabetes mellitus, and smoking. In both aortic segments, CAC score was markedly associated with the atherosclerotic process. For TAC progression, we identified systolic blood pressure, diabetes mellitus, smoking, LDL‐C, and presence of lipid‐lowering and/or antihypertensive medication, in addition to age, as the main determinants. This is in line with the population‐based findings of Youssef et al, who investigated this link across 4 different ethnicities. They found age, systolic blood pressure, intake of lipid‐lowering medication, diabetes mellitus, and smoking to be associated with TAC progression.26 In contrast to TAC progression, we did not observe a relevant association of incident TAC with the intake of lipid‐lowering medication; however, the duration and extent of medical intake was not included into the analysis. Because atherosclerosis is an ongoing disease, this may have biased our results. Dykun et al reported enhanced CAC progression under statin intake.27 Our corresponding results for TAC progression may support the hypothesis of a plaque‐stabilizing effect of statins, which might be reflected by an increase in TAC. This may influence expectations of clinicians when monitoring statin therapy by repetitive TAC scores. Further studies using CT angiography including lesion‐specific information over time and higher number of participants with statins are needed to confirm our results.
In contrast, the risk of CACi was recently shown to increase with rising TAC burden, suggesting that a TAC score >100 could serve as an independent predictor of future CAC conversion.13 Until now, this finding had not been investigated in a population‐based setting and the commonly accepted calcification score categories had not been utilized, especially with regard to high calcification burden with scores ≥400. Consideration of high calcification burden appears relevant, given the proportion of participants in the overall population with high TAC scores (11.7%).1, 3 We were able demonstrate that the rate of CACi increased up to 65.4% after 5 years in participants with TAC scores ≥400 at baseline. In addition, the portion of high CAC incidence/burden increased with rising TAC scores at baseline.
It was previously demonstrated that the prevalence and extent of TAC burden varies considerably between the ascending and descending thoracic aortic segments, displaying higher prevalence and extent of calcifications in the descending than in the ascending aorta. Both are included in the standard coronary calcification scan.1, 14 Importantly, the risk of cerebrovascular events (eg, stroke) is significantly higher in participants with DTAC.15 Interestingly, the rate of CAC conversion was more closely related to ATAC than DTAC. This divergent finding underscores the hypothesis that stroke events seem primarily associated with aortic atherosclerosis but not with coronary atherosclerosis.
Longitudinal assessment of CAC burden allows the quantification of progression of coronary artery disease.11, 21 An annual score increase of 15% is associated with an enhanced risk of myocardial infarction.28, 29 Major risk factors such as LDL‐C, family history of coronary heart disease, and hypertension showed only weak association with CAC progression. In addition, risk‐modifying medical therapy, known to reduce risk for CV events,30 was not associated with a reduction or attenuation of CAC.27, 31, 32 Furthermore, it was demonstrated previously that the rate of CAC progression is proportional to preexisting CAC.33 Neither the impact of different TAC scores on CAC progression, especially stratified by different aortic segments, nor the influence of TAC progression on the progression of coronary atherosclerosis has been reported.
In our study, ATAC was associated with high excess risk of CAC progression, whereas DTAC was not. With rising TAC scores at baseline, the portion of fast CAC progression increased up to 24.1% when TAC was ≥400, whereas the portion of slow CAC progression was 4.7%. Evaluating the association for aortic segments separately, data corresponded with findings for overall TAC. Because patients with TAC scores ≥400 have considerably elevated cardiovascular event rates,7 our results suggest this finding may be explained by accelerated CAC onset or CAC progress in this TAC category.
Clinical Implications
Noncontrast cardiac CT is performed for the assessment of CAC score, which independently predicts future coronary mortality and morbidity.1, 2, 5 Once CT examinations are performed, information on TAC score is readily available. This study demonstrates that TACbl is associated with the incidence and progression of CAC. Consequently, our results support the implementation of TAC assessment as an adjunct measurement of primary indication in a clinical workup, with noncontrast cardiac CT looking for CAC to improve the prognostic value of this imaging technology. Cardiac CT is considered appropriate for patients in the intermediate‐risk group only, which may limit the clinical value of our findings.
Strengths and Limitations of the Study
The strength of our study is the population‐based design with close follow‐up over 5 years. Traditional cardiovascular risk factors were measured using highly standardized protocols, and both CAC and TAC were quantified using a reproducible method. The CT scans were repeated with the same scanner technology and identical scanning protocols, so we avoided the use of any correction factors. Moreover, a potential bias by therapy was eradicated because participants and their physicians were blinded to the results of calcification scoring at the baseline examination.
A 5‐year follow‐up period may appear short but offers extrapolation to longer time intervals based on the exponential percentile curvature, which remained constant over time.
As a further limitation, we excluded those participants with revascularization during the 5‐year period, given uncertainties in the calcification score analysis; this approach may have biased our results toward the null. Because we studied mainly participants of white ethnicity, our results may not be generalizable to other ethnic groups; however, no interaction between TAC and ethnicity was observed in an ethnically diverse population.34
Finally, in this study, the aorta was examined in the available location on initially performed CAC scanning, excluding the aortic arch and the infrarenal abdominal aorta, 2 locations with noted higher prevalence of calcification.1, 3 Consequently, our TAC scores did not evaluate the potential importance of aortic arch or abdominal aorta calcification in the prediction of CAC incidence or progression.
Conclusion
The thoracic aorta and coronary arteries share similar major determinants of incidence of calcification. Participants with TAC, especially in the ascending aorta, are at elevated risk of development of CAC and reciprocally, participants with CAC reveal elevated risk for the development of thoracic aortic calcification.
Sources of Funding
This work was supported by the Heinz Nixdorf Foundation Germany and the Deutsche Forschungsgemeinschaft (DFG project: ER 155/6‐1, ER 155/6‐2, SI 236/8‐1, and SI 236/9‐1). We thank the Heinz Nixdorf Foundation (Chairman: Martin Nixdorf; Past Chairman: Dr Jur Gerhard Schmidt [deceased]), for their generous support of this study. This study is also supported by the German Ministry of Education and Science (BMBF) that transferred the monitoring of the study to the German Aero‐space Center (Deutsches Zentrum für Luft‐ und Raumfahrt [DLR]), Bonn, Germany. An international advisory board and quality control as well as event committee were established, but had no role concerning the study design, data collection, analysis, interpretation, or writing the report. The Deutsche Forschungsgemeinschaft (DFG) supported the study (DFG project: ER 155/6‐1 and ER 155/6‐2).
Disclosures
None.
Supporting information
Table S1. Amount of Incident Coronary Artery Calcification (CAC) After 5 Years, Distributed in Different CAC Categories Depending on Baseline Amount of Thoracic Aorta Calcification in Separate Aortic Segments
Table S2. Amount of Incident Thoracic Aorta Calcification (TACi) After 5 Years, Distributed in Different TACi Categories Depending on Baseline Amount of Coronary Artery Calcification
Table S3. Amount of Incident Calcification in Separate Aortic Segments After 5 Years, Distributed in Different Categories Depending on Baseline Amount of Coronary Artery Calcification
Table S4. Coronary Artery Calcification Progression Over 5 Years, Distributed by Slow, Expected, and Fast Progression Depending on Baseline Amount of Thoracic Aorta Calcification in Separate Aortic Segments
Figure S1. Flow diagram of the original study participants and steps of exclusion, resulting in participants eligible for final analysis.
Acknowledgments
We are indebted to the all study participants and to the dedicated personnel of both the study center of the Heinz Nixdorf Recall study and the electron beam tomography scanner facilities Professor D Grönemeyer, Bochum and Dr R Seibel, Mülheim as well as to the investigative group, in particular to U. Slomiany, E.M. Beck, A. Öffner, S. Münkel, M. Bauer, S. Schrader, R. Peter, and H. Hirche. We acknowledge the support of the Sarstedt AG&Co. (Nümbrecht, Germany) concerning laboratory equipment. We thank Prof. K. Lauterbach (Adjunct Professor, Harvard School of Public Health, Boston, USA) for his valuable contributions in an earlier phase of the study. Scientific advisory board: T. Meinertz, Hamburg (chairman); C. Bode, Freiburg; P. J. de Feyter, Rotterdam/Netherlands; B. Güntert, Hall i.T., Austria; F. Gutzwiller, Bern, Switzerland; H. Heinen, Bonn; O. Hess, Bern, Schweiz; B. Klein, Essen; H. Löwel, Neuherberg; M. Reiser, München; M. Schwaiger, München; C. Steinmüller, Bonn; T. Theorell, Stockholm, Schweden; S. N. Willich, Berlin. Primary and neurological endpoint committee C. Bode, Freiburg (chairman); K. Berger, Münster; M. Dichgans, München; HR. Figulla, Jena; C. Hamm, Bad Nauheim; P. Hanrath, Aachen; W. Köpcke, Münster; EB. Ringelstein, Münster; C. Weimar, Essen; A. Zeiher, Frankfurt.
(J Am Heart Assoc. 2017;6:e005093 DOI: 10.1161/JAHA.116.005093.)28360229
References
- 1. Kälsch H, Lehmann N, Möhlenkamp S, Hammer C, Mahabadi AA, Moebus S, Schmermund A, Stang A, Bauer M, Jöckel KH, Erbel R; Investigator Group of the Heinz Nixdorf Recall Study . Prevalence of thoracic aortic calcification and its relationship to cardiovascular risk factors and coronary calcification in an unselected population‐based cohort—the Heinz Nixdorf Recall Study. Int J Cardiovasc Imaging. 2013;29:207–216. [DOI] [PubMed] [Google Scholar]
- 2. Schmermund A, Möhlenkamp S, Stang A, Grönemeyer D, Seibel R, Hirche H, Mann K, Siffert W, Lauterbach K, Siegrist J, Jöckel KH, Erbel R; Heinz Nixdorf Recall Study Investigative Group . Assessment of clinically silent atherosclerotic disease and established and novel risk factors for predicting myocardial infarction and cardiac death in healthy middle‐aged subjects: rationale and design of the Heinz Nixdorf Recall Study. Am Heart J. 2002;144:212–218. [DOI] [PubMed] [Google Scholar]
- 3. Takasu J, Katz R, Nasir K, Carr JJ, Wong N, Detrano R, Budoff MJ. Relationships of thoracic aortic wall calcification to cardiovascular risk factors: the Multi‐Ethnic Study of Atherosclerosis (MESA). Am Heart J. 2008;155:765–771. [DOI] [PMC free article] [PubMed] [Google Scholar]
- 4. Kälsch H, Hennig F, Moebus S, Möhlenkamp S, Dragano N, Jakobs H, Memmesheimer M, Erbel R, Jöckel KH, Hoffmann B; Heinz Nixdorf Recall Study Investigative Group . Are air pollution and traffic noise independently associated with atherosclerosis: the Heinz Nixdorf Recall Study. Eur Heart J. 2014;35:853–860. [DOI] [PubMed] [Google Scholar]
- 5. Erbel R, Möhlenkamp S, Moebus S, Schmermund A, Lehmann N, Stang A, Dragano N, Grönemeyer D, Seibel R, Kälsch H, Bröcker‐Preuss M, Mann K, Siegrist J, Jöckel KH; Heinz Nixdorf Recall Study Investigative Group . Coronary risk stratification, discrimination, and reclassification improvement based on quantification of subclinical coronary atherosclerosis: the Heinz Nixdorf Recall Study. J Am Coll Cardiol. 2010;56:1397–1406. [DOI] [PubMed] [Google Scholar]
- 6. Budoff MJ, Nasir K, Katz R, Takasu J, Carr JJ, Wong ND, Allison M, Lima JA, Detrano R, Blumenthal RS, Kronmal R. Thoracic aortic calcification and coronary heart disease events: the Multi‐Ethnic Study of Atherosclerosis (MESA). Atherosclerosis. 2011;215:196–202. [DOI] [PMC free article] [PubMed] [Google Scholar]
- 7. Kälsch H, Lehmann N, Berg MH, Mahabadi AA, Mergen P, Möhlenkamp S, Bauer M, Kara K, Dragano N, Hoffmann B, Moebus S, Schmermund A, Stang A, Jöckel KH, Erbel R. Coronary artery calcification outperforms thoracic aortic calcification for the prediction of myocardial infarction and all‐cause mortality: the Heinz Nixdorf Recall Study. Eur J Prev Cardiol. 2014;21:1163–1170. [DOI] [PubMed] [Google Scholar]
- 8. Eisen A, Tenenbaum A, Koren‐Morag N, Tanne D, Shemesh J, Imazio M, Fisman EZ, Motro M, Schwammenthal E, Adler Y. Calcification of the thoracic aorta as detected by spiral computed tomography among stable angina pectoris patients: association with cardiovascular events and death. Circulation. 2008;118:1328–1334. [DOI] [PubMed] [Google Scholar]
- 9. Blaha M, Budoff MJ, Shaw LJ, Khosa F, Rumberger JA, Berman D, Callister T, Raggi P, Blumenthal RS, Nasir K. Absence of coronary artery calcification and all‐cause mortality. JACC Cardiovasc Imaging. 2009;2:692–700. [DOI] [PubMed] [Google Scholar]
- 10. Budoff MJ, Shaw LJ, Liu ST, Weinstein SR, Mosler TP, Tseng PH, Flores FR, Callister TQ, Raggi P, Berman DS. Long‐term prognosis associated with coronary calcification: observations from a registry of 25253 patients. J Am Coll Cardiol. 2007;49:1860–1870. [DOI] [PubMed] [Google Scholar]
- 11. Min JK, Lin FY, Gidseg DS, Weinsaft JW, Weinsaft JW, Berman DS, Shaw LJ, Rozanski A, Callister TQ. Determinants of coronary calcium conversion among patients with a normal coronary calcium scan: what is the ‘warranty period’ for remaining normal? J Am Coll Cardiol. 2010;55:1110–1117. [DOI] [PubMed] [Google Scholar]
- 12. Budoff MJ, Hokanson JE, Nasir K, Shaw LJ, Kinney GL, Chow D, Demoss D, Nuguri V, Nabavi V, Ratakonda R, Berman DS, Raggi P. Progression of coronary artery calcium predicts all‐cause mortality. JACC Cardiovasc Imaging. 2010;3:1229–1236. [DOI] [PubMed] [Google Scholar]
- 13. Brodov Y, Gransar H, Rozanski A, Hayes SW, Friedman JD, Thomson LE, Dey D, Slomka PJ, Min JK, Shaw LJ, Shah PK, Germano G, Berman DS. Extensive thoracic aortic calcification is an independent predictor of development of coronary artery calcium among individuals with coronary artery calcium score of zero. Atherosclerosis. 2015;238:4–8. [DOI] [PubMed] [Google Scholar]
- 14. Takasu J, Budoff MJ, O'Brien KD, Shavelle DM, Probstfield JL, Jeffrey Carr J, Katz R. Relationship between coronary artery and descending thoracic aortic calcification as detected by computed tomography: the Multi‐Ethnic Study of Atherosclerosis. Atherosclerosis. 2009;204:440–446. [DOI] [PMC free article] [PubMed] [Google Scholar]
- 15. Hermann DM, Lehmann N, Gronewold J, Bauer M, Mahabadi AA, Weimar C, Berger K, Moebus S, Jöckel KH, Erbel R,Kälsch H; Heinz Nixdorf Recall Study Investigative Group . Thoracic aortic calcification is associated with incident stroke in the general population in addition to established risk factors. Eur Heart J Cardiovasc Imaging. 2015;16:684–690. [DOI] [PubMed] [Google Scholar]
- 16. Jöckel KH, Lehmann N, Jaeger BR, Moebus S, Möhlenkamp S, Schmermund A, Dragano N, Stang A, Grönemeyer D, Seibel R, Mann K, Volbracht L, Siegrist J, Erbel R; Heinz Nixdorf Recall Study Investigative Group . Smoking cessation and subclinical atherosclerosis—results from the Heinz Nixdorf Recall Study. Atherosclerosis. 2009;203:221–227. [DOI] [PubMed] [Google Scholar]
- 17. Moebus S, Stang A, Möhlenkamp S, Dragano N, Schmermund A, Slomiany U, Hoffmann B, Bauer M, Broecker‐Preuss M, Mann K, Siegrist J, Erbel R, Jöckel KH; Heinz Nixdorf Recall Study Group . Association of impaired fasting glucose and coronary artery calcification as a marker of subclinical atherosclerosis in a population based cohort—results of the Heinz Nixdorf Recall Study. Diabetologia. 2009;52:81–89. [DOI] [PubMed] [Google Scholar]
- 18. Agatston AS, Janowitz WR, Hildner FJ, Zusmer NR, Viamonte M Jr, Detrano R. Quantification of coronary artery calcium using ultrafast computed tomography. J Am Coll Cardiol. 1990;15:827–832. [DOI] [PubMed] [Google Scholar]
- 19. Spiegelman D, Hertzmark E. Easy SAS calculations for risk or prevalence ratios and differences. Am J Epidemiol. 2005;162:199–200. [DOI] [PubMed] [Google Scholar]
- 20. Lehmann N, Erbel R, Mahabadi AA, Kälsch H, Möhlenkamp S, Moebus S, Stang A, Roggenbuck U, Strucksberg KH, Führer‐Sakel D, Dragano N, Budde T, Seibel R, Grönemeyer D, Jöckel KH; Heinz Nixdorf Recall Study Investigators . Accelerated progression of coronary artery calcification in hypertension but also prehypertension. J Hypertens. 2016;34:2233–2242. [DOI] [PubMed] [Google Scholar]
- 21. Erbel R, Lehmann N, Churzidse S, Rauwolf M, Mahabadi AA, Möhlenkamp S, Moebus S, Bauer M, Kälsch H, Budde T, Montag M, Schmermund A, Stang A, Führer‐Sakel D, Weimar C, Roggenbuck U, Dragano N, Jöckel KH; Heinz Nixdorf Recall Study Investigators . Progression of coronary artery calcification seems to be inevitable, but predictable—results of the Heinz Nixdorf Recall (HNR) Study. Eur Heart J. 2014;35:2960–2971. [DOI] [PMC free article] [PubMed] [Google Scholar]
- 22. Kronmal RA, McClelland RL, Detrano R, Shea S, Lima JA, Cushman M, Bild DE, Burke GL. Risk factors for the progression of coronary artery calcification an asymptomatic subjects: results from the Multi‐Ethnic Study of Atherosclerosis (MESA). Circulation. 2007;115:2722–2730. [DOI] [PubMed] [Google Scholar]
- 23. Kiramijyan S, Ahmadi N, Isma'eel H, Flores F, Shaw LJ, Raggi P, Budoff MJ. Impact of coronary artery calcium progression and statin therapy on clinical outcome in subjects with and without diabetes mellitus. Am J Cardiol. 2013;111:356–361. [DOI] [PubMed] [Google Scholar]
- 24. Quercioli A, Montecucco F, Pataky Z, Thomas A, Ambrosio G, Staub C, Di Marzo V, Ratib O, Mach F, Golay A, Schindler TH. Improvement in coronary circulatory function in morbidly obese individuals after gastric bypass‐induced weight loss: relation to alterations in endocannabinoids and adipocytokines. Eur Heart J. 2013;34:2063–2073. [DOI] [PubMed] [Google Scholar]
- 25. Okwuosa TM, Greenland P, Burke GL, Eng J, Cushman M, Michos ED, Ning H, Lloyd‐Jones DM. Prediction of coronary artery calcium progression in individuals with low Framingham Risk Score: the Multi‐Ethnic Study of Atherosclerosis. JACC Cardiovasc Imaging. 2012;5:144–153. [DOI] [PMC free article] [PubMed] [Google Scholar]
- 26. Youssef G, Guo M, McClelland RL, Shavelle DM, Nasir K, Rivera J, Carr JJ, Wong ND, Budoff MJ. Risk factors for the development and progression of thoracic aorta calcification: the Multi‐Ethnic Study of Atherosclerosis. Acad Radiol. 2015;22:1536–1545. [DOI] [PMC free article] [PubMed] [Google Scholar]
- 27. Dykun I, Lehmann N, Kälsch H, Möhlenkamp S, Moebus S, Budde T, Seibel R, Grönemeyer D, Jöckel K‐H, Erbel R, Mahabadi AA. Statin medication enhances the progression of coronary artery calcification—the Heinz Nixdorf Recall study. J Am Coll Cardiol. 2016;68:2123–2125. [DOI] [PubMed] [Google Scholar]
- 28. Raggi P, Cooil B, Ratti C, Callister TQ, Budoff M. Progression of coronary artery calcium and occurrence of myocardial infarction in patients with and without diabetes mellitus. Hypertension. 2005;46:238–243. [DOI] [PubMed] [Google Scholar]
- 29. Greenland P, Bonow RO, Brundage BH, Budoff MJ, Eisenberg MJ, Grundy SM, Lauer MS, Post WS, Raggi P, Redberg RF, Rodgers GP, Shaw LJ, Taylor AJ, Weintraub WS. ACCF/AHA 2007 clinical expert consensus document on coronary artery calcium scoring by computed tomography in global cardiovascular risk assessment and in evaluation of patients with chest pain: a report of the American College of Cardiology Foundation Clinical Expert Consensus Task Force (ACCF/AHA Writing Committee to Update the 2000 Expert Consensus Document on Electron Beam Computed Tomography) developed in collaboration with the Society of Atherosclerosis Imaging and Prevention and the Society of Cardiovascular Computed Tomography. J Am Coll Cardiol. 2007;49:378–402. [DOI] [PubMed] [Google Scholar]
- 30. Baigent C, Keech A, Kearney PM, Blackwell L, Buck G, Pollicino C, Kirby A, Sourjina T, Peto R, Collins R, Simes R; Cholesterol Treatment Trialists' (CTT) Collaborators . Efficacy and safety of cholesterol‐lowering treatment: prospective meta‐analysis of data from 90,056 participants in 14 randomised trials of statins. Lancet. 2005;366:1267–1278. [DOI] [PubMed] [Google Scholar]
- 31. Arad Y, Spadaro LA, Roth M, Newstein D, Guerci AD. Treatment of asymptomatic adults with elevated coronary calcium scores with atorvastatin, vitamin C, and vitamin E: the St. Francis Heart Study randomized clinical trial. J Am Coll Cardiol. 2005;46:166–172. [DOI] [PubMed] [Google Scholar]
- 32. Raggi P, Davidson M, Callister TQ, Welty FK, Bachmann GA, Hecht H, Rumberger JA. Aggressive versus moderate lipid‐lowering therapy in hypercholesterolemic postmenopausal women: Beyond Endorsed Lipid Lowering with EBT Scanning (BELLES). Circulation. 2005;112:563–571. [DOI] [PubMed] [Google Scholar]
- 33. Lehmann N, Möhlenkamp S, Mahabadi AA, Schmermund A, Roggenbuck U, Seibel R, Grönemeyer D, Budde T, Dragano N, Stang A, Mann K, Moebus S, Erbel R, Jöckel KH. Effect of smoking and other traditional risk factors on the onset of coronary artery calcification: results of the Heinz Nixdorf Recall Study. Atherosclerosis. 2014;232:339–345. [DOI] [PubMed] [Google Scholar]
- 34. Rivera JJ, Nasir K, Katz R, Takasu J, Allison M, Wong ND, Barr RG, Carr JJ, Blumenthal RS, Budoff MJ. Relationship of thoracic aortic calcium to coronary calcium and its progression (from the Multi‐Ethnic Study of Atherosclerosis [MESA]). Am J Cardiol. 2009;103:1562–1567. [DOI] [PMC free article] [PubMed] [Google Scholar]
Associated Data
This section collects any data citations, data availability statements, or supplementary materials included in this article.
Supplementary Materials
Table S1. Amount of Incident Coronary Artery Calcification (CAC) After 5 Years, Distributed in Different CAC Categories Depending on Baseline Amount of Thoracic Aorta Calcification in Separate Aortic Segments
Table S2. Amount of Incident Thoracic Aorta Calcification (TACi) After 5 Years, Distributed in Different TACi Categories Depending on Baseline Amount of Coronary Artery Calcification
Table S3. Amount of Incident Calcification in Separate Aortic Segments After 5 Years, Distributed in Different Categories Depending on Baseline Amount of Coronary Artery Calcification
Table S4. Coronary Artery Calcification Progression Over 5 Years, Distributed by Slow, Expected, and Fast Progression Depending on Baseline Amount of Thoracic Aorta Calcification in Separate Aortic Segments
Figure S1. Flow diagram of the original study participants and steps of exclusion, resulting in participants eligible for final analysis.