

Abstract
Background
The association between obesity and mortality risks following coronary revascularization is not clear. We examined the associations of BMI (kg/m2) with short‐, intermediate‐, and long‐term mortality following coronary artery bypass graft surgery (CABG) and percutaneous coronary intervention (PCI) in patients with different coronary anatomy risks and diabetes mellitus status.
Methods and Results
Data from the Alberta Provincial Project for Outcomes Assessment in Coronary Heart Disease (APPROACH) registry were analyzed. Using normal BMI (18.5–24.9) as a reference, multivariable‐adjusted hazard ratios for all‐cause mortality within 6 months, 1 year, 5 years, and 10 years were individually calculated for CABG and PCI with 4 prespecified BMI categories: overweight (25.0–29.9), obese class I (30.0–34.9), obese class II (35.0–39.9), and obese class III (≥40.0). The analyses were repeated after stratifying for coronary risks and diabetes mellitus status. The cohorts included 7560 and 30 258 patients for CABG and PCI, respectively. Following PCI, overall mortality was lower in patients with overweight and obese class I compared to those with normal BMI; however, 5‐ and 10‐year mortality rates were significantly higher in patients with obese class III with high‐risk coronary anatomy, which was primarily driven by higher mortality rates in patients without diabetes mellitus (5‐year adjusted hazard ratio, 1.78 [95% CI, 1.11–2.85] and 10‐year adjusted hazard ratio, 1.57 [95% CI, 1.02–2.43]). Following CABG, overweight was associated with lower mortality risks compared with normal BMI.
Conclusions
Overweight was associated with lower mortality following CABG and PCI. Greater long‐term mortality in patients with obese class III following PCI, especially in those with high‐risk coronary anatomy without diabetes mellitus, warrants further investigation.
Keywords: cardiovascular disease, coronary artery bypass graft surgery, diabetes mellitus, obesity, percutaneous coronary intervention
Subject Categories: Cardiovascular Surgery; Complications; Mortality/Survival; Obesity; Diabetes, Type 2
Introduction
The prevalence of obesity in Canada has increased across all obesity classes.1, 2 Greater body mass increases the risk of cardiovascular disease,3 and a larger population of patients with obesity are considered for some form of revascularization procedures.4 The prevalence of diabetes mellitus (DM) has also increased in parallel with an increase in obesity.5 DM is a major risk factor for cardiovascular disease, and, in Canada, the proportion of patients with DM undergoing cardiac revascularization procedures increased by ≈50% between 1994 and 2005.6 Thus, patients with obesity and/or DM constitute an important segment of the patient population requiring cardiac revascularization.
Both coronary artery bypass graft (CABG) surgery and percutaneous coronary intervention (PCI) have been used to treat patients with coronary artery disease. Interestingly, although higher body mass increases the risk for all‐cause mortality7 and is commonly perceived as a risk factor for perioperative morbidity and mortality, better prognostic outcomes following revascularization have frequently been reported for patients with obesity. This is now commonly termed the “obesity paradox.” Systematic reviews and meta‐analyses have consistently shown that following both CABG and PCI, patients with obesity are at similar or lower risk for adverse outcomes8, 9, 10, 11 with a possible exception of patients with more advanced obesity (ie, moderate to severe obesity, BMI ≥35).9, 11
Regardless of the frequently reported existence of the obesity paradox, how coexisting DM influences the phenomenon has been less studied. DM has been implicated to account for suboptimal short‐term (within 1 year) survival following CABG12, 13, 14 and PCI,15, 16 but its longer‐term impact on survival is equivocal, with some studies showing increased mortality compared with patients without DM,13, 16 while others show no difference17, 18 or better survival.19 These inconsistent outcomes are at least partially attributable to different degrees of coronary anatomy risks at revascularization.
To date, few studies have investigated the mortality associated with obesity following cardiac revascularization while accounting for coronary anatomy risks and DM status. Moreover, earlier studies that examined the impact of perioperative obesity primarily focused on short‐term outcomes utilizing different BMI categorizations from current international20 or national21 guidelines. As different factors may influence short‐ versus long‐term postoperative mortality, following patients over extended periods (10 years) using up‐to‐date BMI categorization would provide a more comprehensive view on the associations between BMI and postrevascularization mortality. The purpose of this study was to examine mortality risks associated with obesity in light of coronary anatomy risks and DM status on short‐, intermediate‐ and long‐term mortality following CABG and PCI.
Methods
This study used data from the Alberta Provincial Project for Outcomes Assessment in Coronary Heart Disease (APPROACH) registry in conjunction with postoperative mortality determined from the Vital Statistics Registry. Detailed descriptions of the APPROACH registry have been reported elsewhere.22 Briefly, the APPROACH registry is a population‐based database that prospectively captures all patients referred for cardiac catheterization and subsequent revascularization procedures undertaken in the province of Alberta, Canada. Ethical approval was obtained from the University of Alberta Health Research Ethics Board. Because data were obtained from a clinical registry, the need for informed consent was waived.
Study Population
Patients in the study included adult residents referred for CABG or PCI between April 2003 and March 2014 in Alberta, Canada. CABG and PCI groups were chosen based on the first procedure within 1 year of cardiac catheterization. Height and weight were measured at the time of index catheterization with a standard mechanical beam scale with patients wearing a hospital gown. BMI (weight [kg] over height squared [m2]) was calculated for each patient. Patients were then categorized into normal BMI (18.5–24.9 kg/m2), overweight (25.0–29.9 kg/m2), obese class I (30.0–34.9 kg/m2), obese class II (35.0–39.9 kg/m2), and obese class III (≥40.0 kg/m2)20, 21 groups. Patients with BMI <18.5 kg/m2 (underweight) were excluded from the study.
Baseline Measures
Demographic and clinical variables collected at the time of cardiac catheterization included age, sex, BMI, concomitant diseases (ie, cerebrovascular disease, congestive heart failure, DM, dialysis, hyperlipidemia, hypertension, liver disease, gastrointestinal disease, malignancy, peripheral vascular disease, pulmonary disease, and renal disease), smoking status, prior event/treatment (ie, prior CABG, PCI, and myocardial infarction), indication for catheterization (ie, stable and unstable angina, myocardial infarction, and others), ejection fraction (>50%, 35–50%, 20–34%, and <20%), and extent of coronary disease. Concomitant diseases were collected as yes/no binary variables. Pulmonary complications included pulmonary edema and/or pulmonary embolism. Renal complication was defined as a postoperative creatinine level >200 μmol/L.
Study Outcomes
The primary outcomes were all‐cause short‐term (ie, within 6 months and 1 year), intermediate‐term (within 5 years), and long‐term (within 10 years) mortality associated with different degrees of obesity following CABG and PCI. To account for the influence of extent of coronary anatomy involvement on mortality rates, mortality risks were separately assessed for low‐risk and high‐risk coronary anatomy groups. A vessel with a lesion involving >50% of its diameter was considered a diseased vessel. Extent of coronary disease was divided into low risk (ie, lesions with <50% stenosis, 1‐ or 2‐vessel disease) and high risk (ie, 2‐vessel disease involving the proximal left anterior descending artery or left main artery disease, 3‐vessel disease, or left main artery disease). Subsequently, we examined the mortality rates associated with different BMI categories while concurrently stratifying for both coronary anatomy risks and DM status. Patients were identified as having DM based on a recorded history of such or if they were receiving insulin or oral hypoglycemic agents.
Statistical Analysis
Means and SDs were used for continuous variables, and counts and percentages were used for categorical variables. Baseline characteristics were compared across BMI categories using ANOVA for continuous variables and chi‐square test for categorical variables. Where a significant difference was found, each group was compared against the normal BMI group by using post hoc pairwise comparisons with Bonferroni adjustment. The analyses were performed separately for CABG and PCI recipients.
We used a multivariable Cox proportional hazards regression model to evaluate associations between BMI and all‐cause mortality within 6 months, 1 year, 5 years, and 10 years, respectively. The analyses were adjusted for clinical covariates including age, sex, concomitant diseases, smoking status, prior cardiac events/treatment, and ejection fraction. All concomitant diseases were chosen a priori and simultaneously included in the multivariable models as independent covariates to adjust for potential confounding in the regression analyses. Statistical analyses were performed with StataCorp 2013 (Stata Statistical Software, Release 13, College Station, TX: StataCorp LP). P values <0.05 values were considered significant.
Results
Study Sample
Between 2003 and 2014, 7560 patients underwent CABG and 30 228 underwent PCI. Of 7560 CABG and 30 258 PCI recipients, 2749 (36.4%) and 6793 (22.5%) patients, respectively, had DM. Preoperative demographic and clinical characteristics according to BMI categories for patients treated with CABG and PCI are summarized in Tables 1 and 2, respectively. Considerable differences in baseline characteristics among BMI categories were found. In both patients who underwent CABG and PCI, compared with those with normal BMI, patients with overweight and obesity were characterized by younger age (both P<0.001) and higher prevalence of DM, hyperlipidemia, and hypertension (all P<0.001). The overall proportions of men were significantly higher for the overweight and obese class I groups; however, the proportion of men in the obese class II and obese class III groups was lower in patients treated with PCI.
Table 1.
Distribution of Demographic and Clinical Variables for CABG Patients by BMI Groups
| Characteristics | Normal (18.5–24.9) | Overweight (25.0–29.9) | Obese Class I (30.0–34.9) | Obese Class II (35.0–39.9) | Obese Class III (≥40.0) | P Value |
|---|---|---|---|---|---|---|
| Participants, No. (%) | 1509 (20) | 3080 (40.7) | 1942 (25.7) | 696 (9.2) | 333 (4.3) | |
| Age (SD), y | 68.8 (10.6) | 67.2 (10.4)a | 65.8 (9.8)a | 63.5 (9.6)a | 62.0 (9.3)a | <0.001 |
| Men, No. (%) | 1167 (77.3) | 2598 (84.4)a | 1592 (82.0)a | 544 (78.2) | 252 (75.7) | <0.001 |
| Height, mean (SD), cm | 170.2 (12.1) | 171.1 (11.0)a | 171.0 (8.9) | 169.5 (14.8) | 167.6 (11.7)a | <0.001 |
| Weigh, mean (SD), kg | 67.2 (8.9) | 80.8 (9.1)a | 94.3 (10.5)a | 107.7 (12.4)a | 125.4 (19.8)a | <0.001 |
| Concomitant disease, No. (%) | ||||||
| Cerebrovascular disease | 141 (9.3) | 229 (7.4)a | 112 (5.8)a | 45 (6.5)a | 25 (7.5) | 0.002 |
| Congestive heart failure | 151 (10.0) | 268 (8.7) | 166 (8.6) | 63 (9.1) | 37 (11.1) | 0.350 |
| Diabetes mellitus | 383 (25.4) | 1006 (32.7)a | 795 (40.9)a | 357 (51.3)a | 208 (62.5)a | <0.001 |
| Dialysis | 35 (2.3) | 37 (1.2)a | 18 (0.9)a | 8 (1.2) | 8 (2.4) | 0.003 |
| Hyperlipidemia | 1196 (79.3) | 2535 (82.3)a | 1678 (86.4)a | 612 (87.9)a | 287 (86.2)a | <0.001 |
| Hypertension | 1048 (69.5) | 2334 (75.8)a | 1597 (82.2)a | 593 (85.2)a | 285 (85.6)a | <0.001 |
| Liver or gastrointestinal disease | 49 (3.3) | 115 (3.7) | 62 (3.2) | 26 (3.7) | 8 (2.4) | 0.629 |
| Malignancy | 29 (1.9) | 64 (2.1) | 51 (2.6) | 14 (2.0) | 5 (1.5) | 0.515 |
| Peripheral vascular disease | 222 (14.7) | 328 (10.7)a | 205 (10.6)a | 73 (10.5)a | 29 (8.7)a | <0.001 |
| Pulmonary disease | 163 (10.8) | 300 (9.7) | 189 (9.7) | 85 (12.2) | 51 (15.3)a | 0.008 |
| Renal disease | 105 (7.0) | 200 (6.5) | 120 (6.2) | 60 (8.6) | 26 (7.8) | 0.208 |
| Smoking status, No. (%) | b | b | b | b | <0.001 | |
| Never | 301 (20.0) | 563 (18.3) | 332 (17.1) | 123 (17.7) | 65 (19.5) | |
| Former smoker | 479 (31.7) | 1223 (39.7) | 823 (42.4) | 314 (45.1) | 134 (40.2) | |
| Current smoker | 433 (28.7) | 717 (23.3) | 477 (24.6) | 140 (20.1) | 72 (21.6) | |
| Unknown | 296 (19.6) | 577 (18.7) | 310 (16.0) | 119 (17.1) | 62 (18.6) | |
| Prior event/treatment, No. (%) | ||||||
| CABG | 2 (0.1) | 5 (0.2) | 8 (0.4) | 0 (0) | 0 (0) | 0.133 |
| Myocardial infarction | 312 (20.7) | 651 (21.1) | 462 (23.8) | 143 (20.6) | 80 (24.0) | 0.090 |
| Percutaneous coronary intervention | 181 (12.0) | 472 (15.3)a | 321 (16.5)a | 95 (13.7) | 57 (17.1)a | 0.002 |
| Indication for catheterization | b | b | b | <0.001 | ||
| Stable angina | 597 (39.6) | 1365 (44.3) | 935 (48.2) | 313 (45.0) | 158 (47.5) | |
| Myocardial infarction | 564 (37.4) | 1054 (34.2) | 649 (33.4) | 238 (34.2) | 115 (34.5) | |
| Unstable angina | 205 (13.6) | 435 (14.1) | 247 (12.7) | 90 (12.9) | 49 (14.7) | |
| Other | 143 (9.5) | 226 (7.3) | 111 (5.7) | 55 (7.9) | 11 (3.3) | |
| Ejection fraction, No. (%) | b | b | 0.039 | |||
| >50% | 523 (34.7) | 1156 (37.5) | 778 (40.1) | 275 (39.5) | 128 (38.4) | |
| 35% to 50% | 301 (20.0) | 606 (19.7) | 379 (19.5) | 137 (19.7) | 64 (19.2) | |
| 20% to 34% | 80 (5.3) | 164 (5.3) | 94 (4.8) | 30 (4.3) | 22 (6.6) | |
| <20% | 28 (1.9) | 37 (1.2) | 23 (1.8) | 5 (0.7) | 8 (2.4) | |
| Not performed | 232 (15.4) | 414 (13.4) | 230 (11.8) | 78 (11.2) | 34 (10.2) | |
| Missing | 345 (22.9) | 703 (22.8) | 438 (22.6) | 171 (24.6) | 77 (23.1) | |
| Extent of coronary disease, No. (%) | 0.067 | |||||
| Low risk | 255 (16.9) | 438 (14.2) | 258 (13.3) | 100 (14.4) | 43 (12.9) | |
| High risk | 1238 (82.0) | 2607 (84.7) | 1667 (85.9) | 587 (84.3) | 288 (86.5) | |
| Missing | 16 (1.1) | 35 (1.1) | 17 (0.9) | 9 (1.3) | 2 (0.6) | |
CABG indicates coronary artery bypass graft surgery. Low risk indicates lesions with <50% stenosis, 1‐ or 2‐vessel disease. High risk indicates 2‐vessel disease with proximal left anterior descending artery or left main artery disease, 3‐vessel disease or left main artery disease.
Subgroup significantly different from the normal BMI group (P<0.05).
Significant difference in the distribution of the categories compared with normal BMI.
Table 2.
Distribution of Demographic and Clinical Variables for PCI Patients by BMI Groups
| Characteristics | Normal (18.5–24.9) | Overweight (25–29.9) | Obese Class I (30–34.9) | Obese Class II (35–39.9) | Obese Class III (≥40) | P Value |
|---|---|---|---|---|---|---|
| Participants, No. (%) | 6629 (21.9) | 12 591 (41.6) | 7405 (24.5) | 2506 (8.3) | 1127 (3.7) | |
| Age (SD), y | 65.3 (12.5) | 62.5 (11.8)a | 60.5 (11.2)a | 59.1 (11.0)a | 58.5 (10.2)a | <0.001 |
| Men, No. (%) | 4627 (69.8) | 10 175 (80.8)a | 5869 (79.3)a | 1870 (74.6)a | 700 (62.1)a | <0.001 |
| Height, mean (SD), cm | 170.6 (9.7) | 172.5 (9.0)a | 172.1 (9.5)a | 171.0 (10.2)a | 167.8 (10.9)a | <0.001 |
| Weigh, mean (SD), kg | 67.1 (9.2) | 82.1 (9.7)a | 95.4 (11.2)a | 108.5 (13.1)a | 124.2 (17.0)a | <0.001 |
| Concomitant disease, No. (%) | ||||||
| Cerebrovascular disease | 375 (5.7) | 546 (4.3)a | 312 (4.2)a | 95 (3.8)a | 48 (4.3) | <0.001 |
| Congestive heart failure | 528 (8.0) | 785 (6.2)a | 493 (6.7)a | 207 (8.3) | 139 (12.3)a | <0.001 |
| Diabetes mellitus | 1039 (15.7) | 2352 (18.7)a | 1981 (26.8)a | 885 (35.3)a | 536 (47.6)a | <0.001 |
| Dialysis | 64 (1.0) | 75 (0.6)a | 40 (0.5)a | 18 (0.7) | 12 (1.1) | 0.008 |
| Hyperlipidemia | 4274 (64.5) | 9042 (71.8)a | 5537 (74.8)a | 1894 (75.6)a | 886 (78.6)a | <0.001 |
| Hypertension | 3813 (57.5) | 7851 (62.4)a | 5232 (70.7)a | 1593 (77.9)a | 909 (80.7)a | <0.001 |
| Liver or gastrointestinal disease | 465 (7.0) | 858 (6.8) | 452 (6.1) | 161 (6.4) | 75 (6.7) | 0.220 |
| Malignancy | 274 (4.1) | 433 (3.4) | 214 (2.9)a | 65 (2.6)a | 32 (2.8) | <0.001 |
| Peripheral vascular disease | 495 (7.5) | 798 (6.3)a | 531 (7.2) | 165 (6.6) | 78 (6.9) | 0.031 |
| Pulmonary disease | 872 (13.2) | 1234 (9.8)a | 852 (11.5)a | 323 (12.9) | 220 (19.5)a | <0.001 |
| Renal disease | 237 (3.6) | 376 (3.0) | 216 (2.9) | 75 (3.0) | 43 (3.8) | 0.084 |
| Smoking status, No. (%) | b | b | b | b | <0.001 | |
| Never | 2754 (41.5) | 4800 (38.1) | 2552 (34.5) | 844 (33.7) | 381 (33.8) | |
| Former smoker | 2410 (36.4) | 4170 (33.1) | 2518 (34.0) | 921 (36.8) | 376 (33.4) | |
| Current smoker | 1465 (22.1) | 3621 (28.8) | 2335 (31.5) | 741 (29.6) | 370 (32.8) | |
| Prior event/treatment, No. (%) | ||||||
| Coronary artery bypass grafting | 137 (2.1) | 253 (2.0) | 157 (2.1) | 47 (1.9) | 15 (1.3) | 0.489 |
| Myocardial infarction | 946 (14.3) | 1725 (13.7) | 1059 (14.3) | 367 (14.6) | 177 (15.7) | 0.282 |
| PCI | 272 (4.1) | 559 (4.4) | 362 (4.9) | 100 (4.0) | 43 (3.8) | 0.111 |
| Prior lytic therapy | 503 (7.6) | 994 (7.9) | 616 (8.3) | 174 (6.9) | 73 (6.5) | 0.071 |
| Indication for catheterization, No. (%) | b | b | b | b | <0.001 | |
| Stable angina | 1106 (16.7) | 2506 (19.9) | 1533 (20.7) | 549 (21.9) | 241 (21.4) | |
| Myocardial infarction | 4680 (70.6) | 8357 (66.4) | 4869 (65.8) | 1642 (65.5) | 730 (64.8) | |
| Unstable angina | 764 (11.5) | 1550 (12.3) | 903 (12.2) | 285 (11.4) | 139 (12.3) | |
| Other | 79 (1.2) | 178 (1.4) | 100 (1.4) | 30 (1.2) | 17 (1.5) | |
| Ejection fraction, No. (%) | b | b | b | b | <0.001 | |
| >50% | 3441 (51.9) | 7013 (55.7) | 4120 (55.6) | 1384 (55.2) | 565 (50.1) | |
| 35% to 50% | 1379 (20.8) | 2415 (19.2) | 1394 (18.8) | 476 (19.0) | 206 (18.3) | |
| 20% to 34% | 269 (4.1) | 427 (3.4) | 201 (2.7) | 66 (2.6) | 37 (3.3) | |
| <20% | 54 (0.8) | 95 (0.8) | 37 (0.5) | 13 (0.5) | 8 (0.7) | |
| Not performed | 680 (10.3) | 1143 (9.1) | 994 (13.4) | 214 (8.5) | 176 (15.6) | |
| Missing | 806 (12.2) | 1498 (11.9) | 438 (22.6) | 353 (14.1) | 77 (23.1) | |
| Extent of coronary disease, No. (%) | b | b | b | b | <0.001 | |
| Low risk | 4192 (63.3) | 8012 (63.6) | 4882 (65.9) | 1701 (67.9) | 778 (69.1) | |
| High risk | 2417 (36.4) | 4537 (36.1) | 2506 (33.8) | 794 (31.7) | 345 (30.7) | |
| Missing | 20 (0.3) | 42 (0.3) | 17 (0.2) | 11 (0.4) | 4 (0.4) | |
PCI indicates percutaneous coronary intervention. Low risk indicates lesions with <50% stenosis, 1‐ or 2‐vessel disease. High risk indicates 2‐vessel disease with proximal left anterior descending artery or left main artery disease, 3‐vessel disease, or left main artery disease.
Subgroup significantly different from the normal BMI group (P<0.05).
Significant difference in the distribution of the categories compared with normal BMI.
Relationship Between BMI and Mortality Following Coronary Artery Bypass Graft Surgery
Crude number of deaths following CABG are summarized in Table 3. Overall covariate‐adjusted 5‐ and 10‐year mortality risks were lower in patients with overweight compared with patients with normal BMI (5‐year: adjusted hazard ratio [aHR], 0.80 [95% CI, 0.68–0.95] and 10‐year: aHR, 0.83 [95% CI, 0.73–0.95]; Figure 1). Subgrouping into high‐risk and low‐risk coronary anatomy revealed that lower overall mortality in patients with overweight was primarily due to lower mortality in patients with high‐risk coronary anatomy (5‐year: aHR, 0.76 [95% CI, 0.71–0.95] and 10‐year: aHR, 0.82 [95% CI, 0.71–0.96]; Figure 1).
Table 3.
Cumulative Crude Incidence of Deaths
| 6 Months | 1 Year | 5 Years | 10 Years | |
|---|---|---|---|---|
| Death, No. (%) | ||||
| CABG | 268 (3.5) | 347 (4.6) | 932 (12.3) | 1446 (19.1) |
| PCI | 729 (2.4) | 929 (3.1) | 2178 (7.2) | 2790 (9.2) |
CABG indicates coronary artery bypass graft surgery; PCI, percutaneous coronary intervention.
Figure 1.
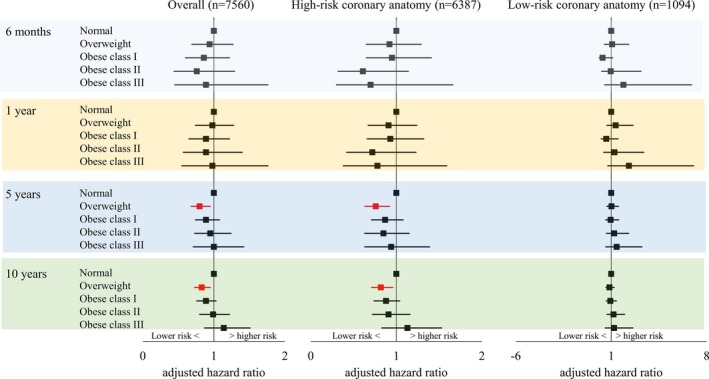
Adjusted mortality risks for patients treated with coronary artery bypass graft surgery by BMI.
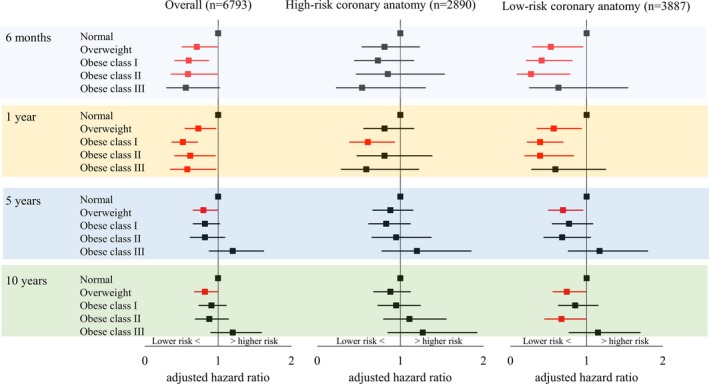
After stratifying for DM status, compared with normal BMI, overweight in the subgroup of DM and high‐risk coronary anatomy was associated with significantly lower mortality at 6 months (aHR, 0.59 [95% CI, 0.35–1.00]) and 1 year (aHR, 0.60 [95% CI, 0.38–0.95]; Figure 2). Similarly, in patients without DM, patients with overweight in the subgroup of high‐risk coronary anatomy showed significantly lower 5‐year mortality and near significantly lower 10‐year mortality (5‐year: aHR, 0.79 [95% CI, 0.62–1.00] and 10‐year: aHR 0.84 [95% CI, 0.70–1.02]; Figure 3). There were no differences in mortality between the normal BMI and the obese groups.
Figure 2.
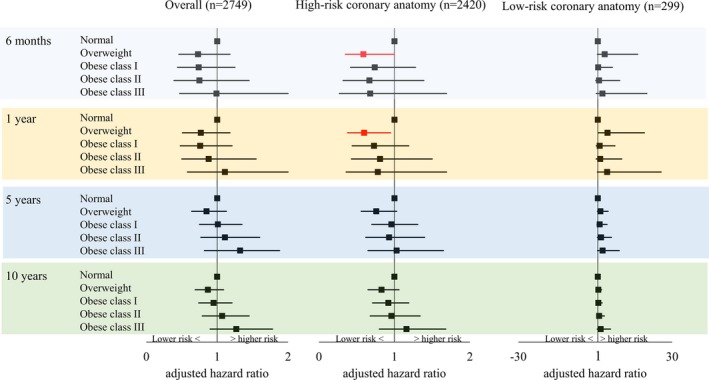
Adjusted mortality risks for patients with diabetes mellitus treated with coronary artery bypass graft surgery by BMI.
Figure 3.
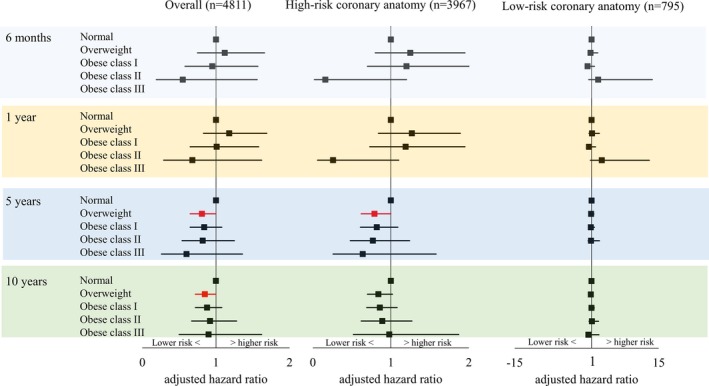
Adjusted mortality risks for patients without diabetes mellitus treated with coronary artery bypass graft surgery by BMI. No estimates were available for patients with obese class III for 6‐month and 1‐year mortalities due to limited sample size. Similarly, no estimate was available for 5‐year mortality for patients with obese class III in the subgroup of low‐risk coronary anatomy.
Relationship Between BMI and Mortality Following Percutaneous Coronary Intervention
The crude number of deaths following PCI are also summarized in Table 3. Overall mortality was consistently lower in patients with overweight and obese class I compared with patients with normal BMI regardless of follow‐up duration. This was due to significantly or near‐significantly lower mortality risks in both high‐risk and low‐risk coronary anatomy subgroups (Figure 4). Contrarily, patients with obese class III showed higher overall 5‐ and 10‐year mortality risks compared with patients with normal BMI (5‐year: aHR, 1.35 [95% CI, 1.09–1.67] and 10‐year: aHR, 1.28 [95% CI, 1.05–1.55]; Figure 4). This was primarily driven by significantly higher mortality risks in the subgroup with high‐risk coronary anatomy (5‐year: aHR, 1.38 [95% CI, 1.01–1.88] and 10‐year: aHR, 1.34 [95% CI, 1.00–1.79]; Figure 4).
Figure 4.
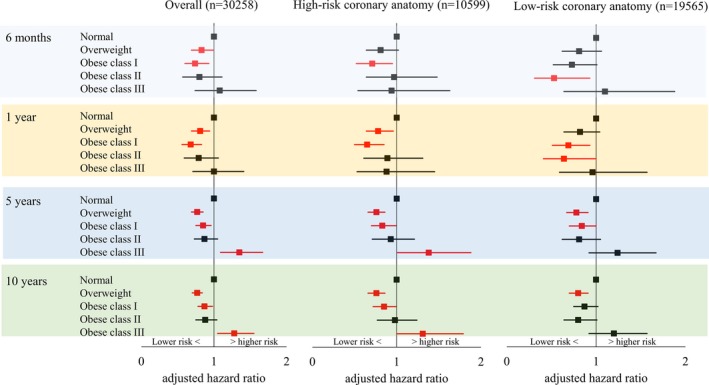
Adjusted mortality risks for patients treated with percutaneous coronary intervention by BMI.
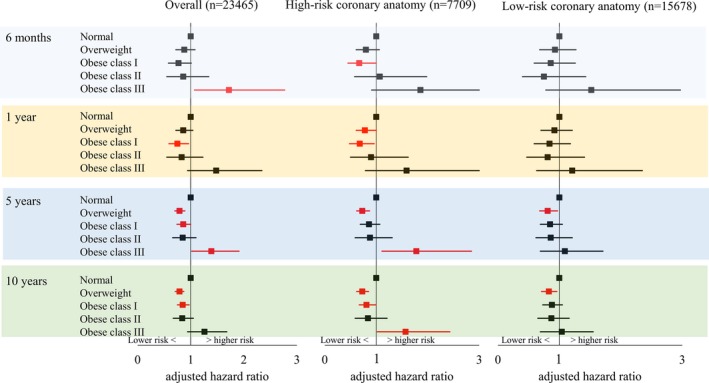
In the subgroup of patients with DM, compared with patients with normal BMI, overall 6‐month and 1‐year mortality risks were significantly lower in patients with overweight, obese class I, and obese class II. In addition, obese class III was associated with near‐significantly lower mortality at 6 months (aHR, 0.56 [95% CI, 0.30–1.02]) and significantly lower mortality at 1 year (aHR, 0.58 [95% CI, 0.35–0.97]; Figure 5). At 6 months and 1 year, lower mortality risks in patients with low‐risk coronary anatomy were the primary contributor to the lower overall mortality. Five‐ and 10‐year overall mortality risks were significantly lower only in patients with overweight compared with patients with normal BMI (5‐year: aHR, 0.80 [95% CI, 0.66–0.99] and 10‐year: aHR, 0.82 [95% CI, 0.68–0.99]), which was also primarily attributable to lower mortality in the subgroup with low‐risk coronary anatomy (5‐year: aHR, 0.69 [95% CI, 0.50–0.95] and 10‐year: aHR, 0.74 [95% CI, 0.56–0.99]; Figure 5). While the overall mortality was not different from normal BMI, obese class II in the subgroup of low‐risk coronary anatomy was also associated with lower 10‐year mortality (aHR, 0.67 [95% CI, 0.45–0.99]; Figure 5).
Figure 5.
Adjusted mortality risks for patients with diabetes mellitus treated with percutaneous coronary intervention by BMI.
In the subgroup of patients with no DM, obese class III was significantly associated with higher overall 6‐month and 5‐year mortality risks, respectively (6‐month: aHR 1.72 [95% CI 1.07–2.77]; and 5‐year: aHR 1.39 [95% CI 1.02–1.91]; Figure 6). Further stratifying for coronary anatomy risks revealed that patients with obese class III with high‐risk coronary anatomy had higher 5‐ and 10‐year mortality risks (5‐year: aHR, 1.78 [95% CI, 1.11–2.85] and 10‐year: aHR, 1.57 [95% CI, 1.02–2.43]; Figure 6).
Figure 6.
Adjusted mortality risks for patients without diabetes mellitus treated with percutaneous coronary intervention by BMI.
Discussion
To date, evidence on the relationship between obesity and outcomes following cardiac revascularization has shown contradicting results. This is at least partly due to heterogeneous criteria for obesity and different end points. Consequently, we investigated the associations of obesity based on current national and international criteria with short‐term (6 months to 1 year), intermediate‐term (5 years), and long‐term (10 years) mortality. Using patients with normal BMI as a reference, the primary findings of the present study include the following: (1) higher intermediate‐term and long‐term morality risks following PCI in patients with obese class III; (2) lower short‐term, intermediate‐term, and long‐term mortality following PCI in patients with overweight and obese class I; and (3) lower intermediate‐term and long‐term mortality in the overweight group, but no differences in mortality in the obese groups following CABG.
To the best of our knowledge, this study is the first to show higher intermediate‐ and long‐term mortality risks in patients with obese class III (BMI ≥40 kg/m2) compared with patients with normal BMI following PCI, supporting the importance of efforts to prevent and treat severe obesity.23, 24 In the upper part of its distribution, BMI has a better ability to differentiate the percent body fat and lean body mass,25 and highly correlates with percent body fat.26 Consequently, higher mortality in patients with obese class III is likely attributable to a higher degree of adiposity. Stratification by coronary anatomy risks revealed that higher overall mortality in patients with obese class III was primarily due to higher mortality in patients with high‐risk coronary anatomy (38% and 34% higher at 5 and 10 years, respectively). Our recent study based on the same cohorts showed that patients with obese class III and high‐risk coronary anatomy are more likely to receive PCI compared with patients with normal BMI.27 Thus, our results highlight that, compared with patients with normal BMI, patients with obese class III with high‐risk coronary anatomy are more likely to be treated with PCI despite a higher chance of intermediate‐ and long‐term death following the treatment. Higher risk of perioperative infection in patients with obese class III28 may be a contributing factor for higher rates of PCI treatment. However, patients with obese class III were younger and showed no association with the risk of mortality following CABG. Thus, further study is warranted to clarify the use of PCI in patients with obese class III.
In patients with obese class III and high‐risk coronary anatomy undergoing PCI, we expected that those with DM would contribute more strongly to higher intermediate‐ and long‐term mortality owing to a greater atherogenic impact of DM.29 However, stratifying for DM status showed that intermediate‐ and long‐term mortality in patients with obese class III were only higher in those without DM (78% higher at 5 years and 57% higher at 10 years compared with those with normal BMI). Because a markedly smaller number of patients with DM were treated with PCI compared with those without DM among patients with high‐risk coronary anatomy (n=2890 versus n=7709), this could simply be due to a difference in statistical power. Alternatively, it could also be explained by more intense pharmacological treatment in patients with DM.30 In patients with obese class III compared with those with normal BMI, short‐term mortality was higher in those without DM, whereas it was lower in those with DM. This may also be attributable to different pharmacological treatments. Thus, our results may suggest the requirement for greater postoperative intervention to lower the mortality risk in patients with obese class III with high‐risk coronary anatomy even in the absence of DM.
In contrast to higher mortality observed in patients with obese class III, following PCI, patients with overweight and obese class I consistently showed significantly or near‐significantly lower mortality risks compared with patients with normal BMI regardless of follow‐up duration or coronary anatomy risks. In addition, obese class II in the subgroup of low‐risk coronary anatomy was significantly associated with lower short‐term and long‐term mortality risks. Thus, our results are in line with previous meta‐analyses demonstrating the obesity paradox in 1‐year31 and 5‐year8 mortality risks in patients with obesity (BMI ≥30 kg/m2) but provide further details by breaking down obesity into different categories. Similarly, following CABG, adjusted intermediate‐ and long‐term mortality rates were lower in patients with overweight compared with those with normal BMI, which was primarily driven by lower mortality in the subgroup with high‐risk coronary anatomy. This is also similar to a previous study showing a 5‐year survival difference in patients with overweight and obese class I (BMI 25–34.9 kg/m2) following CABG compared with those with normal BMI.32 Stamou and colleagues33 also reported a lower 5‐year mortality rate in patients with overweight compared with patients with normal BMI following CABG. Thus, we extend previous findings by reporting that the survival difference may be extended up to 10 years.
It is important to note that, as others have also reported, this apparent paradox may be related to the use of BMI as a surrogate measure for obesity. Indeed, the obesity paradox is almost exclusively reported in studies using BMI to define obesity, with the exception of a few studies reporting a paradoxical association between percent body fat and mortality34, 35, 36 based on relatively small sample sizes and skinfold‐estimated percent body fat. Direct measures of body fat with dual X‐ray absorptiometry with a larger sample size have recently refuted the obesity paradox37 although the study was conducted in participants referred for bone mineral density testing and may have limited generalizability. Diagnostic performance of BMI to discriminate between percent body fat and lean body mass is relatively poor,38 especially in the intermediate BMI ranges25 as BMI in the intermediate range associates similarly with percent body fat and lean muscle mass as measured by dual X‐ray absorptiometry.39 Higher lean mass in patients with high body fat is associated with lower mortality risks compared with patients with low body fat and low lean mass.40, 41 Additionally, central obesity in patients with normal BMI is associated with higher mortality than those with lower central obesity or those with similar central obesity and higher BMI.42 Thus, lower mortality rates in those with high BMI can be due to higher muscle mass.43, 44 Alternatively, it is also possible that lower mortality was due to higher cardiorespiratory fitness45, 46 as higher fitness is able to counteract the adverse effects of obesity on the risk of cardiovascular mortality.23, 24, 47, 48 Altogether, the obesity paradox is still open for debate, and our results may be premature to be interpreted as a survival advantage of obesity but should stimulate further research to clarify the associations.
By performing analyses separately based on DM status, we also showed that, in the subgroup with DM and high‐risk coronary anatomy, patients with overweight are significantly less likely to experience short‐term death (41% at 6 months and 40% at 1 year) compared with patients with normal BMI following CABG. This is similar to a previous study in patients with DM that showed a nonsignificant but lower 30‐day mortality rate in patients with overweight.49 Interestingly, lower short‐term mortality was not observed in patients with overweight in the subgroup with no DM. With respect to intermediate‐ and long‐term mortality risks in patients with DM, despite the higher incidence of metabolic clustering (ie, hyperglycemia, hypertension, and hypertriglyceridemia50) and higher risks of atherogenic progression following CABG in patients with higher BMI,51 obesity was not associated with higher mortality. This is in accordance with a previous study demonstrating no association between higher BMI and long‐term (up to 6 years) mortality following CABG.52 As we speculated for PCI outcomes, it is possible that the higher risk associated with the combination of obesity and DM was attenuated with more intense pharmacotherapy and more intense secondary prevention including implementation of healthy diet and exercise programs.9 Lastly, we did not observe any associations between BMI and mortality in the subgroup with low‐risk coronary anatomy following CABG. However, caution needs to be practiced to interpret this result due to small sample size and thus wide confidence intervals. Taken together, following CABG, only patients with overweight with high‐risk coronary anatomy showed lower intermediate‐ to long‐term mortality. No significant differences between the normal BMI and the obese groups suggest that obesity as determined based on BMI had little impact on mortality following CABG regardless of follow‐up duration.
Study Strengths and Limitations
A strength of registry data is that they record all revascularization procedures performed in the province and thus eliminate potential selection bias. Long follow‐up duration also allowed us to investigate the relationships between BMI and mortality at different follow‐up time from treatment. However, our results should be interpreted in the context of several important limitations. First, although the observational nature of our study provides real‐world data, it can only provide associative evidence, not causal. Second, as previously described, BMI is an aggregate of varying amounts of fat‐free mass and body fat, each of which contributes in its own way to the metabolic profiles of patients. Thus, our results may be explained by the lack of discriminatory power of BMI to differentiate between lean body mass and fat mass. Third, BMI was assessed at baseline only and we had no data on weight change over time. In addition, the other variables included in our study were also measured at baseline only. Fourth, because it is well established that there is little survival benefit of CABG in patients with low‐risk coronary anatomy, sample size was relatively small for the subgroup of patients with low‐risk coronary anatomy treated with CABG. Similarly, advantages of CABG in patients with high‐risk coronary anatomy and DM have been well documented. Consequently, sample size was also limited in the subgroup of patients with high‐risk coronary anatomy and DM who underwent PCI. Lastly, although we controlled for available confounding variables, residual confounding not included in our analysis, such as cardiorespiratory fitness,23, 24, 46, 47, 48 cannot be neglected. Likewise, while PCI technology continues to evolve and affects the occurrence of complications following PCI,28, 53 we did not account for changes in PCI techniques. To partially address this limitation, we repeated analyses with year of coronary revascularization included as a covariate. The outcomes from such analyses were consistent, suggesting that our findings are not affected by year of coronary procedures.
Conclusions
Among patients who had undergone PCI, in general, lower mortality risks were observed in patients with overweight, obese class I, and obese class II. Following CABG, while obesity did not contribute to a differential degree of mortality, being in the overweight category was associated with lower mortality. Given that patients with obese class III in the subgroup of high‐risk coronary anatomy and no DM had higher risks of intermediate‐ and long‐term mortality following PCI, greater postoperative intervention to lower the risk may be required for this group.
Sources of Funding
The program of research was supported by a Partnerships for Research and Innovation in the Health System (PRIHS) award from Alberta Innovates – Health Solutions (AIHS). The funding source had no role in the design, conduct, or reporting of the study. There are no relationships with industry to declare.
Disclosures
None.
(J Am Heart Assoc. 2017;6:e005335 DOI: 10.1161/JAHA.116.005335.)28411242
References
- 1. Katzmarzyk PT, Mason C. Prevalence of class I, II and III obesity in Canada. CMAJ. 2006;174:156–157. [DOI] [PMC free article] [PubMed] [Google Scholar]
- 2. Twells LK, Gregory DM, Reddigan J, Midodzi WK. Current and predicted prevalence of obesity in Canada: a trend analysis. CMAJ Open. 2014;2:E18–E26. [DOI] [PMC free article] [PubMed] [Google Scholar]
- 3. Hensrud DD, Klein S. Extreme obesity: a new medical crisis in the United States. Mayo Clin Proc. 2006;81:S5–S10. [DOI] [PubMed] [Google Scholar]
- 4. Cemerlic‐Adjic N, Pavlovic K, Jevtic M, Velicki R, Kostovski S, Velicki L. The impact of obesity on early mortality after coronary artery bypass grafting. Vojnosanit Pregl. 2014;71:27–32. [DOI] [PubMed] [Google Scholar]
- 5. Go AS, Mozaffarian D, Roger VL, Benjamin EJ, Berry JD, Blaha MJ, Dai S, Ford ES, Fox CS, Franco S, Fullerton HJ, Gillespie C, Hailpern SM, Heit JA, Howard VJ, Huffman MD, Judd SE, Kissela BM, Kittner SJ, Lackland DT, Lichtman JH, Lisabeth LD, Mackey RH, Magid DJ, Marcus GM, Marelli A, Matchar DB, McGuire DK, Mohler ER III, Moy CS, Mussolino ME, Neumar RW, Nichol G, Pandey DK, Paynter NP, Reeves MJ, Sorlie PD, Stein J, Towfighi A, Turan TN, Virani SS, Wong ND, Woo D, Turner MB; American Heart Association Statistics Committee and Stroke Statistics Subcommittee . Executive summary: heart disease and stroke statistics—2014 update a report from the American Heart Association. Circulation. 2014;129:399–410. [DOI] [PubMed] [Google Scholar]
- 6. Hassan A, Newman A, Ko DT, Rinfret S, Hirsch G, Ghali WA, Tu JV. Increasing rates of angioplasty versus bypass surgery in Canada, 1994–2005. Am Heart J. 2010;160:958–965. [DOI] [PubMed] [Google Scholar]
- 7. Berrington de Gonzalez A, Hartge P, Cerhan JR, Flint AJ, Hannan L, MacInnis RJ, Moore SC, Tobias GS, Anton‐Culver H, Freeman LB, Beeson WL, Clipp SL, English DR, Folsom AR, Freedman DM, Giles G, Hakansson N, Henderson KD, Hoffman‐Bolton J, Hoppin JA, Koenig KL, Lee IM, Linet MS, Park Y, Pocobelli G, Schatzkin A, Sesso HD, Weiderpass E, Willcox BJ, Wolk A, Zeleniuch‐Jacquotte A, Willett WC, Thun MJ. Body‐mass index and mortality among 1.46 million white adults. N Engl J Med. 2010;363:2211–2219. [DOI] [PMC free article] [PubMed] [Google Scholar]
- 8. Oreopoulos A, Padwal R, Norris CM, Mullen JC, Pretorius V, Kalantar‐Zadeh K. Effect of obesity on short‐ and long‐term mortality postcoronary revascularization: a meta‐analysis. Obesity (Silver Spring). 2008;16:442–450. [DOI] [PubMed] [Google Scholar]
- 9. Romero‐Corral A, Montori VM, Somers VK, Korinek J, Thomas RJ, Allison TG, Mookadam F, Lopez‐Jimenez F. Association of bodyweight with total mortality and with cardiovascular events in coronary artery disease: a systematic review of cohort studies. Lancet. 2006;368:666–678. [DOI] [PubMed] [Google Scholar]
- 10. Sharma A, Vallakati A, Einstein AJ, Lavie CJ, Arbab‐Zadeh A, Lopez‐Jimenez F, Mukherjee D, Lichstein E. Relationship of body mass index with total mortality, cardiovascular mortality, and myocardial infarction after coronary revascularization: evidence from a meta‐analysis. Mayo Clin Proc. 2014;89:1080–1100. [DOI] [PubMed] [Google Scholar]
- 11. Wang ZJ, Zhou YJ, Galper BZ, Gao F, Yeh RW, Mauri L. Association of body mass index with mortality and cardiovascular events for patients with coronary artery disease: a systematic review and meta‐analysis. Heart. 2015;101:1631–1638. [DOI] [PubMed] [Google Scholar]
- 12. Carson JL, Scholz PM, Chen AY, Peterson ED, Gold J, Schneider SH. Diabetes mellitus increases short‐term mortality and morbidity in patients undergoing coronary artery bypass graft surgery. J Am Coll Cardiol. 2002;40:418–423. [DOI] [PubMed] [Google Scholar]
- 13. Thourani VH, Weintraub WS, Stein B, Gebhart SS, Craver JM, Jones EL, Guyton RA. Influence of diabetes mellitus on early and late outcome after coronary artery bypass grafting. Ann Thorac Surg. 1999;67:1045–1052. [DOI] [PubMed] [Google Scholar]
- 14. Banning AP, Westaby S, Morice M, Kappetein AP, Mohr FW, Berti S, Glauber M, Kellett MA, Kramer RS, Leadley K, Dawkins KD, Serruys PW. Diabetic and nondiabetic patients with left main and/or 3‐vessel coronary artery disease comparison of outcomes with cardiac surgery and paclitaxel‐eluting stents. J Am Coll Cardiol. 2010;55:1067–1075. [DOI] [PubMed] [Google Scholar]
- 15. Elezi S, Kastrati A, Pache J, Wehinger A, Hadamitzky M, Dirschinger J, Neumann FJ, Schömig A. Diabetes mellitus and the clinical and angiographic outcome after coronary stent placement. J Am Coll Cardiol. 1998;32:1866–1873. [DOI] [PubMed] [Google Scholar]
- 16. Kip KE, Faxon DP, Detre KM, Yeh W, Kelsey SF, Currier JW. Coronary angioplasty in diabetic patients—the National Heart, Lung, and Blood Institute percutaneous transluminal corollary angioplasty registry. Circulation. 1996;94:1818–1825. [DOI] [PubMed] [Google Scholar]
- 17. Whang W, Bigger JT. Diabetes and outcomes of coronary artery bypass graft surgery in patients with severe left ventricular dysfunction: results from the CABG Patch Trial database. J Am Coll Cardiol. 2000;36:1166–1172. [DOI] [PubMed] [Google Scholar]
- 18. Calafiore AM, Di Mauro M, Di Giammarco G, Contini M, Vitolla G, Iacò AL, Canosa C, D'Alessandro S. Effect of diabetes on‐early and late survival after isolated first coronary bypass surgery in multivessel disease. J Thorac Cardiovasc Surg. 2003;125:144–154. [DOI] [PubMed] [Google Scholar]
- 19. Yamaguchi A, Kimura N, Itoh S, Adachi K, Yuri K, Okamura H, Adachi H. Efficacy of multiple arterial coronary bypass grafting in patients with diabetes mellitus. Eur J Cardiothorac Surg. 2016;50:520–527. [DOI] [PubMed] [Google Scholar]
- 20. World Health Organization . Obesity: preventing and managing the global epidemic: report of a WHO consultation. 2000;894:1–252. [PubMed] [Google Scholar]
- 21. Douketis JD, Paradis G, Keller H, Martineau C. Canadian guidelines for body weight classification in adults: application in clinical practice to screen for overweight and obesity and to assess disease. CMAJ. 2005;172:995–998. [DOI] [PMC free article] [PubMed] [Google Scholar]
- 22. Oreopoulos A, McAlister FA, Kalantar‐Zadeh K, Padwal R, Ezekowitz JA, Sharma AM, Kovesdy CP, Fonarow GC, Norris CM. The relationship between body mass index, treatment, and mortality in patients with established coronary artery disease: a report from APPROACH. Eur Heart J. 2009;30:2584–2592. [DOI] [PMC free article] [PubMed] [Google Scholar]
- 23. Lavie CJ, De Schutter A, Parto P, Jahangir E, Kokkinos P, Ortega FB, Arena R, Milani RV. Obesity and prevalence of cardiovascular diseases and prognosis‐the obesity paradox updated. Prog Cardiovasc Dis. 2016;58:537–547. [DOI] [PubMed] [Google Scholar]
- 24. Lavie CJ, McAuley PA, Church TS, Milani RV, Blair SN. Obesity and cardiovascular diseases. J Am Coll Cardiol. 2014;63:1345–1354. [DOI] [PubMed] [Google Scholar]
- 25. Romero‐Corral A, Somers VK, Sierra‐Johnson J, Jensen MD, Thomas RJ, Squires RW, Allison TG, Korinek J, Lopez‐Jimenez F. Diagnostic performance of body mass index to detect obesity in patients with coronary artery disease. Eur Heart J. 2007;28:2087–2093. [DOI] [PubMed] [Google Scholar]
- 26. Wellens R, Roche A, Khamis H, Jackson AS, Pollock ML, Siervogel RM. Relationships between the body mass index and body composition. Obes Res. 1996;4:35–44. [DOI] [PubMed] [Google Scholar]
- 27. Terada T, Johnson J, Norris C, Padwal R, Qiu W, Sharma AM, Nagendran J, Forhan M. Body mass index is associated with differential rates of coronary revascularization following cardiac catheterization. Can J Cardiol. Available at: http://www.onlinecjc.ca/article/S0828-282X(16)31176-X/abstract. Accessed March 26, 2017. [DOI] [PubMed] [Google Scholar]
- 28. Terada T, Johnson JA, Norris C, Padwal R, Qiu W, Sharma AM, Janzen W, Forhan M. Severe obesity is associated with increased risk of early complications and extended length of stay following coronary artery bypass grafting surgery. J Am Heart Assoc. 2016;5:e003282 DOI: 10.1161/JAHA.116.003282. [DOI] [PMC free article] [PubMed] [Google Scholar]
- 29. Korpilahti K, Syvanne M, Engblom E, Hämäläinen H, Puukka P, Rönnemaa T. Components of the insulin resistance syndrome are associated with progression of atherosclerosis in non‐grafted arteries 5 years after coronary artery bypass surgery. Eur Heart J. 1998;19:711–719. [DOI] [PubMed] [Google Scholar]
- 30. Lancefield T, Clark DJ, Andrianopoulos N, Brennan AL, Reid CM, Johns J, Freeman M, Charter K, Duffy SJ, Ajani AE, Proietto J, Farouque O. Is there an obesity paradox after percutaneous coronary intervention in the contemporary era? An analysis from a multicenter Australian registry. JACC Cardiovasc Interv. 2010;3:660–668. [DOI] [PubMed] [Google Scholar]
- 31. Bundhun PK, Li N, Chen M. Does an obesity paradox really exist after cardiovascular intervention? A systematic review and meta‐analysis of randomized controlled trials and observational studies. Medicine (Baltimore). 2015;94:e1910. [DOI] [PMC free article] [PubMed] [Google Scholar]
- 32. Johnson AP, Parlow JL, Whitehead M, Xu J, Rohland S, Milne B. Body mass index, outcomes, and mortality following cardiac surgery in Ontario, Canada. J Am Heart Assoc. 2015;4:e002140 DOI: 10.1161/JAHA.115.001977. [DOI] [PMC free article] [PubMed] [Google Scholar]
- 33. Stamou SC, Nussbaum M, Stiegel RM, Reames MK, Skipper ER, Robicsek F, Lobdell KW. Effect of body mass index on outcomes after cardiac surgery: is there an obesity paradox? Ann Thorac Surg. 2011;91:42–48. [DOI] [PubMed] [Google Scholar]
- 34. Lavie C, Osman A, Milani R, Mehra MR. Body composition and prognosis in chronic systolic heart failure: the obesity paradox. Am J Cardiol. 2003;91:891–894. [DOI] [PubMed] [Google Scholar]
- 35. Lavie CJ, Milani RV, Artham SM, Patel DA, Ventura HO. The obesity paradox, weight loss, and coronary disease. Am J Med. 2009;122:1106–1114. [DOI] [PubMed] [Google Scholar]
- 36. De Schutter A, Lavie CJ, Patel DA, Artham SM, Milani RV. Relation of body fat categories by Gallagher classification and by continuous variables to mortality in patients with coronary heart disease. Am J Cardiol. 2013;111:657–660. [DOI] [PubMed] [Google Scholar]
- 37. Padwal R, Leslie WD, Lix LM, Majumdar SR. Relationship among body fat percentage, body mass index, and all‐cause mortality. Ann Intern Med. 2016;164:532–541. [DOI] [PubMed] [Google Scholar]
- 38. Oreopoulos A, Fonarow GC, Ezekowitz JA, McAlister FA, Sharma AM, Kalantar‐Zadeh K, Norris CM, Johnson JA, Padwal RS. Do anthropometric indices accurately reflect directly measured body composition in men and women with chronic heart failure? Congest Heart Fail. 2011;17:90–92. [DOI] [PubMed] [Google Scholar]
- 39. Oreopoulos A, Ezekowitz JA, McAlister FA, Kalantar‐Zadeh K, Fonarow GC, Norris CM, Johnson JA, Padwal RS. Association between direct measures of body composition and prognostic factors in chronic heart failure. Mayo Clin Proc. 2010;85:609–617. [DOI] [PMC free article] [PubMed] [Google Scholar]
- 40. De Schutter A, Lavie CJ, Milani RV. The impact of obesity on risk factors and prevalence and prognosis of coronary heart disease‐the obesity paradox. Prog Cardiovasc Dis. 2014;56:401–408. [DOI] [PubMed] [Google Scholar]
- 41. Lavie CJ, De Schutter A, Patel DA, Romero‐Corral A, Artham SM, Milani RV. Body composition and survival in stable coronary heart disease impact of lean mass index and body fat in the “obesity paradox”. J Am Coll Cardiol. 2012;60:1374–1380. [DOI] [PubMed] [Google Scholar]
- 42. Coutinho T, Goel K, de Sa DC, Carter RE, Hodge DO, Kragelund C, Kanaya AM, Zeller M, Park JS, Kober L, Torp‐Pedersen C, Cottin Y, Lorgis L, Lee SH, Kim YJ, Thomas R, Roger VL, Somers VK, Lopez‐Jimenez F. Combining body mass index with measures of central obesity in the assessment of mortality in subjects with coronary disease role of “normal weight central obesity”. J Am Coll Cardiol. 2013;61:553–560. [DOI] [PubMed] [Google Scholar]
- 43. Srikanthan P, Horwich TB, Tseng CH. Relation of muscle mass and fat mass to cardiovascular disease mortality. Am J Cardiol. 2016;117:1355–1360. [DOI] [PubMed] [Google Scholar]
- 44. Kalantar‐Zadeh K, Rhee CM, Amin AN. To legitimize the contentious obesity paradox. Mayo Clin Proc. 2014;89:1033–1035. [DOI] [PMC free article] [PubMed] [Google Scholar]
- 45. Lavie CJ, Cahalin LP, Chase P, Myers J, Bensimhon D, Peberdy MA, Ashley E, West E, Forman DE, Guazzi M, Arena R. Impact of cardiorespiratory fitness on the obesity paradox in patients with heart failure. Mayo Clin Proc. 2013;88:251–258. [DOI] [PMC free article] [PubMed] [Google Scholar]
- 46. Lavie CJ, De Schutter A, Milani RV. Body composition and the obesity paradox in coronary heart disease: can heavier really be healthier? Heart. 2015;101:1610–1611. [DOI] [PubMed] [Google Scholar]
- 47. Ortega FB, Lavie CJ, Blair SN. Obesity and cardiovascular disease. Circ Res. 2016;118:1752–1770. [DOI] [PubMed] [Google Scholar]
- 48. McAuley PA, Artero EG, Sui X, Lee DC, Church TS, Lavie CJ, Myers JN, España‐Romero V, Blair SN. The obesity paradox, cardiorespiratory fitness, and coronary heart disease. Mayo Clin Proc. 2012;87:443–451. [DOI] [PMC free article] [PubMed] [Google Scholar]
- 49. Pan W, Hindler K, Lee VV, Vaughn WK, Collard CD. Obesity in diabetic patients undergoing coronary artery bypass graft surgery is associated with increased postoperative morbidity. Anesthesiology. 2006;104:441–447. [DOI] [PubMed] [Google Scholar]
- 50. Sprecher D, Pearce G. How deadly is the “deadly quartet”? A post‐CABG evaluation. J Am Coll Cardiol. 2000;36:1159–1165. [DOI] [PubMed] [Google Scholar]
- 51. Wee CC, Girotra S, Weinstein AR, Mittleman MA, Mukamal KJ. The relationship between obesity and atherosclerotic progression and prognosis among patients with coronary artery bypass grafts—the effect of aggressive statin therapy. J Am Coll Cardiol. 2008;52:620–625. [DOI] [PubMed] [Google Scholar]
- 52. Hamman BL, Filardo G, Hamilton C, Grayburn PA. Effect of body mass index on risk of long‐term mortality following coronary artery bypass grafting. Am J Cardiol. 2006;98:734–738. [DOI] [PubMed] [Google Scholar]
- 53. Nikolsky E, Kosinski E, Mishkel G, Kimmelstiel C, McGarry TF Jr, Mehran R, Leon MB, Russell ME, Ellis SG, Stone GW. Impact of obesity on revascularization and restenosis rates after bare‐metal and drug‐eluting stent implantation (from the TAXUS‐IV trial). Am J Cardiol. 2005;95:709–715. [DOI] [PubMed] [Google Scholar]