

Abstract
Background
Little is known about causality and pathological mechanism underlying association of postinfarct fever with myocardial injury in patients with ST‐segment elevation myocardial infarction.
Methods and Results
In 276 patients undergoing primary percutaneous coronary intervention for ST‐segment elevation myocardial infarction, cardiac magnetic resonance imaging was performed a median of 3.4 days after the index procedure. Forty‐five patients had postinfarct fever (peak body temperature within 4 days after primary percutaneous coronary intervention ≥37.7°C; Fever group) whereas 231 did not (no‐Fever group). Primary outcome was myocardial infarct size as assessed by cardiac magnetic resonance imaging. Secondary outcomes were extent of area at risk, myocardial salvage index, and microvascular obstruction area. In cardiac magnetic resonance imaging analysis, myocardial infarct size (25.6% [19.7–32.4] in the Fever group versus 17.2% [11.8–25.4] in the no‐Fever group; P<0.01), extent of area at risk (43.7% [31.9–54.9] versus 35.3% [24.0–43.7]; P<0.01), and microvascular obstruction area (4.4% [0.0–13.2] versus 1.2% [0.0–5.1]; P=0.02) were greater in the Fever group than in the no‐Fever group. Myocardial salvage index tended to be lower in the Fever group compared to the no‐Fever group (37.7 [28.5–56.1] versus 47.0 [34.1–56.8]; P=0.13). In multivariate analysis, postinfarct fever was associated with larger myocardial infarct (odds ratio, 3.48; 95% CI, 1.71–7.07; P<0.01) and lower MSI (odds ratio, 2.10; 95% CI, 1.01–4.08; P=0.03).
Conclusions
Postinfarct fever could predict advanced myocardial injury and less salvaged myocardium in ST‐segment elevation myocardial infarction patients undergoing primary percutaneous coronary intervention.
Keywords: magnetic resonance imaging, postinfarct fever, ST‐segment elevation myocardial infarction
Subject Categories: Myocardial Infarction, Coronary Artery Disease, Magnetic Resonance Imaging (MRI), Percutaneous Coronary Intervention
Introduction
Fever is a common phenomenon in patients with acute myocardial infarction (AMI). These fevers often increase by more than 1°C, on average, as early as 4 to 8 hours after infarction onset, and they usually resolve by the fourth to fifth day.1 Postinfarct fever has been recognized as a nonspecific response to wide myocardial damage because it is associated with elevated serum levels of myocardial enzymes and C‐reactive protein.2, 3 However, recent observational studies found that postinfarct fever is an independent predictor of adverse clinical outcomes4 and infarct size, as assessed by cardiac enzyme levels or echocardiography, in patients with ST‐elevation myocardial infarction (STEMI).5, 6 Although previous studies showed a relationship between postinfarct fever, infarct size, and subsequent adverse clinical outcomes, the causality and pathological mechanisms underlying these associations remain poorly understood.4 Cardiovascular magnetic resonance imaging (CMR) could precisely assess the extent of myocardial injury and salvaged myocardium, providing improved insight into the effects of postinfarct fever in STEMI patients.7, 8 Therefore, we evaluated the association between postinfarct fever and myocardial injury assessed by CMR in STEMI patients undergoing primary percutaneous coronary intervention (PCI).
Methods
Study Population
The study population consisted of patients on the Acute Myocardial Infarction–Cine Magnetic Resonance imaging registry at Samsung Medical Center in Seoul, Korea, from December 2007 to July 2014 (n=645). Of these, we only included patients with STEMI and excluded patients with the following: (1) previous coronary artery bypass grafting; (2) history of cardiogenic shock or cardiopulmonary resuscitation; (3) patients received reperfusion therapy over 12 hours from symptom onset; (4) insufficient information regarding symptom onset time; (5) patients had possible documented evidence of infection; and (6) patients with poor‐quality CMR data for analysis (Figure 1). To exclude infection in the present study, when body temperature (BT) was over 37.5°C, patients underwent physical examination and urinalysis, urine culture, white blood cell count, C‐reactive protein, erythrocyte sedimentation rate, procalcitonin, 3 pairs of blood culture, and indicated imaging studies, such as chest radiography or abdominal ultrasound, were obtained. If any results were positive, the patient was excluded (Figure 1). Finally, a total of 276 patients were included in this study and divided into 2 groups according to the presence of fever (Figure 1). The institutional review board of Samsung Medical Center approved this study, and all subjects provided written informed consent to participate in this study.
Figure 1.
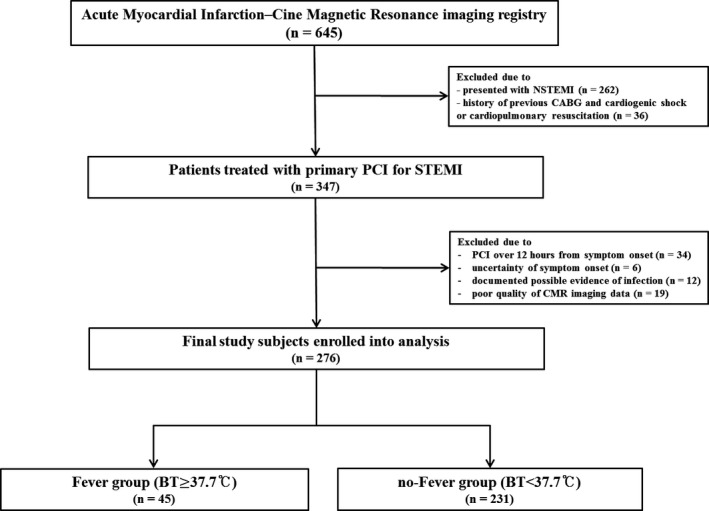
Schematic of study cohort selection. BT indicates body temperature; CABG, coronary artery bypass grafting; CMR, cardiac magnetic resonance imaging; MI, myocardial infarction; NSTEMI, non‐ST‐segment elevation myocardial infarction; PCI, percutaneous coronary infarction; STEMI, ST‐segment elevation myocardial infarction.
Fever and Body Temperature Measurement
BT was measured every 6 hours from time of admission for 4 days using an infrared ear thermometer. If BT was above 37.5°C, axillary BT was measured again using a mercury thermometer. Peak BT was defined as the highest value within 4 days after primary PCI and fever was defined as peak axillary BT more than 37.7°C.9, 10 Patients were divided into 2 groups according to the presence of fever within 4 days after the index procedure. The Fever group had BT ≥37.7°C, and the no‐Fever group had <37.7°C.4, 5
Study Outcomes
The primary outcome was myocardial infarct size (% of left ventricle or ‐cular [LV]) assessed by CMR according to fever onset after primary PCI. Secondary outcomes included extent of the area at risk (AAR; % of LV), myocardial salvage index (MSI), and microvascular obstruction (MVO) area (% of LV).
Data Collection and Definition
Research coordinators of the dedicated registry prospectively recorded baseline characteristics, angiographic findings, and CMR data. Blood samples for N‐terminal pro B‐type natriuretic peptide and creatine kinase myocardial band were drawn from patients before primary PCI. Serum creatine kinase myocardial band levels were measured every 8 hours from the index procedure until peak values were confirmed (Figure S1). Baseline left ventricular ejection fraction (LVEF; %) was measured by transthoracic echocardiography using Simpson's method just after primary PCI.11 Killip classification was determined upon arrival or before primary PCI.12 STEMI was defined as ST‐segment elevation of more than 1 mm in 2 or more contiguous leads or a presumably new‐onset left bundle branch block on ECG. Multivessel disease was defined as stenosis >50% noted in more than 2 coronary arteries. Thrombolysis in myocardial infarction flow grade and myocardial blush grade were evaluated using the final angiogram, as defined previously.13 All baseline and procedural cine coronary angiograms were reviewed and quantitatively analyzed at the angiographic core laboratory of our institution.
CMR Imaging Analysis
All measurements were made at Samsung Medical Center‐CMR core laboratory using validated software (ARGUS; Siemens Medical System, Erlangen, Germany). Infarct size and extent of MVO were assessed on delayed enhanced images, whereas the AAR was measured on T2‐weighted images. Two experienced radiologists who were blinded to patient information performed measurements based on visual assessment. After acquiring short‐axis images at end‐diastole and end‐systole, endocardial borders were traced. The Simpson algorithm was then used to calculate LV end‐diastolic volume, LV end‐systolic volume, and LVEF. Infarct size was calculated from summation of the area with delayed hyperenhancement within each segment of the short‐axis images. This value was multiplied by slice thickness to cover the entire LV. Endocardial and epicardial borders were planimetered to calculate the myocardial area. They were then summed to calculate LV myocardial volume using the same method. Infarct size was expressed as percentage of affected LV myocardial volume. T2‐weighted images were used to determine the presence of hemorrhagic infarction.14 AAR was quantified on T2‐weighted images using a similar algorithm as above and was similarly expressed as percentage of LV myocardial volume affected. The MSI was computed as follows: MSI=(AAR−infarct size)/AAR×100.15
Statistical Analysis
Continuous variables were summarized as mean±SD or median and interquartile range and were compared using independent t tests, Mann–Whitney U tests, or Wilcoxon rank‐sum tests. Categorical variables were described as numbers (n) with percentages (%), and differences were analyzed by Pearson χ2 or Fisher's exact tests. Multivariate logistic regression analysis was performed by a step‐wise backward selection process to determine the independent predictors of large myocardial infarcts (percent infarct volume >median of infarct size in the present study) and lower MSI (MSI <median of MSI). Clinical variables (postinfarct fever, age, sex, diabetes mellitus, Killip class ≥3 on admission, LVEF ≤40%, and use of aspirin post‐PCI) were included in regression models. Criteria for inclusion and exclusion of variables were set at 0.05 and 0.20, respectively. All tests were 2‐tailed, and P<0.05 was considered statistically significant. Statistical analyses were performed with SAS software (version 9.2; SAS Institute Inc, Cary, NC).
Results
Baseline Clinical Characteristics
Within 96 hours of observation after primary PCI, median peak BT was 37.1°C. A total of 276 study patients were divided into those with fever (n=45; 16.3% of the study population) and those without fever (n=231; Figure 1). Compared with the no‐Fever group, the Fever group had greater prevalence of Killip class ≥3 on admission (P<0.01) and lower baseline LVEF by transthoracic echocardiography (P<0.01) and higher level of peak creatine kinase myocardial band (P=0.01), white blood cell count (P<0.01), and C‐reactive protein (P<0.01). In terms of concomitant medication after revascularization, statins were administered less frequently in the Fever group than in the no‐Fever group (P=0.03). The Fever group tended to have a higher incidence of diabetes mellitus and take aspirin less frequently than the no‐Fever group. Other demographic and clinical characteristics were not different between the 2 groups (Table 1).
Table 1.
Baseline Characteristics
| Overall Population (n=276) | Fever (n=45) | No‐Fever (n=231) | P Value Fever vs No‐Fever | |
|---|---|---|---|---|
| Age, y | 59.0 (50.0–67.0) | 57.0 (48.8–67.5) | 59.0 (51.0–67.5) | 0.40 |
| Male | 225 (81.5) | 37 (82.2) | 188 (81.4) | 0.90 |
| BMI, kg/m² | 24.6 (22.4–26.8) | 24.8 (22.3–27.4) | 24.5 (22.3–26.8) | 0.62 |
| Peak body temperature, °C | 37.1 (36.8–37.5) | 38.0 (37.8–38.5) | 37.0 (36.8–37.3) | <0.01 |
| Current smoker | 132 (47.8) | 20 (44.4) | 112 (48.5) | 0.62 |
| Hypertension | 122 (44.2) | 22 (48.9) | 100 (43.3) | 0.49 |
| Diabetes mellitus | 64 (23.2) | 15 (33.3) | 49 (21.2) | 0.08 |
| Dyslipidemia | 49 (17.8) | 11 (24.4) | 38 (16.5) | 0.20 |
| Previous MI | 12 (4.3) | 3 (6.7) | 9 (3.9) | 0.40 |
| Previous PCI | 18 (6.5) | 4 (8.9) | 14 (6.1) | 0.48 |
| Previous CVA | 8 (2.9) | 1 (2.2) | 7 (3.0) | 0.77 |
| Times, min | ||||
| Symptom onset‐to‐balloon time | 162.0 (102.0–287.0) | 151.0 (99.5–280.5) | 171.0 (102.0–293.0) | 0.49 |
| Door‐to‐balloon time | 67.0 (49.3–80.0) | 66.0 (47.0–75.3) | 67.0 (48.0–81.0) | 0.28 |
| Killip class ≥3 on admission | 23 (8.3) | 13 (28.9) | 10 (4.3) | <0.01 |
| LVEF (%) | 54.0 (46.3–60.0) | 47.2 (34.8–55.0) | 55.0 (48.2–62.0) | <0.01 |
| NT‐proBNP, pg/mLa | 96.7 (34.8–340.4) | 110.5 (39.1–833.6) | 95.8 (34.0–303.3) | 0.14 |
| White blood cell, ×103/μL | 12.0 (9.5–14.2) | 13.4 (11.9–16.5) | 11.5 (9.2–14.0) | <0.01 |
| C‐reactive protein, mg/L | 1.1 (0.3–5.8) | 9.5 (2.5–18.2) | 0.8 (0.2–2.7) | <0.01 |
| Peak CK‐MB, ng/mL | 178.3 (73.9–285.4) | 285.3 (65.1–421.6) | 172.0 (85.8–273.2) | 0.01 |
| Concomitant medications | ||||
| Aspirin | 272 (98.6) | 43 (95.6) | 229 (99.1) | 0.07 |
| Clopidogrel | 273 (98.9) | 44 (97.8) | 229 (99.1) | 0.42 |
| Statins | 263 (95.3) | 40 (88.9) | 223 (96.5) | 0.03 |
| Beta‐blockers | 254 (92.0) | 39 (86.7) | 215 (93.1) | 0.15 |
| ACE inhibitors/ARB | 229 (83.0) | 38 (84.4) | 191 (82.7) | 0.77 |
Data are presented as n (%) or median (interquartile range). ACE indicates angiotensin convoluting enzyme; ARB, angiotensin receptor blocker; BMI, body mass index; CK‐MB, creatine kinase‐myocardial band; CVA, cerebrovascular accident; LVEF, left ventricular ejection fraction; MI, myocardial infarction; NT‐proBNP, N‐terminal prohormone of brain natriuretic peptide; PCI, percutaneous coronary intervention.
Data of NT‐proBNP were available for 229 (83.0%) patients.
Angiographic and Procedural Characteristics
Angiographic and procedural findings showed no significant differences between Fever and no‐Fever groups (Table 2). The most common baseline thrombolysis in myocardial infarction flow grade was 0 in both groups, and baseline thrombolysis in myocardial infarction flows were not significantly different between the 2 groups. The most common infarct‐related artery was the left anterior descending artery in both groups, and the prevalence of each involved vessel was similar between the 2 groups. Prevalence of multivessel disease and collateral flow were also similar between the 2 groups. The number of implanted stents, stent diameter, and stent length did not differ between the Fever group and no‐Fever group. Angiographic no‐reflow, final thrombolysis in myocardial infarction grade 3 post‐PCI, and final myocardial blush grade were not different between the 2 groups (Table 2).
Table 2.
Angiographic and Procedural Characteristics
| Overall Population (n=276) | Fever (n=45) | No‐Fever (n=231) | P Value Fever vs No‐Fever | |
|---|---|---|---|---|
| Infarct‐related artery | 0.44 | |||
| LAD | 137 (49.6) | 25 (55.6) | 112 (48.5) | |
| LCx | 32 (11.6) | 5 (11.1) | 27 (11.7) | |
| RCA | 105 (38.0) | 14 (31.1) | 91 (39.4) | |
| Left main | 2 (0.7) | 1 (2.2) | 1 (0.4) | |
| Multi‐vessel disease | 125 (45.3) | 25 (55.6) | 100 (43.3) | 0.13 |
| TIMI flow grade before PCI | 0.35 | |||
| 0 | 209 (75.7) | 38 (84.4) | 171 (74.0) | |
| 1 | 17 (6.2) | 1 (2.2) | 16 (6.9) | |
| 2 | 26 (9.4) | 2 (4.4) | 24 (10.4) | |
| 3 | 24 (8.7) | 4 (8.9) | 20 (8.7) | |
| Presence of collateral flow | 43 (15.6) | 8 (17.8) | 35 (15.2) | 0.66 |
| Final TIMI flow grade 3 post‐PCI | 261 (94.6) | 41 (91.1) | 220 (95.2) | 0.26 |
| Angiographic no reflow phenomenon | 17 (6.2) | 4 (8.9) | 13 (5.6) | 0.41 |
| Myocardial blush grade | 0.19 | |||
| 0 | 0 (0) | 0 (0) | 0 (0) | |
| 1 | 2 (0.7) | 0 (0) | 2 (0.9) | |
| 2 | 20 (7.2) | 6 (13.3) | 14 (6.1) | |
| 3 | 254 (92.0) | 39 (86.7) | 215 (93.1) | |
| Aspiration thrombectomy | 179 (64.9) | 31 (68.9) | 148 (64.1) | 0.54 |
| Use of GPIIb/IIIa inhibitor | 49 (17.8) | 10 (22.2) | 39 (16.9) | 0.39 |
| PCI using stent | 256 (92.8) | 41 (91.1) | 215 (93.1) | 0.64 |
| No. of implanted stenta | 1.2±0.6 | 1.1±0.4 | 1.3±0.6 | 0.14 |
| Stent diameter, mma | 3.0 (2.8–3.5) | 3.0 (2.8–3.5) | 3.0 (2.9–3.5) | 0.18 |
| Stent length, mma | 24.0 (22.0–30.0) | 24.0 (18.0–28.0) | 24.0 (22.0–30.0) | 0.20 |
Data are presented as n (%), mean±SD, or median (interquartile range). GP indicates glycoprotein; LAD, left anterior descending artery; LCx, left circumflex artery; PCI, percutaneous coronary intervention; RCA, right coronary artery; TIMI, thrombolysis in myocardial infarction.
Data of number of implanted stent, stent diameter, or stent length were available for 256 (92.8%) patients.
Analysis of CMR Findings
CMR was performed a median of 3.4 days (interquartile range, 2.8–4.5) after the index procedure, and intervals from primary PCI to CMR were not different between the 2 groups. Myocardial infarct size was significantly larger in the Fever group compared with the no‐Fever group (25.6% [19.7–32.4] versus 17.2% [11.8–25.4]; P<0.01). Extent of AAR (43.7% [31.9–54.9] versus 35.3% [24.0–43.7]; P<0.01) and MVO area (4.4% [0–13.2] versus 1.2% [0.0–5.1]; P=0.02) were also greater in the Fever group than in the no‐Fever group. MSI tended to be lower in the Fever group compared to the no‐Fever group (37.7 [28.5–56.1] versus 47.0 [34.1–56.8]; P=0.13; Figure 2). LVEF and LV stroke volume were lower, but LV systolic volume was greater in the Fever group compared with the no‐Fever group. LV end‐diastolic volume tended to be greater in the Fever group compared with the no‐Fever group, but differences were minor (Table 3).
Figure 2.
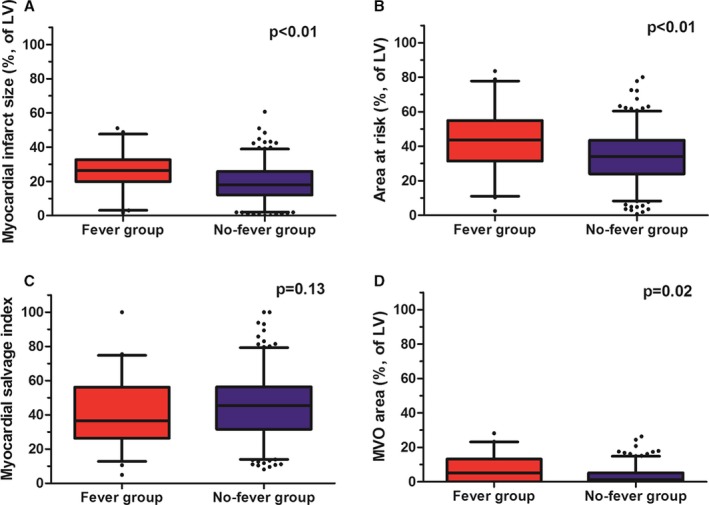
Cardiac magnetic resonance findings according to the presence of postinfarct fever. Boxplots shows cardiac magnetic resonance data according to the presence of postinfarct fever and (A) myocardial infarct size, (B) extent of AAR, (C) MSI, and (D) MVO area. AAR indicates area at risk; LV, left ventricle; MSI, myocardial salvage index; MVO, microvascular obstruction.
Table 3.
Analysis of CMR Findings
| Overall Population (n=276) | Fever (n=45) | No‐Fever (n=231) | P Value Fever vs No‐Fever | |
|---|---|---|---|---|
| Myocardial infarct size (%, of LV) | 19.7 (12.4–27.9) | 25.6 (19.7–32.4) | 17.2 (11.8–25.4) | <0.01 |
| Area at risk (%, of LV) | 35.3 (25.6–44.7) | 43.7 (31.9–54.9) | 35.3 (24.0–43.7) | <0.01 |
| Myocardial salvage index | 44.8 (30.1–56.4) | 37.7 (28.5–56.1) | 47.0 (34.1–56.8) | 0.13 |
| MVO area (%, of LV) | 1.8 (0.0–6.0) | 4.4 (0.0–13.2) | 1.2 (0.0–5.1) | 0.02 |
| Hemorrhagic infarction | 121 (43.8) | 22 (48.9) | 99 (42.9) | 0.46 |
| LV end‐diastolic volume, mL | 142.7 (122.4–163.0) | 146.8 (128.6–173.3) | 142.0 (122.9–161.8) | 0.10 |
| LV end‐systolic volume, mL | 65.9 (50.0–81.4) | 79.7 (60.3–97.5) | 64.8 (49.5–79.7) | <0.01 |
| LV mass, g | 105.4 (94.0–123.1) | 104.5 (92.8–117.4) | 105.5 (94.2–123.8) | 0.86 |
| LV ejection fraction (%) | 53.8 (46.3–60.8) | 47.3 (40.1–55.2) | 54.3 (47.0–61.1) | <0.01 |
| LV stroke volume, mL | 73.3 (63.4–85.5) | 67.9 (61.9–73.8) | 75.6 (64.4–86.4) | <0.01 |
| LV cardiac output, L/min | 5.0 (4.4–5.8) | 5.1 (4.5–5.9) | 5.0 (4.4–5.8) | 0.48 |
Data are presented as n (%) or median (interquartile range). CMR indicates cardiac magnetic resonance; LV, left ventricle (‐ular); MVO, microvascular obstruction.
Predictors of Advanced Myocardial Injury in Patients Treated With PCI for STEMI
In multivariable logistic regression analysis, independent predictors of large myocardial infarct (percent infarct volume of LV ≥20%) included postinfarct fever (odds ratio [OR], 3.48; 95% CI, 1.71–7.07; P<0.01), Killip class ≥3 on admission (OR, 2.57; 95% CI, 1.02–6.47; P=0.04), and LVEF ≤40% (OR, 4.01; 95% CI, 1.82‐ 8.84, P<0.01). Postinfarct fever was the only significant independent predictor of lower MSI (MSI <44; OR, 2.10; 95% CI, 1.01–4.08; P=0.03). Male patients (OR, 1.79; 95% CI, 0.96–3.35; P=0.07) and leukocytosis (OR, 1.46; 95% CI, 0.90–2.38; P=0.12) tended to have larger myocardial infarcts, but these differences were not statistically significant (Table 4).
Table 4.
Predictors of Advanced Myocardial Injury in Patients Treated With PCI for STEMI
| Odds Ratio | 95% CI | P Value | |
|---|---|---|---|
| Predictor of larger myocardial infarct (percent infarct volume ≥20%) | |||
| Postinfarct fever | 3.48 | 1.71 to 7.07 | <0.01 |
| Age ≥65 y | 1.03 | 0.62 to 1.71 | 0.90 |
| Male | 1.79 | 0.96 to 3.35 | 0.07 |
| Diabetes mellitus | 1.35 | 0.77 to 2.37 | 0.29 |
| Killip class ≥3 on admission | 2.57 | 1.02 to 6.47 | 0.04 |
| LVEF ≤40% | 4.01 | 1.82 to 8.84 | <0.01 |
| Leukocytosisa | 1.46 | 0.90 to 2.38 | 0.12 |
| TIMI flow ≥2 pre‐PCI | 0.92 | 0.57 to 1.50 | 0.75 |
| Multivessel disease | 1.20 | 0.75 to 1.93 | 0.45 |
| Use of aspirin after primary PCI | 0.96 | 0.13 to 6.89 | 0.97 |
| Predictor of lower MSI (MSI <44) | |||
| Postinfarct fever | 2.10 | 1.01 to 4.08 | 0.03 |
| Age ≥65 yr | 1.15 | 0.70 to 1.91 | 0.58 |
| Male | 1.23 | 0.67 to 2.26 | 0.51 |
| Diabetes mellitus | 1.33 | 0.76 to 2.33 | 0.32 |
| Killip class ≥3 on admission | 1.14 | 0.48 to 2.67 | 0.77 |
| LVEF ≤40% | 1.40 | 0.70 to 2.79 | 0.34 |
| Leukocytosisa | 1.08 | 0.67 to 1.75 | 0.75 |
| TIMI flow ≥2 pre‐PCI | 0.65 | 0.35 to 1.21 | 0.18 |
| Multivessel disease | 1.29 | 0.81 to 2.01 | 0.29 |
| Use of aspirin after primary PCI | 0.97 | 0.14 to 6.99 | 0.98 |
CI indicates confidence interval; LVEF indicates left ventricular ejection fraction; MSI, myocardial salvage index; PCI, percutaneous coronary intervention; STEMI, ST‐segment elevation myocardial infarction; TIMI, thrombolysis in myocardial infarction; WBC, white blood cell count.
Leukocytosis was defined as WBC ≥11.0×10³/μL.
Subanalysis of Patients With Postinfarct Fever
Of 45 patients with postinfarct fever, median peak BT was 38.0°C (37.8–38.5°C). Sixteen patients (35.6% of the Fever group) developed a peak fever within the first 24 hours after admission, 23 (51.1%) developed a peak fever on the second day, 4 (8.9%) developed a peak fever on the third day, and 2 (4.4%) developed a peak fever on the fourth day. Twenty‐three patients (51.1% of the Fever group) had a peak fever of 37.7°C to 38.0°C, 14 (31.1%) had a peak fever of 38.1°C to 38.5°C, and 8 (17.8%) had a peak fever of >38.5°C (Figure 3). The CMR analysis of patients with postinfarct fever was also evaluated according to onset time of fever and degree of fever. The early‐onset fever group (n=16; patients with peak fever within 24 hours after the index procedure; 35.6% of the Fever group) had no differences in myocardial infarct size, AAR, and MSI compared with the late‐onset fever group. Patients with high‐degree fever (n=22; patients with peak BT >38.0°C; 48.9% of Fever group) tended to have lager myocardial infarct size (30.6 [21.1–36.2] versus 22.9 [17.6–30.2]; P=0.09) and extent of AAR (45.6 [36.6–55.6] versus 33.6 [29.5–48.0]; P=0.11) compared with patients with low‐degree fever, but the differences were not significant. Both subgroups had similar MSI and MVO area (Table 5).
Figure 3.
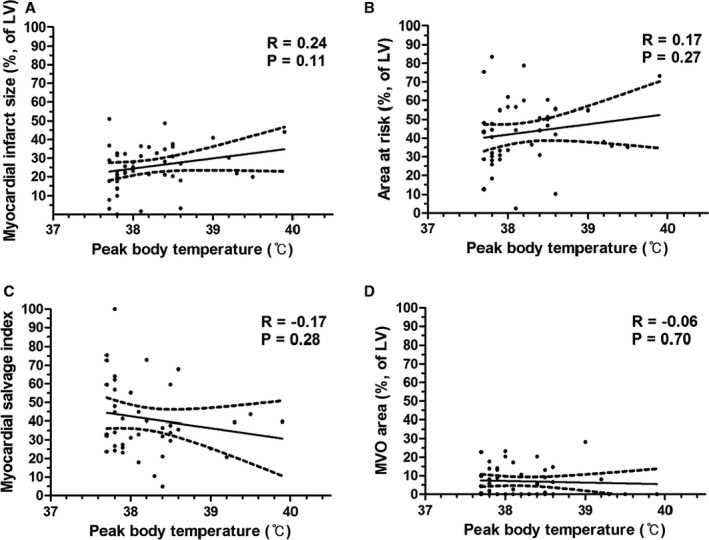
Cardiac magnetic resonance findings according to peak body temperature in patients with postinfarct fever. Scatter plot shows analyzed data of cardiac magnetic resonance according to peak body temperature (°C), (A) myocardial infarct size (%, of LV), (B) area at risk (%, of LV), (C) myocardial salvage index, and (D) MVO area (%, of LV), respectively. LV indicates left ventricle (‐ular); MVO, microvascular obstruction.
Table 5.
CMR Outcome in Patients With Postinfarct Fever (n=45)
| Overall Population (n=45) | Early‐Onset Fevera (n=16) | Late‐Onset Fever (n=29) | P Value | |
|---|---|---|---|---|
| Myocardial infarct size (%, of LV) | 25.6 (19.7–32.7) | 21.8 (15.7–30.7) | 27.7 (20.3–32.7) | 0.18 |
| Area at risk (%, of LV) | 43.7 (31.4–54.9) | 42.2 (30.4–54.0) | 44.2 (31.8–54.9) | 0.72 |
| Myocardial salvage index | 36.4 (26.3–56.1) | 42.5 (31.3–58.2) | 33.9 (25.4–44.7) | 0.20 |
| MVO area (%, of LV) | 5.2 (0.0–13.2) | 8.1 (0.0–12.2) | 4.4 (0.0–13.2) | 0.57 |
| Overall Population (n=45) | High‐Degree Feverb (n=22) | Low‐Degree Fever (n=23) | P Value | |
|---|---|---|---|---|
| Myocardial infarct size (%, of LV) | 25.6 (19.7–32.7) | 30.6 (21.1–36.2) | 22.9 (17.6–30.2) | 0.09 |
| Area at risk (%, of LV) | 43.7 (31.4–54.9) | 45.6 (36.6–55.6) | 33.6 (29.5–48.0) | 0.11 |
| Myocardial salvage index | 36.4 (26.3–56.1) | 36.0 (25.4–43.6) | 41.3 (27.1–58.2) | 0.31 |
| MVO area (%, of LV) | 5.2 (0.0–13.2) | 3.9 (0.0–10.6) | 5.5 (0.0–13.5) | 0.55 |
Data are presented as n (%) or median (interquartile range). BT indicates body temperature; CMR, cardiac magnetic resonance imaging; LV, left ventricle (‐ular); MVO, microvascular obstruction; PCI, percutaneous coronary intervention.
Early‐onset fever was defined as the occurrence of fever within 24 hours after primary PCI.
High‐degree fever was defined as BT over 38.0°C.
Discussion
The association between postinfarct fever after primary PCI and myocardial injury was investigated in patients with STEMI using CMR markers of myocardial and microvascular damage. The main finding of this study is that in STEMI patients undergoing primary PCI, postinfarct fever is associated with greater myocardial infarct size, AAR, and MVO area assessed by CMR. In multivariate analysis, postinfarct fever was associated with larger myocardial infarct and less salvaged myocardium. To the best of our knowledge, this is the first study to evaluate the clinical significance of postinfarct fever on myocardial injury assessed by CMR data in STEMI patients. Our findings correspond well with those of earlier studies that established an association between postinfarct fever and adverse clinical outcomes.4 Therefore, the results of the present study may provide the causality and pathological mechanisms for the association of adverse clinical outcomes associated with postinfarct fever.
In the past, fever in patients with AMI was recognized as a nonspecific inflammatory response resulting from myocardial tissue necrosis.1 However, many reports have suggested that fever post‐AMI has another underlying mechanism where there is an association with adverse clinical outcomes.2, 3, 5, 6 Recently, Cho et al4 reported that fever predicts adverse clinical outcomes in patients with STEMI, although they could not elucidate an underlying mechanism. CMR can be used to assess almost all relevant prognostic pathophysiological consequences of myocardial ischemia and reperfusion post‐STEMI.16, 17 CMR is uniquely positioned to comprehensively evaluate the morphological, functional, and microvascular sequelae of postinfarct patients.8 We evaluated the association of fever after revascularization and prognostic pathophysiology of myocardial ischemia in STEMI patients using CMR data and identified that fever after primary PCI was associated with extensive myocardial and microvascular damage. Our results provide substantial support that fever post‐AMI is a reasonably accurate surrogate for advanced myocardial injury in patients with STEMI. The results also explain the higher incidence of adverse clinical outcomes reported by Cho et al.4
Despite successful revascularization, fever after revascularization in patients with STEMI may be associated with advanced myocardial injury. Multivariate analysis showed that postinfarct fever predicted larger myocardial infarct size and lower MSI. There are several possible explanations for these results. First, postinfarct fever could impair cardiovascular function by increasing myocardial oxygen requirements, possibly predisposing to infarct extension or arrhythmias.18 Second, increased BT post‐AMI may be associated with infarct expansion, suggesting a relationship between the systemic inflammatory response and LV remodeling.5 Myocardial necrosis induces infiltration of inflammatory cells, including neutrophils, monocytes, and macrophages. These cells lead to synthesis of various cytokines, including interleukin‐1, interleukin‐6, interleukin‐8, tumor necrosis factor‐α, and interferon‐γ, which act as endogenous pyrogens. These cytokines are released into the systemic circulation and transported to the preoptic‐anterior hypothalamic area, the brain region where BT is regulated. Prostaglandin E2 induced by these cytokines plays an essential role in the preoptic‐anterior hypothalamic area and the development of fever. An inflammatory reaction post‐AMI is a prerequisite for healing and scar formation. However, defective infarct healing caused by excessive inflammation, as well as large infarct size and wall stress, is a major determinant of infarct expansion.19 The vulnerable myocardium, which consists of necrotic myocardium and inflammatory cells, is susceptible to wall stress, resulting in infarct expansion and LV remodeling. Alternatively, increased BT may augment the inflammatory response to myocardial necrosis, because increased temperature is known to activate host immune function.5 Third, fever itself could trigger atherothrombotic events by activating the immune system and coagulation factors predisposing patients to stent thrombosis.4 Last, fever is simply a marker for larger infarct size and not a cause, and postinfarct fever may result from the substantial inflammation that occurs with the larger myocardial infarction.
Our findings suggest that postinfarct fever should be understood not only as a phenomenon secondary to myocardial necrosis, but also as a predictor of larger infarct size and lower MSI. BT is one of the most precise and frequently performed clinical examinations on patients. Because postinfarct fever might be deleterious to the jeopardized myocardium, close monitoring and appropriate treatment of postinfarct fever may reduce expansion of myocardial damage and adverse clinical outcomes. However, it should be noted that these are hypothesis‐generating findings. The potential therapeutic implications of these findings deserve further investigation.
A subanalysis of CMR data was conducted according to features of postinfarct fever, such as degree of fever and onset time of fever. Interestingly, patients with a high‐degree fever tended to have greater myocardial infarct size and AAR compared to patients with a low‐degree fever. Because high‐degree fever represents more‐active inflammation that could play an important role in the immune response that mediates atherosclerosis,20 more‐active inflammation in patients with high‐degree fever might result in larger myocardial infarction. In addition, we found that the extent of myocardial injury had no relationship with the onset time of postinfarct fever. In the present study, myocardial infarct size, AAR, MSI, and MVO assessed by CMR were similar regardless of the onset time of postinfarct fever. Fever onset time was not related to degree of fever or level of serum inflammatory markers in our study, and it could make similar inflammatory activity or advancements of myocardial injury.
Study Limitations
This study has several limitations. First, its design was nonrandomized, prospective, and observational, which may have significantly affected results attributed to confounding factors. Second, the impact of postinfarct fever on assessment of outcomes was not assessed in this study. Third, a patient undergoing CMR may be clinical stable with modest myocardial injury. Because only patients available for CMR were included, the sample size of our study was small and it may limit our study results. Fourth, we measured BT using an infrared ear thermometer on admission, and if BT was above 37.5°C, axillary BT was measured again using a mercury thermometer. They may differ a little from central BT. Additionally, in the present study, we decided the definition of fever based on previous studies about clinical meanings of postinfarct fever, although there are several definitions on fever in the real‐world practice.4, 5 Thus, the statistical association of postinfarct fever with findings on CMR may have a little change according to various definitions of fever. Finally, although various examinations were performed to exclude infection, there is a chance that patients with unidentified subclinical infection were included in the study. Noninfectious causes of fever, such as vasculitis, deep vein thrombosis, medication side effects, and cancer, were also not fully evaluated.
Conclusions
Postinfarct fever is developed in one sixth of STEMI patients undergoing primary PCI. It is associated with lager extent of myocardial edema, less myocardial salvage, and greater myocardial infarct size, as assessed by CMR. Further investigation with potential therapeutic implications of these findings should be considered.
Disclosures
None.
Supporting information
Figure S1. Peak CK‐MB according to peak body temperature in STEMI patients undergoing primary PCI.
(J Am Heart Assoc. 2017;6:e005687 DOI: 10.1161/JAHA.117.005687.)28438740
References
- 1. Lofmark R, Nordlander R, Orinius E. The temperature course in acute myocardial infarction. Am Heart J. 1978;96:153–156. [DOI] [PubMed] [Google Scholar]
- 2. Herlitz J, Bengtson A, Hjalmarson A, Wilhelmsen L. Body temperature in acute myocardial infarction and its relation to early intervention with metoprolol. Int J Cardiol. 1988;20:65–71. [DOI] [PubMed] [Google Scholar]
- 3. Risoe C, Kirkeby OJ, Grottum P, Sederholm M, Kjekshus JK. Fever after acute myocardial infarction in patients treated with intravenous timolol or placebo. Br Heart J. 1987;57:28–31. [DOI] [PMC free article] [PubMed] [Google Scholar]
- 4. Cho HO, Nam CW, Lee HM, Shin HW, Cho YK, Yoon HJ, Park HS, Kim H, Chung IS, Hur SH, Kim YN, Kim KB. Fever after primary percutaneous coronary intervention in ST‐segment elevation myocardial infarction is associated with adverse outcomes. Int J Cardiol. 2014;170:376–380. [DOI] [PubMed] [Google Scholar]
- 5. Naito K, Anzai T, Yoshikawa T, Maekawa Y, Sugano Y, Kohno T, Mahara K, Okabe T, Asakura Y, Ogawa S. Increased body temperature after reperfused acute myocardial infarction is associated with adverse left ventricular remodeling. J Card Fail. 2007;13:25–33. [DOI] [PubMed] [Google Scholar]
- 6. Ben‐Dor I, Haim M, Rechavia E, Murininkas D, Nahon M, Harell D, Porter A, Iakobishvili Z, Scapa E, Battler A, Hasdai D. Body temperature—a marker of infarct size in the era of early reperfusion. Cardiology. 2005;103:169–173. [DOI] [PubMed] [Google Scholar]
- 7. Dall'Armellina E, Karamitsos TD, Neubauer S, Choudhury RP. CMR for characterization of the myocardium in acute coronary syndromes. Nat Rev Cardiol. 2010;7:624–636. [DOI] [PubMed] [Google Scholar]
- 8. Eitel I, de Waha S, Wohrle J, Fuernau G, Lurz P, Pauschinger M, Desch S, Schuler G, Thiele H. Comprehensive prognosis assessment by CMR imaging after ST‐segment elevation myocardial infarction. J Am Coll Cardiol. 2014;64:1217–1226. [DOI] [PubMed] [Google Scholar]
- 9. Axelrod YK, Diringer MN. Temperature management in acute neurologic disorders. Neurol Clin. 2008;26:585–603, xi. [DOI] [PubMed] [Google Scholar]
- 10. Laupland KB. Fever in the critically ill medical patient. Crit Care Med. 2009;37:S273–S278. [DOI] [PubMed] [Google Scholar]
- 11. Lang RM, Bierig M, Devereux RB, Flachskampf FA, Foster E, Pellikka PA, Picard MH, Roman MJ, Seward J, Shanewise JS, Solomon SD, Spencer KT, Sutton MS, Stewart WJ; Chamber Quantification Writing G, American Society of Echocardiography's G, Standards C, European Association of E . Recommendations for chamber quantification: a report from the American Society of Echocardiography's Guidelines and Standards Committee and the Chamber Quantification Writing Group, developed in conjunction with the European Association of Echocardiography, a branch of the European Society of Cardiology. J Am Soc Echocardiogr. 2005;18:1440–1463. [DOI] [PubMed] [Google Scholar]
- 12. Neskovic AN, Otasevic P, Bojic M, Popovic AD. Association of Killip class on admission and left ventricular dilatation after myocardial infarction: a closer look into an old clinical classification. Am Heart J. 1999;137:361–367. [DOI] [PubMed] [Google Scholar]
- 13. van ‘t Hof AW, Liem A, Suryapranata H, Hoorntje JC, de Boer MJ, Zijlstra F. Angiographic assessment of myocardial reperfusion in patients treated with primary angioplasty for acute myocardial infarction: myocardial blush grade. Zwolle Myocardial Infarction Study Group. Circulation. 1998;97:2302–2306. [DOI] [PubMed] [Google Scholar]
- 14. Ganame J, Messalli G, Dymarkowski S, Rademakers FE, Desmet W, Van de Werf F, Bogaert J. Impact of myocardial haemorrhage on left ventricular function and remodelling in patients with reperfused acute myocardial infarction. Eur Heart J. 2009;30:1440–1449. [DOI] [PubMed] [Google Scholar]
- 15. Eitel I, Desch S, Fuernau G, Hildebrand L, Gutberlet M, Schuler G, Thiele H. Prognostic significance and determinants of myocardial salvage assessed by cardiovascular magnetic resonance in acute reperfused myocardial infarction. J Am Coll Cardiol. 2010;55:2470–2479. [DOI] [PubMed] [Google Scholar]
- 16. Kim HW, Farzaneh‐Far A, Kim RJ. Cardiovascular magnetic resonance in patients with myocardial infarction: current and emerging applications. J Am Coll Cardiol. 2009;55:1–16. [DOI] [PubMed] [Google Scholar]
- 17. Perazzolo Marra M, Lima JA, Iliceto S. MRI in acute myocardial infarction. Eur Heart J. 2011;32:284–293. [DOI] [PubMed] [Google Scholar]
- 18. Kuchinskii AP. [Fever in myocardial infarction, its relation with catecholamine excretion and disorders of heart rhythm]. Ter Arkh. 1982;54:53–56. [PubMed] [Google Scholar]
- 19. Pfeffer MA, Braunwald E. Ventricular remodeling after myocardial infarction. Experimental observations and clinical implications. Circulation. 1990;81:1161–1172. [DOI] [PubMed] [Google Scholar]
- 20. Libby P, Ridker PM, Maseri A. Inflammation and atherosclerosis. Circulation. 2002;105:1135–1143. [DOI] [PubMed] [Google Scholar]
Associated Data
This section collects any data citations, data availability statements, or supplementary materials included in this article.
Supplementary Materials
Figure S1. Peak CK‐MB according to peak body temperature in STEMI patients undergoing primary PCI.