

Abstract
Background:
Stress fractures (SFs) are one of the more severe overuse injuries in military training, and therefore, knowledge of potential risk factors is needed to assist in developing mitigating strategies.
Purpose:
To develop a prediction model for risk of SF in Royal Marines (RM) recruits during an arduous military training program.
Study Design:
Case-control study; Level of evidence, 3.
Methods:
RM recruits (N = 1082; age range, 16-33 years) who enrolled between September 2009 and July 2010 were prospectively followed through the 32-week RM training program. SF diagnosis was confirmed from a positive radiograph or magnetic resonance imaging scan. Potential risk factors assessed at week 1 included recruit characteristics, anthropometric assessment, dietary supplement use, lifestyle habits, fitness assessment, blood samples, 25(OH)D, bone strength as measured by heel broadband ultrasound attention, history of physical activity, and previous and current food intake. A logistic least absolute shrinkage and selection operator (LASSO) regression with 10-fold cross-validation was used to select potential predictors among 47 candidate variables. Model performance was assessed using measures of discrimination (c-index) and calibration. Bootstrapping was used for internal validation of the developed model and to quantify optimism.
Results:
A total of 86 (8%) volunteer recruits presented at least 1 SF during training. Twelve variables were identified as the most important risk factors of SF. Variables strongly associated with SF were age, body weight, pretraining weightbearing exercise, pretraining cycling, and childhood intake of milk and milk products. The c-index for the prediction model, which represents the model performance in future volunteers, was 0.73 (optimism-corrected c-index, 0.68). Although 25(OH)D and VO2max had only a borderline statistically significant association with SF, the inclusion of these factors improved the performance of the model.
Conclusion:
These findings will assist in identifying recruits at greater risk of SF during training and will support interventions to mitigate this injury risk. However, external validation of the model is still required.
Keywords: stress fracture, risk factors, prediction, military, Royal Marines
The 32-week Royal Marines (RM) recruit training is one of the most arduous and longest initial military training programs in the world. Recruits are at relatively high risk of musculoskeletal overuse injuries (30%), including stress fracture (SF), which represents one of the more severe overuse injuries in military training.42
SF is a partial or complete fracture of bone, and it occurs when bones are repetitively loaded with vigorous weightbearing (WB) exercise over short time periods without sufficient time for repair. Existing research in military and athletic populations have documented that the incidence of SF ranges from 0.7% to 31%.14,17,24 The most prevalent site of SF is generally the tibia, followed by the metatarsal bones.18 Furthermore, it is the single most common cause for lost training days, and it represents a significant cost in terms of medical support and rehabilitation time as well as increasing the likelihood of recruits leaving training prior to completion.
The etiology of SF is multifactorial, and knowledge of potential risk factors is required to assist in developing mitigating strategies. Previous prospective studies in military populations have assessed SF risk factors in the Indian Army,8 US military,1,27,28,32,47,48 Israeli military,14,15,33 and Finnish Army,31,55 all of which have training programs that range between 8 and 16 weeks. However, there are only a few data assessing risk factors during longer training programs such as RM training.9,10,36 Previous systematic reviews18,37,57 have identified the following SF risk factors: older age, female sex, lifestyle habits (smoking and alcohol ingestion), low bone mineral density (BMD), previous lower limb injury, and poor nutrition. Because these variables are of limited predictive value when considered in isolation, the combination of them is needed for better predictive accuracy.
The problem of selecting a set of potential risk factors to include in regression modeling is well known, but it is also among the most controversial and difficult tasks in epidemiologic analysis.56 Selecting a practical number of predictors to be included in the model is the natural first step, and they are generally selected based on subject knowledge from clinical expertise and reviews of the literature.23,50,51 Currently, there is a lack of research on the risk factors for SF in an elite military setting; therefore, we used a more statistically driven method of predictor selection. For this study, given the sample size and incidence of outcome, standard variable selection methods (forward selection and/or backward elimination) could lead to only a limited number of predictors being considered to avoid model overfitting. An alternative method that overcomes this limitation is LASSO (least absolute shrinkage and selection operator) regression and is the most widely used.38,49 LASSO is a powerful penalized regression method used in predictor selection.34
The purpose of this study was to identify the most probable SF risk factors in RM recruits at the start of military training and to construct an SF prediction model using advanced statistical methods. The resulting better understanding of the interrelationship between SF risk factors will assist in developing evidence-based preventive interventions and safety promotion programs for mitigating SF in the military.
Methods
In this study, we followed the TRIPOD (transparent reporting of a multivariable prediction model for individual prognosis or diagnosis) statement6 to report the prediction model, including model development, model performance, and model internal validation.
Study Population
The present study used data from phase II of Surgeon General’s Bone Health Project (SGBHP). SGBHP adopted a prospective, observational study design to assess the relationship between nutritional influences on bone health and SF occurrence during the 32-week recruit training program at the Commando Training Centre Royal Marines (CTCRM), Lympstone, Devon, UK. The RM is an all-male elite fighting force; therefore, there were no females in the sample. Recruits who successfully completed the physical and professional selection tests, and who were deemed medically fit and healthy to undertake RM training, were eligible to participate in the study.
A total of 1113 recruits from 20 troops of RM recruits, commencing training between September 2009 and July 2010, were invited to participate in this study. Written informed consent was obtained from volunteer recruits (n = 1090; 98% response rate) (age range 16-33 years); 23 recruits declined to participate in the study. A further 8 recruits were discharged during the first week due to preexisting medical conditions, leaving 1082 participants.
Ethical Considerations
The study was approved by the UK Ministry of Defence Research Ethics Committee and was conducted in accordance with the ethical standards of the Declaration of Helsinki.
Primary Outcome: Stress Fracture
Recruits reporting to the CTCRM Medical Centre with symptoms of a potential SF underwent examination and radiography or magnetic resonance imaging (MRI) scanning to confirm SF diagnosis as part of routine care. SF diagnosis was based on a positive radiograph or MRI scan. Depending on the fracture site, a negative initial radiograph was followed up by a further radiograph or MRI to confirm diagnosis. All recruits with SF were removed from RM training and underwent rest and rehabilitation in situ under medical supervision.
Potential Risk Factors
Based on the information available in the study and on previous research in the scientific literature, 47 potential predictors from measurements collected at the start training were selected to be included in the modeling analyses; categories included physical fitness, diet, lifestyle, education, season for commencing RM training, and measures of bone health.
Recruit Information
Age, education, and the season of the year at the start of training were available. As the association of age on SF was nonlinear, it was divided into 3 categories based on distributions from a previous study associated with discharge in US Marine Corps recruits40: younger than 19 years (range, 16-18 years), 19 to 23 years, and 24 years or older (range, 24-32 years). Education was defined as secondary school versus further education/degree, and season when the recruit started training was divided into the 4 standard seasons (autumn, winter, spring, and summer).
Anthropometric Assessments
Height and body weight were measured. Height was measured in centimeters (to the nearest 0.1 cm) in a standing position, with shoes/boots removed, on a stadiometer (Invicta), with feet together. Body weight was measured in kilograms (Seca) in standard-issue t-shirt and shorts.
Self-Reported Dietary Supplement Usage
Multivitamins and minerals, creatine, sports/energy drinks/energy gels, and protein bars/powder/shakes were included in an assessment of self-reported pre-RM training dietary supplement usage. Categorical variables of intake frequency for each dietary supplement were generated (never, sometimes, and every day).
Lifestyle Habits
Smoking habits and alcohol intake were assessed. Recruits were classified as never smokers, ex-smokers, or current smokers. Alcohol intake was considered relative to intake in units per week, and it was used as a continuous variable.
Broadband Ultrasound Attenuation Measurement
Broadband ultrasound attenuation (BUA) measurement was assessed on the dominant and nondominant foot (dB·MHz−1) as an indicator of bone strength.26 It is considered to be a rapid, safe, and relatively inexpensive technique for measuring skeletal status.20 This measure was taken across the calcaneum of a seated recruit. A continuous score was used for the analysis, where a greater BUA was indicative of higher bone mass and greater bone strength.
Royal Marine Fitness Assessment
The Royal Marine Fitness Assessment (RMFA) is composed of 4 parts, which include the Multistage Fitness Test (MSFT)3 to estimate maximum oxygen uptake (VO2max),29 a push-up test, a sit-up test, and a pull-up test. The 4 fitness tests were undertaken in a gymnasium with recruits wearing shorts, t-shirt, and training shoes. The recruits were required to do the maximum number of push-ups, sit-ups, and pull-ups in 60 seconds. All measures were treated as continuous for the analysis.
Exercise Pre-RM Training Preparation
Mode, duration, frequency, and volume of exercise pre-RM training preparation were included. Mode of training was assessed by the amount of WB and non-WB exercises from a list of 3 WB exercises (ie, running, circuit training, and weight training) and 2 non-WB exercises (ie, cycling and swimming). Duration was assessed by the number of weeks of pre-RM training preparation, frequency by the number of training sessions per week, and volume by the minutes per week training.
Previous lower-limb injuries (dominant and nondominant leg) were also self-reported by recruits.
Assessment of Micronutrient and Vitamin D Status
A nonfasting blood sample was drawn by medical personnel, using serum separation vacutainers. Serum samples were provided for magnesium (as marker of micromineral status), zinc, selenium, copper (as markers of trace element status), and serum 25(OH)D concentration (as marker of vitamin D status). A threshold of 50 nmol/L for 25(OH)D was used for the analysis.10
Physical Activity and Dietary Intake Measurements
A validated survey, the Food Frequency Questionnaire,11,35 which examines childhood, adolescence, and current diet and physical activity levels, was administered to recruits at the beginning of RM training.
Dietary intake focused on recruit eating choices just prior to commencing RM training (the past month), as well as during childhood and adolescence, as an assessment of habitual dietary patterns. Milk, milk products (such as yogurt, cream, ice cream, custard, milk puddings), vegetables, and fruit were included. Intake of each group was determined in times/week (except vegetables and fruit, which were determined in portions/week).
Current activity levels were assessed by number of minutes walked per day, number of minutes cycled per day,39 and by the following 2 questions: “During your working time and during your nonworking time, how often during a normal week were you physically active for at least 20 minutes during which time you became short of breath and sweat?” Recruits were classified into 3 groups: once or less per week, 2 to 3 times per week, and more than 3 times per week. Physical activity throughout childhood and early adulthood (ie, 0-12 years and 12-18 years) was assessed by asking recruits how often they were normally physically active for at least 20 minutes during which time they became short of breath and sweaty: Once or less per week, 2 to 6 times per week, more than 6 times per week.
Table 1 provides a detailed description of all covariates recorded.
TABLE 1.
List of Prognostic Variables for Stress Fractures Available for Analysisa
| Variable | Additional Information | Variable | Additional Information |
|---|---|---|---|
| Age | (1) 16-18 y; (2) 19-23 y; (3) 24-32 y | RMFA | |
| Education | (1) Secondary school; (2) Further education/degree | VO2max | mL·kg−1·min−1 (continuous) |
| Season at start of training | (1) Autumn; (2) Winter; (3) Spring; (4) Summer | Push-ups | Counts (continuous) |
| Anthropometric assessment | Sit-up tests | Counts (continuous) | |
| Height | Meters (continuous) | Pull-up test | Counts (continuous) |
| Body weight | Kilograms (continuous) | Exercise pre-RM training | |
| Dietary supplement usage self-reported | Amount of WB exercises | (1) 0-2 WB exercises; (2) 3 WB exercises | |
| Multivitamins with minerals | (1) Never; (2) Sometimes; (3) Every day | Amount of non-WB exercises | (1) 0-1 non-WB exercises; (2) 2 non-WB exercises |
| Creatine | (1) Never; (2) Sometimes; (3) Every day | Duration | Number of weeks (continuous) |
| Sports/energy drinks/ energy gels | (1) Never; (2) Sometimes; (3) Every day | Frequency/wk | Times per week (continuous) |
| Protein bars/powder/shakes | (1) Never; (2) Sometimes; (3) Every day | Weekly training volume | Minutes (continuous) |
| Lifestyle habits | Previous injury | ||
| Smoke | (1) Never; (2) Ex-smoker; (3) Current | Lower limb injury in dominant leg | Yes or No |
| Alcohol | Units/wk (continuous) | Lower limb injury in nondominant leg | Yes or No |
| BUA | |||
| Dominant foot | dB·MHz−1 (continuous) | ||
| Nondominant foot | dB·MHz−1 (continuous) | ||
| Blood sample | Dietary intake FFQ | ||
| Magnesium | µmol/L (continuous) | Current | |
| Zinc | µmol/L (continuous) | Milk intake | (1) Low (<285 mL/d); (2) Moderate (426 mL/d); (3) High (≥852 mL/d) |
| Selenium | µmol/L (continuous) | Milk products intake (eg, yogurt and cream) | (1) Low (<2 times per week); (2) Moderate (2-5 times per week); (3) High (≥5 times per week) |
| Copper | µmol/L (continuous) | Fruit intake | (1) Low (<8 portions per week); (2) Moderate (8-13 portions per week); (3) High (≥14 portions per week) |
| 25(OH)D | <50 nmol/L vs ≥50 nmol/L | Vegetable intake | (1) Low (<14 portions per week); (2) Moderate (14-22 portions per week); (3) High (≥23 portions per week) |
| FFQ: Physical activity | Adolescence and childhood | ||
| Current | Milk intake | (1) Low (<285 mL/d); (2) Moderate (426 mL/d); (3) High (≥852 mL/d) | |
| Minutes/d of walking | (1) <30 min/d; (2) ≥30 min/d | Milk products intake (eg, yogurt, cream, ice cream, custard, milk puddings) | (1) Low (<4 times per week); (2) Moderate (4-5 times per week); (3) High (≥6 times per week) |
| Minutes/d of cycling | (1) <30 min/d; (2) ≥30 min/d | Fruit intake | (1) Low (<4 times per week); (2) Moderate (4-5 times per week); (3) High (≥6 times per week) |
| Physical activity during working time | (1) Once or less/wk; (2) 2-3 times/wk; (3) >3 times/wk | Vegetable intake | (1) Low (<4 times/wk); (2) Moderate (4-5 times/wk); (3) High (≥6 times/wk) |
| Physical activity during nonworking time | (1) Once or less/wk; (2) 2-3 times/wk; (3) >3 times/wk | ||
| Adolescence and childhood | |||
| Physical activity | (1) Once or less/wk; (2) 2-6 times/wk; (3) >6 times/wk |
aBUA, broadband ultrasound attenuation measurement; FFQ, Food Frequency Questionnaire; RM, Royal Marines; RMFA, Royal Marine Fitness Assessment; VO2max, maximum oxygen uptake; WB, weightbearing.
Statistical Analyses
Descriptive statistics of all potential predictors, according to whether the recruit presented or did not present an SF during RM training, were examined using means (SD) or medians (interquartile range) for quantitative measures, and frequency (percentage) for categorical variables.
Linearity assumption for continuous variables (using fractional polynomials or linear splines) was assessed, and the presence of interactions between age and the other variables was tested.43 To fill in variables with missing values, and because there was less than 15% missing data (see Appendix Table A2), a stochastic simple imputation method was used. It was created as the first of a series of 10 multiple imputations using MICE (multiple imputation by chained equation)45 (see Appendix Table A1). All prespecified predictors were included in the imputation model, together with the outcome.
The predicting model was achieved in 2 steps. First, LASSO shrinkage logistic regression method54 was used to reduce the final model to the most important variables to predict SF. It shrinks the coefficient estimates toward zero, with the degree of shrinkage depending on an additional parameter, lambda (λ) (this study used λ = 1). A single model adjusted for all potential variables was fitted with a 10-fold cross-validation and the minimum average mean-squared error (MSE) to extract the nonzero coefficients and therefore the significant predictors. This method focuses on the overall fit (best model fit) rather than statistical significance of individual predictors. As a consequence, predictors with a P > .05 could still be included in the final model. Second, odds ratios (ORs) and 95% confidence intervals (CIs) using a classic logistic regression model, were estimated for the principal risk factors selected in the previous step.
Internal Validity
To check the internal validity of the model, 200 bootstrap samples with replacement were used to assess bias-corrected estimates of predictive ability.22 The evaluation of the model performance considered measures of discrimination and calibration.5,44 Discrimination was assessed using the c-index (this value varies between 0 and 1, where 1 represents perfect discrimination).21 In logistic regression, c-index is identical to the area under the receiver operating characteristic (ROC) curve. Calibration was assessed by calibration plots.
All calculations were performed using Stata statistical software version 13.1 (StataCorp) and R statistical software, version 3.2.3 (R Foundation for Statistical Computing). Variable selection and internal validation of the model were performed using the “glmnet”19 and the “rms”16 packages, respectively.
Results
Recruit Characteristics
During phase II of SGBHP, a total of 86 recruits (8% of the study cohort) suffered at least 1 SF during the 32-week training period, with the metatarsal as the most common injury site (44 recruits), followed by the tibia and fibula (34 recruits). The majority of SFs (∼80%) occurred in the latter 15 weeks of RM training (Figure 1). The highest frequency was in week 31 (17.3%), followed by week 17 (12.4%) and week 22 (11.1%).
Figure 1.
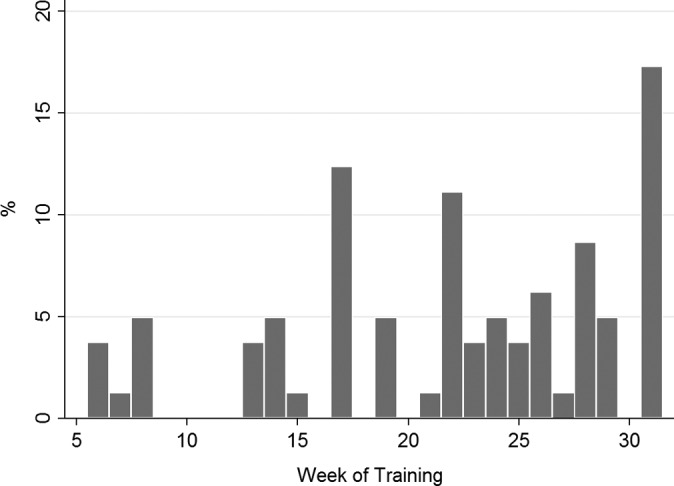
Distribution (%) of first stress fracture in 1082 recruits during 32-week training.
The proportion of missing data for each variable included in this study is shown in Appendix Table A2. The missing data represented less than or equal to 10% for all variables.
Distributions of the all-potential predictors by SF status are presented in Appendix Table A1. Significant differences (P < .05) between recruits who sustained an SF and those who did not were found for age, body weight, BUA of the dominant foot, volume of WB exercise pre-RM training, minutes per day of cycling, and milk intake during childhood. Compared with the recruits without SF, recruits with at least 1 SF during training were older, had a lower body weight, and had lower units of BUA of the dominant foot. In addition, recruits who reported a high amount of WB exercise pre-RM training preparation (3 WB exercises), cycling 30 minutes or more per day, and low intake of milk during their childhood were more likely to incur an SF.
Selection of Principal Predictors of Stress Fracture
Twelve variables were selected by the LASSO selection approach. The model contained age, body weight, smoking habit, BUA of the dominant foot, VO2max, 25(OH)D concentration, amount of WB exercise, minutes cycling per day, physical activity during childhood, vegetables intake during adolescence, and milk and milk products intake during childhood.
The ORs and 95% CI of the predictors are presented in Table 2. Higher SF risk was associated with older age group (range, 24-32 years) (OR, 1.98; 95% CI, 1.07-3.55) compared with recruits between 19 and 23 years old. Increased WB exercise pre-RM training (OR, 2.46; 95% CI, 1.51-4.00), high frequency of cycling per day pre-RM training preparation (OR, 1.71; 95% CI, 1.07-2.74), and high intake of milk products during childhood (OR, 1.84; 95% CI, 1.03-3.30) were also associated with increased risk of SF.
TABLE 2.
Estimation for Principal Risk Factors of Stress Fracture During Royal Marine Recruit Traininga
| Predictor Variable (Reference Category) | OR | 95% CI | P Valueb |
|---|---|---|---|
| Age, y (19-23) | |||
| <19 | 1.66 | 0.97-2.85 | .066 |
| >23 | 1.98 | 1.07-3.55 | .030 |
| Body weight, kg | 0.96 | 0.93-0.99 | .018 |
| Smoke (never) | |||
| Ex-smoker | 1.55 | 0.91-2.64 | .109 |
| Current | 0.73 | 0.32-1.64 | .447 |
| BUA of the dominant foot, dB·MHz−1 | 0.99 | 0.98-1.00 | .150 |
| VO2max, mL·kg−1·min−1 | 0.93 | 0.86-1.01 | .074 |
| Amount of WB exercise (0-2 exercises) | |||
| 3 exercises | 2.46 | 1.51-4.00 | <.001 |
| 25(OH)D, nmol/L (≥50) | |||
| <50 | 1.56 | 0.95-2.56 | .077 |
| Minutes/d of cycling (<30) | |||
| ≥30 | 1.71 | 1.07-2.74 | .026 |
| Physical activity in childhood (once or less/wk) | |||
| 2-6 times/wk | 1.27 | 0.54-2.96 | .584 |
| >6 times/wk | 1.76 | 0.79-3.93 | .165 |
| Adolescence | |||
| Vegetables, times/wk (Low, <4) | |||
| Moderate (4-5) | 0.67 | 0.36-1.24 | .200 |
| High (≥6) | 0.91 | 0.51-1.60 | .735 |
| Childhood | |||
| Milk intake, mL/d (Low, <285) | |||
| Moderate (426) | 0.95 | 0.57-1.61 | .862 |
| High (≥852) | 0.45 | 0.23-0.86 | .016 |
| Milk products, times/wk (Low, <4) | |||
| Moderate (4-5) | 1.19 | 0.67-2.11 | .550 |
| High (≥6) | 1.84 | 1.03-3.30 | .039 |
| Model intercept | 30.8 | ||
| c-index, fitted model (95% CI) | 0.73 (0.67-0.78) | ||
| Optimism | 0.05 | ||
| Bias-corrected c-index | 0.68 | ||
aBUA, broadband ultrasound attenuation; WB, weightbearing.
bBoldfaced P values indicate statistical significance (P < .05).
In contrast, variables strongly associated with a lower risk of SF were high body weight (OR, 0.96; 95% CI, 0.93-0.99); and high milk intake during childhood (OR, 0.45; 95% CI, 0.23-0.86) compared with low intake. Variables with a borderline statistically significant association with SF included VO2max and 25(OH)D. Recruits with poor aerobic fitness at the start of training and low concentrations of 25(OH)D (<50 nmol/L) were associated with an increased risk of SF during training.
Smoking habits, bone strength of the dominant foot, physical activity during childhood, and vegetable intake during adolescence contributed to the overall model performance, although they did not have a statistically significant association with SF.
The performance of the model showed adequate calibration (Figure 2A) and discrimination (Figure 2B), with a c-index of 0.73 (95% CI, 0.67-0.78). Using bootstrap validation, the optimism-corrected c-index was 0.68, which indicated a moderate predictive model in future volunteers.
Figure 2.

(A) Calibration curve of the prediction model of the risk of stress fracture during 32-week Marines training. The solid line indicates perfect calibration. (B) Receiver operating characteristic curve plot to assess discrimination of the predictive model.
Discussion
This study identified pretraining predictors of developing SF during the 32 weeks of RM recruit training, by using advanced statistical methods.
Age, body weight, exercise pre-RM training, and childhood milk intake were the strongest predictors of SF in the model. Although 25(OH)D, VO2max, smoking habits, bone strength of the dominant foot, physical activity during childhood, and vegetables intake during adolescence were weakly associated with SF (P > .05), the inclusion of these factors improved the performance of the model; hence, the effects attributable to these factors were small but important to explain the outcome. The predictive model had a reasonable prediction capacity and validity to identify SF in RM recruits during the training period (see Table 2).
What Do We Already Know?
The occurrence of SF during training in this population was 8%, and it was consistent with rates reported for other military recruit populations in Europe.55 Many of the variables identified as important risk factors have been shown to predict the risk of SF in earlier studies,24,53 supporting the plausibility of this model.
Age and body weight were significantly associated with SF. Older age (24-32 years) predicted SF in the present population, compared with recruits between 19 and 23 years old, which is in agreement with previous findings in other military and nonmilitary populations.4,31 Higher body weight was significantly associated with a decreased risk of SF, and this association has been well documented.15,36
Within this study, VO2max and 25(OH)D concentrations were borderline significantly associated with SF during training. Recruits with lower aerobic fitness assessed in week 1 of training were more likely to have an increased risk of SF during the subsequent 32 weeks of training. These finding were consistent with a previous report that used the Cooper test as a measure of physical fitness.55 However, a lack of association between VO2max and SF incidence has been reported in a study of Israeli infantry recruits.52 It should be noted that recruits in the present study were volunteers joining one of the United Kingdom’s elite Service Arms, where recruitment is partly based on having a high aerobic fitness at the start of training.
There is controversy with regard to 25(OH)D; previous studies found an association between low serum 25(OH)D levels and increased SF risk,10 whereas others have found no evidence of an association in military personnel.7 The present study found that low levels of 25(OH)D (<50 nmol/L) were associated with greater risk of SF during training, compared with recruits with higher levels of 25(OH)D, and this result was consistent with previous studies in this population.10
The present study aimed to produce a statistical model with the optimum predictive ability, and not to formally assess the association of 25(OH)D with SF per se. Thus, the scope of this present study, in developing an expansive prediction model, may explain the weak association for 25(OH)D.
What Does This Study Add?
This study has produced the first risk prediction model for SF during elite military training, using a wide variety of risk factors and excellent follow-up data. This model had a reasonable predictive capacity and validity to identify occurrence of SF. After appropriate external validation, this model may be useful in helping to identify recruits as well as athletes at greater risk of SF, and hence may contribute to the development of strategies to mitigate SF risk.
Although there are several well-established risk factors for SF,18,37,57 a novel finding from this study was the identification of new exercise and diet variables as predictors of SF, using an advanced variable selection method.54 Increased WB exercise pretraining was a significant risk factor of SF occurrence. This result does not agree with the majority of previous basic military studies, which have reported that recruits who had a physically active lifestyle in the past would be less likely to suffer SF when starting a vigorous exercise program.8,25,47 Possible explanations for this may be the following: First, as most SFs of foot and ankle are caused by repetitive vigorous WB activities such as running and marching, and they usually occur when individuals change their activities (eg, such as trying a new exercise, increasing the intensity of their workout, or changing the workout surface), well-conditioned individuals who have been preparing to join the RM could suffer injuries during the military training. Second, differences could be due to collecting pre-RM previous training data. High frequency of cycling per day pre-RM training preparation was associated with increased risk of SF. Cycling is an aerobic, non-WB sport that has been associated with lower BMD.46 Since BMD has been found to be a predictor of high risk of SF,9 high intensity of cycling pre-RM training may contribute to the development of SF because of its influence on bone development.
An interesting finding in the present study was the association between SF and the intake of milk and milk products during childhood. The model shows that recruits who reported a high intake of milk had a lower risk of SF than recruits with low intake of milk. A possible explanation for this is that in growing children, long-term avoidance of milk is associated with smaller stature and poorer BMD.41 As mentioned above, BMD is associated with SF; hence, inadequate childhood calcium intake may affect SF development during training due to its influence on bone health. A significant skeletal growth phase at childhood age may be particularly important to the prevention of SF.
The opposite relationship was found for milk products intake. High intake of milk products (yogurt, cream, ice cream, custard, milk puddings, etc) during childhood was statistically associated with increased risk of SF compared with a low intake. Milk products, in this study, could be related to fat products, so a high-fat dietary pattern could be associated with greater risk of SF, as inadequate nutritional intake may alter bone metabolism and predispose toward appearance of SF. Another possible explanation for this would be the lack of precision on reporting milk products.
To our knowledge, this is the first study to report an association between past dietary intake and risk of SF during male military training.
Strengths and Potential Limitations
This study has a number of strengths, including unique prospective data, a wide range of potential risk factors, and low proportion of missing data. The study used a rigorous and robust variable selection method to reduce the number of potential risk factors for SF. For prognostic studies, the LASSO regression could select the most important variables much more efficiently than the standard variable selection methods, by omitting additional and redundant variables.34 LASSO controls multicollinearity and is also applicable in settings where the number of variables is higher than the sample size, where traditional logistic regression would fail.54 Twelve factors were identified to be included into the final model, but 8 factors were identified as the most important risk factors of SF occurrence during RM training. Established measures of prediction performance, including the overall model fit, discrimination, and calibration, suggested that the final model had a satisfactory performance. A further strength of this study was the use of the RM data set, where there had been very high recruitment and retention rates.
There are several potential limitations to this study. First, because we used the LASSO methods, which variables are “clinically important” could not be defined because if 2 predictors were perfectly collinear, the LASSO will pick one of them essentially at random. Second, there are currently no common methods to incorporate multiple imputation with LASSO; therefore, single imputation was used. Single imputation may underestimate associations, and point estimates are potentially unstable, although the low level of missingness (<10%) in the data combined with the size of the data set make this unlikely.49 Third, although the inclusion of recruits who did not complete training for noninjury reasons (n = 465) in logistic regression analysis may introduce bias, excluding them would reduce the statistical power and validity of the study. An analysis excluding these recruits was performed, and no significant impact on the results and interpretation of this study was found. Fourth, the results of this study were restricted to male military personnel, which may not be generalizable to women or to a more general population. Future research should focus on the relative contribution of general population and sex-specific conditions. Fifth, residual bias may exist. The development of the model in the present study only took into account variables at the start of training. Other possible factors during training could explain the high variability in outcome. Sixth, self-reported past physical activity and diet is subject to the weakness of recall bias. However, past measures have been found to be positively correlated with those recorded objectively at the same time period,2,12,13,30,58 and hence the Food Frequency Questionnaire, used in this study, represents a valid instrument for assessing past physical activity and food intake. Seventh, an SF may have remained undiagnosed for several weeks and may even have remained unreported in some recruits, so SFs may have been underreported in this study. Finally, these results require validation through further prospective studies to improve the predictive capacity of the model. However, the results of the present study provide new important predictors of SF cases.
Conclusion
This model has provided an important contribution to the prediction of SF during RM training, identifying high-risk recruits for targeted injury-prevention studies. SF risk during training may be modified through adjustments to selection. Information from this study could be used to determine recruits at risk of developing an SF. Further replication in additional data sets may lead to further enhancement of the current model for RM and other military training programs.
Acknowledgment
The authors thank the RM recruits who participated in the study and acknowledge the assistance of the Commando Training Centre Royal Marines and specifically, staff from the Commando Training Wing, the Physical Training School, and the Medical Centre.
Appendix
TABLE A1.
Descriptive Statistics of Recruits at Week 1 According to Stress Fracture During Training (Complete Cases vs Simple Imputation)a
| Variable | Complete Cases | P Value | Simple Imputation | P Value | ||
|---|---|---|---|---|---|---|
| Stress Fracture | Non–Stress Fracture | Stress Fracture | Non–Stress Fracture | |||
| Recruit characteristics | ||||||
| Age, % | .012 | .011 | ||||
| <19 y | 36.1 | 27.2 | 36.1 | 27.4 | ||
| 19-23 y | 38.4 | 55.0 | 38.4 | 55.0 | ||
| >23 y | 25.6 | 17.8 | 25.6 | 17.6 | ||
| Education, % | .168 | .158 | ||||
| Secondary school | 53.5 | 45.7 | 53.5 | 45.6 | ||
| Further education/degree | 46.5 | 54.3 | 46.5 | 54.4 | ||
| Anthropometric assessment | ||||||
| Height, m, mean (SD) | 1.8 (0.1) | 1.8 (0.1) | .524 | 1.8 (0.1) | 1.8 (0.1) | .561 |
| Body mass, kg, mean (SD) | 72.8 (8.0) | 74.9 (7.6) | .020 | 72.8 (8.0) | 74.8 (7.6) | .021 |
| Health behaviors | ||||||
| Smoke, % | .078 | .078 | ||||
| Never | 59.3 | 65.9 | 59.3 | 65.9 | ||
| Ex-smoker | 31.4 | 21.2 | 31.4 | 21.2 | ||
| Current | 9.3 | 13.0 | 9.3 | 13.0 | ||
| Alcohol, units/wk, median, (IQR) | 12 (4-25) | 14 (2-28) | .544 | 12 (4-25) | 14 (2-28) | .545 |
| BUA, dB·MHz−1, mean (SD) | ||||||
| Dominant foot | 94.0 (17.1) | 98.5 (18.5) | .030 | 94.0 (17.1) | 98.5 (18.8) | .035 |
| Nondominant foot | 94.5 (19.3) | 96.0 (18.5) | .474 | 94.5 (19.3) | 96.0 (18.5) | .496 |
| RMFA | ||||||
| VO2max, mL·kg−1·min−1, median (IQR) | 51.9 (50.5-54.6) | 52.5 (50.8-55.1) | .104 | 51.9 (50.5-54.6) | 52.5 (50.8-55.1) | .052 |
| Press-up, counts, median (IQR) | 45 (36-52) | 45 (39-53) | .335 | 44.5 (36-52) | 45 (39-53) | .367 |
| Sit-up tests, counts, median (IQR) | 69 (56-85) | 69 (56-85) | .439 | 68 (56-85) | 68 (55.5-85) | .476 |
| Pull-up test, counts, median (IQR) | 8 (7-10) | 8 (6-10) | .204 | 8 (7-10) | 8 (6-10) | .336 |
| Exercise pre-RM training preparation | ||||||
| Number of WB exercises, % | .001 | .001 | ||||
| 0-2 WB exercises | 32.6 | 50.6 | 32.6 | 51.4 | ||
| 3 WB exercises | 67.4 | 49.4 | 67.4 | 48.6 | ||
| Number of non-WB exercises (%) | .801 | .779 | ||||
| 0-1 non-WB exercises | 57.0 | 58.4 | 57.0 | 58.5 | ||
| 2 non-WB exercises | 43.0 | 41.6 | 43.0 | 41.5 | ||
| Duration, wk, median (IQR) | 24 (12-50) | 20 (10-40) | .067 | 24 (12-48) | 20 (10-40) | .099 |
| Frequency, times/wk, median (IQR) | 5 (4-6) | 5 (4-6) | .783 | 5 (4-6) | 5 (4-6) | .748 |
| Weekly training volume, min, median (IQR) | 360 (270-540) | 360 (270-600) | .274 | 360 (270-540) | 360 (270-550) | .328 |
| Blood sample | ||||||
| Magnesium, µmol/L, mean (SD) | 1.0 (0.1) | 1.0 (0.1) | .465 | 1.0 (0.1) | 1.0 (0.1) | .558 |
| Zinc, µmol/L mean (SD) | 12.3 (3.6) | 12.5 (2.5) | .424 | 12.6 (2.2) | 12.3 (2.1) | .250 |
| Selenium, µmol/L, mean (SD) | 1.2 (0.1) | 1.2 (0.2) | .182 | 1.2 (0.1) | 1.2 (0.2) | .196 |
| Copper, µmol/L, mean (SD) | 14.0 (2.3) | 14.0 (2.3) | .846 | 13.8 (2.3) | 14.0 (2.3) | .485 |
| 25(OH)D, nmol/L, mean (SD) | .051 | .067 | ||||
| <50 nmol/L, % | 38.6 | 28.4 | 37.2 | 27.9 | ||
| ≥50 nmol/L, % | 61.5 | 71.6 | 62.8 | 72.1 | ||
| Physical activity FFQ | ||||||
| Current | ||||||
| Minutes/d of walking, % | .658 | .672 | ||||
| <30 min | 12.8 | 14.5 | 12.8 | 14.5 | ||
| ≥30 min | 87.2 | 85.5 | 87.2 | 85.5 | ||
| Minutes/d of cycling, % | .016 | .012 | ||||
| <30 min | 40.0 | 53.6 | 39.5 | 53.7 | ||
| ≥30 min | 60.0 | 46.4 | 60.5 | 46.3 | ||
| Physical activity during working time, % | .851 | .807 | ||||
| Once or less/wk | 29.1 | 26.5 | 29.1 | 26.0 | ||
| 2-3 times/wk | 12.8 | 12.4 | 12.8 | 12.6 | ||
| >3 times/wk | 58.1 | 61.1 | 58.1 | 61.5 | ||
| Physical activity during nonworking time (%) | .497 | .500 | ||||
| Once or less/wk | 10.5 | 15.0 | 10.5 | 15.1 | ||
| 2-3 times/wk | 12.8 | 11.1 | 12.8 | 11.4 | ||
| >3 times/wk | 76.7 | 74.0 | 76.7 | 73.6 | ||
| Adolescence | ||||||
| Physical activity, % | .799 | .800 | ||||
| Once or less/wk | 7.1 | 8.6 | 7.0 | 8.8 | ||
| 2-6 times/wk | 27.4 | 29.5 | 27.9 | 28.9 | ||
| >6 times/wk | 65.5 | 62.0 | 65.1 | 62.3 | ||
| Childhood | ||||||
| Physical activity, % | .124 | .224 | ||||
| Once or less/wk | 9.5 | 15.6 | 9.3 | 12.9 | ||
| 2-6 times/wk | 28.6 | 37.1 | 30.2 | 36.2 | ||
| >6 times/wk | 61.9 | 50.3 | 60.5 | 50.9 | ||
| Dietary intake FFQ | ||||||
| Current | ||||||
| Milk intake, mL/d, % | .974 | .973 | ||||
| Low (<285) | 16.3 | 16.7 | 16.3 | 16.7 | ||
| Moderate (426) | 37.2 | 36.0 | 37.2 | 35.9 | ||
| High (≥852) | 46.5 | 47.2 | 46.5 | 47.4 | ||
| Milk products, times/wk, tertiles | .386 | .329 | ||||
| Low (<2) | 20.9 | 27.8 | 20.9 | 28.4 | ||
| Moderate (2-5) | 39.5 | 35.5 | 39.5 | 35.2 | ||
| High (≥5) | 39.5 | 36.7 | 39.5 | 36.4 | ||
| Fruit, portions/wk, tertiles | .658 | .518 | ||||
| Low (<8) | 27.9 | 31.6 | 27.9 | 32.4 | ||
| Moderate (8-13) | 30.2 | 31.2 | 30.2 | 31.6 | ||
| High (≥14) | 41.9 | 37.2 | 41.9 | 35.9 | ||
| Vegetables, portions/wk, tertiles | .583 | .527 | ||||
| Low (<14) | 26.7 | 30.7 | 26.7 | 31.1 | ||
| Moderate (14-22) | 40.7 | 35.4 | 40.7 | 34.9 | ||
| High (≥23) | 32.6 | 34.0 | 32.6 | 33.9 | ||
| Adolescence | ||||||
| Milk intake, mL/d, % | .572 | .574 | ||||
| Low (<285) | 12.8 | 15.0 | 12.8 | 14.9 | ||
| Moderate (426) | 40.7 | 35.1 | 40.7 | 35.1 | ||
| High (≥852) | 46.5 | 49.9 | 46.5 | 50.0 | ||
| Milk products, times/wk, % | .735 | .721 | ||||
| Low (<3) | 34.9 | 39.2 | 34.9 | 39.3 | ||
| Moderate (4-5) | 33.7 | 31.2 | 33.7 | 30.9 | ||
| High (≥6) | 31.4 | 29.6 | 31.4 | 29.8 | ||
| Fruit, times/wk, % | .876 | .869 | ||||
| Low (<3) | 25.6 | 23.3 | 25.6 | 23.2 | ||
| Moderate (4-5) | 33.7 | 34.0 | 33.7 | 33.9 | ||
| High (≥6) | 40.7 | 42.8 | 40.7 | 42.9 | ||
| Vegetables, times/wk, % | .347 | .321 | ||||
| Low (<3) | 29.1 | 25.3 | 29.1 | 24.7 | ||
| Moderate (4-5) | 27.9 | 35.7 | 27.9 | 35.8 | ||
| High (≥6) | 43.0 | 39.1 | 43.0 | 39.5 | ||
| Childhood | ||||||
| Milk intake, mL/d, % | .077 | .090 | ||||
| Low (<285) | 38.4 | 31.1 | 38.4 | 31.3 | ||
| Moderate (426) | 43.0 | 39.0 | 43.0 | 39.2 | ||
| High (≥852) | 18.6 | 29.9 | 18.6 | 29.5 | ||
| Milk products, times/wk, % | .298 | .303 | ||||
| Low (<3) | 33.7 | 39.3 | 33.7 | 39.1 | ||
| Moderate (4-5) | 31.4 | 33.6 | 31.4 | 33.7 | ||
| High (≥6) | 34.9 | 27.2 | 34.9 | 27.3 | ||
| Fruit, times/wk, % | .507 | .470 | ||||
| Low (<3) | 38.4 | 35.6 | 38.4 | 34.9 | ||
| Moderate (4-5) | 38.4 | 35.2 | 38.4 | 35.5 | ||
| High (≥6) | 23.3 | 29.2 | 23.3 | 29.5 | ||
| Vegetables, times/wk, % | .769 | .779 | ||||
| Low (<3) | 31.4 | 35.1 | 31.4 | 35.0 | ||
| Moderate (4-5) | 36.1 | 34.9 | 36.1 | 34.9 | ||
| High (≥6) | 32.6 | 29.9 | 32.6 | 30.0 | ||
aBUA, broadband ultrasound attenuation; FFQ, Food Frequency Questionnaire; IQR, interquartile range; RM, Royal Marines; RMFA, Royal Marine Fitness Assessment; WB, weightbearing.
TABLE A2.
Missing Data
| Variable | Missing, n (%) |
|---|---|
| Recruit characteristics | |
| Age, y | 43 (4.0) |
| Education | 58 (5.4) |
| Season at start training | — |
| Anthropometric assessment | |
| Height (m) | 55 (5.1) |
| Body mass (kg) | 55 (5.1) |
| Dietary supplement usage self-reported | |
| Multivitamins with minerals | — |
| Creatine | — |
| Sports/energy drinks/energy gels | — |
| Protein bars/powder/shakes | — |
| Health behaviors | |
| Smoke | 46 (4.3) |
| Alcohol, units | 57 (5.3) |
| BUA, dB·MHz−1 | |
| Dominant foot | 50 (4.6) |
| Nondominant foot | 47 (4.3) |
| RMFA | |
| VO2max, mL·kg−1·min−1 | 111 (10.3) |
| Press-up test, counts | 112 (10.4) |
| Sit-up test, counts | 111 (10.3) |
| Pull-up test (counts) | 112 (10.4) |
| Exercise pre-RM training preparation | |
| WB and non-WB exercises | 59 (5.5) |
| Frequency/wk, times/wk | 81 (7.5) |
| Duration, wk | 105 (9.7) |
| Weekly training volume, min | 93 (8.6) |
| Previous injury | |
| Lower limb injury in dominant leg | — |
| Lower limb injury in nondominant leg | — |
| Blood sample | |
| Magnesium, µmol/L | 52 (4.8) |
| Zinc, µmol/L | 57 (5.3) |
| Selenium, µmol/L | 51 (4.7) |
| Copper, µmol/L | 52 (4.8) |
| 25(OH)D, nmol/L | 69 (6.4) |
| Physical activity FFQ | |
| Current | |
| Walking, min/d | 54 (5.0) |
| Cycling, min/d | 61 (5.6) |
| Physical activity during working time | 55 (5.1) |
| Physical activity during nonworking time | 55 (5.1) |
| Adolescence | |
| Physical activity | 62 (5.7) |
| Childhood | |
| Physical activity | 61 (5.6) |
| Dietary intake FFQ | |
| Current | |
| Milk, mL/d | 54 (5.0) |
| Milk products, times/wk | 54 (5.0) |
| Fruit, times/wk | 54 (5.0) |
| Vegetables, times/wk | 54 (5.0) |
| Adolescence | |
| Milk, mL/d | 54 (5.0) |
| Milk products, times/wk | 54 (5.0) |
| Fruit, times/wk | 54 (5.0) |
| Vegetables, times/wk | 54 (5.0) |
| Childhood | |
| Milk, mL/d | 54 (5.0) |
| Milk products, times/wk | 54 (5.0) |
| Fruit, times/wk | 54 (5.0) |
| Vegetables, times/wk | 54 (5.0) |
aBUA, broadband ultrasound attenuation; FFQ, Food Frequency Questionnaire; RMFA, Royal Marine Fitness Assessment; WB, weightbearing.
Footnotes
One or more of the authors has declared the following potential conflict of interest or source of funding: This work was supported by UK Ministry of Defence and the Arthritis Research UK Centre for Sport, Exercise and Osteoarthritis (Grant reference 20194). A.J. is a consultant for Servier, UK Renal Registry, Oxford Craniofacial Unit, and Freshfields Bruckhaus Deringer, has grants/grants pending from Roche-Chugai, and receives honoraria from the Blood journal. N.K.A. is a paid consultant for Merck, Smith & Nephew, Nicox, Flexion, Bioventus, and Freshfields and has received grants from Roche, Bioiberica, and Novartis.
Ethical approval for this study was obtained from the Ministry of Defence Research Ethics Committee, London, UK (ref: 0926/251).
References
- 1. Almeida SA, Williams KM, Shaffer RA, Brodine SK. Epidemiological patterns of musculoskeletal injuries and physical training. Med Sci Sports Exerc. 1999;31:1176–1182. [DOI] [PubMed] [Google Scholar]
- 2. Besson H, Harwood CA, Ekelund U, et al. Validation of the historical adulthood physical activity questionnaire (HAPAQ) against objective measurements of physical activity. Int J Behav Nutr Phys Act. 2010;7:54. [DOI] [PMC free article] [PubMed] [Google Scholar]
- 3. Brewer J, Ramsbottom R, Williams C. Multistage Fitness Test: A Progressive Shuttle-Run Test for the Prediction of Maximum Oxygen Uptake. Leeds, UK: Loughborough University, National Coaching Foundation; 1988. [Google Scholar]
- 4. Buist I, Bredeweg SW, Bessem B, van Mechelen W, Lemmink KA, Diercks RL. Incidence and risk factors of running-related injuries during preparation for a 4-mile recreational running event. Br J Sports Med. 2010;44:598–604. [DOI] [PubMed] [Google Scholar]
- 5. Collins GS, Mallett S, Altman DG. Predicting risk of osteoporotic and hip fracture in the United Kingdom: prospective independent and external validation of QFractureScores. BMJ. 2011;342:D3651. [DOI] [PMC free article] [PubMed] [Google Scholar]
- 6. Collins GS, Reitsma JB, Altman DG, Moons KG. Transparent Reporting of a multivariable prediction model for Individual Prognosis or Diagnosis (TRIPOD): the TRIPOD statement. Ann Intern Med. 2015;162:55–63. [DOI] [PubMed] [Google Scholar]
- 7. Dao D, Sodhi S, Tabasinejad R, et al. Serum 25-hydroxyvitamin D levels and stress fractures in military personnel: a systematic review and meta-analysis. Am J Sports Med. 2015;43:2064–2072. [DOI] [PubMed] [Google Scholar]
- 8. Dash N, Kushwaha A. Stress fractures—a prospective study amongst recruits. Med J Armed Forces India. 2012;68:118–122. [DOI] [PMC free article] [PubMed] [Google Scholar]
- 9. Davey T, Lanham-New SA, Shaw AM, et al. Fundamental differences in axial and appendicular bone density in stress fractured and uninjured Royal Marine recruits—a matched case-control study. Bone. 2015;73:120–126. [DOI] [PubMed] [Google Scholar]
- 10. Davey T, Lanham-New SA, Shaw AM, et al. Low serum 25-hydroxyvitamin D is associated with increased risk of stress fracture during Royal Marine recruit training. Osteoporos Int. 2016;27:171–179. [DOI] [PubMed] [Google Scholar]
- 11. Delaney S, Lanham-New SA, Leiper R, et al. Validation of a modified FFQ for assessing food and nutrient intake in military personnel. Proc Nutr Soc. 2010;69:E65. [Google Scholar]
- 12. DuBose KD, Edwards S, Ainsworth BE, Reis JP, Slattery ML. Validation of a historical physical activity questionnaire in middle-aged women. J Phys Act Health. 2007;4:343–355. [DOI] [PubMed] [Google Scholar]
- 13. Dwyer JT, Gardner J, Halvorsen K, Krall EA, Cohen A, Valadian I. Memory of food intake in the distant past. Am J Epidemiol. 1989;130:1033–1046. [DOI] [PubMed] [Google Scholar]
- 14. Finestone A, Milgrom C. How stress fracture incidence was lowered in the Israeli army: a 25-yr struggle. Med Sci Sports Exerc. 2008;40(suppl 11):S623–S629. [DOI] [PubMed] [Google Scholar]
- 15. Finestone A, Milgrom C, Evans R, Yanovich R, Constantini N, Moran DS. Overuse injuries in female infantry recruits during low-intensity basic training. Med Sci Sports Exerc. 2008;40(suppl 11):S630–S635. [DOI] [PubMed] [Google Scholar]
- 16. Frank E, Harrell J. rms: Regression modeling strategies. http://biostat.mc.vanderbilt.edu/rms. Accessed May 2016.
- 17. Fredericson M, Jennings F, Beaulieu C, Matheson GO. Stress fractures in athletes. Top Magn Reson Imaging. 2006;17:309–325. [DOI] [PubMed] [Google Scholar]
- 18. Friedl KE, Evans RK, Moran DS. Stress fracture and military medical readiness: bridging basic and applied research. Med Sci Sports Exerc. 2008;40(suppl 11):S609–S622. [DOI] [PubMed] [Google Scholar]
- 19. Friedman J, Hastie T, Tibshirani R. Regularization paths for generalized linear models via coordinate descent. J Stat Softw. 2010;33:1–22. [PMC free article] [PubMed] [Google Scholar]
- 20. Greenspan SL, Bouxsein ML, Melton ME, et al. Precision and discriminatory ability of calcaneal bone assessment technologies. J Bone Miner Res. 1997;12:1303–1313. [DOI] [PubMed] [Google Scholar]
- 21. Harrell FE., Jr Regression Modeling Strategies: With Applications to Linear Models, Logistic Regression, and Survival Analysis. New York, NY: Springer; 2001. [Google Scholar]
- 22. Harrell FE., Jr Regression Modeling Strategies: With Applications to Linear Models, Logistic Regression, and Survival Analysis. 2nd ed New York, NY: Springer; 2015. [Google Scholar]
- 23. Harrell FE, Jr, Lee KL, Califf RM, Pryor DB, Rosati RA. Regression modelling strategies for improved prognostic prediction. Stat Med. 1984;3:143–152. [DOI] [PubMed] [Google Scholar]
- 24. Jones BH, Thacker SB, Gilchrist J, Kimsey CD, Jr, Sosin DM. Prevention of lower extremity stress fractures in athletes and soldiers: a systematic review. Epidemiol Rev. 2002;24:228–247. [DOI] [PubMed] [Google Scholar]
- 25. Knapik JJ, Graham B, Cobbs J, Thompson D, Steelman R, Jones BH. A prospective investigation of injury incidence and injury risk factors among army recruits in military police training. BMC Musculoskelet Disord. 2013;14:32. [DOI] [PMC free article] [PubMed] [Google Scholar]
- 26. Langton CM, Palmer SB, Porter RW. The measurement of broadband ultrasonic attenuation in cancellous bone. Eng Med. 1984;13:89–91. [DOI] [PubMed] [Google Scholar]
- 27. Lappe J, Davies K, Recker R, Heaney R. Quantitative ultrasound: use in screening for susceptibility to stress fractures in female army recruits. J Bone Miner Res. 2005;20:571–578. [DOI] [PubMed] [Google Scholar]
- 28. Lappe JM, Stegman MR, Recker RR. The impact of lifestyle factors on stress fractures in female army recruits. Osteoporos Int. 2001;12:35–42. [DOI] [PubMed] [Google Scholar]
- 29. Leger LA, Lambert J. A maximal multistage 20-m shuttle run test to predict VO2max. Eur J Appl Physiol Occup Physiol. 1982;49:1–12. [DOI] [PubMed] [Google Scholar]
- 30. Maruti SS, Feskanich D, Colditz GA, et al. Adult recall of adolescent diet: reproducibility and comparison with maternal reporting. Am J Epidemiol. 2005;161:89–97. [DOI] [PMC free article] [PubMed] [Google Scholar]
- 31. Mattila VM, Niva M, Kiuru M, Pihlajamaki H. Risk factors for bone stress injuries: a follow-up study of 102,515 person-years. Med Sci Sports Exerc. 2007;39:1061–1066. [DOI] [PubMed] [Google Scholar]
- 32. Montain SJ, McGraw SM, Ely MR, Grier TL, Knapik JJ. A retrospective cohort study on the influence of UV index and race/ethnicity on risk of stress and lower limb fractures. BMC Musculoskelet Disord. 2013;14:135. [DOI] [PMC free article] [PubMed] [Google Scholar]
- 33. Moran DS, Israeli E, Evans RK, et al. Prediction model for stress fracture in young female recruits during basic training. Med Sci Sports Exerc. 2008;40(suppl 11):S636–S644. [DOI] [PubMed] [Google Scholar]
- 34. Musoro JZ, Zwinderman AH, Puhan MA, ter Riet G, Geskus RB. Validation of prediction models based on lasso regression with multiply imputed data. BMC Med Res Methodol. 2014;14:116. [DOI] [PMC free article] [PubMed] [Google Scholar]
- 35. New SA, Bolton-Smith C, Grubb DA, Reid DM. Nutritional influences on bone mineral density: a cross-sectional study in premenopausal women. Am J Clin Nutr. 1997;65:1831–1839. [DOI] [PubMed] [Google Scholar]
- 36. Nunns M, House C, Rice H, et al. Four biomechanical and anthropometric measures predict tibial stress fracture: a prospective study of 1065 Royal Marines. Br J Sports Med. 2016;50:1206–1210. [DOI] [PubMed] [Google Scholar]
- 37. Patel DS, Roth M, Kapil N. Stress fractures: diagnosis, treatment, and prevention. Am Fam Physician. 2011;83:39–46. [PubMed] [Google Scholar]
- 38. Pavlou M, Ambler G, Seaman SR, et al. How to develop a more accurate risk prediction model when there are few events. BMJ. 2015;351:H3868. [DOI] [PMC free article] [PubMed] [Google Scholar]
- 39. Pucher J, Buehler R, Merom D, Bauman A. Walking and cycling in the United States, 2001-2009: evidence from the National Household Travel Surveys. Am J Public Health. 2011;101(suppl 1):S310–S317. [DOI] [PMC free article] [PubMed] [Google Scholar]
- 40. Reis JP, Trone DW, Macera CA, Rauh MJ. Factors associated with discharge during marine corps basic training. Mil Med. 2007;172:936–941. [DOI] [PubMed] [Google Scholar]
- 41. Rizzoli R. Dairy products, yogurts, and bone health. Am J Clin Nutr. 2014;99(suppl 5):1256S–1262S. [DOI] [PubMed] [Google Scholar]
- 42. Ross RA, Allsopp A. Stress fractures in Royal Marines recruits. Mil Med. 2002;167:560–565. [PubMed] [Google Scholar]
- 43. Royston P, Ambler G, Sauerbrei W. The use of fractional polynomials to model continuous risk variables in epidemiology. Int J Epidemiol. 1999;28:964–974. [DOI] [PubMed] [Google Scholar]
- 44. Royston P, Moons KG, Altman DG, Vergouwe Y. Prognosis and prognostic research: Developing a prognostic model. BMJ. 2009;338:B604. [DOI] [PubMed] [Google Scholar]
- 45. Royston P, White IR. Multiple imputation by chained equations (MICE): implementation in Stata. J Stat Softw. 2011;45(4):1–20. [Google Scholar]
- 46. Scofield KL, Hecht S. Bone health in endurance athletes: runners, cyclists, and swimmers. Curr Sports Med Rep. 2012;11:328–334. [DOI] [PubMed] [Google Scholar]
- 47. Shaffer RA, Brodine SK, Almeida SA, Williams KM, Ronaghy S. Use of simple measures of physical activity to predict stress fractures in young men undergoing a rigorous physical training program. Am J Epidemiol. 1999;149:236–242. [DOI] [PubMed] [Google Scholar]
- 48. Shaffer RA, Rauh MJ, Brodine SK, Trone DW, Macera CA. Predictors of stress fracture susceptibility in young female recruits. Am J Sports Med. 2006;34:108–115. [DOI] [PubMed] [Google Scholar]
- 49. Steyerberg EW. Clinical Prediction Models: A Practical Approach to Development, Validation, and Updating. New York, NY: Springer; 2008. [Google Scholar]
- 50. Steyerberg EW, Eijkemans MJ, Harrell FE, Jr, Habbema JD. Prognostic modelling with logistic regression analysis: a comparison of selection and estimation methods in small data sets. Stat Med. 2000;19:1059–1079. [DOI] [PubMed] [Google Scholar]
- 51. Steyerberg EW, Eijkemans MJ, Van Houwelingen JC, Lee KL, Habbema JD. Prognostic models based on literature and individual patient data in logistic regression analysis. Stat Med. 2000;19:141–160. [DOI] [PubMed] [Google Scholar]
- 52. Swissa A, Milgrom C, Giladi M, et al. The effect of pretraining sports activity on the incidence of stress fractures among military recruits. A prospective study. Clin Orthop Relat Res. 1989;245:256–260. [PubMed] [Google Scholar]
- 53. Tenforde AS, Sayres LC, Sainani KL, Fredericson M. Evaluating the relationship of calcium and vitamin D in the prevention of stress fracture injuries in the young athlete: a review of the literature. PM R. 2010;2:945–949. [DOI] [PubMed] [Google Scholar]
- 54. Tibshirani R. Regression shrinkage and selection via the Lasso. J R Stat Soc Ser B. 1996;58:267–288. [Google Scholar]
- 55. Välimäki VV, Alfthan H, Lehmuskallio E, et al. Risk factors for clinical stress fractures in male military recruits: a prospective cohort study. Bone. 2005;37:267–273. [DOI] [PubMed] [Google Scholar]
- 56. Walter S, Tiemeier H. Variable selection: current practice in epidemiological studies. Eur J Epidemiol. 2009;24:733–736. [DOI] [PMC free article] [PubMed] [Google Scholar]
- 57. Warden SJ, Burr DB, Brukner PD. Stress fractures: pathophysiology, epidemiology, and risk factors. Curr Osteoporos Rep. 2006;4:103–109. [DOI] [PubMed] [Google Scholar]
- 58. Wolk A, Bergstrom R, Hansson LE, Nyren O. Reliability of retrospective information on diet 20 years ago and consistency of independent measurements of remote adolescent diet. Nutr Cancer. 1997;29:234–241. [DOI] [PubMed] [Google Scholar]