

SUMMARY
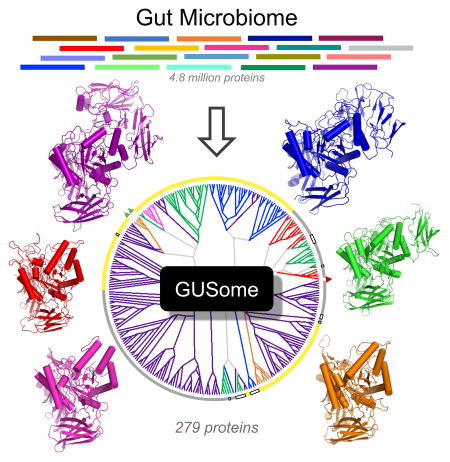
Microbiome-encoded β-glucuronidase (GUS) enzymes play important roles in human health by metabolizing drugs in the gastrointestinal (GI) tract. The numbers, types and diversity of these proteins in the human GI microbiome, however, remain undefined. We present an atlas of GUS enzymes comprehensive for the Human Microbiome Project GI database. We identify 3,013 total and 279 unique microbiome-encoded GUS proteins clustered into six unique structural categories. We assign their taxonomy, assess cellular localization, reveal the inter-individual variability within the 139 individuals sampled, and discover 112 novel microbial GUS enzymes. A representative in vitro panel of the most common GUS proteins by read abundances highlights structural and functional variabilities within the family, including their differential processing of smaller glucuronides and larger carbohydrates. These data provide a sequencing-to-molecular roadmap for examining microbiome-encoded enzymes essential to human health.
Keywords: Alpha-beta hydrolase, x-ray crystallography, gastrointestinal microbiota, glycan metabolism, Human Microbiome Project
eTOC PARAGRAPH
Microbial β-glucuronidase (GUS) enzymes cause drug-induced damage in the mammalian gut. We identify the 3,013 total and 279 unique microbial GUS proteins in the Human Microbiome Project database, and reveal their differential processing of distinct substrates. These data provide a roadmap for examining microbiome-encoded enzymes essential to human health.
INTRODUCTION
The gastrointestinal (GI) microbiota is a highly complex ecosystem that lives in intimate symbiosis with its mammalian host (David et al., 2013; Kau et al., 2011; Maurice et al., 2013; Methé et al., 2012; Mitreva and Consortium, 2012; Turnbaugh et al., 2008). Such complexity, however, makes probing the molecular basis of microbial-mammalian mutualism a daunting task. Mechanistic studies are typically reductionist, focusing on specific gene products and examining them in model systems. While next-generation sequencing continues to provide a wealth of paradigm-shifting data, its results are more difficult to reduce to a protein-level understanding of the molecular connections between the microbiota and the mammalian host.
Fortunately, microbial-mammalian symbioses often exist in interlocking functional systems that co-evolved for mutual benefit. These systems can in principle be reduced to a manageable number of molecular factors, allowing for the use of next-generation sequencing data to probe the interplay between the host and the GI microbiota. One such system is the inactivation of endobiotic and xenobiotic compounds by mammalian Phase II drug metabolism and the subsequent reactivation of these chemicals by GI microbial enzymes (Figure 1A). The mammalian UDP-glucuronosyltransferase (UGT) family of drug metabolizing proteins link single glucuronic acid sugars to a variety of compounds marked for excretion via the GI tract (Mackenzie et al., 1997; Meech et al., 2012). In the intestines, symbiotic bacteria express β-glucuronidase (GUS) enzymes capable of removing the inactivating glucuronic acid to use as a carbon source, and either further metabolize the parent compound or release it into the GI lumen (Mani et al., 2014). Previously glucuronidated compounds reactivated by GI microbial GUS enzymes can be reabsorbed to reach the plasma and be subject to cycles of enterohepatic recirculation (Figure 1A) (Redinbo, 2014).
Figure 1. Human GI Microbial GUS Enzymes, the GUS Rubric and the GUSome.

A. Compound inactivation by UDP-glucuronosyltransferases (UGT) that add glucuronic acid sugar (GlcUA). Endogenous (endobiotic), foreign (xenobiotic) and dietary glucuronides are substrates for the microbial β-glucuronidase (GUS) enzymes in the gastrointestinal tract (GI), collectively termed the GUSome. B. E. coli GUS structure and active site residues employed to create the GUS Rubric. C. Two of the Human Microbiome Project (HMP) Stool Sample Catalog datasets were screened, with 3,013 GUS proteins identified from the HMGI (HMGI3013), a collection of all GUS proteins from 139 individuals, and 279 GUS proteins (HMGC279) from the non-redundant HMGC. See also File S1, File S2, STAR Methods.
A great deal is known about the diversity, activity and expression of the mammalian UGTs (Meech et al., 2012). The UGT isoforms responsible for glucuronidation of a range of compounds including hormones, neurotransmitters, anticancer agents, NSAIDs, and environmental carcinogens have been characterized. By contrast, in spite of their importance in physiology and disease, relatively little is known about the GI microbial GUS enzymes that process endobiotic and xenobiotic glucuronide metabolites (Wallace et al., 2015). While microbial GUS activity has been demonstrated against many of the compounds known to be processed by mammalian UGTs, the microbes and associated enzymes responsible for this activity have not been elucidated. Microbial GUS activity is of particular interest because non-steroidal anti-inflammatory drugs (NSAIDs) and the cancer drug irinotecan cause significant intestinal damage through the actions of GI microbial GUS enzymes (Boelsterli et al., 2012; Takasuna et al., 1996). These effects have been alleviated in mice using bacterial GUS-targeted inhibitors (LoGuidice et al., 2012; Mani et al., 2014; Roberts et al., 2013; Saitta et al., 2014; Wallace et al., 2010, 2015). In addition to their role in the UGT pathway of drug metabolism, GUS enzymes are predicted to metabolize dietary and host-generated polysaccharides containing terminal glucuronide moieties (Koropatkin et al., 2012; Salyers and O’Brien, 1980).
The specific types and diversity of GI microbial GUS enzymes responsible for processing these chemically-distinct glucuronide substrates have not been determined, in part because we lack an understanding of the comprehensive diversity of bacterial GUS proteins present in the mammalian GI tract. The GUS enzyme was first described in 1934 (Masamune, 1934; Oshima, 1934), and GUS activity has since been noted in the major bacterial phyla of the mammalian GI: Bacteroidetes, Firmicutes, Proteobacteria, and Actinobacteria (Gloux et al., 2011; Kim et al., 2000; McBain and Macfarlane, 1998; Nakamura et al., 2002; Russell and Klaenhammer, 2001). Next-generation sequencing has also revealed novel β-glucuronidases, providing important advances in our understanding of unique GUS enzyme orthologs present in the mammalian GI (Gloux et al., 2011). In spite of these data, however, a complete view of the GUS enzymes in the GI microbiome – a “GUSome” – has yet to be assembled.
Here, we provide a comprehensive catalog of microbial GUS genes from gut metagenomic data assembled by the Human Microbiome Project. Guided by crystal structures of microbial GUS enzymes, we identify and describe the human GI microbial GUSome and characterize a representative set of GUS enzymes that sample its structural and functional diversity. These results facilitate a deeper understanding of glucuronide processing by GI microbes that affects host homeostasis and disease, and provide a roadmap for the creation of similar functional catalogs of other GI microbial protein families present in microbiome deep-sequencing data.
RESULTS
Identifying GUS Proteins from Human GI
The Human Microbiome Project (HMP) Stool Sample Catalog, the set of genes sequenced from fecal samples collected by the HMP, contains more than 26.5 million translated protein sequences in its Gene Indices (HMGI) and 4.8 million in its Clustered Gene Indices (HMGC) databases (Methé et al., 2012). The Clustered data consolidates proteins that share >95% sequence identity, and thus represents a library of unique proteins in the human GI microbiome. To find genes that encode β-glucuronidase (GUS) enzymes in these vast databases, a two-step rubric was employed based on microbial GUS proteins of known structure and the conservation of residues essential to GUS function (Figure 1B). First, the HMGI and HMGC databases were screened to identify proteins with E-values < 0.05 and sequence identity ≥25% in a pair-wise alignment to at least one of the four microbial GUS enzymes of known crystal structure from E. coli, C. perfringens, S. agalactiae, and B. fragilis (Wallace et al., 2010, 2015). This step captured 1,646,315 proteins from the HMGI (6.2% of the total) and 267,594 proteins from the HMGC (5.5% of the total), and likely represent the wide range of microbial glycosyl α/β hydrolases. Although this type of information can be provided by the Pfam database (Finn et al., 2016), for example, which correctly identifies glycosyl hydrolase domains in GUS and β-galactosidase (GAL) candidate sequences, importantly, the Pfam database is not able to definitely distinguish between these two enzymes. GUS and GAL proteins share the same fold but maintain functionally-critical differences in their active sites. For example, we previously identified the “N-K motif” unique to the active site of GUS enzymes and distinct from GAL proteins, and used that information to correct a microbial GUS initially classified as a GAL (3CMG from B. fragilis) (Wallace et al., 2015).
Second, the 1,646,315 and 267,594 sequences identified from the HMGI and HMGC databases, respectively, in the first step were screened for conserved active site residues essential to hydrolyzing glucuronide-containing substrates including (Figure 1B) (Wallace et al., 2010, 2015). The conserved residues included the two catalytic glutamic acids and a proximal asparagine as well as invariant Gly, Asn and Lys side chains (N566, K568, G569; the “N-K motif” noted above) that distinguish the carboxylic acid moiety unique to glucuronic acid (GlcUA) relative to the primary alcohol in the nearly isostructural galactose (Figure 1B) (Matsumura and Ellington, 2001; Wallace et al., 2015). These GUS-specific active site residues were identified using a combination of structural and functional data (Matsumura and Ellington, 2001; Roberts et al., 2013; Wallace et al., 2010). Furthermore, the seven residues selected to define the GUS rubric (Figure 1B) were completely conserved in multiple sequence alignments in confirmed GUS enzymes and in GUS proteins of known structure (Callanan et al., 2007; Gloux et al., 2011; Hassan et al., 2013; Wallace et al., 2010, 2015).
The second, active site structure-guided step identified 3,013 GUS proteins (0.011% of the total) from the full 26.5 million member HMGI database (we term this group HMGI3013; Figure 1C; Data File S1, HMGI3013 Sequences, Related to Figure 1), and 279 unique non-redundant GUS proteins (0.0057% of the total) from the 4.8 million HMGC database (termed HMGC279; Figure 1C; Data File S2, HMGC279 Sequences, Related to Figure 1). Structure-guided screening reduced the number of glycosyl hydrolase fold-containing proteins selected from the first step by three orders of magnitude. These data define the first collective human GI microbial GUSome. We expect that only GUS-type enzymes were identified because no validated GAL was present in the HMGI3013 or HMCG279 datasets created. Furthermore, because the HMGI3013 dataset was assembled from 139 individuals, the number and types of GUS enzymes present within each individual can be examined (e.g., GUS1.1, the first GUS from Individual 1, etc.; Figure 1C; STAR Methods). These data significantly extend our understanding of the catalytic potential of the microbiota and demonstrate the utility of employing structure-guided rubrics to annotate microbiome sequencing data.
Distinct Enzyme Architectures in the GUSome
While hundreds to thousands of proteins are more tractable than millions, we sought to further categorize the GUSome. In multiple sequence alignments of the HMGC279 proteins, the active site residues and core predicted α/β hydrolase folds were highly conserved (Figure 2A; Data File S3, Representative GUS Loop Alignment, Related to Figure 2). By contrast, the active site-adjacent Loop 1 and Loop 2 exhibited marked variability in length and amino acid composition (Figure 2A, B; Data File S3, Representative GUS Loop Alignment, Related to Figure 2). These regions were therefore employed to generate more manageable categories of GUSome proteins (STAR Methods; Data File S3, Representative GUS Loop Alignment, Related to Figure 2). Loop 1 was initially termed the “Bacterial Loop” in E. coli GUS (Figure 2A) (Wallace et al., 2010); however, as outlined below, Loop 1 exhibits two sizes: a full Loop 1 of >15 residues and a smaller Mini-Loop 1 of 10–15 residues. The second region, Loop 2, is adjacent in structure to Loop 1, located three residues in the amino acid sequence away from a catalytic glutamic acid, and is variable in length across the GUSome (Figures 2A, B; Data File S3, Representative GUS Loop Alignment, Related to Figure 2). Like Loop 1, Loop 2 occurs in a full size of ≥12 residues, as well as a Mini-Loop 2 of 9–11 residues.
Figure 2. Human GI Microbial GUS Loop Categories.

A. E. coli GUS structure (grey) with conserved active site (yellow) and the variable Loop 1 and Loop 2 regions (cyan). B. Loop 1 and 2 sequences of representative GUS enzymes (Eu., Eubacterium; F., Faecalibacterium; B., Bacteroides; P., Parabacteroides) with residue numbers for E. coli GUS. C. Active sites of GUS enzymes from each loop category. E. coli and B. fragilis GUS are of known structure, while the others are models. See also Files S3, S4.
Each protein in the HMGI3013 and HMGC279 GUSome datasets can be classified into one of seven categories: Loop 1 (L1), Mini-Loop 1 (mL1), Loop 2 (L2), Mini-Loop2 (mL2), Mini-Loop 1,2 (mL1,2), No Loop (NL), and no coverage (Figures 2B–C; Table 1; Tables S1, S2, Related to Table 1). “No coverage” is not a formal enzyme category; instead, these predicted proteins lack sequencing information for one or both loop regions. They are a small fraction (2.2–4.8%) of the GUS protein sets in-hand (Table 1; Table S2, HMGC279 Characteristics, Related to Table 1; Data File S2, HMGC279 Sequences, Related to Table 1; Figure S1, Related to Table 1) and are indicative of sequencing “dark matter” present in whole-genome metagenome data.
Table 1. Composition of the HMGI3013 and HMGC279 GUS enzyme datasets by loop category.
The “no coverage” category are proteins with no sequence coverage for either the Loop 1 or Loop 2. (n/a, not applicable).
| Loop 1 (L1) | Mini-Loop 1 (mL1) | Loop 2 (L2) | Mini-Loop 2 (mL2) | Mini-Loop 1, 2 (mL1,2) | No Loop (NL) | no coverage | |
|---|---|---|---|---|---|---|---|
| HMGI3013 Composition Percent (number) | 5.6% (165) | 20.7% (615) | 11.9% (351) | 6.7% (208) | 1.3% (36) | 49% (1494) | 4.8% (144) |
| HMGC279 Composition Percent (number) | 5.7% (16) | 14.7% (41) | 14% (39) | 3.9% (11) | 2.2% (6) | 57.3% (160) | 2.2% (6) |
| Length range num. residues | 595–611 | 578–685 | 830–1085 | 685–807 | 661–665 | 555–1059 | n/a |
| Examples | E. coli Eu. eligens F. prausnitzii | B. fragilis | B. uniformis | P. merdae | B. ovatus | B. dorei | n/a |
Loop 1 (L1) GUS enzymes contain a >15 residue loop at the 356–380 region of E. coli GUS (Figures 2B, C; Data File S3, Representative GUS Loop Alignment, Related to Figure 2) (Wallace et al., 2010). Additional L1 GUS structures from the Firmicutes species Clostridium perfringens and Streptococcus agalactiae contain 22- and 21-residue loops in this location (Data File S3, Representative GUS Loop Alignment, Related to Figure 2) (Wallace et al., 2015). The L1 regions of Firmicutes Eubacterium eligens and Faecalibacterium prausnitzii GUS enzymes identified in this study (see below) reveal 24- and 27-residue loops (Figures 2B, C; Data File S3, Representative GUS Loop Alignment, Related to Figure 2). L1 enzymes represent ~5.5% of the GUS protein sequences identified (Table 1; Table S2, HMGC279 Characteristics, Related to Table 1). Mini-Loop 1 (mL1) enzymes contain a loop of 10–15 residues in the same location as Loop 1. Bacteroides fragilis GUS of the Bacteroidetes phylum, with a 12-residue loop, is a mL1 GUS of known structure (Figures 2B, C; Data File S3, Representative GUS Loop Alignment, Related to Figure 2; RCSB 3CMG). mL1 enzymes are relatively abundant, represent 15–21% of the total GUS enzymes identified (Table 1; Tables S1, S2, Related to Table 1) and can contain additional C-terminal carbohydrate binding domains, as outlined below.
Loop 2 (L2) GUS proteins contain a ≥12 residue insertion region 416–419 of E. coli GUS, and are represented by a B. uniformis GUS (Figures 2B, C; see below). A model of B. uniformis GUS suggests a 19-residue loop in this position (amino acids 428 to 446; Figure 2C; Data File S3, Representative GUS Loop Alignment, Related to Figure 2). L2 GUS enzymes lack Loop 1 motifs (Figure 2B, C; Data File S3, Representative GUS Loop Alignment, Related to Figure 2), represent 12–14% of the GUS proteins identified (Table 1; Tables S1, S2, Related to Table 1), and contain additional C-terminal domains relative to L1 enzymes. Mini-Loop 2 (mL2) enzymes exhibit a loop of 9–12 residues in length in the same location, contain no Loop 1, and are represented by a Parabacteroides merdae GUS (Figures 2B, C; Data File S3, Representative GUS Loop Alignment, Related to Figure 2). mL2 proteins comprise 4–7% of the total GUS enzymes in our analysis (Table 1; Tables S1, S2, Related to Table 1).
A small number of GUS proteins, representing only 1–2% of the total datasets, contain both Mini-Loop 1 and Mini-Loop 2 motifs (Figures 2B, C; Table 1; Tables S1, S2, Related to Table 1). Mini-Loop 1,2 (mL1,2) enzymes exhibit 10–15 residues in the Loop 1 and 9–12 residues in Loop 2 (Figures 2B, C; Data File S3, Representative GUS Loop Alignment, Related to Figure 2). A model of a representative GUS from Bacteroides ovatus reveals the two loops in close proximity and suggests that full loops in either location would clash, perhaps explaining why enzymes containing full Loop 1 and Loop 2 inserts were not observed (Figure 2C). Finally, No Loop (NL) GUS enzymes lack a loop in either position (Figures 2B, C; Data File S3, Representative GUS Loop Alignment, Related to Figure 2). NL enzymes are by far the most abundant GUS identified, comprising 49–57% of each of our datasets (Table 1; Tables S1, S2, Related to Table 1). The H11G11 GUS previously discovered from human fecal metagenomics data was identified in this HMP analysis and categorized as a NL enzyme (Gloux et al., 2011) (Data File S3, Representative GUS Loop Alignment, Related to Figure 2; Table S2, HMGC279 Characteristics, Related to Table 1). Taken together, the human GI microbial GUSome is composed of enzymes that decorate a conserved fold with distinct active site-adjacent loops, likely enabling them to act on chemically-variable substrates present in the intestinal tract.
HMGC279 Taxonomy and Localization
Taxonomy was assigned and a cladogram based on sequence similarity was created for the HMGC279 non-redundant set of GUS enzymes (Figure 3A). Phylum-level taxonomy was fixed for 93.5% (261) of the 279 GUS enzymes identified, while 18 enzymes remain “unclear” due to moderate sequence identity to enzymes encoded by bacteria from multiple phyla (Figure 3A, B; STAR Methods; Table S2, HMGC279 Characteristics, Related to Figure 3). Genus and species assignments were also possible for 177 of the 261 sequences of known phyla based on exhibiting ≥95% identity to a protein in the NCBI Protein database (Table S2, HMGC279 Characteristics, Related to Figure 3; Data File S2, HMGC279 Sequences, Related to Figure 3). However, 112 GUS enzymes, 18 without clear phyla and 94 without genus and species, were not previously documented in NCBI. Thus, 40% of the 279 non-redundant GUSome set represent novel microbial GUS proteins (Table S2, HMGC279 Characteristics, Related to Figure 3), an indication of the potential of the GI microbiome for enzyme discovery.
Figure 3. Human GI Microbial HMGC279 Taxonomy, Localization and Composition.

A. Cladogram for the 279 GUSome including a few without clear taxonomy (Unclear). GUS loop types in each phylum are indicated. B. Phylum composition with numbers of GUS enzymes per phylum indicated. C. Predicted signal sequence prevalence for each GUS type. GUS without clear signal sequences are thus labeled “uncertain.” D. GUS protein length colored by loop category. 61 had unclear sequences and were not assigned a length.
For the 261 sequences with unambiguous taxonomy, the following phyla were observed (Figure 3A, B; Table S2, HMGC279 Characteristics, Related to Figure 3): Bacteroidetes (52%), Firmicutes (43%), Verrucomicrobia (1.5%), and Proteobacteria (0.5%). The Bacteroidetes phylum exhibits the broadest diversity and the largest number (137) of non-redundant GUS enzymes (Figures 3A, B; Table S2, HMGC279 Characteristics, Related to Figure 3; Data File S2, HMGC279 Sequences, Related to Figure 3). The Bacteroidetes contain proteins in five of the six loop categories, and is the only phylum that expresses the rare mL1,2 enzymes. However, no L1 enzymes were detected in the Bacteroidetes phylum (Figure 3A). The Firmicutes phylum has the next most abundant number of non-redundant GUS enzymes (112); they do not exhibit mL2 or mL1,2 enzymes, but do contain the majority of L1 and NL enzymes, a large fraction of mL1 enzymes, and one L2 enzyme (Figures 3A, B). The Verrucomicrobia phylum represents a small number of total GUS proteins (4), all of which are mL2, while the Proteobacteria phylum contains a single GUS in the 279 set, the L1 enzyme from E. coli (Figures 3A, B).
We next sought to understand the cellular localization of members of the HMGC279 non-redundant GUS set by searching for an N-terminal signal sequence that would mark the enzyme for trafficking to the periplasmic space (STAR Methods) (Navarre and Schneewind, 1999). Predicted signal sequences were based on signal peptidase I sites and were not followed by a cysteine, suggesting that enzymes with signal sequences are retained in the periplasmic space (Auclair et al., 2012; Zückert, 2014). While 20% of the overall sequences could not be classified due to missing or miscalled starting methionines, clear trends emerged (Figure 3C; Table S2, HMGC279 Characteristics, Related to Figure 3). No L1 enzyme contained a signal sequence, suggesting that L1 proteins are maintained intracellularly. By contrast, all L2, mL2, and mL1,2 enzymes contained signal sequences, indicating that these proteins can be transported across the inner microbial membrane. Roughly half of the mL1 and NL GUS proteins contained signal sequences, and these results segregated by phylum: all Firmicutes mL1 and NL proteins lacked signal sequences, while all such Bacteroidetes enzymes contained them. These results suggest functional specialization, with periplasmic proteins possibly acting on larger polysaccharide substrates, while intracellular enzymes process smaller glucuronides capable of reaching this location within the cell.
Predicted signal sequences, if present, were trimmed from the proteins in the HMGC279 to define expected enzyme lengths; 61 proteins of the 279 have unconfirmed lengths because a clear translation start or end site could not be identified (STAR Methods; Figure 3D; Table S2, HMGC279 Characteristics, Related to Figure 3). The L1, mL1, L2, mL2, and mL1,2 enzymes tended to cluster together by length classifications, while the NL enzymes sample the full range observed, from the smallest GUS at 555 amino acids to nearly the largest at 1059 residues (Figure 3D). The increase in GUS enzyme length likely corresponds to the addition of protein domains to the C-terminus of the conserved core α/β hydrolase fold, as demonstrated in more detail below. This conclusion is supported by the analysis of the HMGC279 sequences using the Carbohydrate Active enZymes (CAZy) database (Lombard et al., 2014), which describes structurally-related proteins, including glycosyl hydrolases, that act on carbohydrates. CAZy classifications for the HMGC279 sequences with confirmed lengths reveal that all enzymes have conserved glycosyl hydrolase 2 (GH2) domains located N-terminally, while those that extend beyond that domain are commonly assigned a carbohydrate binding motif (CBM) domain located C-terminally (Figure 3D; Table S2, HMGC279 Characteristics, Related to Figure 3). Together, these results reveal the diversity, localization and functional specialization of the GUS enzymes in the human intestinal microbiome.
Inter-Individual Variability in HMGI3013
The >26 million-protein HMGI-Gene Indices database is organized by samples obtained from 139 donors, allowing us to examine the GUS composition, distribution and abundance within this set of healthy fecal donors (Figure 1C; Data File S1, HMGI3013 Sequences, Related to Figure 1; Table 1; Table S1, HMGI3013 Characteristics, Related to Table 1). Our analysis only considers the presence or absence of GUS genes within individuals, however, not their expression or activity, which would require transcriptomics and/or proteomics investigations. First, the total number of GUS protein sequences in each individual’s gut microbiota was determined. All samples contained a gene predicted to encode a GUS, with a minimum of 4 GUS proteins, in one individual, and a maximum of 38 GUS proteins, in two individuals; the mean number of GUS enzymes per individual sampled was 21.7 (Figure 4A). Thus, while GUS proteins were relatively rare within the overall microbiome (e.g., 0.006–0.01% of total genes; see Figure 1C), they were universally associated with a healthy microbiota in this database.
Figure 4. Human GI Microbial HMGI3013 Composition and Abundances.

A. The 139 individuals in the HMGI contained 4 to 38 GUS proteins per individual. B. GUS composition by read abundance in each individual and rank-ordered by L1. C. Stepwise use of read abundances to identify the most common GUS of each loop category. The results of Step 3 are presented in panel D. D. Abundant GUS enzymes in each category, with those characterized further in bold. See also Figure S1, Figure S2.
Second, each GUS in the HMGI3013 was classified into a Loop category, and the number of enzymes in each category were compared across individuals (Table 2; Table S1, HMGI3013 Characteristics, Related to Table 2). Only NL GUS enzymes were observed to be present in all 139 samples, although two individuals had only one NL GUS, while one individual had 23 (Table 2; Figure S1, Related to Table 2). The mean number of NL enzymes per sample was 10.7, supporting the conclusion that No Loop enzymes represent the majority of GUS proteins in the human GI microbiome (Table 2; Figure S1, Related to Table 2). mL1 GUS enzymes were present in 99% of individuals, with a maximum of 11 and a mean of 4.4 per sample. L2 and mL2 GUS proteins were present in 92% and 81% of individuals, respectively. We also considered the average composition of each GUS type per individuals including only samples which contained at least one of these GUS classifications; thus, for L2 and mL2, the average values increase from 1.6 and 1.1 to 2.8 and 1.9 per individual, respectively (Table 2). While NL, mL1, L2 and mL2 enzymes are relatively abundant, L1 and mL1,2 enzymes are less common. L1 enzymes are only present in two-thirds of individuals. mL1,2 are rare, present in less than 25% of individuals and exhibit a mean of only 1 when they are present (Table 2; Figure S1, Related to Table 2). Taken together, these data reveal the compositional variability of this microbial enzyme in the human GI, and will facilitate future studies designed to test the functional variability across individuals.
Table 2.
Inter-individual variability in the composition of GUS types in HMGI3013 dataset.
| Loop 1 (L1) | Mini-Loop 1 (mL1) | Loop 2 (L2) | Mini-Loop 2 (mL2) | Mini-Loop 1, 2 (mL1,2) | No Loop (NL) | no coverage | |
|---|---|---|---|---|---|---|---|
| Individuals w/At Least One of this Gus Type Percent (num. of 139 total) | 66% (92) | 99% (137) | 92% (128) | 81% (112) | 24% (34) | 100% (139) | 59% (82) |
| Range of Number GUS of this Type per Individual | 0 – 5 | 0 – 11 | 0 – 7 | 0 – 4 | 0 – 2 | 1 – 23 | 0 – 5 |
| Average Number per Individual Ave. (st. dev.) | 1.2 (1.2) | 4.4 (2.2) | 2.5 (1.6) | 1.5 (1.1) | 0.25 (0.5) | 10.7 (4.6) | 1.0 (1.2) |
| Average Number per Individual w/at Least One of this GUS Type Ave. (st. dev.) | 1.8 (1.0) | 4.5 (2.2) | 2.8 (1.5) | 1.9 (0.8) | 1.1 (0.2) | 10.7 (4.6) | 1.8 (1) |
The HMGI-Gene Indices database is comprised of whole-genome metagenome deep sequencing reads. To gain an appreciation of the relative abundances of each GUS type, read abundances were calculated per sample and normalized to allow comparison across individuals (STAR Methods; Table 2; Figure S1, Related to Table 2). The overall results reflect those in Tables 1 and 2, with NL enzymes being most abundant, followed by mL1, L2, mL2, L1, and mL1,2 (Figure 4B; Figure S2, Related to Table 2). However, marked variabilities were noted across individuals (Figure S1, Related to Table 2; Table S1, HMGI3013 Characteristics, Related to Table 2). For example, some individuals contained much higher than average abundances of mL1 and L2 enzymes, while others showed increases in L1 proteins (Figure 4B). Indeed, one individual’s sample contained 25% mL1,2 enzymes, by far the least common GUS by other measures (Figure 4B; see also Figures 3A, B; Table 1; Table S1, HMGI3013 Characteristics, Related to Table 1). Such variability may be stochastic, or may reflect important functional differences between the metabolic capabilities of the microbiota in these individuals. No information on diet, health, or therapeutic use, for example, is available for the 139 individuals in the HMP’s Stool Sample Catalog; thus, resolving the basis for these distinctions will require future studies with matched metadata.
GUSome Structure and Function
To generate a representative set of microbial GUS proteins for in vitro study, the most common GUS protein of each category was identified from the HMGI3013 dataset. This was achieved by tabulating the most abundant GUS of each category within each individual by normalized read counts (Figure 4C; Step 1) and then tabulating across individuals (Figure 4C; Steps 2–3; STAR Methods). Bacteroidetes and Firmicutes dominate these abundance results, with the highly abundant enzymes in each category coming from these two phyla (Figure 4D). The exception is the mL2 proteins from the Verrucomicrobia phylum (genus Akkermansia; Figure 4D). These results provide a first view of the GUS enzymes that govern the processing of glucuronides in the GI tract, and provide a rationale for choosing novel GUS enzymes for in vitro characterization.
Indeed, a representative panel of novel GUS enzymes was created for in vitro analysis. The enzymes highlighted in bold in Figure 4D were purified to homogeneity (STAR Methods). Six GI microbiome-encoded GUS enzymes were chosen from the HMP analysis as well as two GUS enzymes already in-hand, the L1 E. coli GUS (EcGUS) (Wallace et al., 2010) and the mL1 GUS from B. fragilis, BfGUS. BfGUS has recently been shown to be a GUS (Wallace et al., 2015), is of known structure (RCSB: 3CMG), and shares 66% sequence identity with the top mL1 proteins identified. Of the novel enzymes chosen from the HMP abundancy analysis, two were L1 enzymes, from F. prausnitzii (FpGUS) and Eubacterium eligens (EeGUS; Figure 4D). The other four represent one each from the remaining categories: L2 from B. uniformis (BuGUS; Figure 4D), mL2 from P. merdae (PmGUS), mL1,2 from B. ovatus (BoGUS), and NL from B. dorei (BdGUS). The eight proteins in this panel share between 21% and 45% sequence identity (Figure 5A; Figure S3, Related to Figure 5), and range between 603 and 886 residues in length (Figure 5A).
Figure 5. Human Microbial GUS Functional and Structural Specialization.

A. Differential processing of a small p-nitrophenol glucuronide (PNPG) substrate and a larger heparosan nonasaccharide substrate composed of GlcUA-(GlcNAc-GlcUA)4-PNP (GlcUA, glucuronic acid; GlcNAc, N-acetyl-glucosamine; labeled “heparan”). Rates of PNPG processing are nmol PNP produced per minute per nmol GUS, while percent conversion of the heparan substrate over 24 hours are provided. B. Active site of the crystal structure of the Loop 2 GUS from B. uniformis (PDB ID 5UJ6). Conserved catalytic residues (yellow), helix-turn-helix motif (blue), and the carbohydrate binding region (CBM2; blue) shown. C. The CBM 1 of Mini-Loop 1 GUS from B. fragilis (3CMG; green) aligned with the longer region of BuGUS with CBM 2 (blue). E. coli Loop 1 GUS (red; 3LPF) lacks a CBM at its C-terminus.
The representative eight-protein GUS panel was first examined with the standard GUS assay substrate p-nitrophenol glucuronide (PNPG), a small glucuronide (Figure 5A; STAR Methods). Activity optima were determined for each enzyme within the pH range of 4 to 7.4 (Figure 5A; Figure S4, Related to Figure 5), and noted differences were observed. Within L1 proteins, EcGUS is active across a broad pH range, including pH 7.4, while EeGUS and FpGUS perform best at 6.5 and 6, respectively (Figure 5A; Figure S4, Related to Figure 5). Such differences may reflect the relative locations of microbial species within the GI, as the pH gradually increases from ~5 in the proximal duodenum to ~7.4 in the sigmoid colon (Abuhelwa et al., 2016). PNPG kinetic studies with each enzyme at its optimum pH (STAR Methods) revealed apparent catalytic turnover rates for the L1, mL1 and L2 enzymes to be much higher than the mL2, mL1,2 and NL GUS enzymes tested (Figure 5A). Indeed, within the L1 enzymes, E. coli and Eu. eligens GUS are remarkably efficient at PNPG processing, exhibiting rates 10-fold higher than the L1 protein from F. prausnitzii, and similarly higher than the mL1 and L2 enzymes from B. fragilis and B. uniformis, respectively (Figure 5A). This may be due to the L1 region, which could be capable of closing over small substrates within the GUS active site (see Figures 2A, C) (Wallace et al., 2010, 2015).
Loop 2 GUS proteins also maintain a reasonably long, >15-residue amino acid region located adjacent to Loop 1, and thus could also close over the catalytic site in a manner similar to L1 GUS enzymes. To understand Loop 2 GUS enzymes, we determined the 1.9 Å resolution crystal structure of B. uniformis GUS (Figure 5B; Table S3, BuGUS Crystallographic Analysis, Related to Figure 5). Contrary to expectations, the 19 amino acids of BuGUS’s Loop 2 form a helix-turn-helix motif rather than a loop; thus, the active site of the L2 BuGUS in this structure is relatively open compared to the active sites of L1 enzymes. (Figure 5B). The BuGUS L2 structure also reveals additional domains added to the C-terminus of this 886-residue enzyme compared to the smaller, ~600-residue L1 GUS proteins. BuGUS contains two carbohydrate binding modules (CBMs) (Boraston et al., 2004) that are missing from L1 GUS enzymes. The BfGUS mL1 enzyme, by contrast, contains one C-terminal CBM (Figure 5C).Interestingly, both the BfGUS CBM and the first, more N-terminal CBM of BuGUS are not detected as CBMs in CAZy database searches (Lombard et al., 2014), suggesting that these represent previously uncharacterized carbohydrate binding modules. Thus, the increased GUS protein lengths presented in Figure 3D can in these cases be explained by additional carbohydrate binding modules to facilitate the binding of larger substrates, possibly carbohydrates.
Finally, we hypothesized that microbial GUS enzymes with open active sites would process polysaccharides with a glucuronic acid at the non-reducing end. We tested this hypothesis by examining our panel of eight GUS enzymes with a representative natural heparan nonasaccharide: GlcUA-(GlcNAc-GlcUA)4-PNP (GlcUA, glucuronic acid, GlcNAc, N-acetylglucosamine; PNP added for detection) (STAR Methods). We found that Loop 1 GUS enzymes were not able to process this substrate, yielding no product over 24 hours (Figure 5A). By contrast, the mL1, L2, mL2, and NL enzymes were able to utilize this heparan substrate, with the mL2 GUS from P. merdae converting 100% of it to product (Figure 5A). Analysis of products by mass spectrometry revealed that only the terminal glucuronic acid was removed by each GUS (Figure 5A; Figure S5, Related to Figure 5). The mL1,2 GUS from B. ovatus showed no activity with this heparan substrate (Figure 5A), indicating that we have yet to identify the substrate of this unique and relatively rare type of GUS. Taken together, these data on representative GUS enzymes provide a critical first view of the structural and functional diversity present in this microbiome family of proteins.
DISCUSSION
An atlas of human GI microbiome-encoded enzymes comprehensive for the Human Microbiome Project Stool Sample Catalog is presented. The results demonstrate conservation of structural features in bacterial β-glucuronidase (GUS) proteins and their diversity in function, structure and cellular localization. The GUSome enzymes sample four major microbial phyla – Bacteroidetes, Firmicutes, Verrucomicrobia, and Proteobacteria – and can be clustered into six distinct categories. GUS enzymes from these categories are also shown to exhibit differing functional capacities; enzymes with longer loops process a small glucuronide substrate, while others with open active sites process a larger heparan substrate. GUS proteins active on small substrates appear to be intracellular, while enzyme orthologs that act on large polysaccharides maintain signal sequences and are expected to be localized in the periplasmic space (Koropatkin et al., 2012).
Connecting phyla with GUS functional patterns, we hypothesize that NL enzymes are housekeeping proteins maintained by a large number of Firmicutes and Bacteroidetes taxa for the processing of commonly available substrates, including host- or microbial-produced polysaccharides like heparan, heparin, chondroitin, and mucins. Such housekeeping NL enzymes can be either intracellular or extracellular. While we show they can act on one type of polysaccharide, there is an array of important polysaccharides present in the GI lumen (Koropatkin et al., 2012). We hypothesize that distinct NL proteins, and also mL1, L2, mL2, and mL1,2 GUS enzymes, will show preferences for different types of polysaccharide substrates. Future studies will be required to assign substrate preferences to each category of GUS proteins, and perhaps even to individual GUS enzymes within each category, to understand fully the roles these proteins play in mammalian-microbial mutualism.
Intracellular GUS enzymes appear poised to respond to the presence of smaller glucuronide conjugates formed either locally by the GI epithelium, which express UGTs, or by the liver, which passes glucuronide conjugates to the GI via the bile duct (Mackenzie et al., 1997; Meech et al., 2012). Such substrates are expected to exhibit diverse aglycone chemistry, sampling the sterol scaffold compounds and bilirubin for endobiotics and, for xenobiotics, a broad range of drugs and toxins (Meech et al., 2012). Such intracellular systems would be expected to require importers to bring small glucuronide conjugates into microbial cells for processing. Indeed, the Enterobacteriaceae are known to encode a GUS operon that expresses both the GUS enzyme (gusA), as well as inner- and outer-membrane glucuronide mobilization proteins (gusB, gusC, respectively) (Liang et al., 2005; Wilson et al., 1992). The GI microbiota harbor an array of distinct metabolic functions that can be increased both by gene expression and by clonal expansion when particular substrates are present, and then decreased by relative growth disadvantages when key compounds are scarce.
The current report details 112 new GUS proteins that lack identifiable phylum or genus, demonstrating that precise structure-guided searching of metagenome data has the capability of expanding our knowledge of microbial functions by 40%, in this case, and perhaps more for other catalytic functionalities. Moreover, this strategy can be extended to enzymes other than GUS given defined structural motifs to identify them, enabling the mining of whole-genome metagenome sequences from the GI as well as other body sites. However, a limitation to the study presented here is the requirement that the GUS enzymes selected maintain all seven of the conserved active site residues shown in Figure 1B. It is likely, given the rapid evolutionary capability of bacteria, that the GI microbiota have sampled active sites with one or more of these residues altered to orthologous or distinct amino acid side chains, and yet still maintain GUS activity. Future studies will be required to examine this possibility. A second limitation to the current study is that, in spite of the GUS rubric employed, there may be enzymes we have labeled here as a GUS that in fact lack GUS activity. For this reason, we have chosen to describe this is “an atlas” of GUS enzymes, rather than the definitive atlas, and we look forward to further studies designed to probe this first atlas for functional diversity and potential surprises.
The 3,013 GUS proteins identified from the fecal sampling of 139 individuals provide the first full-scope view of GI microbial enzyme diversity and compositional heterogeneity in humans. All individuals contained GUS-encoding genes, but that numbers varied by 10-fold across individuals, from a minimum of 4 to a maximum of 38 GUS proteins. The functional diversity was also observed to be relatively vast, with some individuals encoding a large number of relatively rare GUS enzymes, such as L1 or mL1,2, compared to most samples that exhibited dominance of NL enzymes. More detailed knowledge about whether unique GUS compositions are stochastic or representative of other factors like diet or disease will remain for future studies. Indeed, the data from these 139 individuals, while well-annotated, are only a small first look at the diversity of a family of gut microbiome-encoded enzymes, and we look forward to future studies of larger metagenomic assemblies collected from more individuals and integrated with matched metadata.
The information outlined here could form a basis for personalized medicine and predictive efforts to identify patients at risk for chemotherapy-induced diarrhea, for example. Such knowledge may facilitate regimen-tailoring to enhance antitumor efficacy while avoiding dose-limiting GI toxicities, or could suggest dietary changes that could improve microbiota composition before treatment. Taken together, the data and methodologies presented provide a roadmap for the annotation of diverse microbiome-encoded catalytic and non-catalytic functions, and open the door to new eras of discovery in understanding mammalian-microbial mutualism.
STAR METHODS
CONTACT FOR REAGENT AND RESOURCE SHARING
Further information and requests for resources and reagents should be directed to and will be fulfilled by the Lead Contact, Matthew R Redinbo (redinbo@unc.edu).
EXPERIMENTAL MODEL AND SUBJECT DETAILS
Cell Lines
E. coli BL21 DE3 Gold cells were cultured in lysogeny broth (LB) with vigorous shaking at 37°C.
METHOD DETAILS
Human Microbiome Project (HMP) data
Protein sequences for stool samples from the HMP Clustered genes- HMGC (http://hmpdacc.org/HMGC) and Gene Indices – HMGI (http://hmpdacc.org/HMGI/) were downloaded as FASTA files and used as a database for subsequent NCBI BLASTp searches (Altschul et al., 1990). Microbial assemblies, annotations and reads for stool samples were obtained from http://hmpdacc.org/HMASM/ and used for abundance calculations as described below.
HMP β-glucuronidase Identification
In order to identify β-glucuronidase (GUS) enzymes in the HMP stool proteins, we used Escherichia coli β-glucuronidase (NCBI Accession: NP_416134.1), Clostridium perfringens β-glucuronidase (NCBI Accession: WP_003467686.1), Streptococcus agalactiae β-glucuronidase (NCBI Accession: WP_000966715.1) and Bacteroides fragilis β-glucuronidase (NCBI Accession: 3CMG) in a pair-wise alignment approach. Each HMP stool protein was aligned to the above proteins using NCBI BLASTp (Altschul et al., 1990). We considered alignments with an E-value < 0.05 and percent identity ≥25 to be valid hits. Only those valid hits were then checked for the presence of NxKG motif, catalytic E residues and N and Y motifs corresponding to GUS positions shown below.
| Bacterium | NxKG motif positions | Catalytic E residues positions | N and Y motifs positions |
|---|---|---|---|
| Escherichia coli | 566, 568, 569 | 413, 504 | 412, 468 |
| Clostridium perfringens | 567, 569, 570 | 412, 505 | 411, 468, |
| Streptococcus agalactiae | 563, 565, 566 | 408, 501 | 407, 464 |
| Bacteroides fragilis | 547, 549, 550 | 395, 476 | 394, 445 |
We classified HMP proteins that satisfied the above conditions as β-glucuronidase.
HMP β-Glucuronidase Loop Classification
HMP GUS proteins identified above were subjected to a multiple sequence alignment (MSA) using Clustal Omega (Sievers et al., 2011) along with selected model GUS sequences: E. coli (NCBI Accession: NP_416134.1), Streptococcus agalactiae (NCBI Accession: WP_000966715.1), Clostridium perfringens (NCBI Accession: WP_003467686.1), Homo sapiens (NCBI Accession: NP_000172.2), H11G11-BG from uncultured bacterium (NCBI Accession: CBJ55484.1) and Bacteroides fragilis (NCBI Accession: 3CMG). The MSA was examined for the presence of two loop regions. The first (Loop 1) corresponds to E. coli GUS positions 356 to 380 and the second (Loop 2) corresponds to E. coli GUS positions 416 to 419. HMP GUS proteins were then categorized into six categories based on the number of residues present in those two regions after excluding gap characters as shown below.
| Category | Residues in Loop 1 region | Residues in Loop 2 region |
|---|---|---|
| No Loop | < 10 | < 9 |
| Loop 1 | > 15 | < 9 |
| Mini-Loop 1 | ≤ 15 and ≥ 10 | < 9 |
| Loop 2 | < 10 | ≥ 12 |
| Mini-Loop 2 | < 10 | ≥ 9 and < 12 |
| Mini-Loop 1,2 | ≤ 15 and ≥ 10 | ≥ 9 and < 12 |
Protein Structure Models
Protein structure models for the P. merdae, B. ovatus, and B. dorei GUS enzymes were generated using the Protein Homology/analogY Recognition Engine V 2.0 (Phyre2) (Kelley et al., 2015). The model for B. uniformis GUS was generated using SWISS-MODEL (Biasini et al., 2014). Models were analyzed and figures were generated in Pymol.
Taxonomic Assignments of GUSome Sequences
The non-redundant protein sequences database was searched for sequences matching protein sequences from the HMGC279 or HMGI3013 datasets using NCBI BLASTp (Altschul et al., 1990). For matches with ≥95% identity, phylum, genus and species taxonomy were assigned to that sequence in the HMGC279 or HMGI3013 dataset and any large sequencing errors such as duplication of a sequence segment, miscalled start or end sites were corrected. For matches with 25–94% sequence identity, the top results were analyzed for phylum of the expressing bacteria. If all results were from the same phylum, the HMGC279 or HMGI3013 sequence was assigned to that phylum. However, if sequences with ≥25% identity were found in multiple phyla, a phylum was not assigned and is instead noted as unclear. Potential sequencing errors were not corrected for these lower identity matches but were noted and a mature sequence length is not reported for these unverified sequences. Correction of sequencing errors in the HMGC279 dataset led to reduction of total sequences from 293 to 279 due to sequences that shared ≥95% sequence identity after correction. Similarly, sequences from the HMGI3013 dataset were considered to be equivalent sequences if they shared ≥95% sequence identity for the summaries presented in Figure 5. The radial cladogram in Figure 3A was generated in Dendroscope version 3.5.7 (Huson and Scornavacca, 2012). Data provided for HMGC279 and HMGI3013 sequences are based on the NCBI Protein Database as of August 2016 and October 2016, respectively.
Signal Peptide Identification
Following any correction of sequencing errors such as miscalled start sites found during analysis with BLASTp for taxonomic assignments, HMGC279 sequences were analyzed for signal peptide cleavage sites using the online SignalP 4.1 server for Gram-negative bacteria (Petersen et al., 2011) and the online LipoP 1.0 server (Juncker et al., 2003). Sequences trimmed of the predicted signal sequence were manually interrogated for an N-terminal cysteine for possible lipidation for presentation on the outer membrane.
CAZy Enzyme and Module Family Identification
HMGC279 sequences were compared to the Carbohydrate-Active enZyme (CAZy) database in order to assign enzyme class and module family matches using the “annotate your proteins” function in the DataBase for automated Carbohydrate-active enzyme ANnotation (dbCAN) web server (dbCAN HMMs 5.0 based on CAZyDB 07/15/2016).
Gene Abundance Calculations
The trimmed and duplicate-marked reads for each stool sample were aligned to their own assembled gene sequences using bowtie2 (v.2.2.5) (Langmead and Salzberg, 2012). Alignments were stored in bam files and gene specific counts were obtained by running the program featurecount from the subread package (v.1.4.6-p2-Linux-x86_64) on each bam file (Liao et al., 2014). To account for differences in read numbers between samples, we normalized and log transformed the counts as shown below:
where RC is the read count for a gene in a particular sample, n is the total number of reads in that sample, the sum of x is the total number of reads in all samples and N is the total number of samples.
Enzyme Cloning
Eubacterium eligens GUS
The codon-optimized E. eligens β-glucuronidase (EeGUS) gene was purchased from Bio Basic in the pUC57 vector. The gene was amplified and inserted into the pLIC-His vector using the primers in Table S4, Primer Sequences, Related to Figure 5.
Faecalibacterium prausnitzii GUS
The F. prausnitizii β-glucuronidase (FpGUS) gene was purchased from Bio Basic in the pUC57 vector. The gene was amplified and inserted into the pLIC- His vector using the primers in Table S4, Primer Sequences, Related to Figure 5.
Bacteroides fragilis
The mature gene lacking the signal peptide of B. fragilis β-glucuronidase (BfGUS) was purchased from DNA SU Plasmid Repository in the pSGX3 plasmid. The gene was amplified and inserted into the pLIC-His vector using the primers in Table S4, Primer Sequences, Related to Figure 5.
Bacteroides uniformis GUS
The full-length B. uniformis β-glucuronidase (BuGUS) gene was purchased from Bio Basic in the pUC57 vector. The mature gene lacking the signal peptide was amplified and inserted into the pLIC-His vector using the primers in Table S4, Primer Sequences, Related to Figure 5.
Parabacteroides merdae GUS
The full-length P. merdae β-glucuronidase (PmGUS) gene was purchased from Bio Basic in the pUC57 vector. The mature gene lacking the signal peptide was amplified and inserted into the pLIC-His vector using the primers in Table S4, Primer Sequences, Related to Figure 5.
Bacteroides ovatus GUS
The full-length B. ovatus β-glucuronidase (BoGUS) gene was purchased from Bio Basic in the pUC57 vector. The mature gene lacking the signal peptide was amplified and inserted into the pLIC-His vector using the primers in Table S4, Primer Sequences, Related to Figure 5.
Bacteroides dorei GUS
The full-length B. dorei β-glucuronidase (BdGUS) gene was purchased from Bio Basic in the pUC57 vector. The mature gene lacking the signal peptide was amplified and inserted into the pLIC-His vector using the primers in Table S4, Primer Sequences, Related to Figure 5.
Expression and Purification of Enzymes
Each β-glucuronidase expression plasmid was transformed into BL21 DE3 Gold cells for enzyme expression. Cells were grown in the presence of kanamycin (EcGUS) or ampicillin (all other GUS constructs) in LB medium with vigorous shaking at 37 °C to an OD600nm of 0.5, at which point the temperature was reduced to 18 °C. At OD600=0.8, protein expression was induced by the addition of 0.1 mM isopropyl-1-thio-D-galactopyranoside (IPTG) and incubation continued overnight. For PmGUS and BoGUS, protein expression was carried out in auto-inducing media with shaking at 37°C until an OD600nm of ~1.0 was reached, at which point the temperature was reduced to 18°C. Cells were collected by centrifugation at 450 0xg for 20 min at 4 °C in a Sorvall (model RC-3B) swinging bucket centrifuge. Cell pellets were resuspended in Buffer A (20 mM Potassium Phosphate pH 7.4, 50 mM imidazole, 500 mM NaCl), DNase, lysozyme, and a Roche complete-EDTA free protease inhibitor tablet. Resuspended cells were sonicated and clarified via centrifugation at 17,000xg for 60 min in a Sorvall (model RC-5B). The lysate was flowed over a Ni-NTA HP column (GE Healthcare) loaded onto the Aktaxpress FPLC system (Amersham Bioscience) and washed with Buffer A. Protein was eluted with Buffer B 20 mM Potassium Phosphate pH 7.4, 250 mM Imidazole, 500mM NaCl). Fractions containing the protein of interest were combined and passed over a HiLoadTM 16/60 SuperdexTM 200 gel filtration column. Protein was eluted in S200 Buffer (20 mM HEPES pH 7.4, 50 mM NaCl), except PmGUS which was eluted in S200 Buffer (20mM HEPES, pH 7.4, 300mM NaCl). Fractions were analyzed by SDS- PAGE and those with >95% purity were combined and concentrated for long-term storage at −80 °C.
PNPG Assay
Para-nitrophenyl glucuronide (PNPG) was purchased as a solid and suspended in water to a concentration of 100 mM. Reactions were conducted in triplicate in 96-well, black, clear-bottom assay plates (Costar, Tewksbury MA) at 37 °C. The reactions consisted of 10 μL assay buffer (50 mM HEPES, 50 mM NaCl, various pH), 10 μL enzyme, and 30 μL of substrate diluted in assay buffer. For each time point, a reaction was quenched with 100μL of 0.2 M sodium carbonate. When all reactions were quenched, product formation was measured via absorbance at 410 nm using a PHERAstar Plus microplate reader (BMG Labtech, Ortenberg, Germany). For analysis of the optimal pH for each enzyme, the above assay was run at one enzyme concentration (10 nM) and one PNPG concentration (800 μM) with buffer at pH 4, 4.5, 5, 5.5, 6, 6.5, 7, and 7.4. For kinetic assays, each protein was examined at its optimal pH using assay buffer and 800 μM PNPG diluted in the appropriate assay buffer. For assays at pH 6.5 to 7.4, initial 50 μL reactions described above were not quenched and product formation was measured over time via absorbance at 410 nm. For assays at pH 6 or lower, reactions were quenched and product formation in the final 150 μL reaction was measured.
Heparan Nonasaccharide Assay
The heparan nonasaccharide substrate [GlcUA-(GlcNAc-GlcUA)4-PNP (where GlcUA is glucuronic acid, GlcNAc is N-acetylglucosamine)] was synthesized in-house (Xu et al., 2014) and was digested with the each of the eight GUS enzymes in the in vitro panel for 24 hours. Digestion reactions were composed of 0.5 μM GUS enzyme and 273 μM nonasaccharide. Aliquots of the resultant solutions were analyzed by polyamine-based anion exchange (PAMN)-HPLC. Sugars were eluted from the PAMN column (0.46 cm × 25 cm from Waters) with a linear gradient of KH2PO4 from 0 to 1 M in 40 min at a flow rate of 0.5 ml/min. The eluent was monitored by a UV detector at 310 nm. Aliquots of heparan nonasaccharide digestion reactions were analyzed by electrospray ionization mass spectrometry (ESI-MS) by first purifying the reaction mixture by C18 column eluted with a linear gradient of methanol with 1% trifluoroacetic acid from 0 to 1 M in 60 min at a flow rate of 0.5 ml/min. The purified oligosaccharides were then dried. ESI-MS analysis was performed on a Thermo LCQ-Deca in negative ionization mode. A syringe pump (Harvard Apparatus) was used to introduce the sample by direct infusion (50 μl/min). The purified oligosaccharides were diluted in 200 μl of H2O with the electrospray source set to 3 KV and 150 °C. The automatic gain c ontrol was set to 1 × 10⁷ for full scan MS. The MS data were acquired and processed using Xcalibur 1.3.
Structure Determination of B. uniformis GUS
B. uniformis β-glucuronidase (BuGUS) was crystallized using hanging drop vapor diffusion at 20 °C using a well solution consisting of 20% PEG 3350 and 0.2 M Potassium Chloride. 0.001 mL of well solution was combined with 0.001 mL of BuGUS (12 mg/mL in 20mM Hepes, pH 7.4, 100mM NaCl, 5% Glycerol and 0.5mM TCEP) and crystals appeared in 3 days. Crystal specimen were cryo-protected in 20% PEG 3350, 0.2 M Potassium Chloride and 15% glycerol and diffraction data were collected from one crystal at 100 °K to 1.9 Å resolution at APS Be amline 23-ID-B. The data were processed with XDS and the structure was determined by molecular replacement in Phenix (Adams et al., 2002) using the B. fragilis GUS structure (3CMG) as a search model. The structure was iteratively built by hand using COOT (Emsley and Cowtan, 2004) along with appropriate cycles of refinement using Phenix to final R and Rfree values of 0.14 and 0.18, respectively (Table S3, BuGUS Crystallographic Analysis, Related to Figure 5). Coordinates and structure factors have been deposited at the RCSB with accession code 5UJ6.
QUANTIFICATION AND STATISTICAL ANALYSIS
PNPG Cleavage Rate and Heparan Cleavage in Figure 5A are reported as average and standard error of three reactions.
DATA AND SOFTWARE AVAILABILITY
The accession number for the coordinates and structure factors of the B. uniformis β-glucuronidase structure reported in this paper is PDB: 5UJ6. All other data are provided in supplemental files associated with this paper.
Supplementary Material
HIGHLIGHTS.
β-glucuronidase (GUS) enzymes from the Human Microbiome Project examined
3,013 total and 279 unique microbial GUS proteins cluster in six structural groups
GUSs are universally present and exhibit distinct inter-individual variabilities
112 novel GUSs are discovered, and functional differentiation is established
Acknowledgments
The authors thank Prof. Martin L. Blaser for stimulating discussions. Funded by NIH grants CA098468 and CA207416 (M.R.R.), T32 DK007737 (A.P.B), GM102137 and HL094463 (J.L.), by a grant from the Eshelman Institute for Innovation (J.L.), and by NSF Predoctoral Fellowships (R.M.P., M.S.L.). M.R.R. is a Founder and Board Member of Symberix, Inc.
Footnotes
AUTHOR CONTRIBUTIONS
Conceptualization, M.R.R., J.L. and R.Z.G.; Methodology, R.Z.G., R.M.P. and E.H.D.; Investigation, R.M.P., E.H.D., W.G.W., Y.X., M.S.L., K.A.B., S.J.P., L.M.P., B.C.C., H.N.I., R.R.B., A.P.B. and R.Z.G.; Writing – Original Draft, M.R.R., R.M.P. and E.H.D.; Writing – Review & Editing, M.R.R., R.M.P., E.H.D., R.Z.G., J.L., Y.X., W.G.W., M.S.L., K.A.B. and S.J.P.; Funding Acquisition, M.R.R. and J.L.; Supervision, M.R.R., R.Z.G, and R.M.P.
Publisher's Disclaimer: This is a PDF file of an unedited manuscript that has been accepted for publication. As a service to our customers we are providing this early version of the manuscript. The manuscript will undergo copyediting, typesetting, and review of the resulting proof before it is published in its final citable form. Please note that during the production process errors may be discovered which could affect the content, and all legal disclaimers that apply to the journal pertain.
References
- Abuhelwa AY, Foster DJR, Upton RN. A Quantitative Review and Meta-Models of the Variability and Factors Affecting Oral Drug Absorption—Part I: Gastrointestinal pH. AAPS J. 2016;18:1309–1321. doi: 10.1208/s12248-016-9952-8. [DOI] [PubMed] [Google Scholar]
- Adams PD, Grosse-Kunstleve RW, Hung LW. PHENIX: building new software for automated crystallographic structure determination. Acta Crystallogr Sect D Biol Crystallogr. 2002;58:1948–1954. doi: 10.1107/s0907444902016657. [DOI] [PubMed] [Google Scholar]
- Altschul SF, Gish W, Miller W, Myers EW. Basic local alignment search tool. J Mol Biol. 1990;215:403–410. doi: 10.1016/S0022-2836(05)80360-2. [DOI] [PubMed] [Google Scholar]
- Auclair SM, Bhanu MK, Kendall DA. Signal peptidase I: Cleaving the way to mature proteins. Protein Sci. 2012;21:13–25. doi: 10.1002/pro.757. [DOI] [PMC free article] [PubMed] [Google Scholar]
- Biasini M, Bienert S, Waterhouse A, Arnold K, Studer G, Schmidt T, Kiefer F, Cassarino TG, Bertoni M, Bordoli L, et al. SWISS-MODEL: Modelling protein tertiary and quaternary structure using evolutionary information. Nucleic Acids Res. 2014;42:W252–258. doi: 10.1093/nar/gku340. [DOI] [PMC free article] [PubMed] [Google Scholar]
- Boelsterli UA, Redinbo MR, Saitta K. Multiple NSAID-induced hits injure the small intestine: Underlying mechanisms and novel strategies. Toxicol Sci. 2012;131:654–667. doi: 10.1093/toxsci/kfs310. [DOI] [PMC free article] [PubMed] [Google Scholar]
- Boraston AB, Bolam DN, Gilbert HJ, Davies GJ. Carbohydrate-binding modules: fine-tuning polysaccharide recognition. Biochem J. 2004;382:769–781. doi: 10.1042/BJ20040892. [DOI] [PMC free article] [PubMed] [Google Scholar]
- Callanan MJ, Russell WM, Klaenhammer TR. Modification of Lactobacillus beta-glucuronidase activity by random mutagenesis. Gene. 2007;389:122–127. doi: 10.1016/j.gene.2006.10.022. [DOI] [PubMed] [Google Scholar]
- David LA, Maurice CF, Carmody RN, Gootenberg DB, Button JE, Wolfe BE, Ling AV, Devlin AS, Varma Y, Fischbach MA, et al. Diet rapidly and reproducibly alters the human gut microbiome. Nature. 2013;505:559–563. doi: 10.1038/nature12820. [DOI] [PMC free article] [PubMed] [Google Scholar]
- Emsley P, Cowtan K. Coot: model-building tools for molecular graphics. Acta Crystallogr Sect D Biol Crystallogr. 2004;60:2126–2132. doi: 10.1107/S0907444904019158. [DOI] [PubMed] [Google Scholar]
- Finn RD, Coggill P, Eberhardt RY, Eddy SR, Mistry J, Mitchell AL, Potter SC, Punta M, Qureshi M, Sangrador-Vegas A, et al. The Pfam protein families database: Towards a more sustainable future. Nucleic Acids Res. 2016;44:D279–D285. doi: 10.1093/nar/gkv1344. [DOI] [PMC free article] [PubMed] [Google Scholar]
- Gloux K, Berteau O, El Oumami H, Béguet F, Leclerc M, Doré J. A metagenomic β-glucuronidase uncovers a core adaptive function of the human intestinal microbiome. Proc Natl Acad Sci U S A. 2011;108(Suppl):4539–4546. doi: 10.1073/pnas.1000066107. [DOI] [PMC free article] [PubMed] [Google Scholar]
- Hassan MI, Waheed A, Grubb JH, Klei HE, Korolev S, Sly WS. High Resolution Crystal Structure of Human beta-Glucuronidase Reveals Structural Basis of Lysosome Targeting. PLoS One. 2013;8:e79687. doi: 10.1371/journal.pone.0079687. [DOI] [PMC free article] [PubMed] [Google Scholar]
- Huson DH, Scornavacca C. Dendroscope 3: An interactive tool for rooted phylogenetic trees and networks. Syst Biol. 2012;61:1061–1067. doi: 10.1093/sysbio/sys062. [DOI] [PubMed] [Google Scholar]
- Juncker AS, Willenbrock H, Von Heijne G, Brunak S, Nielsen H, Krogh A. Prediction of lipoprotein signal peptides in Gram-negative bacteria. Protein Sci. 2003;12:1652–1662. doi: 10.1110/ps.0303703. [DOI] [PMC free article] [PubMed] [Google Scholar]
- Kau AL, Ahern PP, Griffin NW, Goodman AL, Gordon JI. Human nutrition, the gut microbiome and the immune system. Nature. 2011;474:327–336. doi: 10.1038/nature10213. [DOI] [PMC free article] [PubMed] [Google Scholar]
- Kelley LA, Mezulis S, Yates CM, Wass MN, Sternberg MJE. The Phyre2 web portal for protein modeling, prediction and analysis. Nat Protoc. 2015;10:845–858. doi: 10.1038/nprot.2015.053. [DOI] [PMC free article] [PubMed] [Google Scholar]
- Kim DH, Hong SW, Kim BT, Bae EA, Park HY, Han MJ. Biotransformation of glycyrrhizin by human intestinal bacteria and its relation to biological activities. Arch Pharm Res. 2000;23:172–177. doi: 10.1007/BF02975509. [DOI] [PubMed] [Google Scholar]
- Koropatkin NM, Cameron EA, Martens EC. How glycan metabolism shapes the human gut microbiota. Nat Rev Microbiol. 2012;10:323–335. doi: 10.1038/nrmicro2746. [DOI] [PMC free article] [PubMed] [Google Scholar]
- Langmead B, Salzberg SL. Fast gapped-read alignment with Bowtie 2. Nat Methods. 2012;9:357–359. doi: 10.1038/nmeth.1923. [DOI] [PMC free article] [PubMed] [Google Scholar]
- Liang WJ, Wilson KJ, Xie H, Knol J, Suzuki S, Rutherford NG, Henderson PJF, Jefferson RA. The gusBC genes of Escherichia coli encode a glucuronide transport system. J Bacteriol. 2005;187:2377–2385. doi: 10.1128/JB.187.7.2377-2385.2005. [DOI] [PMC free article] [PubMed] [Google Scholar]
- Liao Y, Smyth GK, Shi W. FeatureCounts: An efficient general purpose program for assigning sequence reads to genomic features. Bioinformatics. 2014;30:923–930. doi: 10.1093/bioinformatics/btt656. [DOI] [PubMed] [Google Scholar]
- LoGuidice A, Wallace BD, Bendel L, Redinbo MR, Boelsterli UA. Pharmacologic targeting of bacterial β-glucuronidase alleviates nonsteroidal anti-inflammatory drug-induced enteropathy in mice. J Pharmacol Exp Ther. 2012;341:447–454. doi: 10.1124/jpet.111.191122. [DOI] [PMC free article] [PubMed] [Google Scholar]
- Lombard V, Ramulu HG, Drula E, Coutinho PM, Henrissat B. The carbohydrate-active enzymes database (CAZy) in 2013. Nucleic Acids Res. 2014;42:D490–D495. doi: 10.1093/nar/gkt1178. [DOI] [PMC free article] [PubMed] [Google Scholar]
- Mackenzie PI, Owens IS, Burchell B, Bock KW, Bairoch A, Bélanger A, Fournel-Gigleux S, Green M, Hum DW, Iyanagi T, et al. The UDP glycosyltransferase gene superfamily: recommended nomenclature update based on evolutionary divergence. Pharmacogenetics. 1997;7:255–269. doi: 10.1097/00008571-199708000-00001. [DOI] [PubMed] [Google Scholar]
- Mani S, Boelsterli UA, Redinbo MR. Interrogating and Modulating Mammalian-Microbial Communication for Improved Health. Annu Rev Pharmacol Toxicol. 2014;55:559–580. doi: 10.1146/annurev-pharmtox-011613-140007. [DOI] [PMC free article] [PubMed] [Google Scholar]
- Masamune H. Biochemical Studies on Carbohydrates. IV On an Enzyme which Catalyses the Hydrolysis of Biosynthetic Osides of Glucuronic Acid. J Biochem. 1934;19:353–375. [Google Scholar]
- Matsumura I, Ellington AD. In vitro evolution of beta-glucuronidase into a beta-galactosidase proceeds through non-specific intermediates. J Mol Biol. 2001;305:331–339. doi: 10.1006/jmbi.2000.4259. [DOI] [PubMed] [Google Scholar]
- Maurice CF, Haiser HJ, Turnbaugh PJ. Xenobiotics Shape the Physiology and Gene Expression of the Active Human Gut Microbiome. Cell. 2013;152:39–50. doi: 10.1016/j.cell.2012.10.052. [DOI] [PMC free article] [PubMed] [Google Scholar]
- McBain AJ, Macfarlane GT. Ecological and physiological studies on large intestinal bacteria in relation to production of hydrolytic and reductive enzymes involved in formation of genotoxic metabolites. J Med Microbiol. 1998;47:407–416. doi: 10.1099/00222615-47-5-407. [DOI] [PubMed] [Google Scholar]
- Meech R, Miners JO, Lewis BC, MacKenzie PI. The glycosidation of xenobiotics and endogenous compounds: Versatility and redundancy in the UDP glycosyltransferase superfamily. Pharmacol Ther. 2012;134:200–218. doi: 10.1016/j.pharmthera.2012.01.009. [DOI] [PubMed] [Google Scholar]
- Methé BA, Nelson KE, Pop M, Creasy HH, Giglio MG, Huttenhower C, Gevers D, Petrosino JF, Abubucker S, Badger JH, et al. A framework for human microbiome research. Nature. 2012;486:215–221. doi: 10.1038/nature11209. [DOI] [PMC free article] [PubMed] [Google Scholar]
- Mitreva M Consortium THMP. Structure, function and diversity of the healthy human microbiome. Nature. 2012;486:207–214. doi: 10.1038/nature11234. [DOI] [PMC free article] [PubMed] [Google Scholar]
- Nakamura J, Kubota Y, Miyaoka M, Saitoh T, Mizuno F, Benno Y. Comparison of four microbial enzymes in Clostridia and Bacteroides isolated from human feces. Microbiol Immunol. 2002;46:487–490. doi: 10.1111/j.1348-0421.2002.tb02723.x. [DOI] [PubMed] [Google Scholar]
- Navarre WW, Schneewind O. Surface proteins of gram-positive bacteria and mechanisms of their targeting to the cell wall envelope. Microbiol Mol Biol Rev. 1999;63:174–229. doi: 10.1128/mmbr.63.1.174-229.1999. [DOI] [PMC free article] [PubMed] [Google Scholar]
- Oshima G. Biochemical Studies on Carbohydrates. XII On Beta-Glucuronidase, 2nd Communication. J Biochem. 1934;20:361–370. [Google Scholar]
- Petersen TN, Brunak S, von Heijne G, Nielsen H. SignalP 4.0: discriminating signal peptides from transmembrane regions. Nat Methods. 2011;8:785–786. doi: 10.1038/nmeth.1701. [DOI] [PubMed] [Google Scholar]
- Redinbo MR. The Microbiota, Chemical Symbiosis, and Human Disease. J Mol Biol. 2014;426:3877–3891. doi: 10.1016/j.jmb.2014.09.011. [DOI] [PMC free article] [PubMed] [Google Scholar]
- Roberts AB, Wallace BD, Venkatesh MK, Mani S, Redinbo MR. Molecular Insights into Microbial β-Glucuronidase Inhibition to Abrogate CPT-11 Toxicity. Mol Pharmacol. 2013;84:208–217. doi: 10.1124/mol.113.085852. [DOI] [PMC free article] [PubMed] [Google Scholar]
- Russell WM, Klaenhammer TR. Identification and cloning of gusA, encoding a new beta-glucuronidase from Lactobacillus gasseri ADH. Appl Environ Microbiol. 2001;67:1253–1261. doi: 10.1128/AEM.67.3.1253-1261.2001. [DOI] [PMC free article] [PubMed] [Google Scholar]
- Saitta KS, Zhang C, Lee KK, Fujimoto K, Redinbo MR, Boelsterli UA. Bacterial Beta-Glucuronidase Inhibition Protects Mice Against Enteropathy Induced by Indomethacin, Ketoprofen, or Diclofenac: Mode of Action and Pharmacokinetics. Xenobiotica. 2014;44:28–35. doi: 10.3109/00498254.2013.811314. [DOI] [PMC free article] [PubMed] [Google Scholar]
- Salyers AA, O’Brien M. Cellular location of enzymes involved in chondroitin sulfate breakdown by Bacteroides thetaiotaomicron. J Bacteriol. 1980;143:772–780. doi: 10.1128/jb.143.2.772-780.1980. [DOI] [PMC free article] [PubMed] [Google Scholar]
- Sievers F, Wilm A, Dineen D, Gibson TJ, Karplus K, Li W, Lopez R, McWilliam H, Remmert M, Söding J, et al. Fast, scalable generation of high-quality protein multiple sequence alignments using Clustal Omega. Mol Syst Biol. 2011;7:539. doi: 10.1038/msb.2011.75. [DOI] [PMC free article] [PubMed] [Google Scholar]
- Takasuna K, Hagiwara T, Hirohashi M, Kato M, Nomura M, Nagai E, Yokoi T, Kamataki T. Involvement of beta-glucuronidase in intestinal microflora in the intestinal toxicity of the antitumor camptothecin derivative irinotecan hydrochloride (CPT-11) in rats. Cancer Res. 1996;56:3752–3757. [PubMed] [Google Scholar]
- Turnbaugh PJ, Hamady M, Yatsunenko T, Cantarel BL, Duncan A, Ley RE, Sogin ML, Jones WJ, Roe BA, Affourtit JP, et al. A core gut microbiome in obese and lean twins. Nature. 2008;457:480–484. doi: 10.1038/nature07540. [DOI] [PMC free article] [PubMed] [Google Scholar]
- Wallace BD, Wang H, Lane KT, Scott JE, Orans J, Koo JS, Venkatesh M, Jobin C, Yeh LA, Mani S, et al. Alleviating cancer drug toxicity by inhibiting a bacterial enzyme. Science. 2010;330:831–835. doi: 10.1126/science.1191175. [DOI] [PMC free article] [PubMed] [Google Scholar]
- Wallace BD, Roberts AB, Pollet RM, Ingle JD, Biernat KA, Pellock SJ, Venkatesh MK, Guthrie L, O’Neal SK, Robinson SJ, et al. Structure and Inhibition of Microbiome β-Glucuronidases Essential to the Alleviation of Cancer Drug Toxicity. Chem Biol. 2015;22:1238–1249. doi: 10.1016/j.chembiol.2015.08.005. [DOI] [PMC free article] [PubMed] [Google Scholar]
- Wilson KJ, Hughes SG, Jefferson RA. The Escherichia coli gus operon: induction and expression of the gus operon in E. coli and the occurrence and use of GUS in other bacteria. In: Gallagher SR, editor. GUS Protocols. Using the GUS Gene as Reporter of Gene Expression. San Diego: Academic Press, Inc; 1992. pp. 7–22. [Google Scholar]
- Xu Y, Cai C, Chandarajoti K, Hsieh PH, Li L, Pham TQ, Sparkenbaugh EM, Sheng J, Key NS, Pawlinski R, et al. Homogeneous low-molecular-weight heparins with reversible anticoagulant activity. Nat Chem Biol. 2014;10:248–250. doi: 10.1038/nchembio.1459. [DOI] [PMC free article] [PubMed] [Google Scholar]
- Zückert WR. Secretion of Bacterial Lipoproteins: Through the Cytoplasmic Membrane, the Periplasm and Beyond. Biochim Biophys Acta - Mol Cell Res. 2014;1843:1509–1516. doi: 10.1016/j.bbamcr.2014.04.022. [DOI] [PMC free article] [PubMed] [Google Scholar]
Associated Data
This section collects any data citations, data availability statements, or supplementary materials included in this article.