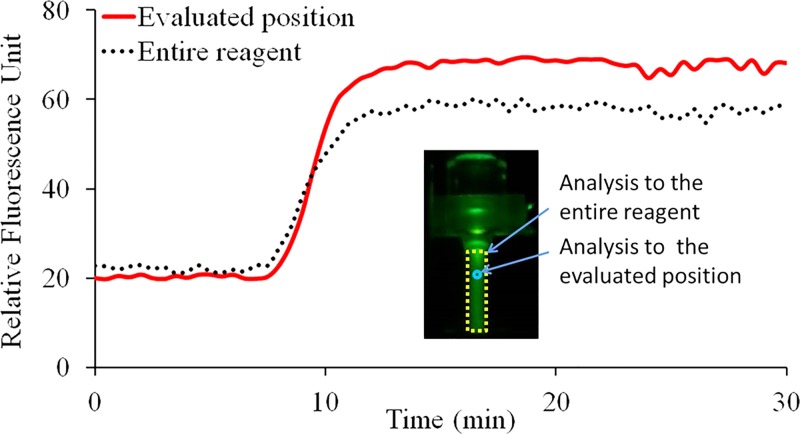
FIG. 5.
Real-time monitoring of CCPCR with H1N1 template (1.0 TCID50/ml) with a camera, the extracted fluorescent signal intensity from image is indicated as a function of the amplification time: the solid and dotted lines correspond, respectively, to the average relative fluorescence signal intensity from the specifically probed position and the entire reagent. The inset features a typical fluorescence signal image of the capillary tube with two marked analyzing zones, respectively, for the probed position and the entire reagent.

