Abstract
Glass capillary tubes have been widely used in microfluidics for generating microdroplets and microfibers. Here, we report on the application of glass capillary to inertial focusing of microparticles and cells for high-throughput flow cytometry. Our device uses a commercially available capillary tube with a square cross-section. Wrapping the tube into a helical shape induces the Dean vortices that aid focusing of cells or microbeads into a single position. We investigated the inertial focusing of microbeads in the device at various Re and concentrations and demonstrated 3D focusing with ∼100% efficiency for a wide range of microparticle diameters. We integrated the device with a laser counting system and demonstrated continuous counting of 10 μm microbeads with a high throughput of 13 000 beads/s as well as counting of fluorescently labeled white blood cells in the diluted whole blood. The helical capillary device offers a number of key advantages, including rapid and ultra-low-cost plug-and-play fabrication, optical transparency, and full compatibility with bright field or fluorescent imaging, easy re-configurability of the device radius for tuning focusing behavior, and ability to rotate for easy side-wall observation. With precise and consistent 3D focusing of microbeads and cells with a wide range of sizes at high throughput and without the use of sheath flows, we envision that this simple capillary-based inertial microfluidic device will create new opportunities for this technique to be widely adopted in the laboratory research.
INTRODUCTION
Flow cytometry is a powerful technique for automatic counting, multi-parameter analysis and sorting of a large number of single cells in biomedical research and clinical diagnostics.1 In a flow cytometer, fluorescently labeled cells are first focused into a narrow stream in fluid. Cells then pass a laser beam sequentially, where the fluorescent and scattered light from each cell is detected in situ to count and analyze various properties of cells. A critical component of any flow cytometer is the flow cell. It focuses cells into a highly ordered chain to ensure that they pass the laser beam one at a time at the same focal position. In a conventional flow cytometer, such three dimensional (3D) focusing is achieved by using a cell-free sheath flow to pinch cells in the sample flow into a single stream.1 This approach is conceptually straightforward but requires delicate balance of sheath and sample flow that complicates the fluidic setup and operation. In today's commercial flow cytometer systems, a flow cell is expensive to manufacture and can cost hundreds to thousands of dollars.
Inertial microfluidics has been an enabling technique that uses the fluid inertia around cells in the microscale channels to focus and sort them in a passive fashion with high throughput.2–7 A variety of inertial microfluidic devices have been developed to achieve precise 3D focusing without the use of sheath flow, which significantly simplifies the system setup and can potentially be the simplest approach for 3D focusing. Oakey et al.8 and our group9 designed curved or spiral microchannels to generate the Dean vortices in a cross-sectional area to focus cells into a single position along the channel side wall. Chung et al.10,11 developed straight microchannels with the arrays of microcavities or micropillars to engineer the cross-sectional secondary flow for particle focusing. Recently, our group introduced a simple straight microchannel design that combines inertial migration and flow bifurcation to gradually entrain cells into a single position.12 Although these inertial microfluidic devices achieved promising sheathless 3D focusing with a high throughput of up to 36 000 cells/s, a majority of them rely on channels with high-aspect-ratio (channel width w < channel height h) and small cross-section (w × h < 100 μm2). Such small dimensions generally limit fabrication to soft lithography,13 which can require cleanroom environment, involve time-consuming procedures, and need for trained personnel for the reliable fabrication of such microchannels. These limitations inhibit the adoption of this promising technique in general laboratories and in commercial flow cytometers.
Glass capillary tube is a simple yet versatile invention. From a pipette tip in daily laboratory use, to blood draw from a fingertip in clinical diagnostics, to Ag/AgCl reference electrode in electrochemical sensors, to high-performance liquid chromatography, glass capillaries serve as critical components in numerous instruments and techniques. In microfluidics, glass capillary tubes have been widely used for generating microdroplets14 and microfibers.15 Here, we expand the application of glass capillary by enabling 3D sheathless inertial focusing of microparticles in a helical capillary device for high-throughput flow cytometry counting of microbeads and cells. Our device uses a commercially available capillary tube with square cross section. Wrapping the tube into a helical shape induces the Dean vortices in cross-section to focus cells into an approximate single position. The helical section further leads to a straight section in which roughly focused cells are further refined into a single focal position at the center near one channel wall. We investigated the inertial focusing of microbeads in the device at various Re and concentrations and demonstrated 3D focusing of microbeads with a wide range of sizes with ∼100% efficiency. We further integrated the device with a laser counting system and demonstrated the continuous counting of 10 μm microbeads with a high throughput of 13 000 beads/s. Furthermore, we demonstrated the counting of fluorescently labeled bovine white blood cells (WBCs) from diluted blood proving the compatibility of the device for potential flow cytometry analysis of cells.
RESULTS AND DISCUSSIONS
Capillary with square cross-section
While the majority of glass capillaries have circular cross-sections, the capillary used in this work has a square cross-section. Commercially available from Polymicro Technologies (Phoenix, AZ), capillaries can be purchased in three inner widths: 50 μm, 75 μm, and 100 μm (Figs. 1(a) and 1(b)). The square shape with proper characteristic dimensions allows the capillary to replace a square microchannel for inertial focusing. The capillary is made of fused silica coated with polyimide to enhance strength and flexibility, which allows shaping of the capillary into curved, spiral, helical or serpentine channels without breaking it. The re-configurability permits the modification of the inertial focusing behavior and makes the single position focusing possible. In addition, the polyimide coating can be selectively removed from the capillary using flame. Once removed, the remaining glass capillary is optically transparent, making it compatible with fluorescence microscopy for the study of inertial focusing and laser-based flow cytometry for high-throughput counting.
FIG. 1.
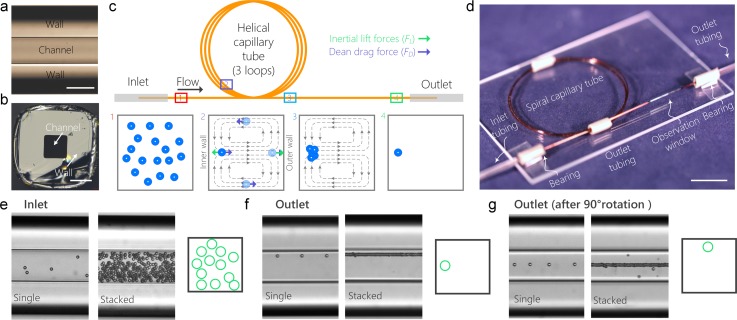
Device principle, fabrication and operation. (a) Bright-field top-view microscopic image of the capillary tube. The scale bar is 100 μm. (b) Bright-field microscopic image of the cross-section of the capillary tube. The scale bar is 100 μm. (c) Schematics of the principle of single-position focusing of cells in a 3-loop helical capillary tube. The inset schematics 1–4 illustrate particle distribution in the channel cross-section at the corresponding downstream positions. The grey dashed lines in inset schematics 2 and 3 represent the Dean vortices. The green and purple arrows represent the net lift force FL and Dean drag force FD, respectively. (d) A photograph of the device mounted on a glass substrate. (e) Single and stacked bright-field microscopic images and cross-sectional schematic showing that particles are distributed randomly at the inlet of the device. (f) Single and stacked bright-field microscopic images and cross-sectional schematic showing that particles are tightly focused into a single position after traveling through the device. (g) Rotation of the device for 90° enables the observation of particle focusing from side view, which further confirms the tight single-position focusing. In all the three panels, the images at the left and right hand sides are single and stacked images (n = 100), respectively.
Device principle
Before describing the principle of the device, we first briefly review inertial focusing in straight and curved microchannels. Inertial focusing of particles occurs when particle Reynolds number Rep > 1, which is given as
| (1) |
where Re is the channel Reynolds number, Uf is the fluid flow velocity, a is the diameter of the particles, ρ is the density of the fluid, μ is the viscosity of the fluid and Dh is the hydraulic diameter of the channel (Dh = 2hw/(h + w)). In a straight microchannel, as particles flow downstream at Rep > 1, they experience shear-induced lift force Fs induced by fluid shear as well as wall-induced lift force Fw generated by the interaction of particles and channel walls. Consequently, they migrate across flow streamlines towards the equilibrium positions where the two forces balance each other and the total net lift force FL becomes 0. The equilibrium positions depend on the cross-sectional shape of the channel. In a straight channel with square cross section such as the capillary used in this paper, particles are focused into the four equilibrium positions near the center of each wall.2,16
In a curved microchannel, fluid undergoes centrifugal acceleration directed radially outward leading to the formation of two counter-rotating vortices known as the Dean vortices. Since the fundamentals of Dean-flow-based inertial focusing6,9,17–19 have been well established, we only briefly discuss it here. The magnitude of the Dean vortices is quantified by the Dean number (De) as
| (2) |
where R is radius of curvature. Due to the presence of the Dean vortices, particles are subjected to an additional Dean drag force FD (Fig. 1(c), panel 2). The particles flowing near the top and bottom walls undergo strong Dean drag, thus migrating along the Dean vortices towards the inner and outer walls. Near the outer wall, the net lift force FL has the same direction as FD; thus, the particles follow the Dean vortices independent of their size. Near the inner wall, FL and FD act in opposite direction leading to possible force balance for particle focusing into a single position.
The capillary device consists of a helical section followed by a straight section and combines inertial focusing in these two sections to achieve precise single-position focusing (Fig. 1(c)). As uniformly distributed particles flow downstream in the helical section, they are first focused into an approximate single position near the inner channel wall where FL balances FD. Although the helical section might be sufficient to focus monodispersed particles into a single position, microbead or cell samples are often heterogeneous in size, which can only be roughly focused as a band near the inner sidewall (Fig. 1(c), panel 3). To achieve complete single-position focusing independent of size, we designed a straight section followed by the helical section. As the roughly focused particles enter the straight section, they are located near one sidewall. Downstream, they migrate to the center of that sidewall completing the single-position focusing (Fig. 1(c), panel 4).
Device fabrication and operation
Fabrication of the inertial microfluidic helical capillary device consists of 4 simple steps and can be completed in <10 min (Fig. 1(d)). First, a certain length of capillary tube was cut from stock using a glass tubing cutter or simply using a scissor. Second, the capillary tube was threaded through two 5 mm rigid tubes that shape and fix the tube into helical shape. Third, a 10 mm observation window was created by burning the polyimide coating near one end of the capillary tube using a match. Finally, inlet and outlet tubing was threaded through the two 5 mm rigid tubes and then fixed to the capillary tube using superglue. The two 5 mm tubes serve as bearings allowing the rotation of the device for observation from top and side views. In our experiment, a helical device with 3 loops and a radius of 20 mm was fabricated using an ∼45 cm long capillary (at a cost of ∼$15). The entire fabrication process only requires a pair of scissors, a tube of superglue, and a match, thus eliminating the need for any sophisticated tools or cleanroom environment.
To demonstrate the feasibility of using the helical capillary tube for inertial focusing, we introduced 10 μm diameter microbeads at the concentration of 3.6 × 10⁵ particles/ml and flow rate Q = 200 μl/min into a device with a radius of ∼20 mm. Microbeads randomly distributed at the inlet of the device (Fig. 1(e)) gradually migrate to the center of the inner sidewall, forming a tightly focused chain near the channel wall (Fig. 1(f) and supplementary material, video 1). To confirm focusing is at a single cross-sectional position, the device was rotated 90° to allow side-view observation. As Fig. 1(g) and supplementary material, video 1, illustrate, all microbeads were focused at the center of the channel. The combination of the top-view image (Fig. 1(f)) and the side-view image (Fig. 1(g)) confirms that the circular capillary device can successfully focus microbeads (and cells, as shown in the section “Shealthless flow cytometry of cells”) into a single focal position with high efficiency.
Adjusting radius of the helical capillary device
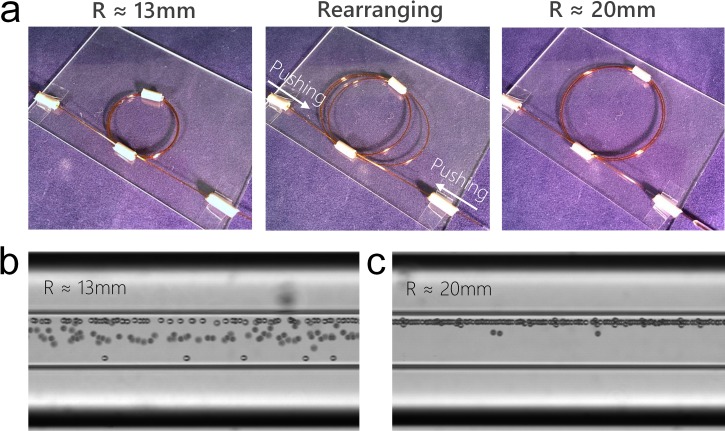
Radius of the helical capillary device can be modified by simply pulling or pushing the two ends of the device. This feature enables convenient tuning of the Dean vortices as well as focusing behavior without refabricating the device. Fig. 2(a) shows a helical capillary device with a radius of ∼13 mm. As 10 μm diameter microbeads were introduced into the device at Q = 150 μl/min, microbeads were focused into multiple positions near the outlet instead of a single position (Fig. 2(b)). This suggests that the small radius leads to strong Dean vortices, which is more dominant than the inertial lift forces. As a result, microbeads are not able to focus into the designed position due to the force imbalance. To optimize focusing, the radius of the device was enlarged to 20 mm by simply pushing and arranging the capillary (Fig. 2(a)). In the adjusted device, the Dean vortices weaken and the 10 μm diameter microbeads were successfully focused into a single position (Fig. 2(c)).
FIG. 2.
Adjusting radius of the helical capillary device. (a) The radius of device was adjusted from ∼13 mm to ∼20 mm by pushing and rearranging the capillary. (b) Stacked bright-field microscopic image showing focusing of 10 μm microbeads near the outlet in a device with radius of ∼13 mm at Q = 150 μl/min. (c) Stacked bright-field microscopic image showing focusing of 10 μm microbeads near the outlet in a device with the radius of ∼20 mm at Q = 150 μl/min.
Optimizing flow for 3D focusing
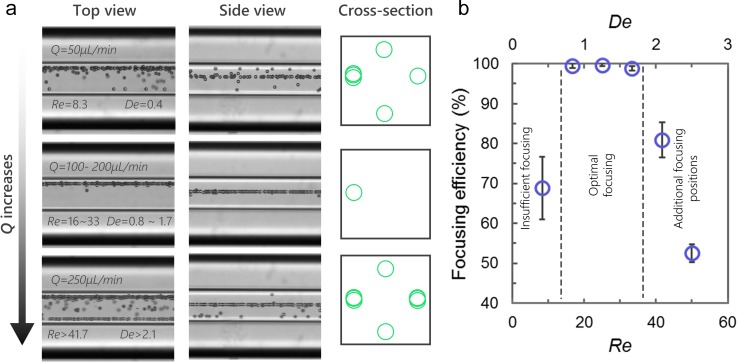
We evaluated the effect of flow rate on inertial focusing in the capillary device to optimize single-position focusing. A 10 μm diameter microbead sample was pumped into a capillary device (R ≈ 20 mm) at flow rates Q = 50–300 μl/min (Re = 8.3–50). At Q = 50 μl/min (Re = 8.3 and De = 0.4), microbeads are focused into four positions near the outlet with ∼70% of the microbeads focused at the designed equilibrium position (Fig. 3). This is because at low De = 0.4, the magnitude of Dean force is limited. Thus, not all of the microbeads can migrate fast enough to reach the equilibrium position before exiting the helical section. As Q = 100–200 μl/min (Re = 16.7–33.3 and De = 0.8–1.7), the magnitude of Dean force increases accordingly. As a result, microbeads migrate faster and are fully focused into a single position with a focusing efficiency of >99%. Further increase of Q to 250 μl/min (Re = 41.7 and De = 2.1) leads to defocusing of microbeads into four focusing positions near the outlet with a focusing efficiency of <80%. The set of experiments suggest that the optimal range of flow rate for 3D focusing in this device is Q = 100–200 μl/min. Within this range, the device can focus microbeads precisely with an efficiency of >99%.
FIG. 3.
Optimizing flow rate for 3D focusing. (a) Stacked bright-field images (n = 100) from top view and side view show focusing of 10 μm microbeads near the outlet at flow rate of 50 μl/min–250 μl/min. The schematics illustrate the focusing pattern from cross-section view. (b) Quantitative analysis (n = 5) of focusing efficiency at corresponding Re and De.
3D focusing of microbeads
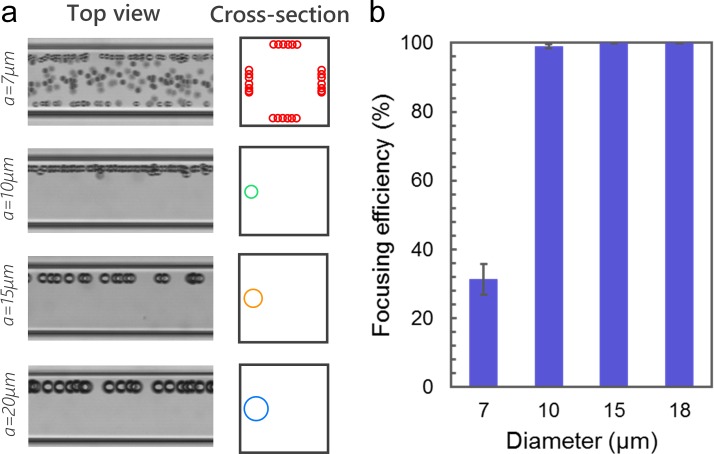
The capillary device can focus microbeads with a wide range of diameters into a single position. We investigated focusing of microbeads with the diameters of 7 μm, 10 μm, 15 μm, and 20 μm, using a device with R ≈ 20 mm at Q = 200 μl/min. As Fig. 4 shows, the device can focus microbeads with diameter a = 10–20 μm into a single position with an efficiency of ∼100%. However, the device has limited performance for 7 μm diameter microbeads. The reason might be that FD is more dominant than FL for smaller beads (FL/FD ∼ a3).6 Thus, the migration of 7 μm diameter microbeads is primarily led by FD along the Dean vortices in the helical section and further focus into four positions in the downstream straight section. To focus 7 μm diameter microbeads, a helical capillary device with larger R must be used to decrease the magnitude of FD. This experiment suggests that the device can provide consistent 3D focusing of microbeads with diameter ≥10 μm or cells in the similar size range. In conventional spiral devices, focusing positions vary with the size of the microbeads or cells, which makes it difficult to focus heterogeneous cell samples precisely into a single stream.6 The capillary device, however, is capable of consistent focusing of heterogeneous particles, which would benefit the alignment of laser and precision of counting.
FIG. 4.
3D focusing of different sized microbeads. (a) Stacked bright-field microscopic images (n = 100) taken near the outlet (n = 100) showing the focusing profiles of 7 μm, 10 μm, 15 μm, and 20 μm diameter microbeads. The schematics illustrate the focusing patterns from the cross-section. (b) Quantitative analysis (n = 5) of focusing efficiency of different sized microbeads.
Effect of particle concentration on 3D focusing
The concentration of microbeads or cells in a sample is known to affect inertial focusing performance. To investigate this, we individually pumped 10 μm diameter microbead samples with an increasing concentrations from 3.6 × 10⁵ to 2.9 × 10⁶ particles/ml into a device at Q = 200 μl/min. As Fig. 5(a) shows, at low concentrations of 3.6 × 10⁵ particles/ml and 7.2 × 10⁵ particles/ml, microbeads are focused into a single stream and are spaced from each other. The corresponding focusing profiles (Fig. 5(b)) appear as narrow single peaks (red and yellow) near the sidewall, indicating successful single-position focusing. To quantitatively evaluate the focusing quality, the full widths at half maximums (FWHM) of the peaks were measured and normalized to particle diameter a. The FWHM/a and efficiency of focusing at the two concentrations were ∼1% and ∼100%, respectively, confirming high precision of the focusing (Fig. 5(c)). As the concentration of microbeads increased to 1.4 × 10⁶ particles/ml, they still aligned into the designed single focal position with ∼100% efficiency. However, due to the increase in the concentration, microbeads are closer to each other with greater chance of interparticle interaction and looser focusing.20 The focusing profile (Figs. 5(b) green and 5(c)) appears as a wider peak with an FWHM/a of 1.3, suggesting decreased focusing precision. As the concentration increases to 2.9 × 10⁶ particles/ml, greater interparticle interaction further disrupts focusing, leading to a wider focusing streak with an FWHM/a of 1.5. The limited space also forces a certain number of microbeads into additional focusing positions and thus leads to lower focusing efficiency (88%).
FIG. 5.
The effect of particle concentration on 3D focusing. (a) Single bright-field images and corresponding standard deviation stacking images showing focusing of 10 μm diameter microbeads at concentration from 3.6 × 10⁵ to 2.9 × 10⁶ particles/ml. (b) Focusing profiles along the channel width derived from the standard deviation stacking images at various microbead concentrations. (c) Quantitative measurement of FWHM/a and focusing efficiency at various microbead concentrations.
In summary, the set of experiments suggest that the device can provide 3D focusing with high precision and efficiency for microbead or cell samples with concentration ≤106 particles/ml. Samples with higher concentrations can be processed in this device, however, with decreased performance.
Sheathless flow cytometry of microbeads
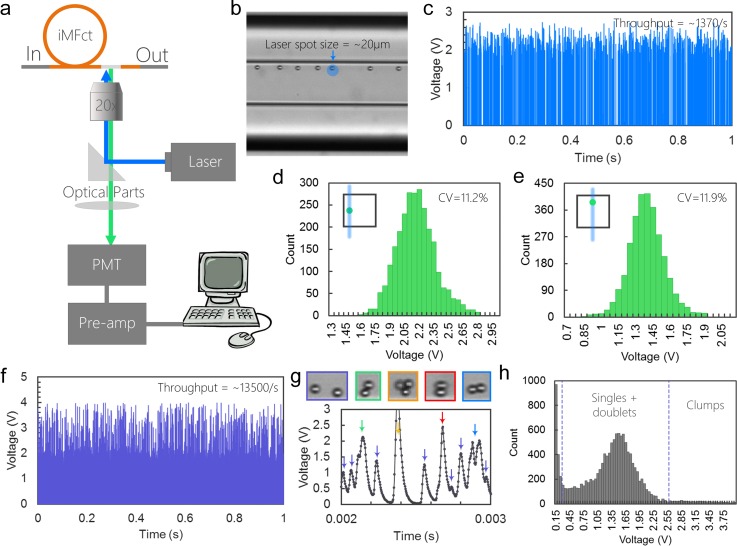
The capillary device can be integrated with our customized laser counting system for high-throughput counting of fluorescently labeled microbeads or cells. As Figs. 6(a) and 6(b) show, a laser with a spot size of ∼20 μm was aimed at the focusing position near the outlet of the capillary device. As each fluorescently labeled microbead passes through the laser spot, it emits fluorescent light for a short period of time. The fluorescent light is collected by a photomultiplier tube (PMT), amplified and converted into a voltage signal. Fig. 6(c) demonstrates the result of counting Fluorescein-isothiocyanate (FITC)-labeled 10 μm diameter microbead samples with a concentration of ∼3.6 × 10⁵ particles/ml. During 1 s time window, a total number of 1370 voltage peaks were detected indicating a throughput of 1370/s that matches well with the theoretical throughput calculated from the concentration (∼1200/s). Histogram of the voltage signals shows a Gaussian-like distribution with a coefficient of variation (CV) of 11.2% confirming the high precision of the 3D focusing in the capillary device (Fig. 6(d)). Furthermore, the device can be rotated 90° manually so that the initial sidewall becomes the top wall. Thus, instead of focusing near the sidewall, microbeads are focused at the center of the top wall. Counting of the same sample shows similar performance with a CV of 11.9% (Fig. 6(e)), implying the rotation does not affect the quality of focusing. This modification eliminates the scattering of excitation light at the sidewall interface and thus is compatible with scatter measurement in flow cytometry.
FIG. 6.
Sheathless flow cytometry counting of microbeads. (a) Schematic showing the setup of the integrated counting system. (b) Bright-field image demonstrating the alignment of the laser. The blue dot indicates the location of the laser spot. (c) Signals of counting 10 μm fluorescently labeled microbeads during 1 s time window. (d) Histograms of voltage signals when microbeads are focused near the side wall. The inset schematic shows the cross-sectional position of the particles and the laser. (e) Histograms of voltage signals when microbeads are focused near the top wall. (f) Signals of counting high-concentration 10 μm fluorescently labeled microbeads during 1s time window. The throughput is measured to be 13 500/s. (g) Signals detected in 1 ms time window. The inset images show the examples of different focusing pattern and morphologies related to the signals. The color of the outlines matches the color of the arrows. (h) Histogram of voltage signals of the high-throughput counting.
We demonstrated counting with high throughput in the helical capillary device using a sample with a concentration of 5.8 × 10⁶ particles/ml. Figure 6(f) demonstrates the crowded signal detected during 1 s, which contains ∼13 500 peaks. A 0.001 s time window shows a detailed example of these signals (Fig. 6(g)). Although appearing as various magnitudes and shapes, 13 peaks can be resolved during 0.001 s indicating high counting throughput. The voltage peaks are less consistent because samples with highly concentrated microbeads contain aggregates, such as doublets or triplets, and exhibit much greater interparticle interactions in flow, which loosens the focusing. As Fig. 6(g) shows, the focusing pattern and morphology of microbead can be estimated from the signals. For example, peaks with the magnitude of 0.3–2 V are likely to represent partially focused single microbeads (purple arrows). Microbead doublets emit stronger light when excited, thus generating peaks with a larger magnitude of 2–2.5 V. In addition, the orientation of doublets at the moment of passing the laser can be estimated from the shape of the double peaks. Doublets aligned along the flow direction yield double peaks with similar magnitude of ∼2 V (blue arrow), while doublets perpendicular to the flow direction generate a single peak with a larger magnitude of ∼2.5 V (red arrow). Microbead triplets or clumps produce signals with magnitude >3 V (yellow arrow). The histogram of the signals shows semi Gaussian-like distribution with the center of the distribution at ∼1.5 V (Fig. 6(h)).
Sheathless flow cytometry of cells
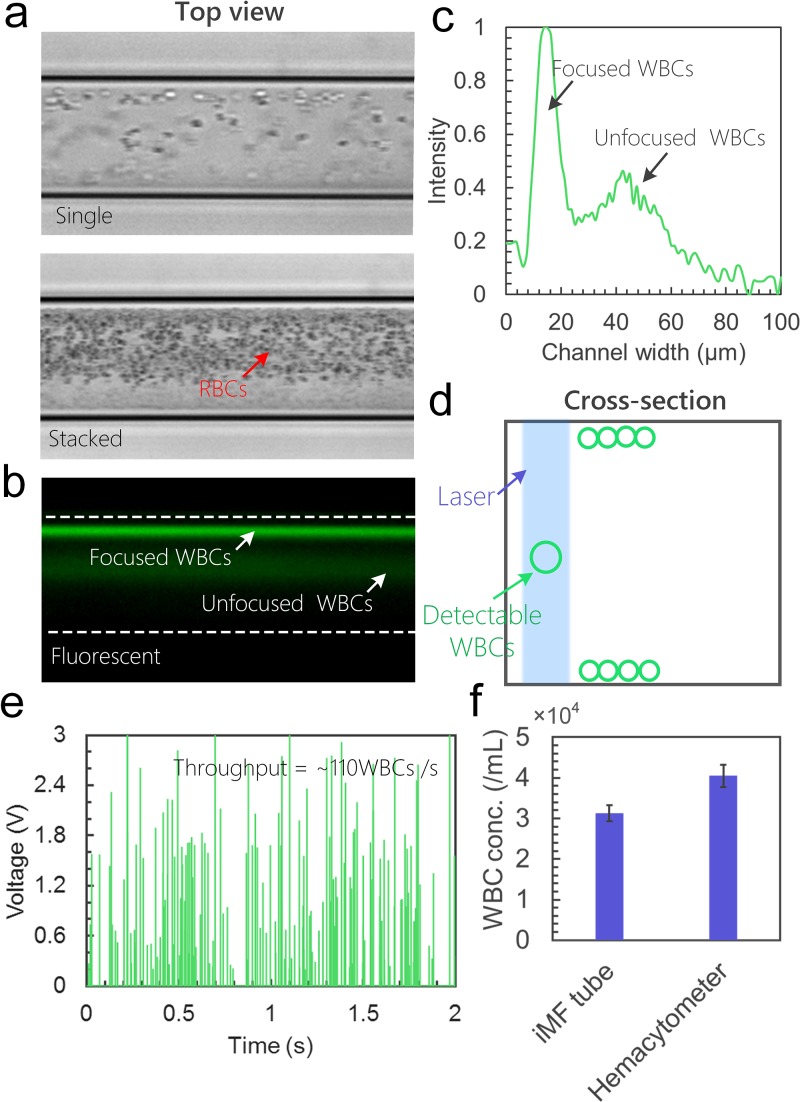
The system can be used to focus and count fluorescently labeled cells within the feasible size range with high throughput. We demonstrated the counting of FITC-labeled WBCs in a blood sample. White blood cells in a bovine blood sample were first labeled with STYO 16 and then diluted 100×. The sample was then introduced to the helical capillary device at Q = 200 μl/min. Since the device was designed to focus cells with size ≥10 μm, red blood cells (RBCs) were circulating in the Dean vortices forming a cloud of cells in the bright-field images (Fig. 7(a)). The fluorescent microscopic image (Fig. 7(b)) demonstrates the focusing of fluorescently labeled WBCs. A majority of WBCs are focused into the designed single position, shown as a sharp peak in the profile linescan along the channel width (Fig. 7(c)). Some WBCs were not fully focused, shown as a broad peak (Fig. 7(c)). This is because certain subpopulations of WBCs such as lymphocytes have sizes in the 7–8 μm range and thus can only be partially focused using this device.
FIG. 7.
Sheathless flow cytometry counting of cells. (a) Single and stacked bright-field images from top view showing focusing of 100× diluted bovine blood. (b) Fluorescence image taken at the same area showing the focusing of fluorescently labeled WBCs. (c) The fluorescent intensity profile along the channel width. (d) Schematic showing the alignment of laser and detectable WBCs. (e) Signals of counting WBCs using the system during 2 s. (f) Quantitative measurements of WBC concentration using the iMF capillary device and a hemocytometer.
In the next set of flow cytometry experiments, we aligned the excitation light near the channel wall so that WBCs with size ≥10 μm can be effectively counted (Fig. 7(d)). As Fig. 7(e) shows, when flowing the blood sample in the device, ∼110 WBCs were detected during 1 s. One should note that the signals vary a lot from 0.2 V to >3 V. This is caused by the inconsistency of labeling. The concentration of WBCs calculated from the measured throughput (110/s) is 3.3 × 10⁴ cells/ml for the 100× diluted sample (Fig. 7(f)), while the concentration of total WBCs measured by a hemocytometer is ∼4.0 × 10⁴ cells/ml. This result suggests that ∼82.5% of the WBCs can be detected using the system. The performance for counting WBCs can be improved from two aspects. First, the capillary device can be modified to enable focusing of smaller cells, so that all the WBC subpopulations can be focused and counted. Second, RBCs in the sample can be lysed to minimize the interference with WBC focusing.
CONCLUSIONS
In summary, we presented an ultra-low-cost, plug-and-play, helical capillary device for high-throughput and sheathless single-position focusing of microbeads and cells. The capillary device offers a number of attractive features. First, the fabrication of the device is a plug-and-play process that takes <10 min and costs <$15, without the use of any sophisticated tools or cleanroom environment. Second, the device is optically transparent and fully compatible with bright-field and fluorescent imaging, as well as laser-based counting. Third, the device can be rotated easily to allow observation or detection from different angles. Fourth, the radius of the helical device can be easily changed to tune the magnitude of the Dean vortices for different focusing behavior. Finally, the device enables precise and consistent 3D focusing of microbeads and cells in a wide range of sizes with high throughput and without the use of sheath flow. Considering the ultra-low-cost nature and ease of fabrication of this capillary-based inertial microfluidic device, as well as its powerful 3D focusing performance, we expect this device to create new opportunities for this technique to be used in the laboratory research.
METHODS
Device operation and microscopic imaging
We loaded a syringe with microbead or cell sample and connected it to the device by using a 1/16 in. tygon tubing (Cole-Parmer) with proper fittings (Upchurch Scientific). We pumped samples into devices using a syringe pump (Legota 180, KD scientific). We used an inverted epi-fluorescence microscope (IX71, Olympus Inc.) equipped with a 12-bit high-speed CCD camera (Retiga EXi, QImaging) to take bright-field images. The exposure time was set to minimum value (10 μs) and 300 images were sequentially taken with the minimum time interval. By stacking 100–300 images in ImageJ, we established a complete view of particle focusing. To capture fluorescence images, we used the same microscope while setting the exposure time to 100 ms–500 ms depending intensity of fluorescent labeling and sequentially taking 20 images. The images were then stacked and pseudo-colored in ImageJ.
Sample preparation
We diluted the microbead stock solutions (Bangs Laboratories) with deionized water into desired concentrations. Tween-20 at 0.1% v/v (Fisher Scientific) was added to the microbead samples as stabilizer to avoid aggregation and clogging issues. Bovine whole blood was purchased from the Lampire Biological Laboratories. Blood sample was first stained with SYTO 16 (Thermo Fisher Scientific) and then diluted 100× before pumping into the device.
Laser counting system
The custom laser counting system consists of an inverted microscope (TE2000U, Nikon Inc., Melville, NY, USA) with a 20× objective. Both FITC-labeled microbeads and cells were excited using a 488 nm argon laser (50mW, CVI Melles Griot, Albuquerque, NM, USA) with corresponding neutral density filter (Thorlabs, Newton, NJ, USA) for power adjustment. A photomultiplier tube (H6780–20, Hamamatsu, Bridgewater, NJ, USA) was used to collect emitted light. The signal collected from the PMT was processed with a current-to-voltage preamplifier (SR570, Stanford Research Systems, Sunnyvale, CA, USA) and then further recorded using a custom LabVIEW data acquisition system (NI PCI 6036E National Instruments, Austin, TX, USA).
Data analysis
Focusing efficiency is calculated as the number of beads in the expected position over the total number of beads. The focusing efficiency of microbeads for each experiment was automatically analyzed from 300 images in ImageJ. At least 500 beads were analyzed in each experiment. The linescans of the fluorescent intensity peaks were measured using ImageJ.
SUPPLEMENTARY MATERIAL
See supplementary material for high-speed bright-field video demonstrating the single-position focusing of 10 μm microbeads from top view and side view.
ACKNOWLEDGMENTS
This work was supported in part by the Ohio Center of Microfluidic Innovation (OCMI) at the University of Cincinnati.
References
- 1. Nolan J. P. and Sklar L. A., Nat. Biotechnol. 16, 633–638 (1998). 10.1038/nbt0798-633 [DOI] [PubMed] [Google Scholar]
- 2. Martel J. M. and Toner M., Annu. Rev. Biomed. Eng. 16, 371–396 (2014). 10.1146/annurev-bioeng-121813-120704 [DOI] [PMC free article] [PubMed] [Google Scholar]
- 3. Zhang J., Yan S., Yuan D., Alici G., Nguyen N., Ebrahimi Warkiani M., and Li W., Lab Chip 16, 10–34 (2016). 10.1039/C5LC01159K [DOI] [PubMed] [Google Scholar]
- 4. Wang X., Liedert C., Liedert R., and Papautsky I., Lab Chip 16, 1821 (2016). 10.1039/C6LC00215C [DOI] [PubMed] [Google Scholar]
- 5. Zhang J., Yan S., Sluyter R., Li W., Alici G., and Nguyen N., Sci. Rep. 4, 4527 (2014). 10.1038/srep04527 [DOI] [PMC free article] [PubMed] [Google Scholar]
- 6. Kuntaegowdanahalli S. S., Bhagat A. A. S., Kumar G., and Papautsky I., Lab Chip 9, 2973–2980 (2009). 10.1039/b908271a [DOI] [PubMed] [Google Scholar]
- 7. Wang X., Yang X., and Papautsky I., Technology 4, 88 (2016). 10.1142/S2339547816400112 [DOI] [Google Scholar]
- 8. Oakey J., Applegate R. W., Arellano E., Carlo D. D., Graves S. W., and Toner M., Anal. Chem. 82, 3862–3867 (2010). 10.1021/ac100387b [DOI] [PMC free article] [PubMed] [Google Scholar]
- 9. Bhagat A. A. S., Kuntaegowdanahalli S. S., Kaval N., Seliskar C. J., and Papautsky I., Biomed. Microdevices 12, 187–195 (2010). 10.1007/s10544-009-9374-9 [DOI] [PubMed] [Google Scholar]
- 10. Chung A. J., Pulido D., Oka J. C., Amini H., Masaeli M., and Di Carlo D., Lab Chip 13, 2942–2949 (2013). 10.1039/c3lc41227j [DOI] [PubMed] [Google Scholar]
- 11. Chung A. J., Gossett D. R., and Di Carlo D., Small 9, 685–690 (2013). 10.1002/smll.201202413 [DOI] [PubMed] [Google Scholar]
- 12. Wang X., Zandi M., Ho C., Kaval N., and Papautsky I., Lab Chip 15, 1812–1821 (2015). 10.1039/C4LC01462F [DOI] [PMC free article] [PubMed] [Google Scholar]
- 13. Xia Y. and Whitesides G. M., Annu. Rev. Mater. Sci. 28, 153–184 (1998). 10.1146/annurev.matsci.28.1.153 [DOI] [Google Scholar]
- 14. Utada A. S., Lorenceau E., Link D. R., Kaplan P. D., Stone H. A., and Weitz D. A., Science 308, 537 (2005). 10.1126/science.1109164 [DOI] [PubMed] [Google Scholar]
- 15. Chung B. G., Lee K. H., Khademhosseinicdef A., and Lee S. H., Lab Chip 12, 45–49 (2012). 10.1039/C1LC20859D [DOI] [PubMed] [Google Scholar]
- 16. Zhou J. and Papautsky I., Lab Chip 13, 1121–1132 (2013). 10.1039/c2lc41248a [DOI] [PubMed] [Google Scholar]
- 17. Bhagat A. A. S., Kuntaegowdanahalli S. S., and Papautsky I., Lab Chip 8, 1906–1914 (2008). 10.1039/b807107a [DOI] [PubMed] [Google Scholar]
- 18. Martel J. M. and Toner M., Sci. Rep 3, 3340 (2013). 10.1038/srep03340 [DOI] [Google Scholar]
- 19. Nivedita N. and Papautsky I., Biomicrofluidics 7, 054101 (2013). 10.1063/1.4819275 [DOI] [PMC free article] [PubMed] [Google Scholar]
- 20. Lee W., Amini H., Stone H. A., and Di Carlo D., Proc. Natl. Acad. Sci. U. S. A. 107, 22413–22418 (2010). 10.1073/pnas.1010297107 [DOI] [PMC free article] [PubMed] [Google Scholar]
Associated Data
This section collects any data citations, data availability statements, or supplementary materials included in this article.
Supplementary Materials
See supplementary material for high-speed bright-field video demonstrating the single-position focusing of 10 μm microbeads from top view and side view.


