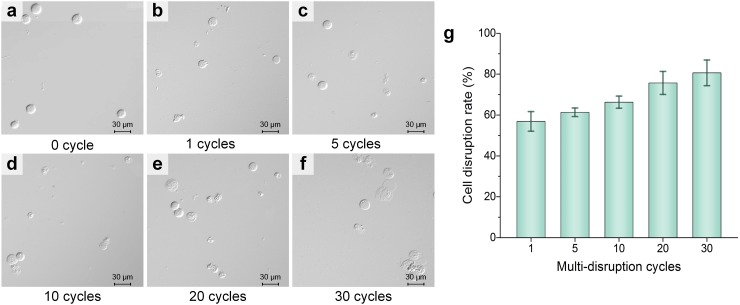
FIG. 7.
HEK293 cells' cell disruption results with different repeating cycles of the circulating disruption step. (a) Microscopic image of the initial HEK293 cell sample. (b)–(f) Microscopic images of collected samples with 1, 5, 10, 20, and 30 repeating cycles of the circulating disruption step. (g) Cell disruption rate versus repeating cycles. Scale bars in (a)–(f) represent 30 μm, and the error bar in (g) represents the standard deviations of 5 different trials.

