Abstract
Optical tweezers have emerged as a powerful tool for multiparametric analysis of individual nanoparticles with single-molecule sensitivity. However, its inherent low-throughput characterstic remains a major obstacle for its applications within and beyond the laboratory. This limitation is further exacerbated when working with low concentration nanoparticle samples. Here, we present a microfluidic-based optical tweezers system that can ‘actively’ deliver nanoparticles to a designated microfluidic region for optical trapping and analysis. The active microfluidic delivery of nanoparticles results in significantly improved throughput and efficiency for optical trapping of nanoparticles. We observed a more than tenfold increase of optical trapping throughput for nanoparticles as compared to conventional systems at the same nanoparticle concentration. To demonstrate the utility of this microfluidic-based optical tweezers system, we further used the back-focal plane interferometry coupled with the trapping laser for precise quantitation of nanoparticle size without prior knowledge of the refractive index of nanoparticles. The development of this microfluidic-based active optical tweezers system thus opens the door to high-throughput multiparametric analysis of nanoparticles using precision optical trap in the future.
Graphical Abstract
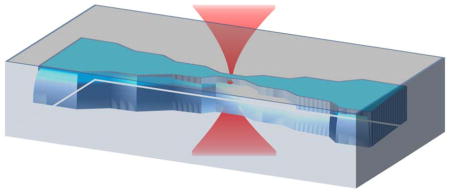
Engineering of a microfluidic-channel leads to a substantial increase in the throughput for the optical trapping of nanoparticles.
1. Introduction
Multiparametric characterization of nanoparticles at the single particle level is of tremendous demand for applications in nanomedicine1,2, photovoltaics3, clinical diagnosis4, environment5, and industrial6 among many others. Detection of individual nanoparticles with single-molecule sensitivity is important as they can directly reveal the heterogeneities among particles that are otherwise hidden in ensemble characterization. Single-molecule sensitivity is essential especially for biological particles, where the difference between particles just by one or two molecules could impart a measurable effect on their biological activity.7 Furthermore, single-molecule sensitivity can offer an intrinsic reference based on which the stoichiometry of a particular protein in a biological nanoparticle can be estimated7,8. Such information is needed for better understanding and interpretation of experimental results. Many well-established microscopy techniques can be used for characterization of nanoparticles at single-particle level. These include confocal laser scanning microscopy (CLSM)9, near-field scanning optical microscopy (NSOM)10, scanning electron microscopy (SEM)11, transmission electron microscopy (TEM)12, atomic force microscopy (AFM)13 and scanning tunneling microscopy (STM)14. New techniques such as nanoparticle tracking analysis (NTA)15, nanopore integrated with resistive pulse techniques16, electronic detection17,18 and optical detection19,20 have also been used for characterization of size, concentration and other parameters of nanoparticles. Among these techniques, optical tweezers have emerged as a highly versatile tool for characterizing nanoparticles with unique advantages. First, optical tweezers allow detection of individual biological nanoparticles in fluid close to physiological conditions21. Second, optical tweezers allow detection of nanoparticles on the basis of an optical gradient force acting on the nanoparticle, which has a cubic dependence on the size of particles as compared to the sixth power dependence of scattering, thus providing higher sensitivity for size characterization comparing to scattering based techniques22. Third, optical tweezers allow quantitation of nanoparticle size without prior knowledge of the refractive index of particles, which is a parameter necessary for size analysis based on light scattering techniques. For example, recently, optical tweezers were used to determine the size and refractive index of individual HIV virions.21,23 Fourth, optical tweezers can be integrated easily with other techniques such as fluorescence microscopy24, Raman spectroscopy25,26, atomic force microscopy (AFM)27 and electrical characterization techniques28, which makes this technique rather versatile for multiparametric analysis of nanoparticles on a single platform. For example, optical tweezers coupled with two-photon fluorescence excitation (TPFE) have been used to determine the envelope protein density of HIV viruses7,21 and quantitative detection of carcinoembryonic antigen (CEA)29, a cancer marker in human whole serum. Optical tweezers have also been used in combination with an external electric field to measure the charge carried by individual microparticles and optical anisotropy.30 Another category of optical tweezers popularly known as nanophotonic tweezers have also shown nanoparticle characterization capabilities. For example, open microcavities were used for calculating nanoparticle polarizability and coefficient of friction.31 Lastly, the ability to manipulate individual trapped nanoparticles may permit sorting of individual particles based on measurement characteristics, an important but underexplored area. In spite of these unique features of optical tweezers, their low throughput characteristic32,33 presents a major challenge in its development as a multiparametric characterization tool for nanoparticles. A high-throughput capability is practically necessary to improve the efficiency of data collection when working with samples containing a low concentration of nanoparticles such as HIV virions in human blood34 or trying to detect rare particles such as titanium oxide (TiO2) in the tertiary effluent of waste water plant.35
Two major approaches, time sharing of laser beam36 and holography37, have been developed for improving the throughput of optical tweezers. Both approaches are based on the idea of transforming optical trapping into a parallel process by creating multiple trapping points to enable simultaneous capture of multiple particles, thereby effectively increasing the throughput of optical tweezers. Although these techniques can increase the throughput of optical trapping, their applications in trapping and detection of sub-micron particles may still be limited. For example, for holographic tweezers, input laser power is shared among all trapping points and therefore it would require a high laser power for creating multiple traps to stably capture sub-micron particles. Using a relatively low laser power, plasmonic tweezers made of circular gold disk38 and photonic waveguides39 have been used to create multiple traps. However, simultaneous detection of multiple trapped particles is usually through imaging using a charged coupled device (CCD) camera, which is only suitable for sub-micron particles under special illumination conditions40,41.
In this work, we maintain optical trapping as a serial process, i.e., trapping and analysing particles one at a time, but aim to increase the throughput of the system by speeding up the trapping process. This idea is based on the simple fact that an intrinsic bottleneck that limits the throughput of optical trapping is the time required for diffusing nanoparticles to encounter the diffraction-limited laser trap, which increases substantially for low concentration samples. We refer to such optical tweezers system, where particles encounter the laser trap only through normal diffusion without external influences of flow, electric or magnetic field etc., as passive trapping systems. To ameliorate this bottleneck, here we integrate the optical tweezers with a tapered microfluidic nanoparticle delivery system, where microfluidic flow actively delivers target nanoparticles to the laser trap region. Thus, we term this design as an active trapping system. Specifically, the trapping laser was positioned in the smallest cross-section of the microfluidic channel to increase the probability of encounter of target nanoparticles with the trap region and therefore maximize nanoparticle trapping efficiency. We found that the throughput of the microfluidics-based active trapping system is dependent on both flow rate and the particle trapping efficiency. Both the throughput and trapping efficiency can be significantly improved by optimizing the flow rate. Moreover, the use of flow and small cross-section channel to realize high throughput trapping does not impact the capability of the optical trap to characterize different features of nanoparticles, such as particle size. Applications of the microfluidics-based active trapping system can be extended for multiparametric measurements of nanoparticles while maintaining its high throughput feature. Other approaches can be combined with the presented technique with some modifications in the future to further increase the throughput of the optical tweezers system.
2. Material and methods
Microfluidic channel design
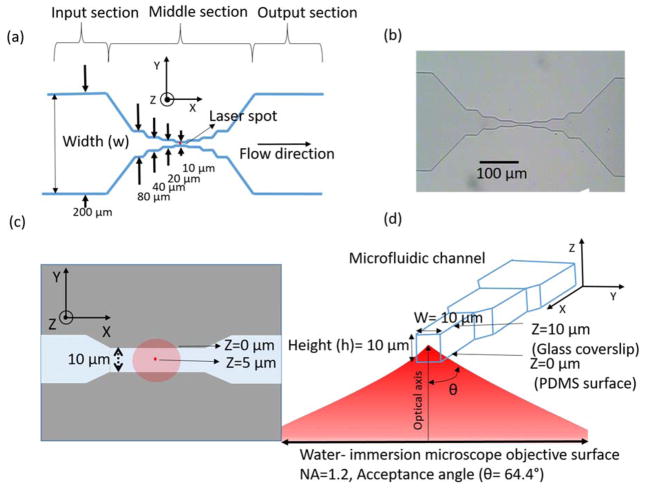
The schematic of the microfluidic channel used for trapping of nanoparticles is shown in figure 1a. The channel consists of three sections: input section, middle section and output section. The trapping laser propagates along z direction. The input and output sections are of width (w) 200 μm along the y direction. The middle section consists of a symmetrical tapered structure with varying channel widths. The widths of the channel are 80, 40, 20 and 10 μm in the middle section as shown in figure 1a. The height (h) of the channel along the Z direction is kept constant at 10 μm as shown in figure 1d. Figure 1b shows the microscope image of the fabricated polydimethylsiloxane (PDMS) microfluidic channel taken using a 10× objective lens. The minimum cross-sectional size of the channel in the middle section is thus 10 μm × 10 μm (width(w) × height (h)), which is sufficiently small compared to our previous design (3000 μm × 100 μm in width(w) × height (h)) to potentially ‘focus’ nanoparticle to the trapping region and yet large enough to reduce the interference of the laser beam from the channel boundaries. The width of the input and output sections was fixed to 200 μm because larger width easily led to channel collapse during fabrication as a results of large aspect ratio (width to height ratio). PDMS based channels with aspect ratio of greater than 20:1 tend to collapse during fabrication and therefore require additional supporting mechanisms which increases the complexity in the fabrication process.42 Smaller channel widths for the input and output sections is also not recommended in our case. This is due to the long length (25.4 mm) of the input and output section of the channel, which result in a high fluidic resistance and therefore would require high input pressure for the fluid flow. Such high pressure might damage the PDMS-glass bonding. The use of other material like glass, for the microfluidic channel fabrication could reduce some of these restrictions, but again they have a complex fabrication procedure as compared to the well-established fabrication procedure for PDMS based microfluidic devices. A total of seven identical channel were fabricated on a single microfluidic device. This gives the microfluidic chip the flexibility of using different nanoparticle suspensions on the same device and the redundancy in case of a channel failure due to clogging or other issues.
Figure 1.
(a) Schematic of the microfluidic channel used for flow of nanoparticles. (b) Microscope image of the fabricated PDMS based channel using a 10× objective lens. (c) Schematic of the top view of the 10 μm section of the microfluidic channel showing the laser spots at two axial planes along the Z (height) direction. (d) Cross-sectional view of the 10 μm section of the channel showing the trap laser beam position with respect to the channel boundaries in the Y and Z directions.
Chip fabrication
The microfluidic chamber was prepared using the standard soft-lithography technique43 as shown in figure 2. The spacing between the objective and the condenser lens in the experimental setup (fobjective + fcondenser = 540 μm) requires the total microfluidic device thickness to be within ~ 440 μm (leaving 50 μm +50 μm for the DI water as water immersion objective lens are used for optical trapping, see Supplementary Fig. S1 for illustration). Since No.1 glass coverslip (130–170 μm) was used for bonding with the PDMS, the PDMS film containing the channels was fabricated to have a thickness of approximately 250 μm. The small thickness of the PDMS film requires a small modification in the standard fabrication procedure for common microfluidic devices. The mould used for fabricating the microfluidic channels was made on the silicon wafer using deep reactive ion etch (DRIE). This method allows to have straight walls of the channel, in addition to a robust structure. A 10:1 mixture of PDMS base and curing agent was spun coated on the silicon wafer with the channels at a speed of 300 rpm for 45 seconds. This results in a thickness of around 250 μm for the PDMS film. The PDMS was baked at 100 °C for 30 min. Due to the thin PDMS film, it is not possible to punch holes directly to the PDMS film, which is to be bonded to the glass coverslip. To overcome this problem, we used two PDMS pads of size 24×12 mm, and bonded them near the inlet and the outlet of the channels using oxygen plasma. Though this increases the thickness of the microfluidic device at the inlet and outlet of the channel, it maintains the thickness of 250 μm near the centre of the channels. This additional step was done prior to the peeling off the PDMS film from the silicon wafer. The whole assembly of the PDMS film and the PDMS pads was then peeled off from the silicon wafer and now holes could be easily punched at the input and output ports for connecting the tubing’s. Finally, the PDMS film was bonded to the glass coverslip using oxygen plasma and baked at 60 °C for 15–30 min.
Figure 2.
Fabrication procedure of the microfluidic device using soft lithography
Optical tweezers experiment
A home-made optical tweezer instrument using a tapered amplifier diode laser operating at an air wavelength of 830 nm (SYS-420-830-1000, Sacher LaserTechnik LLC) was used for optical trapping of polystyrene nanoparticles.44 In brief, the trapping laser was focused to a diffraction limited spot using a 60× water-immersion objective lens with numerical aperture 1.2. The back-focal-plane interferometry (BFPI)45 signal from the trapped particle was detected using a position sensitive detector (PSD) and recorded at 62.5 KHz for 10 seconds for the calculation of the diameter of nanoparticles. 46 The trap laser power was monitored using the PSD and kept constant at 130.8 mW with 1% variation at the focus for all the experiments. In case of experiments using fluorescent polystyrene particles, a solid-state laser of wavelength 488 nm was used for their excitation and the epi-fluorescence was detected using an electron-multiplying charge-coupled device (EMCCD) camera. To measure the diameter of nanoparticles using a reference signal, a closed loop nano-positioning stage (3D200, Mad City Labs) was used to oscillate the microfluidic chamber along X axis at a defined frequency and amplitude.47 We notice that channel boundaries had no influence on the BFPI signal when the chamber was oscillated along X axis, as compared to the oscillation along the Y axis, which would introduce unwanted noise to the BFPI signal due to the periodic change in the refractive index experienced by the laser beam due to moving channel boundaries. Thus, all particle sizing was done by oscillation of the chamber along X axis. All the trapping experiments were conducted at a constant temperature of 20.0 ± 2 °C. The polystyrene nanoparticles were diluted in milli-Q water to specified concentrations and sonicated before injection into the microfluidic channel. A pressure driven flow system was used for the flow of the nanoparticles in the microfluidic channel. We recommend the use of pressure driven flow as compared to the mechanical flow using the syringe pump as the latter showed a very large relaxation time and lacked precise control of the flow rate during the experiments. The precise control of flow rate is crucial for high throughput optical trapping as will be explained in the later section.
Measurement of trapping throughput
In this work, we quantify the throughput of optical trapping using trapping frequency, which is the number of particles trapped per second. The experiments were conducted using polystyrene nanoparticles of two different sizes: one with an average diameter of 190 nm which is non-fluorescent and has been used extensively in the past for various calibration purposes21, and the other with an average diameter of 410 nm which is fluorescent and can be visualized using epi-fluorescence for measurement of trapping efficiency. The working concentrations for the 190-nm particles were kept constant at 4×10⁷ particles/ml in all experiments. This concentration was calculated based on manufactural specified stock concentrations of the particle. The working concentrations for the 410-nm particles were kept constant at 2×10⁷ particles/ml in all experiments. This range of concentrations was chosen to be close to the concentration of nanoparticles that we have studied previously, which represents a physiologically relevant concentration for virus particles. The concentration of the 410-nm fluorescent polystyrene particles was verified by direct counting of particles under the microscope as described in the supplementary information. In the active trapping system, a flow velocity was maintained to deliver particles and the flow velocity never exceeded the escape velocity of the trapped particle, which corresponds to the maximum flow velocity beyond which the particles cannot be trapped by the laser beam for a given laser power. The escape velocity of the trap, in our experiment were found to be 1820±50 μm/s for the 410 nm and 258±10 μm/s for the 190 nm nanoparticles with the specified laser power. In contrast for the passive trapping system, no flow was applied while the particles were trapped. For both systems, multiple particles were consecutively trapped and then released immediately in less than a second and the time stamp of each trapping event was recorded, either from the captured video in case of the fluorescent nanoparticles or from the time series of the BFPI signal, where a change in the BFPI signal indicates trapping of a particle23. The time interval between the two consecutive trapping events gives the inter-particle trapping time and its inverse yields the trapping frequency. Throughout, the flow velocity in each section of the channel was measured from the flow videos of the 410-nm fluorescent particles passing through each section in the channel.
3. Results and discussion
High throughput optical trapping
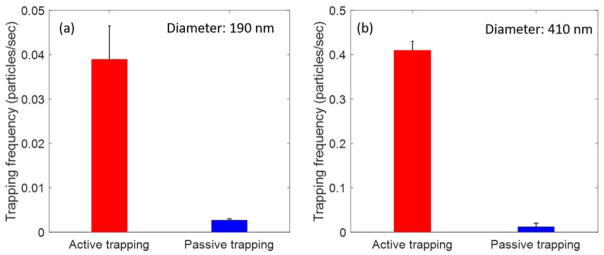
We measured the trapping frequency in the active delivery system and compared it with that in a passive trapping system, as described in Materials and Methods. Figure 3a and 3b show a side-by-side comparison of the trapping frequency for both the active and passive trapping systems, for both 190 nm and 410 nm polystyrene particles, respectively. The trapping frequency reported for the active trapping system was measured in the channel section with the smallest width (10 μm). At a flow rate of 190±10 μm/s, the trapping frequency for the 190-nm particle was 0.04±0.007 particle/s, which was slightly more than tenfold higher than that in the passive trapping system. The frequency of trapping varies with flow rate (more details see the dedicated section below). Throughout, the errors we reported for flow velocity and trapping frequency are standard error of the mean, or SEM unless otherwise noted. Similarly, the trapping frequency for the 410-nm particle was 0.4±0.02 particle/s at a chosen flow rate of 1411±35 μm/s, which was 30× higher than that in the passive trapping system. These results show that the throughput for optical trapping of nanoparticles can be improved substantially by using the tapered microfluidic nanoparticle delivery system. Two major factors likely contribute to the higher throughput: (1) the increase in the probability of particle trapping, due to the use of microfluidic channel with small cross-sections, and (2) the use of fluid flow for the delivery of nanoparticles rather than relying on normal diffusion. To quantify the influence of these two factors on the throughput of optical trapping, we have thus studied the trapping frequency as a function of the size of the channel cross-sections and the flow rate.
Figure 3.
Comparison of trapping frequency between active and passive trapping system (a) for 190-nm polystyrene nanoparticles (b) for 410-nm fluorescent polystyrene nanoparticles. The error bar represents the SEM with sample size of N=60 (active trapping) and N=46 (passive trapping) for 190-nm polystyrene nanoparticles and N= 127 (active trapping) and N=200 (passive trapping) for 410-nm polystyrene nanoparticles. The flow velocity, measured in case of active trapping is 190 ± 10 μm/s for 190 nm polystyrene nanoparticles and 1411±35 μm/s for the 410 nm polystyrene nanoparticles.
Impact of channel width on the trapping throughput at set pressure
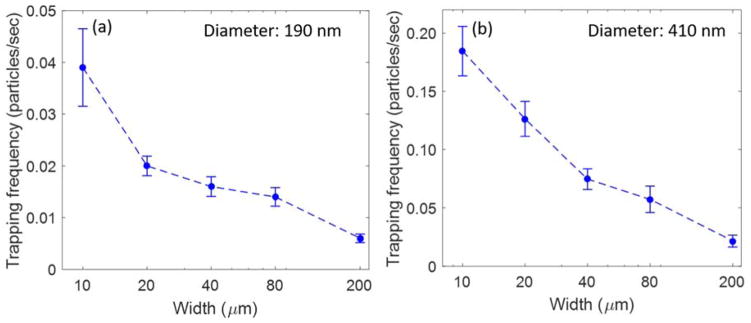
The channel section with the smallest width of 10 μm was used in the above experiments to measure the throughput of optical trapping, as its small size likely increases the chance to trap particles flowing across the channel. To further test this, we positioned the trapping laser in different sections of the microchannel and measured the trapping frequency in channel sections of different widths. In these experiments, a single setting of pneumatic pressure was applied to drive the flow in the microchannel. Although the linear flow velocity in each section varies with the width of the channel (Table 1), the input pressure was low enough such that the maximum flow velocity obtained in the channel (highest in the 10 μm channel for a given input pressure) remained less than the escape velocity of the particle. Figure 4a and 4b shows the trapping frequency as a function of the channel width for both 190-nm and 410-nm particles. The results show clearly that the trapping frequency decreases considerably as the width of the channel is increased. This trend is true for both 190 and 410-nm particles. As a result, the channel section with the smallest width (or smallest cross-section) has the highest trapping frequency among all and therefore provides the highest throughput observed. For both 190- and 410-nm particles, the trapping frequencies became comparable to those in the passive trapping system when the channel section with the largest width of 200 μm was used for trapping. These results are consistent with the idea that a smaller cross-section can effectively ‘focus’ nanoparticles to the trapping region, which increases the probability of particle encountering with the optical trap and thereby the throughput of optical trapping. However, it is worth noting that a higher flow rate in thinner channels may also contribute to the increase in trapping frequency (see Section on “Impact of flow velocity on particle trapping efficiency and throughput”). From these results, one can also predict that the throughput of optical trapping at a set pressure can be further improved by decreasing the cross-section of the channel, provided that the small channel can be fabricated and nonspecific interactions are minimal between the particles and the channel walls.
Table 1.
Linear flow velocity as measured from the travel speed of particles in different sections of the channel during the trapping frequency measurements using the 190 and 410 nm polystyrene particles
| Width (μm) | Flow velocity for 190 nm particles (μm/s) | Flow velocity for 410 nm particles (μm/s) |
|---|---|---|
| 10 | 190±10 | 485±33 |
| 20 | 75±5 | 240±13 |
| 40 | 32±2 | 109±6 |
| 80 | 16±1 | 54±2 |
| 200 | 6±0.5 | 26±1 |
Figure 4.
Trapping frequency as a function of the width of the channel used for optical trapping of (a) 190-nm polystyrene particles, and (b) 410-nm polystyrene particles. The error bars represents the SEM with sample size of N=60 (W=10 μm), N=41 (W=20 μm), N=33 (W=40 μm), N=30 (W=80 μm), N=27 (W=200 μm) for 190 nm polystyrene nanoparticles and N=36 (W=10 μm), N=49 (W=20 μm), N=34 (W=40 μm), N=41 (W=80 μm), N=13 (W=200 μm) for 410 nm polystyrene nanoparticles
Impact of channel width on the particle trapping efficiency at set pressure
A corollary of the above results is that the efficiency to trap particles would be increased with decreasing channel cross-sections. The rationale is that decreasing channel cross-sections will effectively increase the fraction of fluid volumes that carry particles crossing the trapping region of the laser beam, such that a larger fraction of particles will be under the influence of the optical trap, which increases the probability of trapping. In this section, we demonstrate this effect by measuring the trapping efficiency, which is a direct measure of this increase in the probability of trapping leading to higher throughput of the optical trapping system. Trapping efficiency is defined as the percentage of particles trapped versus total number of particles passing through the channel.
nflow: total number of particles flown
ntrap: number of particles trapped
To obtain a reliable measure of the total number of particles traversing through the microfluidic channel, we used the epi-fluorescence to directly visualize and count the 410-nm particles. Particle trapping efficiency was then measured by trapping fluorescent polystyrene particles in different sections of the microfluidic channel. The total number of particles trapped and flown across the channel were counted from the flow video of the fluorescent particles in the channel captured by an EMCCD. Figure 5 shows the particles trapping efficiency in the 10, 20, 40, 80 and 200 μm sections of the microfluidic channel obtained from the 410 nm fluorescent particles. From the results, we observe a significant decrease in particle trapping efficiency from 33 % to 3.1 % when the width of the channel is increased from 10 μm to 200 μm. The result clearly demonstrates that a small cross-section of the channel results in an increased probability of trapping of particles flowing across it and hence a higher particle trapping efficiency. Though, the direct measurement of the particle trapping efficiency for the 190 nm nanoparticles was not possible, as being non-fluorescent, we cannot count the total number of particles flown across the channel, but based on the channel dimension, flow velocity measurement (obtained by mixing 410 nm fluorescent particles in the 190 nm nanoparticle solution) and the given concentration of the 190 nm nanoparticles, we could estimate the total number of particles flown across the channel section in a given time frame. Thus, based on the number of particles trapped and the estimated number of particles flown across the channel in a particular time frame, we found the particle trapping efficiency of 2.8 % at flow velocity of 190±10 μm/s and 4.3 % at 147±11 μm/s in the 10 μm section.
Figure 5.
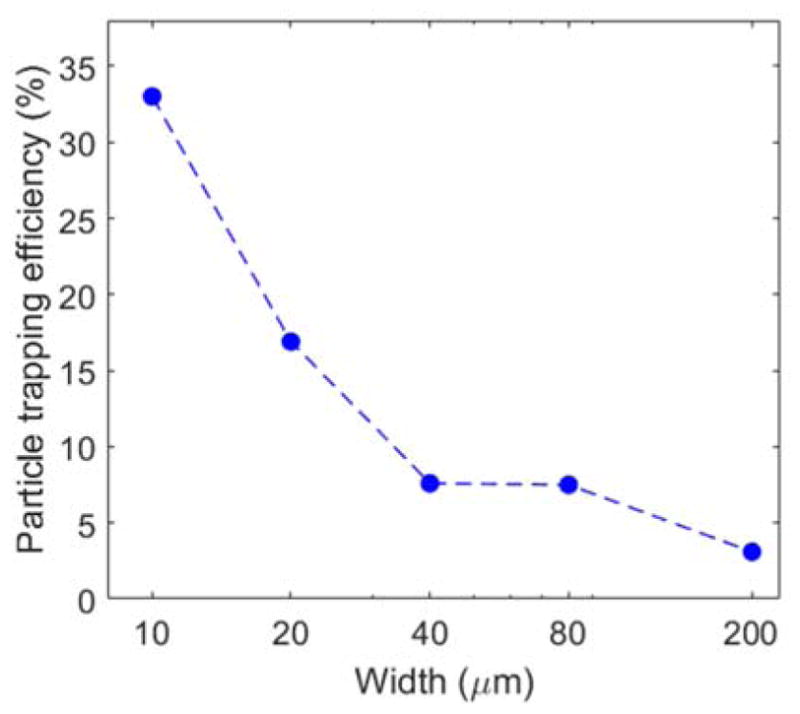
Particle trapping efficiency variation with change in the width of the microfluidic channel. The flow velocity for each section is given in Table 1.
Impact of flow velocity on particle trapping efficiency and throughput
The application of flow, in principle, can ‘speed up’ the delivery of particles to the trap region and thus increase the throughput of the system. On the other hand, a flow velocity above a certain threshold may create a stokes force that is large enough to simply compete with the trapping potential and thus decrease both the throughput and efficiency of trapping. Given the importance of flow velocity in this active trapping system, it is necessary to study its impact on the particle trapping frequency and efficiency. To this end, we used the pneumatic pressure system to drive fluid at different velocities in the channel. The trapping frequency and efficiency were both measured in the 10 μm section at different flow velocities using the 410-nm fluorescent polystyrene particles. As shown in Figure 6, the particle trapping efficiency was reduced from 40 % at 208 μm/s to 5 % for a flow velocity of 1580 μm/s. All these flow velocities were lower than the escape velocity of the particle, and yet the trapping efficiency decreases with the increase in the flow velocity. This is because at high flow velocity, only particles that encounter the centre of the trap’s potential well (the focus of the laser beam) are trapped, whereas the particles that travel slightly away from the centre of the potential well escape the trap. The reason for this is that a high flow velocity yields a very short lifetime of the particle under the influence of the trap potential. In contrast, with lower velocities at which the particles flow across the trap region, they spend a longer time in the trap region which increases the probability of the particle being pulled into the trap. Thus, more particles passing through the trap region are trapped. This explains the decrease in the particle trapping efficiency with the increase in flow velocity. However, the trapping frequency does not follow the same behaviour as the particle trapping efficiency (Fig. 6), which displays a pronounced peak dependence on the flow velocity. The increase in flow velocity increases the rate of delivery of nanoparticles to the trapping region for a given concentration of particles and thereby is meant to increase the throughput, however this increase is counteracted by the decrease in particle trapping efficiency with the increase in flow velocity as described earlier. This result is important and shows that an optimal flow velocity exists in order to maximize the trapping throughput. This optimal flow velocity would not exceed the escape velocity of the particle, which corresponds to the maximum flow velocity beyond which the particle will be no longer trapped for a given laser power (see Material and Methods for measured escape velocities).48
Figure 6.
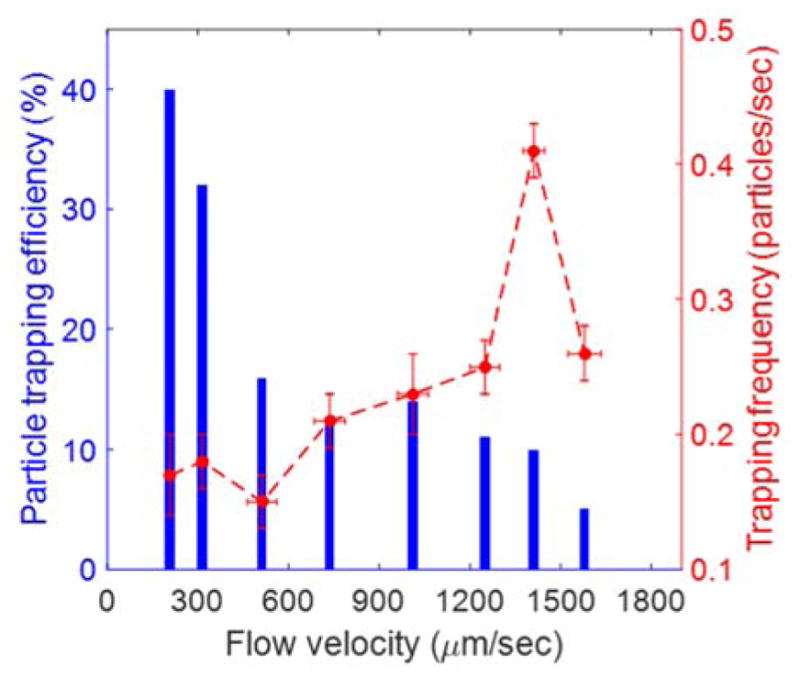
Particle trapping efficiency (blue, left) and trapping frequency (red, right) in the 10 μm width channel section at different flow velocities. The error bars in X and Y represent the SEM with sample size of N=68 (v=208±14μm/s), N=84 (v=315±17 μm/s), N=61(v=512±48 μm/s), N=69 (v=736±50μm/s), N=56 (v=1249±49 μm/s), N=127 (v=1411±35 μm/s ), N=69 (v=1580±54 μm/s ) for trapping frequency measurement and N=10 for flow velocity measurement.
Application of high throughput optical tweezers for determination of nanoparticle size
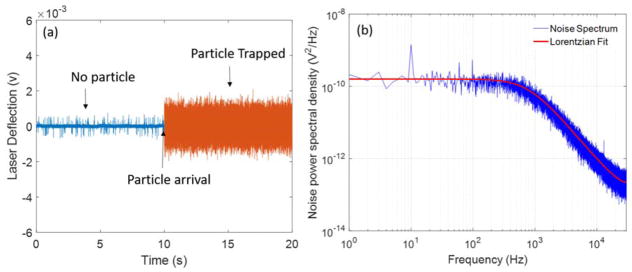
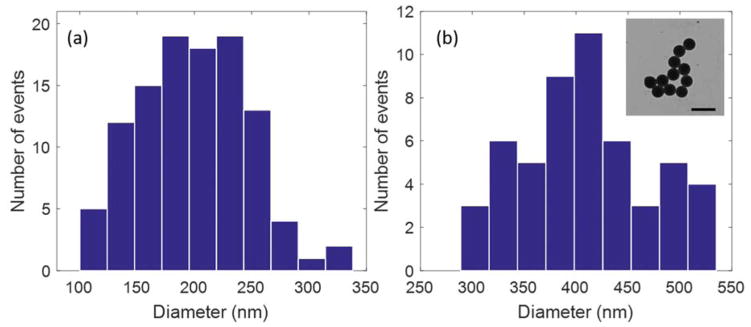
In our earlier works, passive trapping of nanoparticles using a regular microfluidic chamber has been used to determine parameters such as size (diameter) and refractive index (n) of polystyrene nanoparticles and HIV virions.21,23 In this section, we show that our high throughput optical tweezer system can still perform nanoparticle characterization, even though it operates in a flow-based environment and uses small cross-section microfluidic channel, in contrast to the passive trapping. We demonstrate this by using the present trapping system to determine the diameter of the nanoparticles, but it can be extended to study other parameters also, as done previously using the passive trapping system. Polystyrene particles with average diameter of 190 nm and 410 nm, respectively, were optically trapped using the ‘active’ trapping system. The power spectrum calibrated using chamber oscillation was then used to determine the size of the nanoparticles as described previously.21 Figure 7a shows a representative BFPI signal of the trapped 190-nm polystyrene nanoparticle in this microfluidic channel. Figure 7b shows the power spectrum obtained from the BFPI data and was calculated as described21. The power spectrum of the Brownian motion of the nanoparticles in an optical trap is best interpreted using the Einstein-Ornstein-Uhlenbeck theory of Brownian motion, which predicts a Lorentzian spectrum49. Hence, the power spectrum was fitted to a Lorentzian following the procedure as we described previously21, which gives the diffusion constant (Dv) in volts2/s and the corner frequency (fc) in Hz. Oscillation of the chamber was used to determine the calibration factor (β) to convert Dv from units of volts2/s to μm2/s. The values obtained from the Lorentzian fit and the chamber oscillation were then used to determine the size of the trapped particle. Figure 8a and 8b shows the histograms of the diameter values obtained from the power spectrum analysis of the BFPI signal of the trapped 190-nm (N=108) and 410-nm (N=52) polystyrene particles. The diameters obtained are 200±48 nm and 409±64 nm (mean ± standard deviation), respectively, which agree well with the diameter values of 184±12 and 403±6 (mean ± standard deviation) measured using transmission electron microscopy, as shown in ref.21 and in figure 8b inset respectively for the 190-nm and 410-nm particles. The active trapping system can thus accurately determine the size of trapped nanoparticles, and has the capability to do multiparametric analysis of nanoparticles with high throughput.
Figure 7.
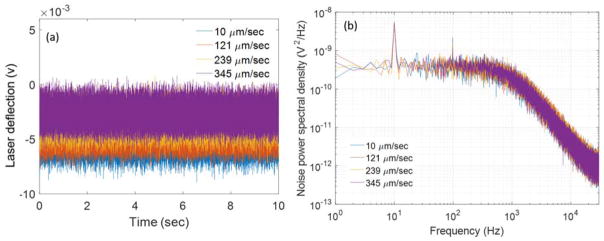
(a) Representative BFPI signal with no particle and the 190-nm polystyrene particle in the optical trap. (b) Power spectrum of the BFPI data obtained from the trapped particle from (a) with a Lorentzian fit
Figure 8.
Diameter values of trapped polystyrene nanoparticles calculated using the power spectrum analysis of the BFPI data obtained from trapping of (a) 190 nm polystyrene particles (b) 410 nm polystyrene particles. (Inset) TEM image of 410 nm polystyrene particles, scale bar: 800 nm.
Impact of fluid flow velocity on the power spectrum analysis
The trapping of the nanoparticles and the collection of the BFPI signal obtained from the trapped particle was done in a fluid flow environment as opposed to the no-flow based passive trapping system. This makes it necessary to study the impact of fluid flow on the BFPI signal and the corresponding power spectrum of the trapped particle. Any deviation in the power spectrum with the change in the fluid flow velocity would influence the accurate calculation of the size of the trapped particle. The influence of fluid flow was studied experimentally by trapping a single 410 nm polystyrene nanoparticle and subsequently recording the BFPI signal while incrementing the fluid flow velocity from low value of 10 μm/s to 345 μm/s (less than the escape velocity of the trap). Figure 9a shows the BFPI signals obtained from the trapped particle at different flow velocities. We do not observe any significant change in the BFPI signal, except a small change in the mean level of the BFPI signal. The change in the mean level of the BFPI signal with the increase in the fluid velocity corresponds to an increase in the displacement of the particle from the centre of the trap. The increase in the flow velocity increases the drag force proportional to the fluid velocity which changes the equilibrium position of the trapped particle, resulting in the change in the mean level of the BFPI signal. The power spectrum obtained from the corresponding BFPI signal at different fluid velocities are plotted in figure 9b. We find again that the change in flow velocity resulted in little change in the power spectrum as the fluid velocity was increased. The diffusion coefficient Dv and the corner frequency fc obtained from the fitting of the power spectrum showed only a 6.3 % and 4.1 % variation even though the change in the fluid velocity was more than 30-fold. The diameter of the trapped particle that we derived from the power spectrum analysis showed a coefficient of variation of only 6 %, which shows no significant influence of flow velocity on the measurement of particle size. The flow only adds a constant force, called the drag force F = 6πηrv with no time dependence and hence makes no contribution to the power spectrum. The power spectrum is a result of random Brownian motion of the particle in the trap due to thermal forces and hence independent of the flow. The results as shown in Fig. 9 suggest the harmonic nature of the optical trap44. When the flow velocity approaches the escape velocity of the trapped particle, the BFPI signal may show deviations from the expected behavior. How to extract particle size information from these unstable trapping conditions will be a subject of future research.
Figure 9.
(a) BFPI signal obtained from the trapped 410 nm polystyrene particle at different flow velocities. (b) Power spectrum obtained from the BFPI data obtained from (a) at different flow velocities.
Conclusions
As optical tweezers continue to grow as a multiparametric characterization tool for nanoparticles, there is a strong need to address its low throughput characteristic. In this paper, we have shown that an optical trapping system, based on the active delivery of nanoparticles, results in a significant increase in the throughput of the optical tweezer. The throughput is increased more than ten-fold as compared to a passive trapping system. The impact of two important parameters of this trapping system, the flow velocity and microfluidic channel dimensions on the throughput were also studied, showing that the use of smallest cross-section channel for trapping along with an optimized flow velocity results in maximum trapping throughput. Despite the application of flow in a spatially-confined channel cross-section, the tweezer system maintains the same functionality as the passive trapping system. We demonstrated this by using the trapping system to measure the size of polystyrene nanoparticles. The mean size obtained were found to match very well with the measured diameter values using TEM. The technique has the potential to develop into a versatile multiparametric tool for characterization of biological nanoparticles.
Supplementary Material
Acknowledgments
This work was supported by National Science Foundation (CAREER Award CHE1149670, WC; CMMI 1536087, JF) and National Institutes of Health (Director’s New Innovator Award 1DP2OD008693-01, WC). Dr. Y. Zheng is partially supported by the Natural Sciences and Engineering Research Council of Canada (NSERC) Postdoctoral Fellowship.
Footnotes
Electronic Supplementary Information (ESI) available: [details of any supplementary information available should be included here]. See DOI: 10.1039/x0xx00000x
References
- 1.Sugahara KN, Teesalu T, Karmali PP, Kotamraju VR, Agemy L, Girard OM, Hanahan D, Mattrey RF, Ruoslahti E. Cancer Cell. 2009;16:510–520. doi: 10.1016/j.ccr.2009.10.013. [DOI] [PMC free article] [PubMed] [Google Scholar]
- 2.De Jong WH, Borm PJa. Int J Nanomedicine. 2008;3:133–149. doi: 10.2147/ijn.s596. [DOI] [PMC free article] [PubMed] [Google Scholar]
- 3.Franzman MA, Schlenker CW, Thompson ME, Brutchey RL. J Am Chem Soc. 2010;132:4060–4061. doi: 10.1021/ja100249m. [DOI] [PubMed] [Google Scholar]
- 4.Michalet X. 2008;538:538–545. [Google Scholar]
- 5.Liu WT. J Biosci Bioeng. 2006;102:1–7. doi: 10.1263/jbb.102.1. [DOI] [PubMed] [Google Scholar]
- 6.Stark WJ, Stoessel PR, Wohlleben W, Hafner A. Chem Soc Rev. 2015;98:2035–2044. doi: 10.1039/c4cs00362d. [DOI] [PubMed] [Google Scholar]
- 7.DeSantis MC, Kim JH, Song H, Klasse PJ, Cheng W. J Biol Chem. 2016;291:13088–13097. doi: 10.1074/jbc.M116.729210. [DOI] [PMC free article] [PubMed] [Google Scholar]
- 8.Gadd JC, Fujimoto BS, Bajjalieh SM, Chiu DT. Anal Chem. 2012;84:10522–10525. doi: 10.1021/ac303032m. [DOI] [PMC free article] [PubMed] [Google Scholar]
- 9.Paddock SW. Biotechniques. 1999;27:992–1004. doi: 10.2144/99275ov01. [DOI] [PubMed] [Google Scholar]
- 10.Hinterdorfer P, Garcia-Parajo MF, Dufrene YF. Acc Chem Res. 2012;45:327–336. doi: 10.1021/ar2001167. [DOI] [PubMed] [Google Scholar]
- 11.Bootz A, Vogel V, Schubert D, Kreuter J. Eur J Pharm Biopharm. 2004;57:369–375. doi: 10.1016/S0939-6411(03)00193-0. [DOI] [PubMed] [Google Scholar]
- 12.Carlton CE, Ferreira PJ. Micron. 2012;43:1134–1139. doi: 10.1016/j.micron.2012.03.002. [DOI] [PubMed] [Google Scholar]
- 13.Starostina N, Brodsky M, Prikhodko S, Hoo CM, Mecartney ML, West P. J Cosmet Sci. 2008;59:225–32. [PubMed] [Google Scholar]
- 14.Ong QK, Reguera J, Silva PJ, Moglianetti M, Harkness K, Longobardi M, Mali KS, Renner C, De Feyter S, Stellacci F. ACS Nano. 2013;7:8529–8539. doi: 10.1021/nn402414b. [DOI] [PubMed] [Google Scholar]
- 15.Wright M. In: Nanoparticles in Biology and Medicine: Methods and Protocols. Soloviev M, editor. Humana Press; Totowa, NJ: 2012. pp. 511–524. [Google Scholar]
- 16.DeBlois RW, Bean CP. Rev Sci Instrum. 1970;41:909–916. [Google Scholar]
- 17.Fraikin JL, Teesalu T, McKenney CM, Ruoslahti E, Cleland AN. Nat Nanotechnol. 2011;6:308–313. doi: 10.1038/nnano.2011.24. [DOI] [PubMed] [Google Scholar]
- 18.Wood DK, Requa MV, Cleland AN. Rev Sci Instrum. 2007:78. doi: 10.1063/1.2794230. [DOI] [PubMed] [Google Scholar]
- 19.Ugawa M, Lei C, Nozawa T, Ideguchi T, Di Carlo D, Ota S, Ozeki Y, Goda K. Opt Lett. 2015;40:4803–6. doi: 10.1364/OL.40.004803. [DOI] [PubMed] [Google Scholar]
- 20.Holmes D, Morgan H, Green NG. Biosens Bioelectron. 2006;21:1621–1630. doi: 10.1016/j.bios.2005.10.017. [DOI] [PubMed] [Google Scholar]
- 21.Pang Y, Song H, Kim JH, Hou X, Cheng W. Nat Nanotechnol. 2014;9:624–630. doi: 10.1038/nnano.2014.140. [DOI] [PMC free article] [PubMed] [Google Scholar]
- 22.Ignatovich FV, Novotny L. Rev Sci Instrum. 2003;74:5231–5235. [Google Scholar]
- 23.Pang Y, Song H, Cheng W. Biomed Opt Express. 2016;7:1672. doi: 10.1364/BOE.7.001672. [DOI] [PMC free article] [PubMed] [Google Scholar]
- 24.Heller I, Sitters G, Broekmans OD, Farge G, Menges C, Wende W, Hell SW, Peterman EJG, Wuite GJL. Nat Methods. 2013;10:910–6. doi: 10.1038/nmeth.2599. [DOI] [PubMed] [Google Scholar]
- 25.Lafratta CN. Anal Bioanal Chem. 2013;405:5671–5677. doi: 10.1007/s00216-013-6919-9. [DOI] [PubMed] [Google Scholar]
- 26.Redding B, Schwab M, Le Pan Y. Sensors (Switzerland) 2015;15:19021–19046. doi: 10.3390/s150819021. [DOI] [PMC free article] [PubMed] [Google Scholar]
- 27.Pierini F, Zembrzycki K, Nakielski P, Pawłowska S, Kowalewski TA. Meas Sci Technol. 2016;27:25904. [Google Scholar]
- 28.Beunis F, Brans T, Schreuer C, Vandewiele S, Strubbe F, Neyts K. 2015:5–7. doi: 10.1002/elps.201500144. [DOI] [PubMed] [Google Scholar]
- 29.Li CY, Cao D, Qi CB, Chen HL, Wan YT, Lin Y, Zhang ZL, Pang DW, Tang HW. Biosens Bioelectron. 2017;90:146–152. doi: 10.1016/j.bios.2016.11.031. [DOI] [PubMed] [Google Scholar]
- 30.Wood TA, Roberts GS, Eaimkhong S, Bartlett P. Faraday Discuss. 2007;137:319–333. doi: 10.1039/b703994h. [DOI] [PubMed] [Google Scholar]
- 31.Trichet AAP, Dolan PR, James D, Hughes GM, Vallance C, Smith JM. Nano Lett. 2016 doi: 10.1021/acs.nanolett.6b02433. acs.nanolett.6b02433. [DOI] [PubMed] [Google Scholar]
- 32.Huang NT, Zhang HL, Chung MT, Seo JH, Kurabayashi K. Lab Chip. 2014;14:1230–1245. doi: 10.1039/c3lc51211h. [DOI] [PubMed] [Google Scholar]
- 33.Nascimento JM, Nascimento JL, Botvinick EL, Shi LZ, Durrant B, Berns MW. J Biomed Opt. 2010;11:44001. doi: 10.1117/1.2337559. [DOI] [PubMed] [Google Scholar]
- 34.Fauci AS, Pantaleo G, Stanley S, Weissman D. Ann Intern Med. 1996;124:654–663. doi: 10.7326/0003-4819-124-7-199604010-00006. [DOI] [PubMed] [Google Scholar]
- 35.Gottschalk F, Sonderer T, Scholz RW, Nowack B. Environ Sci Technol. 2009;43:9216–9222. doi: 10.1021/es9015553. [DOI] [PubMed] [Google Scholar]
- 36.Visscher K, Gross SP, Block SM. IEEE J Sel Top Quant Elect. 1996;2:1066–1076. [Google Scholar]
- 37.Tallieu S. 2012 [Google Scholar]
- 38.Righini M, Zelenina A, Quidant R. 2007 IEEE/LEOS Int Conf Opt MEMS Nanophotonics, OMENS. 2007:61–62. [Google Scholar]
- 39.Soltani M, Lin J, Forties Ra, Inman JT, Saraf SN, Fulbright RM, Lipson M, Wang MD. Nat Nanotechnol. 2014;9:448–52. doi: 10.1038/nnano.2014.79. [DOI] [PMC free article] [PubMed] [Google Scholar]
- 40.Kukura P, Ewers H, Müller C, Renn A, Helenius A, Sandoghdar V. Nat Methods. 2009;6:923–927. doi: 10.1038/nmeth.1395. [DOI] [PubMed] [Google Scholar]
- 41.Kang P, Schein P, Serey X, O’Dell D, Erickson D. Sci Rep. 2015;5:12087. doi: 10.1038/srep12087. [DOI] [PMC free article] [PubMed] [Google Scholar]
- 42.Lake M, Lake M, Narciso C, Cowdrick K, Storey T, Zhang S, Zartman J, Hoelzle D. Protoc Exch. 2015:1–26. [Google Scholar]
- 43.Duffy DC, McDonald JC, Schueller OJA, Whitesides GM. Anal Chem. 1998;70:4974–4984. doi: 10.1021/ac980656z. [DOI] [PubMed] [Google Scholar]
- 44.Cheng W, Hou X, Ye F. Opt Lett. 2010;35:2988–2990. doi: 10.1364/OL.35.002988. [DOI] [PubMed] [Google Scholar]
- 45.Gittes F, Schmidt CF. Opt Lett. 1998;23:7. doi: 10.1364/ol.23.000007. [DOI] [PubMed] [Google Scholar]
- 46.Cheng W, Arunajadai SG, Moffitt JR, Tinoco I, Bustamante C. Science (80- ) 2011;333:1746–1749. doi: 10.1126/science.1206023. [DOI] [PMC free article] [PubMed] [Google Scholar]
- 47.Tolić-Nørrelykke SF, Schäffer E, Howard J, Pavone FS, Jülicher F, Flyvbjerg H. Rev Sci Instrum. 2006:77. [Google Scholar]
- 48.Bui AA, Stilgoe AB, Khatibzadeh N, Nieminen TA, Berns MW, Rubinsztein-Dunlop H. Opt Express. 2015;23:24317–24330. doi: 10.1364/OE.23.024317. [DOI] [PubMed] [Google Scholar]
- 49.Berg-Sørensen K, Flyvbjerg H. Rev Sci Instrum. 2004;75:594–612. [Google Scholar]
Associated Data
This section collects any data citations, data availability statements, or supplementary materials included in this article.


